Cities with the Highest Percentage of Population Employed in Security & Protection in Missouri
RELATED REPORTS & OPTIONS
Security & Protection
Missouri
Compare Cities
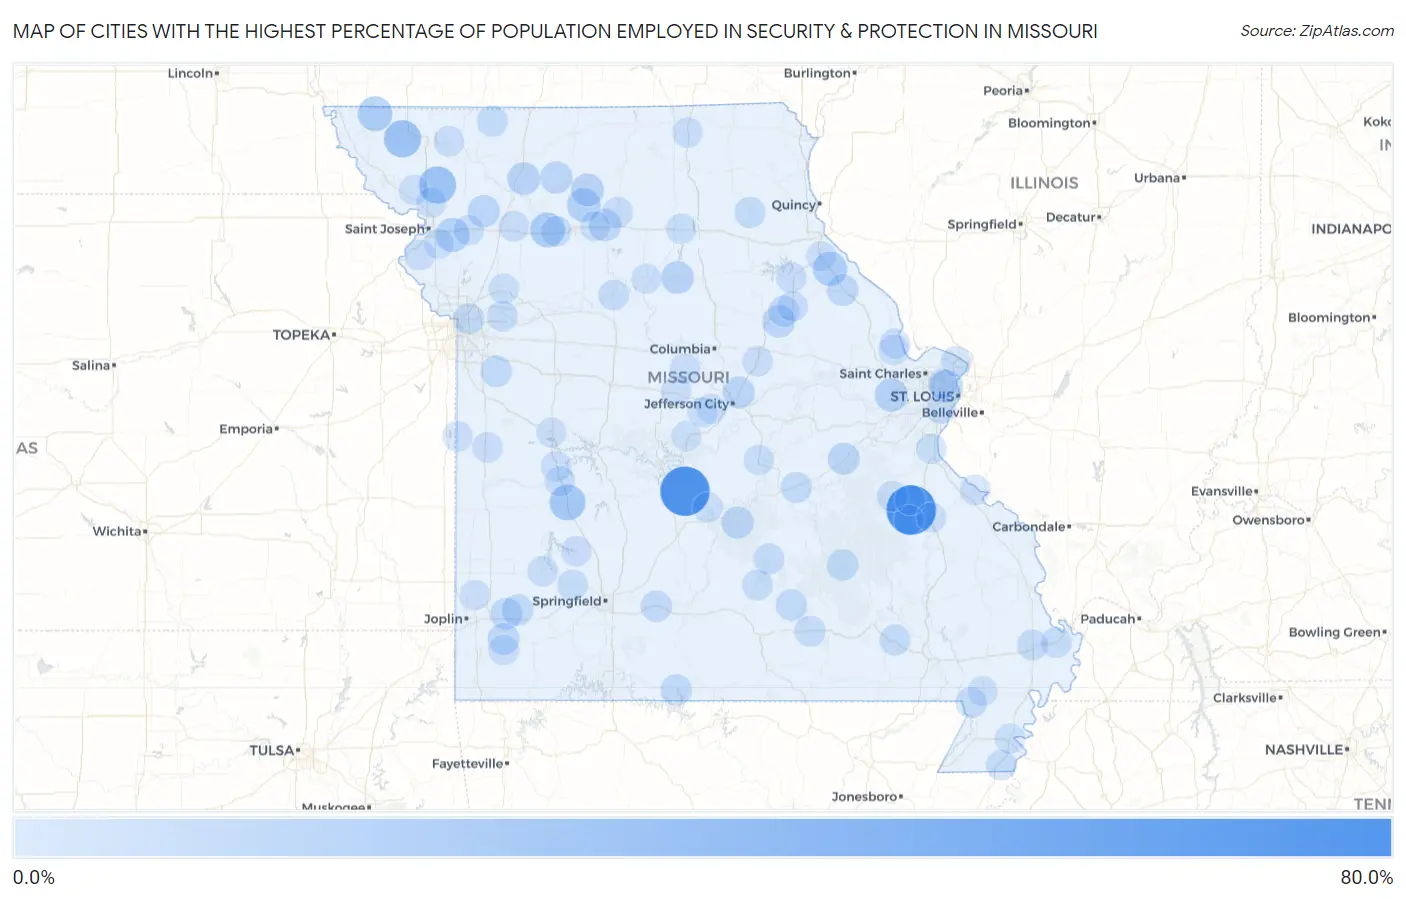
Map of Cities with the Highest Percentage of Population Employed in Security & Protection in Missouri
0.0%
80.0%
Cities with the Highest Percentage of Population Employed in Security & Protection in Missouri
| City | % Employed | vs State | vs National | |
| 1. | Wortham | 62.5% | 1.9%(+60.6)#1 | 2.1%(+60.4)#14 |
| 2. | Montreal | 61.9% | 1.9%(+60.0)#2 | 2.1%(+59.8)#15 |
| 3. | Rea | 25.0% | 1.9%(+23.1)#3 | 2.1%(+22.9)#183 |
| 4. | Quitman | 25.0% | 1.9%(+23.1)#4 | 2.1%(+22.9)#187 |
| 5. | Collins | 21.1% | 1.9%(+19.2)#5 | 2.1%(+18.9)#253 |
| 6. | Breckenridge | 18.1% | 1.9%(+16.2)#6 | 2.1%(+15.9)#331 |
| 7. | Westboro | 17.9% | 1.9%(+16.0)#7 | 2.1%(+15.7)#340 |
| 8. | Frankford | 16.3% | 1.9%(+14.4)#8 | 2.1%(+14.2)#417 |
| 9. | Easton | 15.7% | 1.9%(+13.8)#9 | 2.1%(+13.5)#454 |
| 10. | Lake Timberline | 14.4% | 1.9%(+12.5)#10 | 2.1%(+12.3)#528 |
| 11. | Chula | 14.3% | 1.9%(+12.4)#11 | 2.1%(+12.1)#542 |
| 12. | Velda City | 13.2% | 1.9%(+11.4)#12 | 2.1%(+11.1)#636 |
| 13. | Defiance | 13.1% | 1.9%(+11.2)#13 | 2.1%(+11.0)#649 |
| 14. | Laredo | 12.5% | 1.9%(+10.6)#14 | 2.1%(+10.4)#713 |
| 15. | Coffey | 12.2% | 1.9%(+10.3)#15 | 2.1%(+10.0)#734 |
| 16. | Clifton Hill | 12.2% | 1.9%(+10.3)#16 | 2.1%(+10.0)#735 |
| 17. | Benton City | 11.9% | 1.9%(+10.0)#17 | 2.1%(+9.79)#769 |
| 18. | Vibbard | 11.2% | 1.9%(+9.29)#18 | 2.1%(+9.03)#885 |
| 19. | Meadville | 11.0% | 1.9%(+9.13)#19 | 2.1%(+8.88)#921 |
| 20. | Maysville | 11.0% | 1.9%(+9.10)#20 | 2.1%(+8.84)#926 |
| 21. | Fort Leonard Wood | 10.7% | 1.9%(+8.77)#21 | 2.1%(+8.52)#978 |
| 22. | Leisure Lake | 10.7% | 1.9%(+8.76)#22 | 2.1%(+8.50)#985 |
| 23. | Holts Summit | 10.5% | 1.9%(+8.60)#23 | 2.1%(+8.34)#1,015 |
| 24. | Goose Creek Lake | 10.4% | 1.9%(+8.50)#24 | 2.1%(+8.24)#1,028 |
| 25. | West Sullivan | 10.3% | 1.9%(+8.42)#25 | 2.1%(+8.16)#1,041 |
| 26. | Reeds | 9.6% | 1.9%(+7.70)#26 | 2.1%(+7.44)#1,182 |
| 27. | Ritchey | 9.5% | 1.9%(+7.63)#27 | 2.1%(+7.38)#1,195 |
| 28. | Bowling Green | 9.2% | 1.9%(+7.34)#28 | 2.1%(+7.08)#1,254 |
| 29. | Baldwin Park | 9.1% | 1.9%(+7.20)#29 | 2.1%(+6.94)#1,313 |
| 30. | La Russell | 8.9% | 1.9%(+7.04)#30 | 2.1%(+6.78)#1,360 |
| 31. | Theodosia | 8.7% | 1.9%(+6.80)#31 | 2.1%(+6.55)#1,435 |
| 32. | Diggins | 8.6% | 1.9%(+6.72)#32 | 2.1%(+6.46)#1,454 |
| 33. | Summersville | 8.5% | 1.9%(+6.58)#33 | 2.1%(+6.33)#1,496 |
| 34. | Bunker | 8.3% | 1.9%(+6.37)#34 | 2.1%(+6.12)#1,569 |
| 35. | Rush Hill | 8.0% | 1.9%(+6.11)#35 | 2.1%(+5.85)#1,659 |
| 36. | Licking | 7.7% | 1.9%(+5.81)#36 | 2.1%(+5.56)#1,754 |
| 37. | Allendale | 7.7% | 1.9%(+5.80)#37 | 2.1%(+5.54)#1,768 |
| 38. | Randolph | 7.7% | 1.9%(+5.80)#38 | 2.1%(+5.54)#1,771 |
| 39. | Ellsinore | 7.7% | 1.9%(+5.76)#39 | 2.1%(+5.51)#1,778 |
| 40. | St James | 7.4% | 1.9%(+5.46)#40 | 2.1%(+5.21)#1,921 |
| 41. | Bethel | 7.2% | 1.9%(+5.36)#41 | 2.1%(+5.10)#1,960 |
| 42. | Birch Tree | 7.2% | 1.9%(+5.29)#42 | 2.1%(+5.03)#1,989 |
| 43. | Miner | 7.1% | 1.9%(+5.21)#43 | 2.1%(+4.96)#2,017 |
| 44. | Campbell | 7.0% | 1.9%(+5.07)#44 | 2.1%(+4.81)#2,100 |
| 45. | Charleston | 6.7% | 1.9%(+4.84)#45 | 2.1%(+4.58)#2,229 |
| 46. | Houston | 6.7% | 1.9%(+4.78)#46 | 2.1%(+4.52)#2,256 |
| 47. | Ash Grove | 6.7% | 1.9%(+4.77)#47 | 2.1%(+4.51)#2,276 |
| 48. | Linneus | 6.6% | 1.9%(+4.70)#48 | 2.1%(+4.44)#2,307 |
| 49. | Potosi | 6.5% | 1.9%(+4.65)#49 | 2.1%(+4.40)#2,334 |
| 50. | Miami | 6.5% | 1.9%(+4.56)#50 | 2.1%(+4.30)#2,396 |
| 51. | Mooresville | 6.4% | 1.9%(+4.49)#51 | 2.1%(+4.23)#2,442 |
| 52. | Sibley | 6.4% | 1.9%(+4.47)#52 | 2.1%(+4.21)#2,465 |
| 53. | Cooter | 6.3% | 1.9%(+4.46)#53 | 2.1%(+4.20)#2,471 |
| 54. | De Kalb | 6.2% | 1.9%(+4.33)#54 | 2.1%(+4.08)#2,548 |
| 55. | Ste Genevieve | 6.0% | 1.9%(+4.15)#55 | 2.1%(+3.89)#2,676 |
| 56. | Fulton | 6.0% | 1.9%(+4.08)#56 | 2.1%(+3.82)#2,733 |
| 57. | Perry | 6.0% | 1.9%(+4.06)#57 | 2.1%(+3.80)#2,749 |
| 58. | Lowry City | 6.0% | 1.9%(+4.06)#58 | 2.1%(+3.80)#2,750 |
| 59. | Old Monroe | 5.9% | 1.9%(+4.05)#59 | 2.1%(+3.79)#2,758 |
| 60. | Kidder | 5.9% | 1.9%(+3.99)#60 | 2.1%(+3.73)#2,815 |
| 61. | Aldrich | 5.9% | 1.9%(+3.99)#61 | 2.1%(+3.73)#2,826 |
| 62. | Ravenwood | 5.8% | 1.9%(+3.90)#62 | 2.1%(+3.64)#2,893 |
| 63. | Queen City | 5.8% | 1.9%(+3.88)#63 | 2.1%(+3.62)#2,909 |
| 64. | Stark City | 5.8% | 1.9%(+3.88)#64 | 2.1%(+3.62)#2,914 |
| 65. | Butler | 5.7% | 1.9%(+3.79)#65 | 2.1%(+3.54)#2,974 |
| 66. | Prairie Home | 5.7% | 1.9%(+3.79)#66 | 2.1%(+3.53)#2,978 |
| 67. | Amsterdam | 5.7% | 1.9%(+3.77)#67 | 2.1%(+3.51)#3,002 |
| 68. | Laddonia | 5.6% | 1.9%(+3.73)#68 | 2.1%(+3.47)#3,039 |
| 69. | Greenfield | 5.6% | 1.9%(+3.72)#69 | 2.1%(+3.47)#3,045 |
| 70. | Vienna | 5.6% | 1.9%(+3.66)#70 | 2.1%(+3.41)#3,102 |
| 71. | Callao | 5.6% | 1.9%(+3.66)#71 | 2.1%(+3.41)#3,109 |
| 72. | West Alton | 5.5% | 1.9%(+3.64)#72 | 2.1%(+3.39)#3,126 |
| 73. | Bismarck | 5.5% | 1.9%(+3.62)#73 | 2.1%(+3.36)#3,142 |
| 74. | Terre Du Lac | 5.5% | 1.9%(+3.57)#74 | 2.1%(+3.32)#3,201 |
| 75. | Winfield | 5.4% | 1.9%(+3.54)#75 | 2.1%(+3.28)#3,234 |
| 76. | Crystal Lakes | 5.4% | 1.9%(+3.50)#76 | 2.1%(+3.24)#3,266 |
| 77. | Horine | 5.4% | 1.9%(+3.50)#77 | 2.1%(+3.24)#3,269 |
| 78. | Osceola | 5.4% | 1.9%(+3.47)#78 | 2.1%(+3.21)#3,292 |
| 79. | Stewartsville | 5.3% | 1.9%(+3.40)#79 | 2.1%(+3.14)#3,380 |
| 80. | Eldon | 5.3% | 1.9%(+3.38)#80 | 2.1%(+3.12)#3,401 |
| 81. | Clarksburg | 5.3% | 1.9%(+3.37)#81 | 2.1%(+3.11)#3,411 |
| 82. | Wheeling | 5.3% | 1.9%(+3.37)#82 | 2.1%(+3.11)#3,414 |
| 83. | Latham | 5.3% | 1.9%(+3.37)#83 | 2.1%(+3.11)#3,419 |
| 84. | New London | 5.3% | 1.9%(+3.36)#84 | 2.1%(+3.10)#3,429 |
| 85. | Fillmore | 5.2% | 1.9%(+3.28)#85 | 2.1%(+3.02)#3,508 |
| 86. | Agency | 5.1% | 1.9%(+3.25)#86 | 2.1%(+2.99)#3,543 |
| 87. | Savannah | 5.1% | 1.9%(+3.23)#87 | 2.1%(+2.98)#3,561 |
| 88. | Lohman | 5.1% | 1.9%(+3.19)#88 | 2.1%(+2.94)#3,608 |
| 89. | Hayti | 5.1% | 1.9%(+3.19)#89 | 2.1%(+2.93)#3,614 |
| 90. | Clinton | 5.1% | 1.9%(+3.19)#90 | 2.1%(+2.93)#3,616 |
| 91. | Lakeshire | 5.0% | 1.9%(+3.12)#91 | 2.1%(+2.87)#3,671 |
| 92. | Richland | 5.0% | 1.9%(+3.11)#92 | 2.1%(+2.85)#3,683 |
| 93. | Indian Lake | 5.0% | 1.9%(+3.06)#93 | 2.1%(+2.80)#3,742 |
| 94. | Raintree Plantation | 4.9% | 1.9%(+3.06)#94 | 2.1%(+2.80)#3,747 |
| 95. | Bel Ridge | 4.9% | 1.9%(+2.99)#95 | 2.1%(+2.73)#3,832 |
| 96. | Malden | 4.9% | 1.9%(+2.99)#96 | 2.1%(+2.73)#3,841 |
| 97. | Russellville | 4.8% | 1.9%(+2.96)#97 | 2.1%(+2.70)#3,870 |
| 98. | Keytesville | 4.8% | 1.9%(+2.96)#98 | 2.1%(+2.70)#3,872 |
| 99. | Purcell | 4.8% | 1.9%(+2.93)#99 | 2.1%(+2.67)#3,905 |
| 100. | Farmington | 4.8% | 1.9%(+2.91)#100 | 2.1%(+2.65)#3,925 |
Common Questions
What are the Top 10 Cities with the Highest Percentage of Population Employed in Security & Protection in Missouri?
Top 10 Cities with the Highest Percentage of Population Employed in Security & Protection in Missouri are:
What city has the Highest Percentage of Population Employed in Security & Protection in Missouri?
Wortham has the Highest Percentage of Population Employed in Security & Protection in Missouri with 62.5%.
What is the Percentage of Population Employed in Security & Protection in the State of Missouri?
Percentage of Population Employed in Security & Protection in Missouri is 1.9%.
What is the Percentage of Population Employed in Security & Protection in the United States?
Percentage of Population Employed in Security & Protection in the United States is 2.1%.