Kimberling City, MO Map & Demographics
Kimberling City Map
Kimberling City Overview
$35,384
PER CAPITA INCOME
$65,616
AVG FAMILY INCOME
$51,458
AVG HOUSEHOLD INCOME
7.1%
WAGE / INCOME GAP [ % ]
92.9¢/ $1
WAGE / INCOME GAP [ $ ]
0.48
INEQUALITY / GINI INDEX
2,625
TOTAL POPULATION
1,224
MALE POPULATION
1,401
FEMALE POPULATION
87.37
MALES / 100 FEMALES
114.46
FEMALES / 100 MALES
59.4
MEDIAN AGE
2.7
AVG FAMILY SIZE
2.2
AVG HOUSEHOLD SIZE
1,047
LABOR FORCE [ PEOPLE ]
44.1%
PERCENT IN LABOR FORCE
11.8%
UNEMPLOYMENT RATE
Kimberling City Zip Codes
Kimberling City Area Codes
Income in Kimberling City
Income Overview in Kimberling City
Per Capita Income in Kimberling City is $35,384, while median incomes of families and households are $65,616 and $51,458 respectively.
| Characteristic | Number | Measure |
| Per Capita Income | 2,625 | $35,384 |
| Median Family Income | 745 | $65,616 |
| Mean Family Income | 745 | $83,832 |
| Median Household Income | 1,183 | $51,458 |
| Mean Household Income | 1,183 | $74,313 |
| Income Deficit | 745 | $0 |
| Wage / Income Gap (%) | 2,625 | 7.06% |
| Wage / Income Gap ($) | 2,625 | 92.94¢ per $1 |
| Gini / Inequality Index | 2,625 | 0.48 |
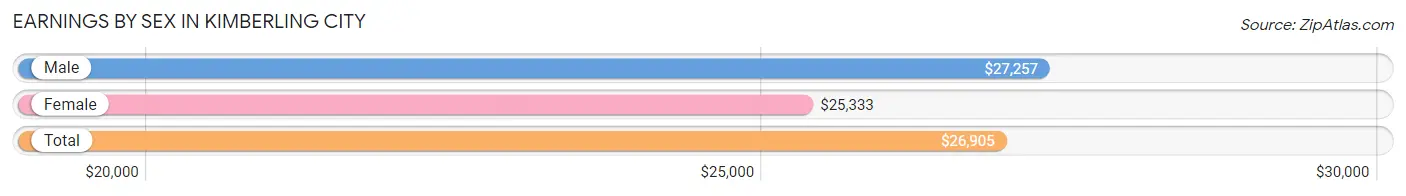
Earnings by Sex in Kimberling City
Average Earnings in Kimberling City are $26,905, $27,257 for men and $25,333 for women, a difference of 7.1%.
| Sex | Number | Average Earnings |
| Male | 601 (52.4%) | $27,257 |
| Female | 546 (47.6%) | $25,333 |
| Total | 1,147 (100.0%) | $26,905 |
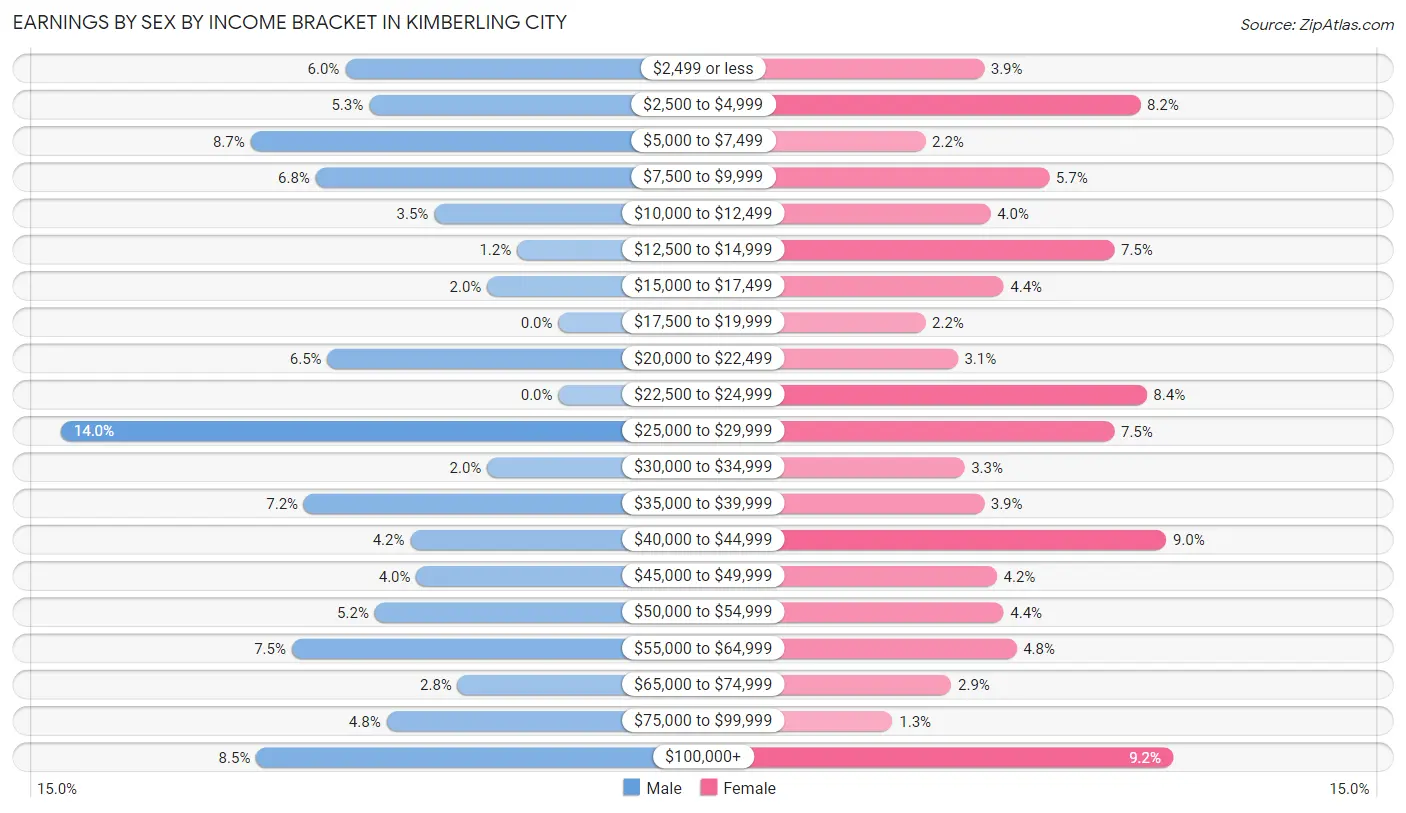
Earnings by Sex by Income Bracket in Kimberling City
The most common earnings brackets in Kimberling City are $25,000 to $29,999 for men (84 | 14.0%) and $100,000+ for women (50 | 9.2%).
| Income | Male | Female |
| $2,499 or less | 36 (6.0%) | 21 (3.8%) |
| $2,500 to $4,999 | 32 (5.3%) | 45 (8.2%) |
| $5,000 to $7,499 | 52 (8.6%) | 12 (2.2%) |
| $7,500 to $9,999 | 41 (6.8%) | 31 (5.7%) |
| $10,000 to $12,499 | 21 (3.5%) | 22 (4.0%) |
| $12,500 to $14,999 | 7 (1.2%) | 41 (7.5%) |
| $15,000 to $17,499 | 12 (2.0%) | 24 (4.4%) |
| $17,500 to $19,999 | 0 (0.0%) | 12 (2.2%) |
| $20,000 to $22,499 | 39 (6.5%) | 17 (3.1%) |
| $22,500 to $24,999 | 0 (0.0%) | 46 (8.4%) |
| $25,000 to $29,999 | 84 (14.0%) | 41 (7.5%) |
| $30,000 to $34,999 | 12 (2.0%) | 18 (3.3%) |
| $35,000 to $39,999 | 43 (7.1%) | 21 (3.8%) |
| $40,000 to $44,999 | 25 (4.2%) | 49 (9.0%) |
| $45,000 to $49,999 | 24 (4.0%) | 23 (4.2%) |
| $50,000 to $54,999 | 31 (5.2%) | 24 (4.4%) |
| $55,000 to $64,999 | 45 (7.5%) | 26 (4.8%) |
| $65,000 to $74,999 | 17 (2.8%) | 16 (2.9%) |
| $75,000 to $99,999 | 29 (4.8%) | 7 (1.3%) |
| $100,000+ | 51 (8.5%) | 50 (9.2%) |
| Total | 601 (100.0%) | 546 (100.0%) |
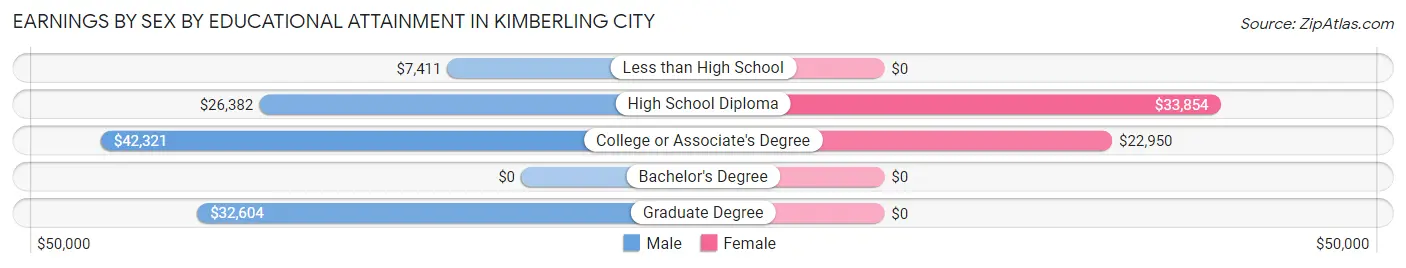
Earnings by Sex by Educational Attainment in Kimberling City
Average earnings in Kimberling City are $32,604 for men and $29,625 for women, a difference of 9.1%. Men with an educational attainment of college or associate's degree enjoy the highest average annual earnings of $42,321, while those with less than high school education earn the least with $7,411. Women with an educational attainment of high school diploma earn the most with the average annual earnings of $33,854, while those with college or associate's degree education have the smallest earnings of $22,950.
| Educational Attainment | Male Income | Female Income |
| Less than High School | $7,411 | $0 |
| High School Diploma | $26,382 | $33,854 |
| College or Associate's Degree | $42,321 | $22,950 |
| Bachelor's Degree | - | - |
| Graduate Degree | $32,604 | $0 |
| Total | $32,604 | $29,625 |
Family Income in Kimberling City
Family Income Brackets in Kimberling City
According to the Kimberling City family income data, there are 189 families falling into the $50,000 to $74,999 income range, which is the most common income bracket and makes up 25.4% of all families. Conversely, the $10,000 to $14,999 income bracket is the least frequent group with only 24 families (3.2%) belonging to this category.
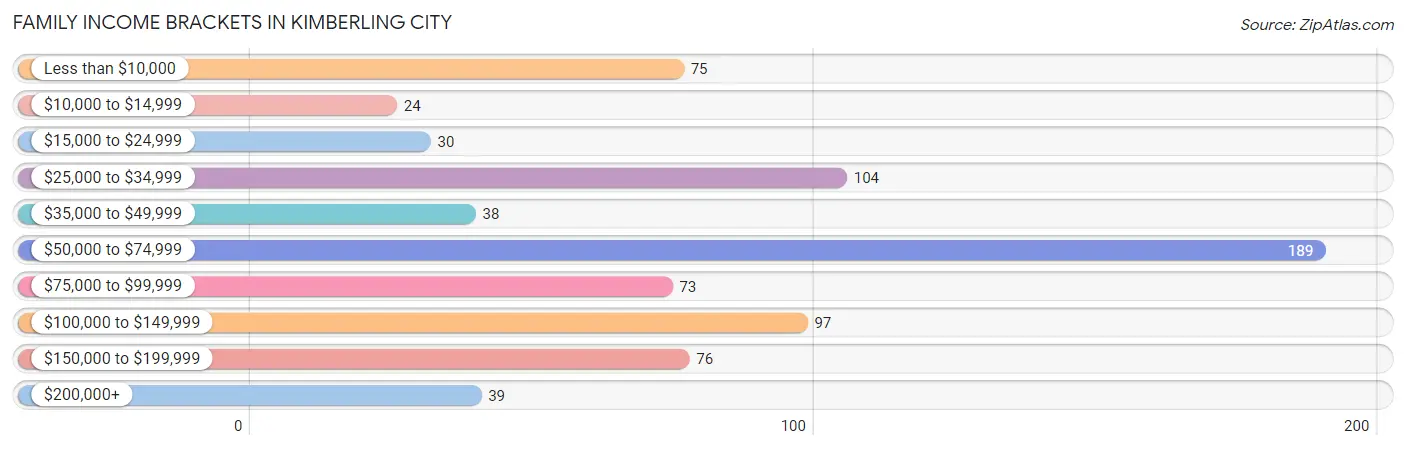
| Income Bracket | # Families | % Families |
| Less than $10,000 | 75 | 10.1% |
| $10,000 to $14,999 | 24 | 3.2% |
| $15,000 to $24,999 | 30 | 4.0% |
| $25,000 to $34,999 | 104 | 14.0% |
| $35,000 to $49,999 | 38 | 5.1% |
| $50,000 to $74,999 | 189 | 25.4% |
| $75,000 to $99,999 | 73 | 9.8% |
| $100,000 to $149,999 | 97 | 13.0% |
| $150,000 to $199,999 | 76 | 10.2% |
| $200,000+ | 39 | 5.2% |
Family Income by Famaliy Size in Kimberling City
2-person families (508 | 68.2%) account for the highest median family income in Kimberling City with $65,261 per family, while 2-person families (508 | 68.2%) have the highest median income of $32,630 per family member.
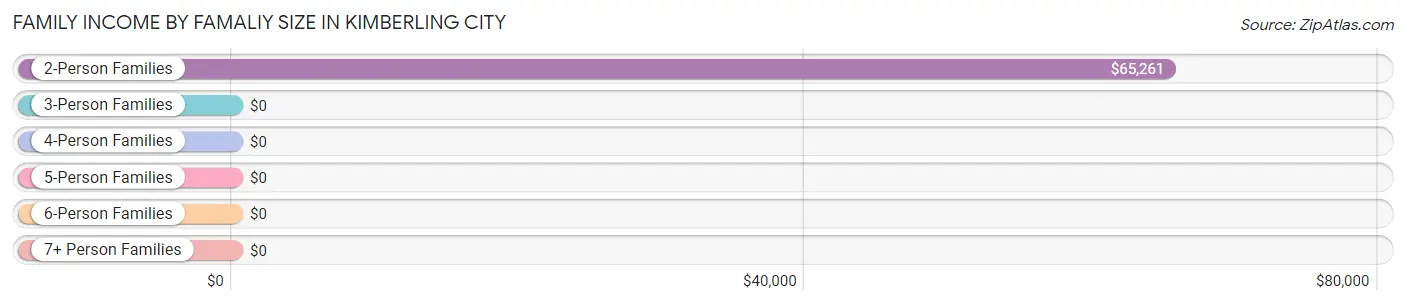
| Income Bracket | # Families | Median Income |
| 2-Person Families | 508 (68.2%) | $65,261 |
| 3-Person Families | 148 (19.9%) | $0 |
| 4-Person Families | 47 (6.3%) | $0 |
| 5-Person Families | 24 (3.2%) | $0 |
| 6-Person Families | 0 (0.0%) | $0 |
| 7+ Person Families | 18 (2.4%) | $0 |
| Total | 745 (100.0%) | $65,616 |
Family Income by Number of Earners in Kimberling City
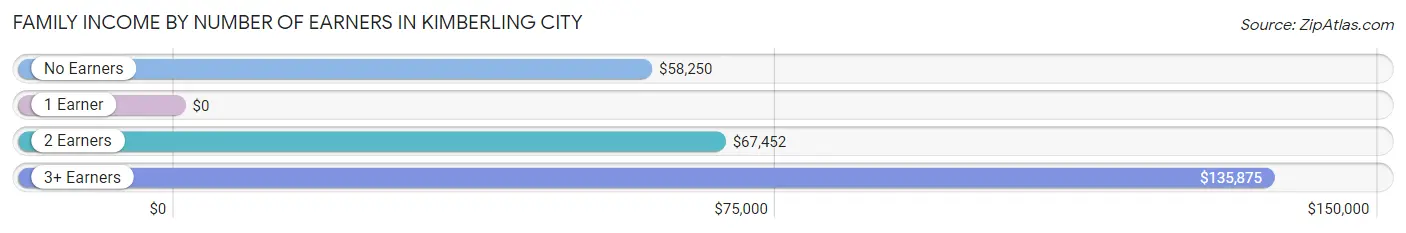
| Number of Earners | # Families | Median Income |
| No Earners | 276 (37.0%) | $58,250 |
| 1 Earner | 213 (28.6%) | $0 |
| 2 Earners | 173 (23.2%) | $67,452 |
| 3+ Earners | 83 (11.1%) | $135,875 |
| Total | 745 (100.0%) | $65,616 |
Household Income in Kimberling City
Household Income Brackets in Kimberling City
With 205 households falling in the category, the $50,000 to $74,999 income range is the most frequent in Kimberling City, accounting for 17.3% of all households. In contrast, only 44 households (3.7%) fall into the $10,000 to $14,999 income bracket, making it the least populous group.
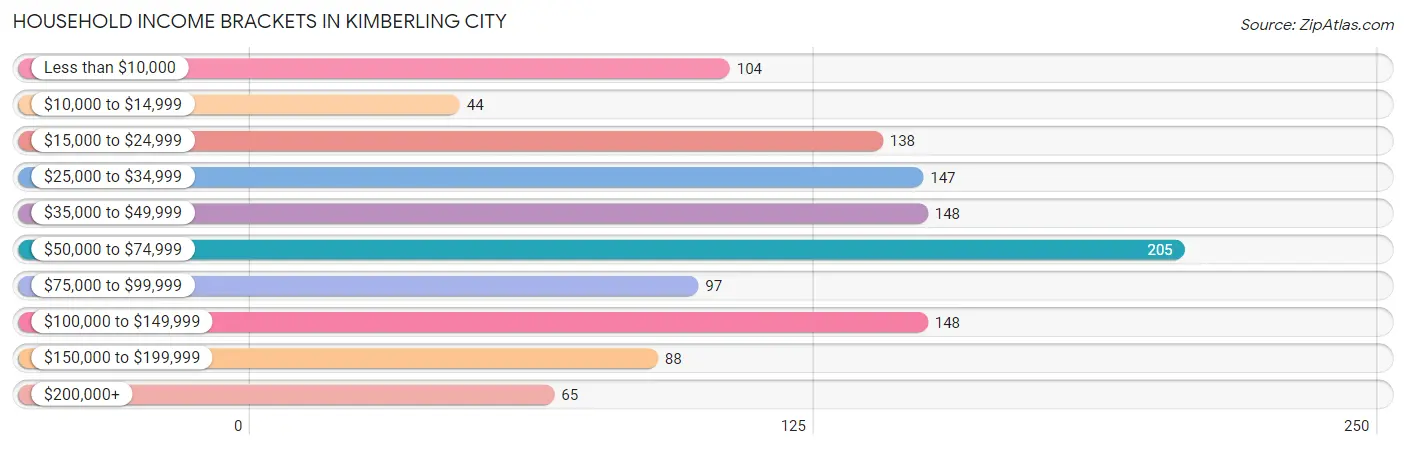
| Income Bracket | # Households | % Households |
| Less than $10,000 | 104 | 8.8% |
| $10,000 to $14,999 | 44 | 3.7% |
| $15,000 to $24,999 | 138 | 11.7% |
| $25,000 to $34,999 | 147 | 12.4% |
| $35,000 to $49,999 | 148 | 12.5% |
| $50,000 to $74,999 | 205 | 17.3% |
| $75,000 to $99,999 | 97 | 8.2% |
| $100,000 to $149,999 | 148 | 12.5% |
| $150,000 to $199,999 | 88 | 7.4% |
| $200,000+ | 65 | 5.5% |
Household Income by Householder Age in Kimberling City
The median household income in Kimberling City is $51,458, with the highest median household income of $71,146 found in the 45 to 64 years age bracket for the primary householder. A total of 377 households (31.9%) fall into this category. Meanwhile, the 15 to 24 years age bracket for the primary householder has the lowest median household income of $0, with 18 households (1.5%) in this group.
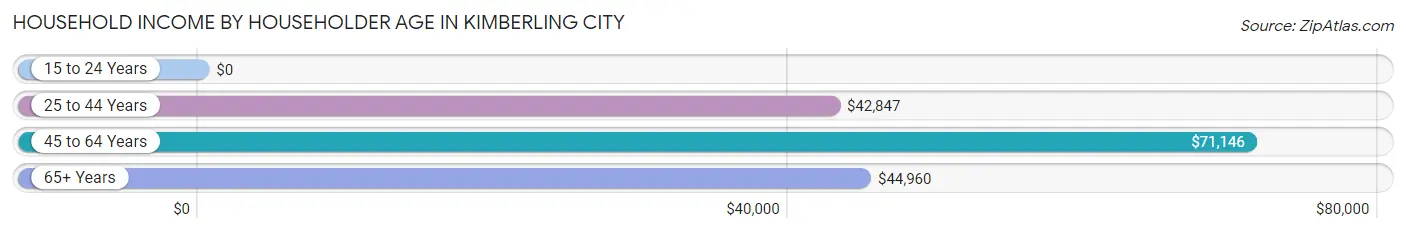
| Income Bracket | # Households | Median Income |
| 15 to 24 Years | 18 (1.5%) | $0 |
| 25 to 44 Years | 199 (16.8%) | $42,847 |
| 45 to 64 Years | 377 (31.9%) | $71,146 |
| 65+ Years | 589 (49.8%) | $44,960 |
| Total | 1,183 (100.0%) | $51,458 |
Poverty in Kimberling City
Income Below Poverty by Sex and Age in Kimberling City
With 14.4% poverty level for males and 13.9% for females among the residents of Kimberling City, 5 year old males and 6 to 11 year old females are the most vulnerable to poverty, with 10 males (100.0%) and 13 females (100.0%) in their respective age groups living below the poverty level.
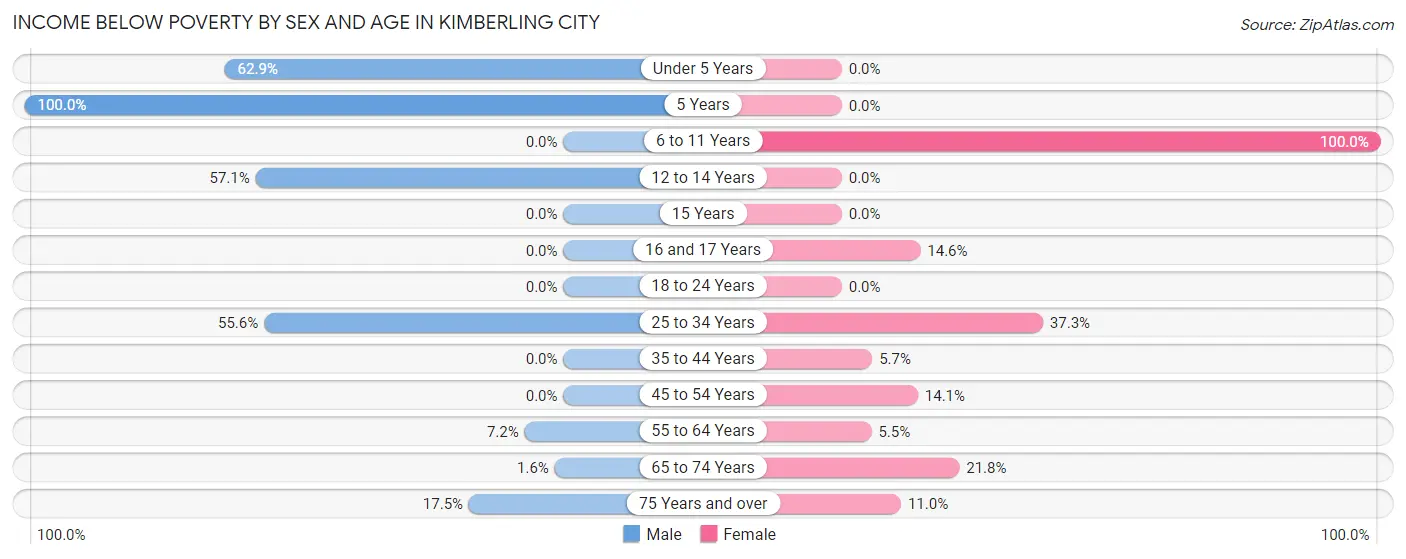
| Age Bracket | Male | Female |
| Under 5 Years | 22 (62.9%) | 0 (0.0%) |
| 5 Years | 10 (100.0%) | 0 (0.0%) |
| 6 to 11 Years | 0 (0.0%) | 13 (100.0%) |
| 12 to 14 Years | 20 (57.1%) | 0 (0.0%) |
| 15 Years | 0 (0.0%) | 0 (0.0%) |
| 16 and 17 Years | 0 (0.0%) | 7 (14.6%) |
| 18 to 24 Years | 0 (0.0%) | 0 (0.0%) |
| 25 to 34 Years | 75 (55.6%) | 28 (37.3%) |
| 35 to 44 Years | 0 (0.0%) | 7 (5.7%) |
| 45 to 54 Years | 0 (0.0%) | 25 (14.1%) |
| 55 to 64 Years | 18 (7.2%) | 13 (5.5%) |
| 65 to 74 Years | 4 (1.6%) | 82 (21.8%) |
| 75 Years and over | 27 (17.5%) | 20 (11.0%) |
| Total | 176 (14.4%) | 195 (13.9%) |
Income Above Poverty by Sex and Age in Kimberling City
According to the poverty statistics in Kimberling City, males aged 6 to 11 years and females aged under 5 years are the age groups that are most secure financially, with 100.0% of males and 100.0% of females in these age groups living above the poverty line.
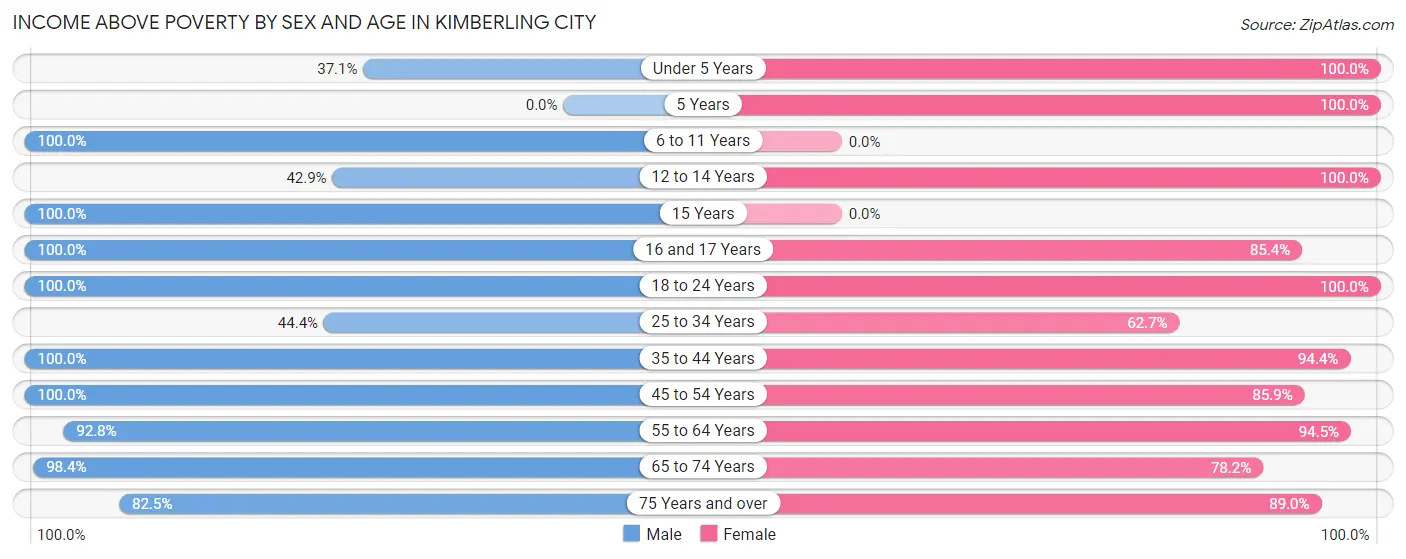
| Age Bracket | Male | Female |
| Under 5 Years | 13 (37.1%) | 18 (100.0%) |
| 5 Years | 0 (0.0%) | 8 (100.0%) |
| 6 to 11 Years | 23 (100.0%) | 0 (0.0%) |
| 12 to 14 Years | 15 (42.9%) | 87 (100.0%) |
| 15 Years | 21 (100.0%) | 0 (0.0%) |
| 16 and 17 Years | 43 (100.0%) | 41 (85.4%) |
| 18 to 24 Years | 62 (100.0%) | 57 (100.0%) |
| 25 to 34 Years | 60 (44.4%) | 47 (62.7%) |
| 35 to 44 Years | 116 (100.0%) | 117 (94.4%) |
| 45 to 54 Years | 91 (100.0%) | 152 (85.9%) |
| 55 to 64 Years | 232 (92.8%) | 223 (94.5%) |
| 65 to 74 Years | 245 (98.4%) | 294 (78.2%) |
| 75 Years and over | 127 (82.5%) | 162 (89.0%) |
| Total | 1,048 (85.6%) | 1,206 (86.1%) |
Income Below Poverty Among Married-Couple Families in Kimberling City
The poverty statistics for married-couple families in Kimberling City show that 1.4% or 8 of the total 562 families live below the poverty line. Families with no children have the highest poverty rate of 1.7%, comprising of 8 families. On the other hand, families with 1 or 2 children have the lowest poverty rate of 0.0%, which includes 0 families.
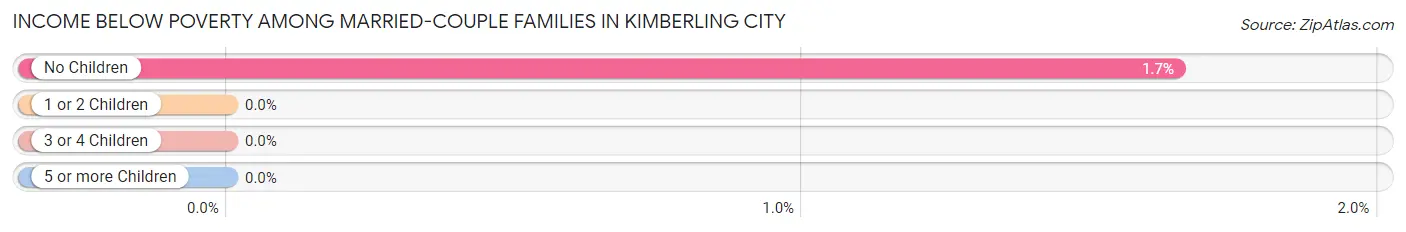
| Children | Above Poverty | Below Poverty |
| No Children | 476 (98.4%) | 8 (1.7%) |
| 1 or 2 Children | 78 (100.0%) | 0 (0.0%) |
| 3 or 4 Children | 0 (0.0%) | 0 (0.0%) |
| 5 or more Children | 0 (0.0%) | 0 (0.0%) |
| Total | 554 (98.6%) | 8 (1.4%) |
Income Below Poverty Among Single-Parent Households in Kimberling City
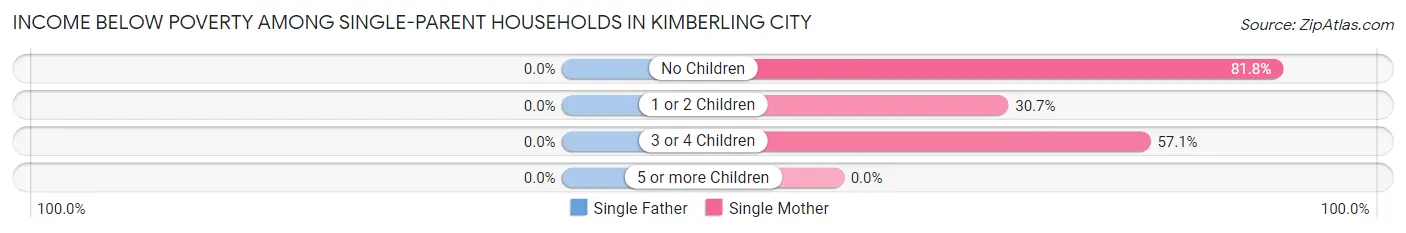
| Children | Single Father | Single Mother |
| No Children | 0 (0.0%) | 63 (81.8%) |
| 1 or 2 Children | 0 (0.0%) | 23 (30.7%) |
| 3 or 4 Children | 0 (0.0%) | 12 (57.1%) |
| 5 or more Children | 0 (0.0%) | 0 (0.0%) |
| Total | 0 (0.0%) | 98 (56.7%) |
Income Below Poverty Among Married-Couple vs Single-Parent Households in Kimberling City
The poverty data for Kimberling City shows that 8 of the married-couple family households (1.4%) and 98 of the single-parent households (53.5%) are living below the poverty level. Within the married-couple family households, those with no children have the highest poverty rate, with 8 households (1.7%) falling below the poverty line. Among the single-parent households, those with no children have the highest poverty rate, with 63 household (75.0%) living below poverty.
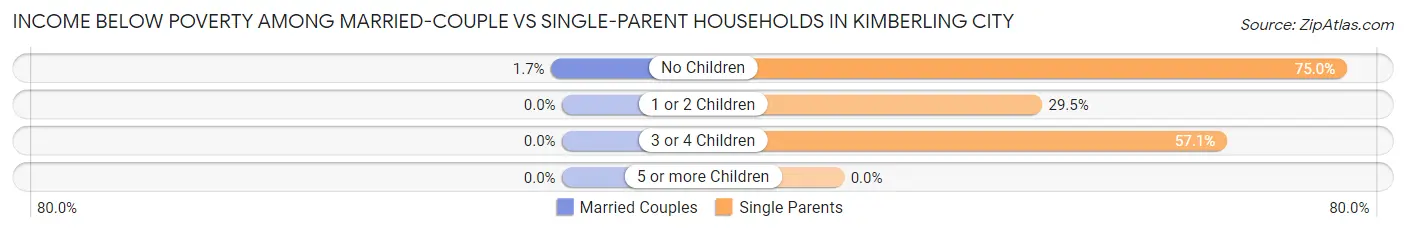
| Children | Married-Couple Families | Single-Parent Households |
| No Children | 8 (1.7%) | 63 (75.0%) |
| 1 or 2 Children | 0 (0.0%) | 23 (29.5%) |
| 3 or 4 Children | 0 (0.0%) | 12 (57.1%) |
| 5 or more Children | 0 (0.0%) | 0 (0.0%) |
| Total | 8 (1.4%) | 98 (53.5%) |
Race in Kimberling City
The most populous races in Kimberling City are White / Caucasian (2,476 | 94.3%), Two or more Races (121 | 4.6%), and Asian (28 | 1.1%).
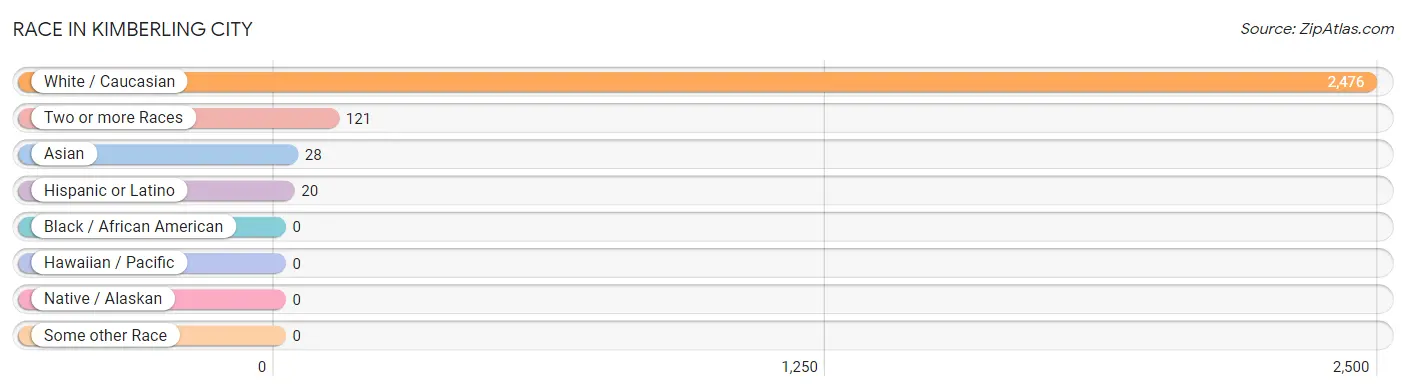
| Race | # Population | % Population |
| Asian | 28 | 1.1% |
| Black / African American | 0 | 0.0% |
| Hawaiian / Pacific | 0 | 0.0% |
| Hispanic or Latino | 20 | 0.8% |
| Native / Alaskan | 0 | 0.0% |
| White / Caucasian | 2,476 | 94.3% |
| Two or more Races | 121 | 4.6% |
| Some other Race | 0 | 0.0% |
| Total | 2,625 | 100.0% |
Ancestry in Kimberling City
The most populous ancestries reported in Kimberling City are English (441 | 16.8%), Irish (284 | 10.8%), German (280 | 10.7%), American (232 | 8.8%), and European (103 | 3.9%), together accounting for 51.1% of all Kimberling City residents.
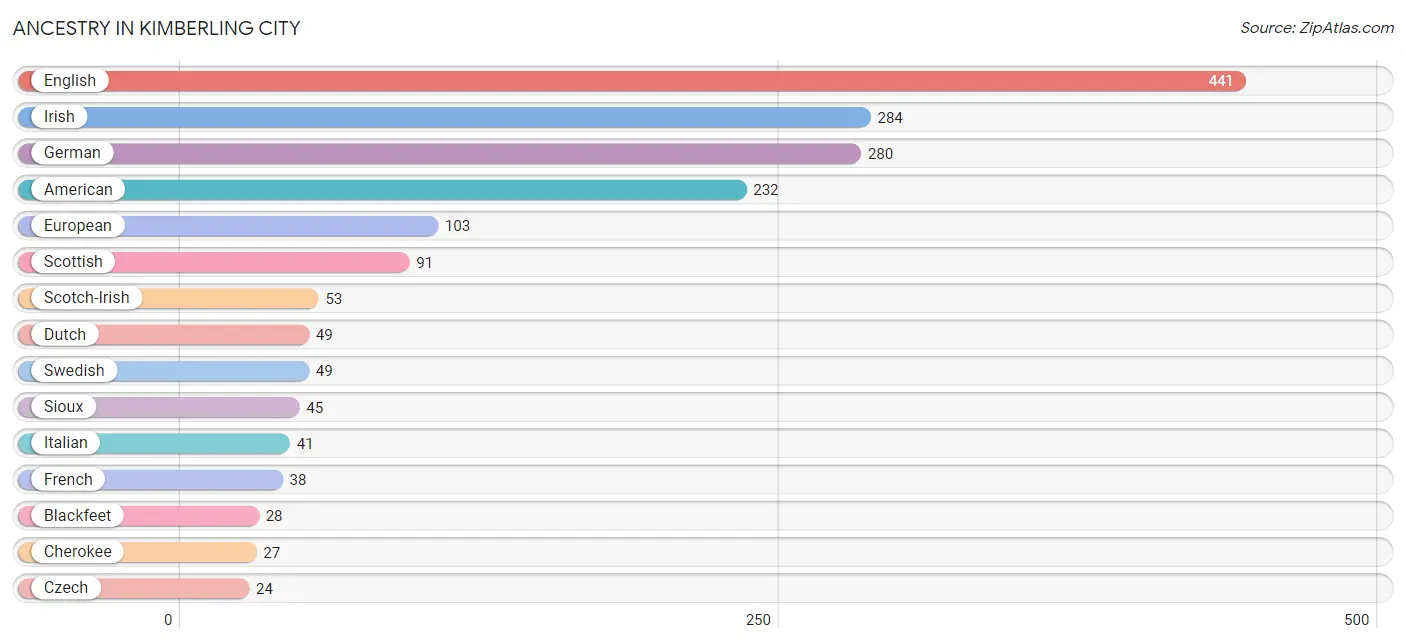
| Ancestry | # Population | % Population |
| American | 232 | 8.8% |
| Austrian | 3 | 0.1% |
| Bhutanese | 5 | 0.2% |
| Blackfeet | 28 | 1.1% |
| British | 17 | 0.6% |
| Canadian | 19 | 0.7% |
| Cherokee | 27 | 1.0% |
| Croatian | 3 | 0.1% |
| Czech | 24 | 0.9% |
| Czechoslovakian | 4 | 0.2% |
| Dutch | 49 | 1.9% |
| English | 441 | 16.8% |
| European | 103 | 3.9% |
| French | 38 | 1.5% |
| French Canadian | 21 | 0.8% |
| German | 280 | 10.7% |
| Hungarian | 8 | 0.3% |
| Irish | 284 | 10.8% |
| Italian | 41 | 1.6% |
| Korean | 3 | 0.1% |
| Lithuanian | 17 | 0.6% |
| Mexican | 20 | 0.8% |
| Norwegian | 19 | 0.7% |
| Polish | 6 | 0.2% |
| Russian | 5 | 0.2% |
| Scandinavian | 5 | 0.2% |
| Scotch-Irish | 53 | 2.0% |
| Scottish | 91 | 3.5% |
| Sioux | 45 | 1.7% |
| Slovak | 10 | 0.4% |
| Swedish | 49 | 1.9% |
| Swiss | 8 | 0.3% |
| Thai | 21 | 0.8% |
| Welsh | 11 | 0.4% | View All 34 Rows |
Immigrants in Kimberling City
The most numerous immigrant groups reported in Kimberling City came from Asia (28 | 1.1%), South Central Asia (25 | 0.9%), India (21 | 0.8%), Latin America (16 | 0.6%), and Europe (12 | 0.5%), together accounting for 3.9% of all Kimberling City residents.
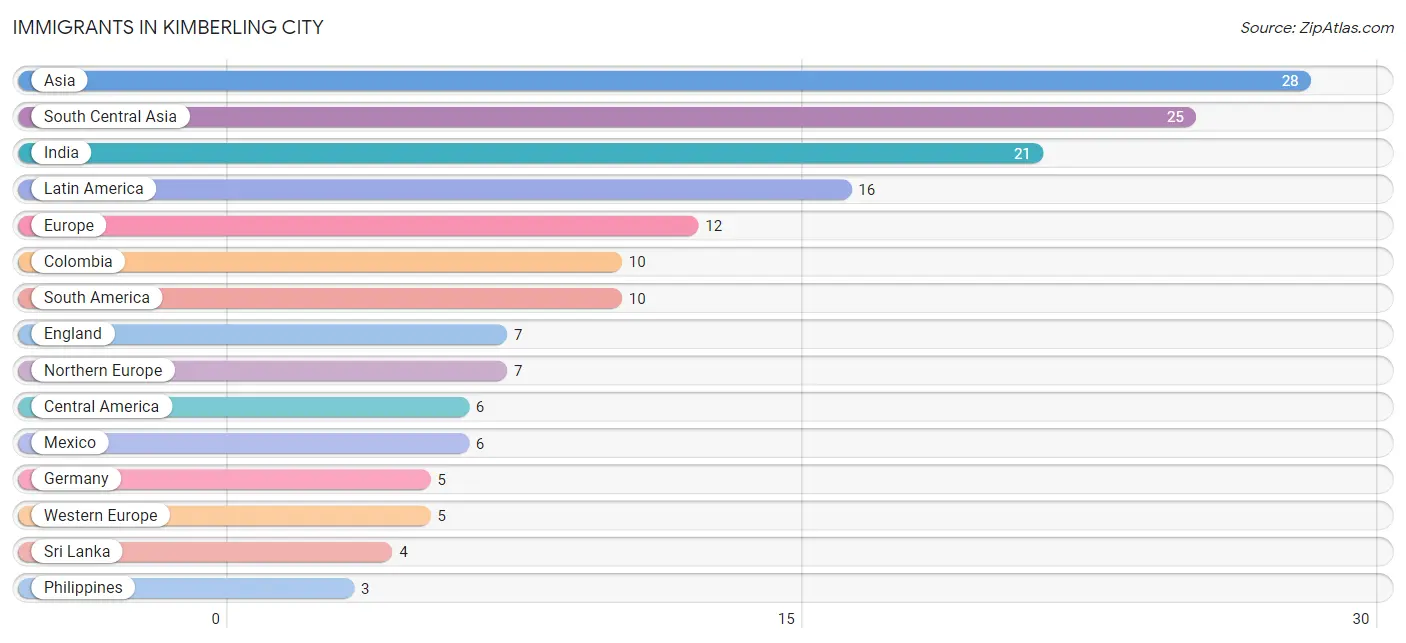
| Immigration Origin | # Population | % Population |
| Asia | 28 | 1.1% |
| Central America | 6 | 0.2% |
| Colombia | 10 | 0.4% |
| England | 7 | 0.3% |
| Europe | 12 | 0.5% |
| Germany | 5 | 0.2% |
| India | 21 | 0.8% |
| Latin America | 16 | 0.6% |
| Mexico | 6 | 0.2% |
| Northern Europe | 7 | 0.3% |
| Philippines | 3 | 0.1% |
| South America | 10 | 0.4% |
| South Central Asia | 25 | 0.9% |
| South Eastern Asia | 3 | 0.1% |
| Sri Lanka | 4 | 0.2% |
| Western Europe | 5 | 0.2% | View All 16 Rows |
Sex and Age in Kimberling City
Sex and Age in Kimberling City
The most populous age groups in Kimberling City are 60 to 64 Years (168 | 13.7%) for men and 65 to 69 Years (245 | 17.5%) for women.
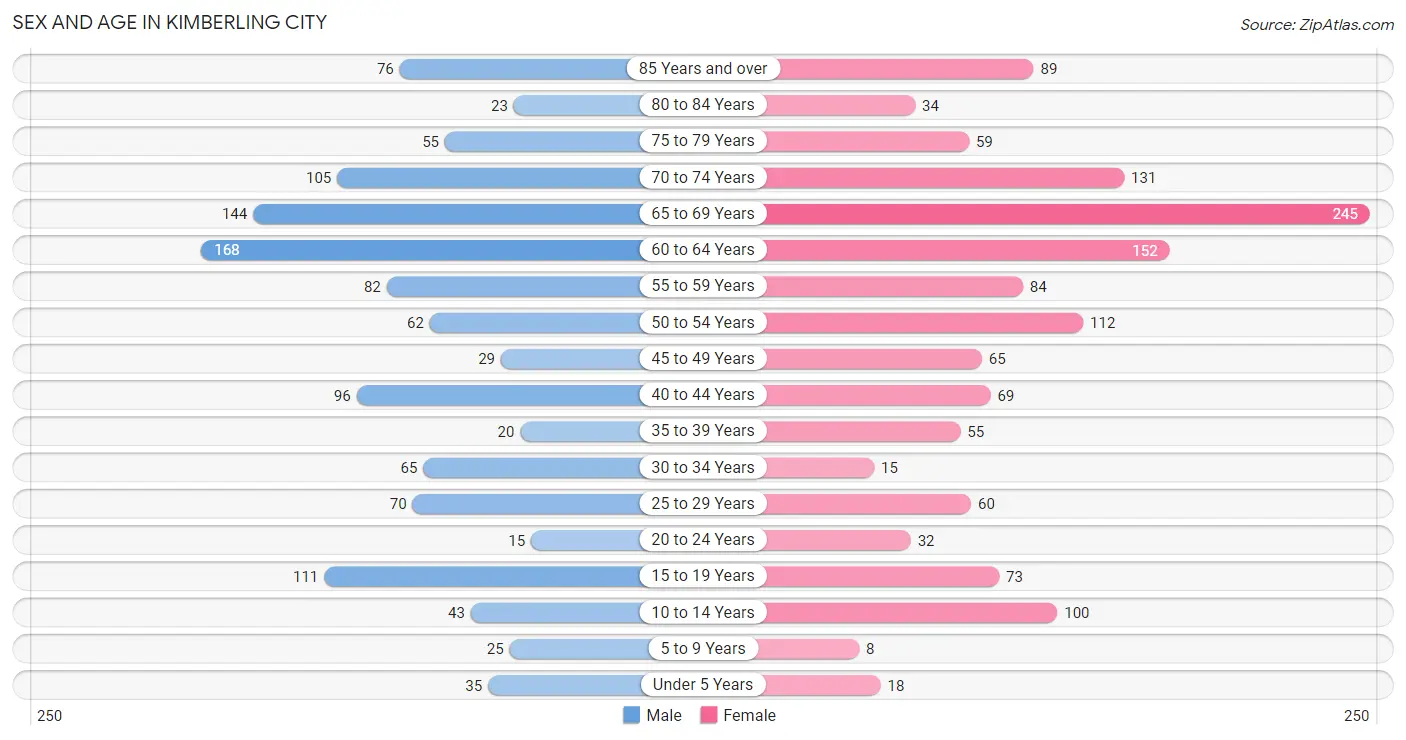
| Age Bracket | Male | Female |
| Under 5 Years | 35 (2.9%) | 18 (1.3%) |
| 5 to 9 Years | 25 (2.0%) | 8 (0.6%) |
| 10 to 14 Years | 43 (3.5%) | 100 (7.1%) |
| 15 to 19 Years | 111 (9.1%) | 73 (5.2%) |
| 20 to 24 Years | 15 (1.2%) | 32 (2.3%) |
| 25 to 29 Years | 70 (5.7%) | 60 (4.3%) |
| 30 to 34 Years | 65 (5.3%) | 15 (1.1%) |
| 35 to 39 Years | 20 (1.6%) | 55 (3.9%) |
| 40 to 44 Years | 96 (7.8%) | 69 (4.9%) |
| 45 to 49 Years | 29 (2.4%) | 65 (4.6%) |
| 50 to 54 Years | 62 (5.1%) | 112 (8.0%) |
| 55 to 59 Years | 82 (6.7%) | 84 (6.0%) |
| 60 to 64 Years | 168 (13.7%) | 152 (10.8%) |
| 65 to 69 Years | 144 (11.8%) | 245 (17.5%) |
| 70 to 74 Years | 105 (8.6%) | 131 (9.3%) |
| 75 to 79 Years | 55 (4.5%) | 59 (4.2%) |
| 80 to 84 Years | 23 (1.9%) | 34 (2.4%) |
| 85 Years and over | 76 (6.2%) | 89 (6.4%) |
| Total | 1,224 (100.0%) | 1,401 (100.0%) |
Families and Households in Kimberling City
Median Family Size in Kimberling City
The median family size in Kimberling City is 2.71 persons per family, with married-couple families (562 | 75.4%) accounting for the largest median family size of 2.73 persons per family. On the other hand, single male/father families (10 | 1.3%) represent the smallest median family size with 2.50 persons per family.
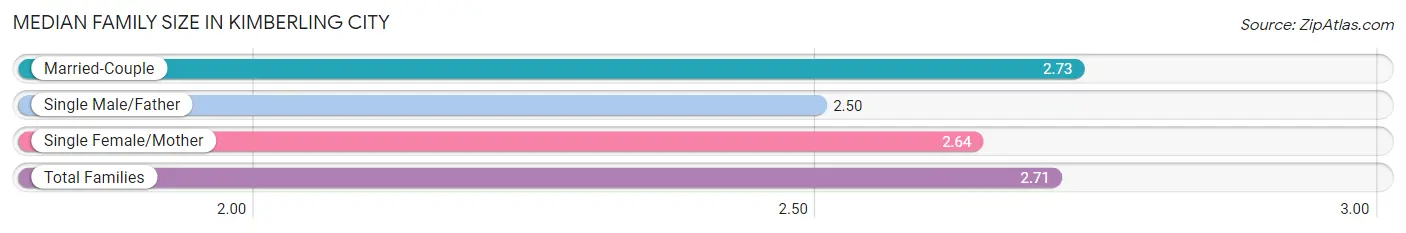
| Family Type | # Families | Family Size |
| Married-Couple | 562 (75.4%) | 2.73 |
| Single Male/Father | 10 (1.3%) | 2.50 |
| Single Female/Mother | 173 (23.2%) | 2.64 |
| Total Families | 745 (100.0%) | 2.71 |
Median Household Size in Kimberling City
The median household size in Kimberling City is 2.22 persons per household, with single female/mother households (173 | 14.6%) accounting for the largest median household size of 3.15 persons per household. non-family households (438 | 37.0%) represent the smallest median household size with 1.18 persons per household.
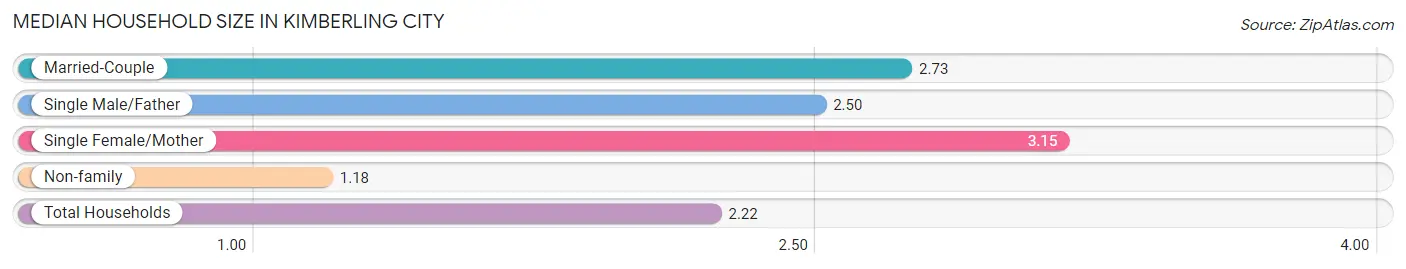
| Household Type | # Households | Household Size |
| Married-Couple | 562 (47.5%) | 2.73 |
| Single Male/Father | 10 (0.9%) | 2.50 |
| Single Female/Mother | 173 (14.6%) | 3.15 |
| Non-family | 438 (37.0%) | 1.18 |
| Total Households | 1,183 (100.0%) | 2.22 |
Household Size by Marriage Status in Kimberling City
Out of a total of 1,183 households in Kimberling City, 745 (63.0%) are family households, while 438 (37.0%) are nonfamily households. The most numerous type of family households are 2-person households, comprising 480, and the most common type of nonfamily households are 1-person households, comprising 387.
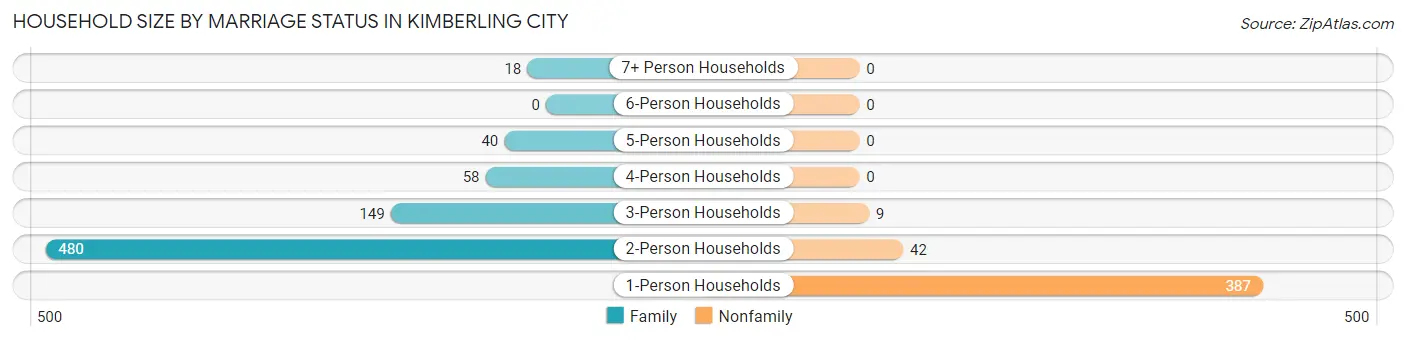
| Household Size | Family Households | Nonfamily Households |
| 1-Person Households | - | 387 (32.7%) |
| 2-Person Households | 480 (40.6%) | 42 (3.5%) |
| 3-Person Households | 149 (12.6%) | 9 (0.8%) |
| 4-Person Households | 58 (4.9%) | 0 (0.0%) |
| 5-Person Households | 40 (3.4%) | 0 (0.0%) |
| 6-Person Households | 0 (0.0%) | 0 (0.0%) |
| 7+ Person Households | 18 (1.5%) | 0 (0.0%) |
| Total | 745 (63.0%) | 438 (37.0%) |
Female Fertility in Kimberling City
Fertility by Age in Kimberling City
Average fertility rate in Kimberling City is 31.0 births per 1,000 women. Women in the age bracket of 20 to 34 years have the highest fertility rate with 112.0 births per 1,000 women. Women in the age bracket of 20 to 34 years acount for 100.0% of all women with births.
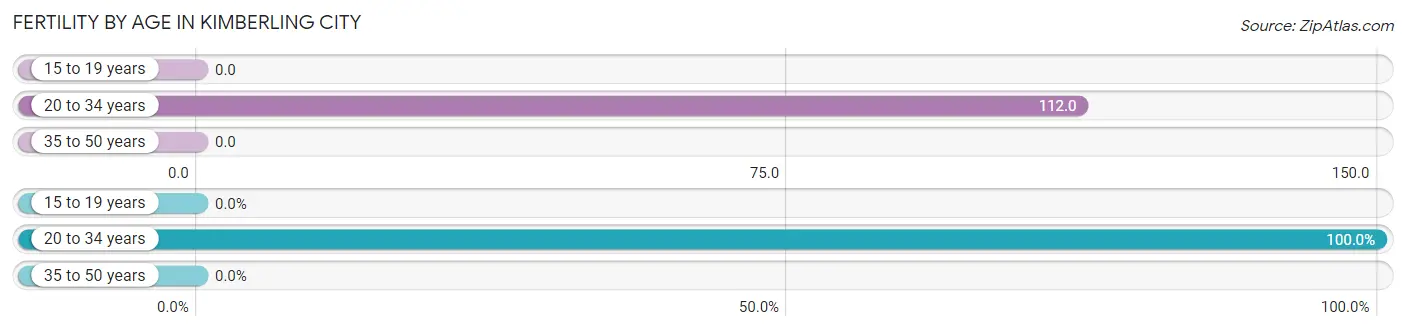
| Age Bracket | Women with Births | Births / 1,000 Women |
| 15 to 19 years | 0 (0.0%) | 0.0 |
| 20 to 34 years | 12 (100.0%) | 112.0 |
| 35 to 50 years | 0 (0.0%) | 0.0 |
| Total | 12 (100.0%) | 31.0 |
Fertility by Age by Marriage Status in Kimberling City
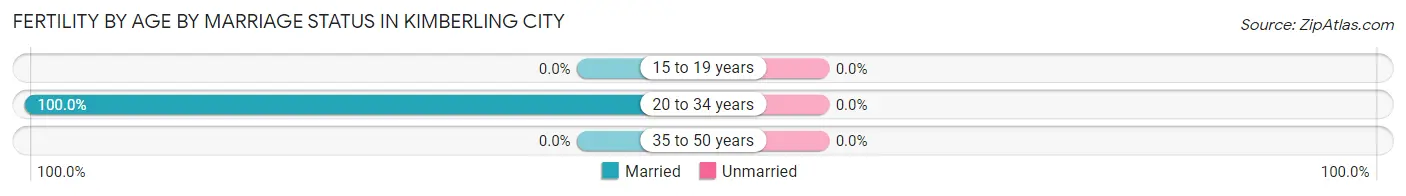
| Age Bracket | Married | Unmarried |
| 15 to 19 years | 0 (0.0%) | 0 (0.0%) |
| 20 to 34 years | 12 (100.0%) | 0 (0.0%) |
| 35 to 50 years | 0 (0.0%) | 0 (0.0%) |
| Total | 12 (100.0%) | 0 (0.0%) |
Fertility by Education in Kimberling City
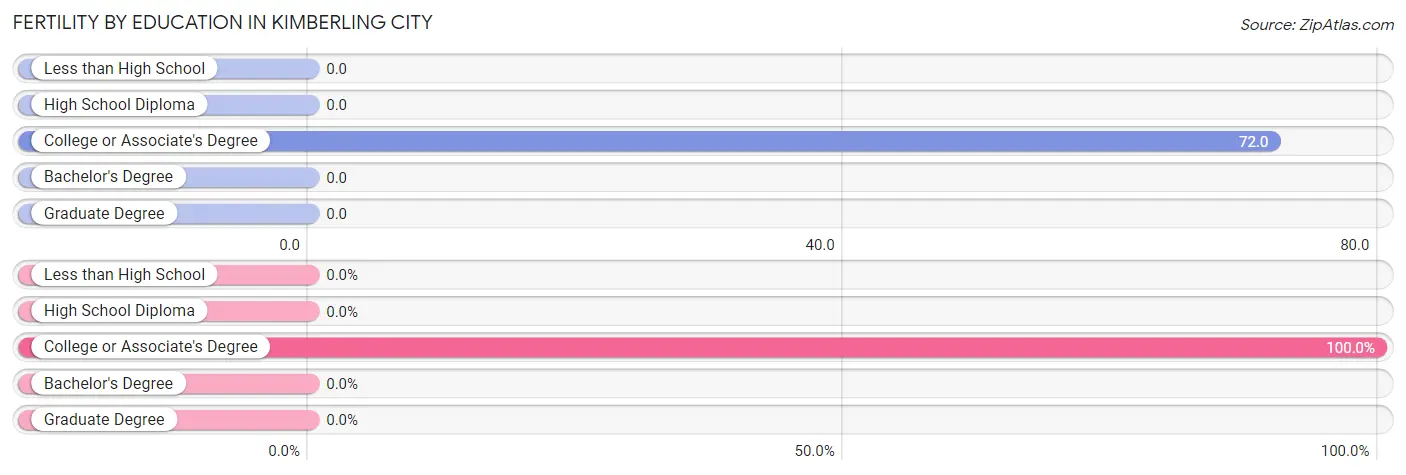
| Educational Attainment | Women with Births | Births / 1,000 Women |
| Less than High School | 0 (0.0%) | 0.0 |
| High School Diploma | 0 (0.0%) | 0.0 |
| College or Associate's Degree | 12 (100.0%) | 72.0 |
| Bachelor's Degree | 0 (0.0%) | 0.0 |
| Graduate Degree | 0 (0.0%) | 0.0 |
| Total | 12 (100.0%) | 31.0 |
Fertility by Education by Marriage Status in Kimberling City
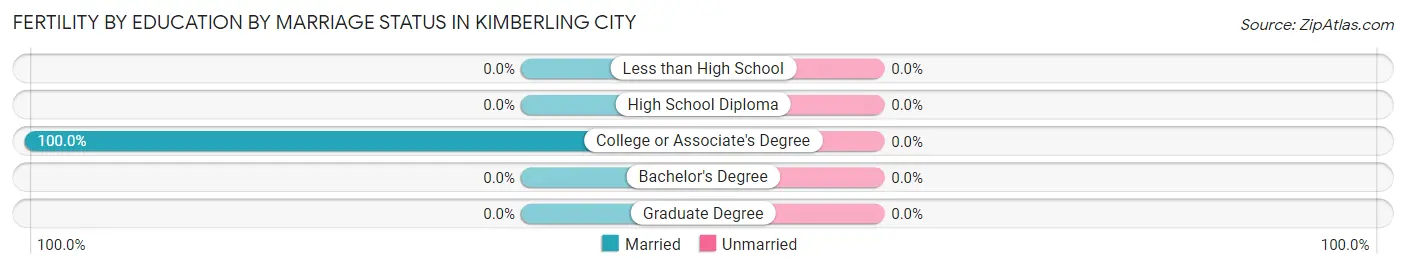
| Educational Attainment | Married | Unmarried |
| Less than High School | 0 (0.0%) | 0 (0.0%) |
| High School Diploma | 0 (0.0%) | 0 (0.0%) |
| College or Associate's Degree | 12 (100.0%) | 0 (0.0%) |
| Bachelor's Degree | 0 (0.0%) | 0 (0.0%) |
| Graduate Degree | 0 (0.0%) | 0 (0.0%) |
| Total | 12 (100.0%) | 0 (0.0%) |
Employment Characteristics in Kimberling City
Employment by Class of Employer in Kimberling City
Among the 923 employed individuals in Kimberling City, private company employees (647 | 70.1%), local government employees (77 | 8.3%), and not-for-profit organizations (67 | 7.3%) make up the most common classes of employment.
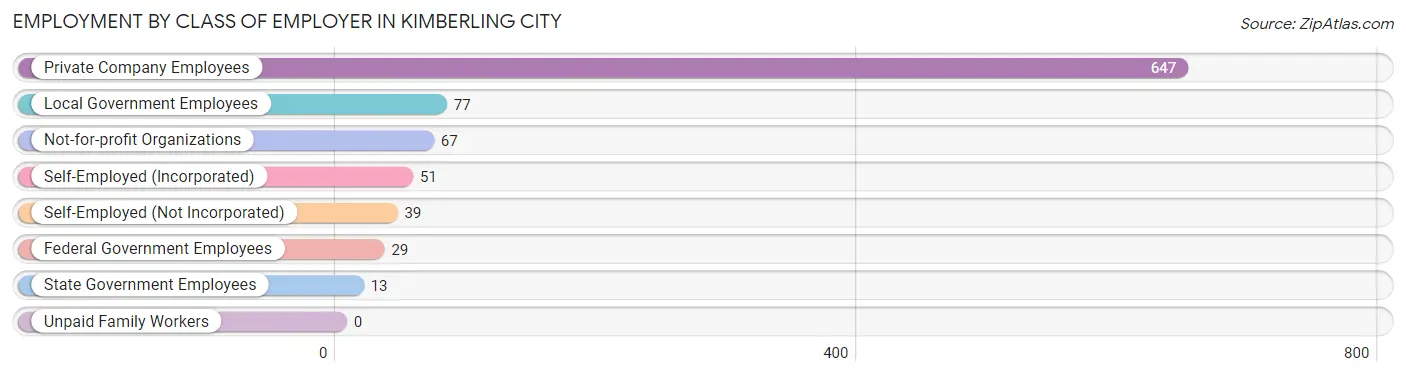
| Employer Class | # Employees | % Employees |
| Private Company Employees | 647 | 70.1% |
| Self-Employed (Incorporated) | 51 | 5.5% |
| Self-Employed (Not Incorporated) | 39 | 4.2% |
| Not-for-profit Organizations | 67 | 7.3% |
| Local Government Employees | 77 | 8.3% |
| State Government Employees | 13 | 1.4% |
| Federal Government Employees | 29 | 3.1% |
| Unpaid Family Workers | 0 | 0.0% |
| Total | 923 | 100.0% |
Employment Status by Age in Kimberling City
According to the labor force statistics for Kimberling City, out of the total population over 16 years of age (2,375), 44.1% or 1,047 individuals are in the labor force, with 11.8% or 124 of them unemployed. The age group with the highest labor force participation rate is 20 to 24 years, with 100.0% or 47 individuals in the labor force. Within the labor force, the 20 to 24 years age range has the highest percentage of unemployed individuals, with 63.8% or 30 of them being unemployed.
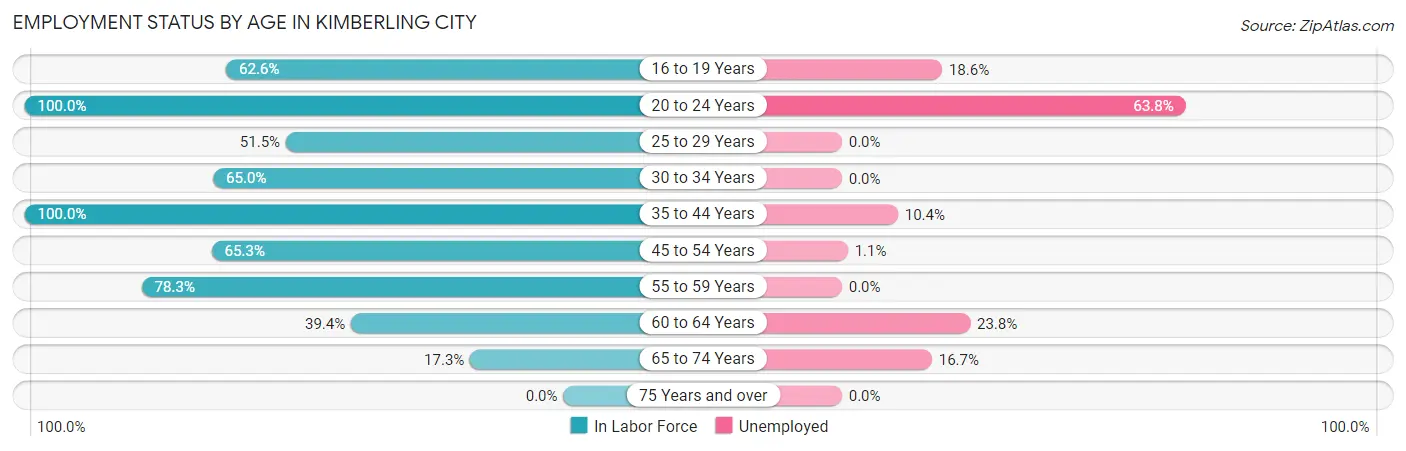
| Age Bracket | In Labor Force | Unemployed |
| 16 to 19 Years | 102 (62.6%) | 19 (18.6%) |
| 20 to 24 Years | 47 (100.0%) | 30 (63.8%) |
| 25 to 29 Years | 67 (51.5%) | 0 (0.0%) |
| 30 to 34 Years | 52 (65.0%) | 0 (0.0%) |
| 35 to 44 Years | 240 (100.0%) | 25 (10.4%) |
| 45 to 54 Years | 175 (65.3%) | 2 (1.1%) |
| 55 to 59 Years | 130 (78.3%) | 0 (0.0%) |
| 60 to 64 Years | 126 (39.4%) | 30 (23.8%) |
| 65 to 74 Years | 108 (17.3%) | 18 (16.7%) |
| 75 Years and over | 0 (0.0%) | 0 (0.0%) |
| Total | 1,047 (44.1%) | 124 (11.8%) |
Employment Status by Educational Attainment in Kimberling City
According to labor force statistics for Kimberling City, 65.6% of individuals (790) out of the total population between 25 and 64 years of age (1,204) are in the labor force, with 7.2% or 57 of them being unemployed. The group with the highest labor force participation rate are those with the educational attainment of college / associate degree, with 77.9% or 349 individuals in the labor force. Within the labor force, individuals with high school diploma education have the highest percentage of unemployment, with 16.0% or 43 of them being unemployed.
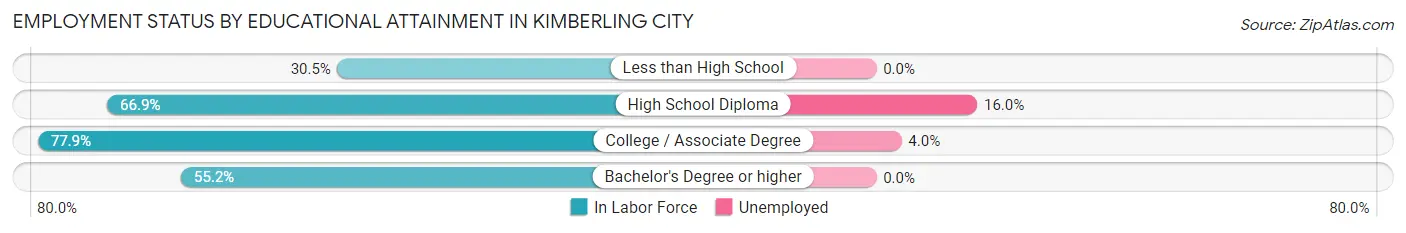
| Educational Attainment | In Labor Force | Unemployed |
| Less than High School | 29 (30.5%) | 0 (0.0%) |
| High School Diploma | 269 (66.9%) | 64 (16.0%) |
| College / Associate Degree | 349 (77.9%) | 18 (4.0%) |
| Bachelor's Degree or higher | 143 (55.2%) | 0 (0.0%) |
| Total | 790 (65.6%) | 87 (7.2%) |
Employment Occupations by Sex in Kimberling City
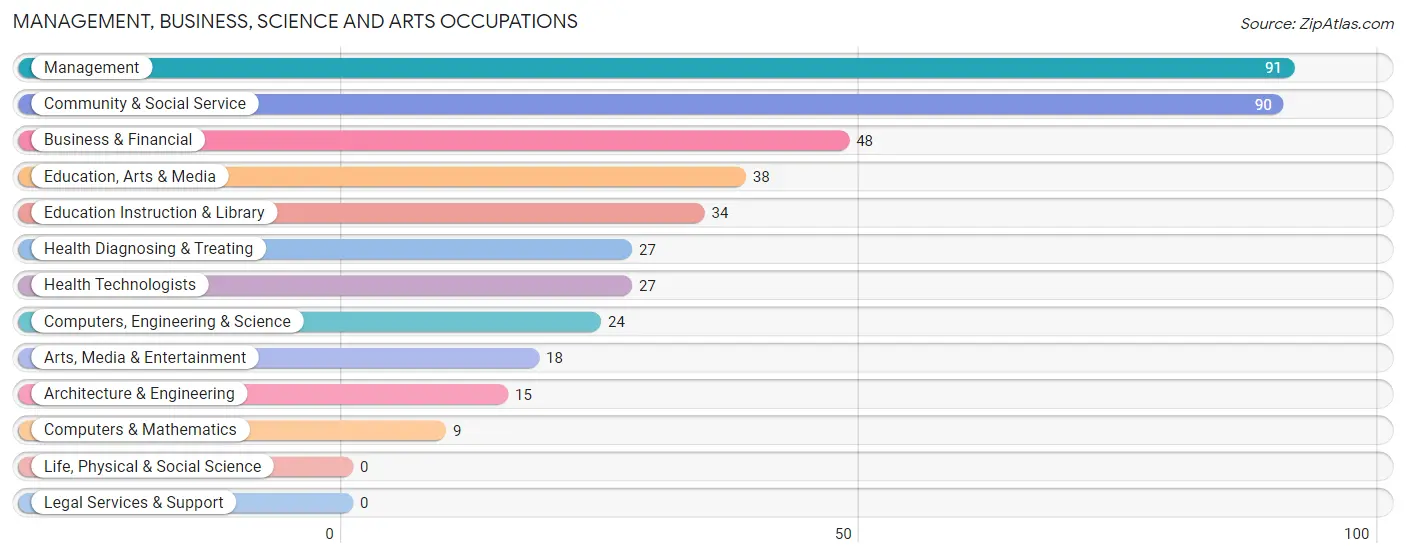
Management, Business, Science and Arts Occupations
The most common Management, Business, Science and Arts occupations in Kimberling City are Management (91 | 9.9%), Community & Social Service (90 | 9.8%), Business & Financial (48 | 5.2%), Education, Arts & Media (38 | 4.1%), and Education Instruction & Library (34 | 3.7%).
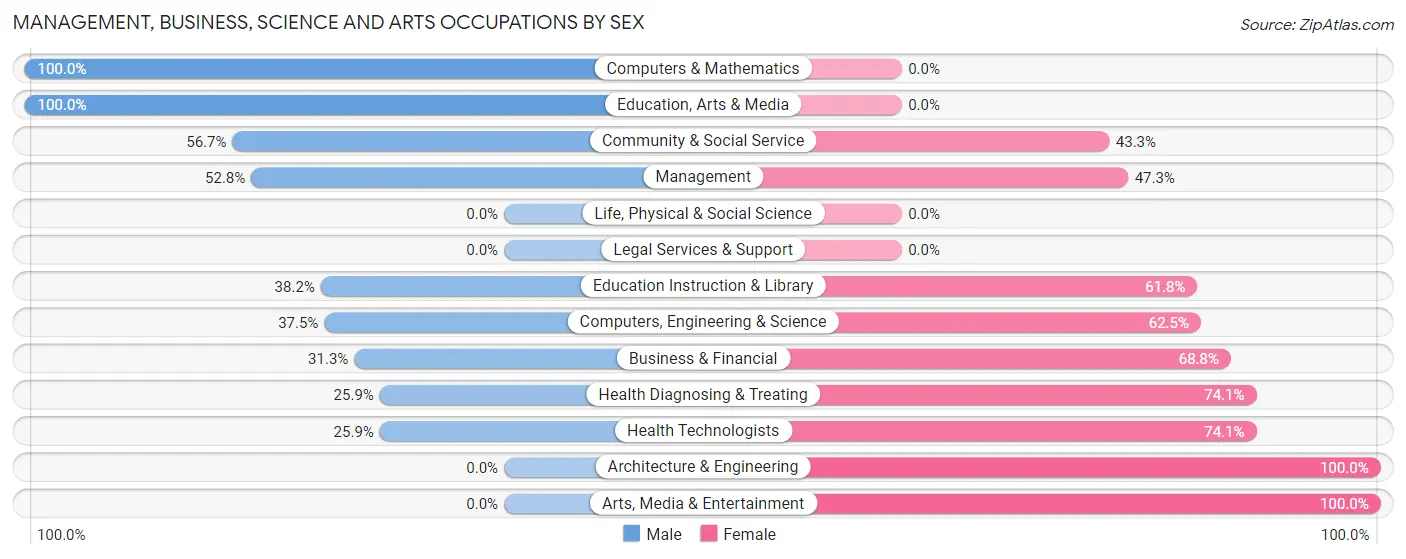
Management, Business, Science and Arts Occupations by Sex
Within the Management, Business, Science and Arts occupations in Kimberling City, the most male-oriented occupations are Computers & Mathematics (100.0%), Education, Arts & Media (100.0%), and Community & Social Service (56.7%), while the most female-oriented occupations are Architecture & Engineering (100.0%), Arts, Media & Entertainment (100.0%), and Health Diagnosing & Treating (74.1%).
| Occupation | Male | Female |
| Management | 48 (52.7%) | 43 (47.2%) |
| Business & Financial | 15 (31.2%) | 33 (68.8%) |
| Computers, Engineering & Science | 9 (37.5%) | 15 (62.5%) |
| Computers & Mathematics | 9 (100.0%) | 0 (0.0%) |
| Architecture & Engineering | 0 (0.0%) | 15 (100.0%) |
| Life, Physical & Social Science | 0 (0.0%) | 0 (0.0%) |
| Community & Social Service | 51 (56.7%) | 39 (43.3%) |
| Education, Arts & Media | 38 (100.0%) | 0 (0.0%) |
| Legal Services & Support | 0 (0.0%) | 0 (0.0%) |
| Education Instruction & Library | 13 (38.2%) | 21 (61.8%) |
| Arts, Media & Entertainment | 0 (0.0%) | 18 (100.0%) |
| Health Diagnosing & Treating | 7 (25.9%) | 20 (74.1%) |
| Health Technologists | 7 (25.9%) | 20 (74.1%) |
| Total (Category) | 130 (46.4%) | 150 (53.6%) |
| Total (Overall) | 461 (49.9%) | 462 (50.0%) |
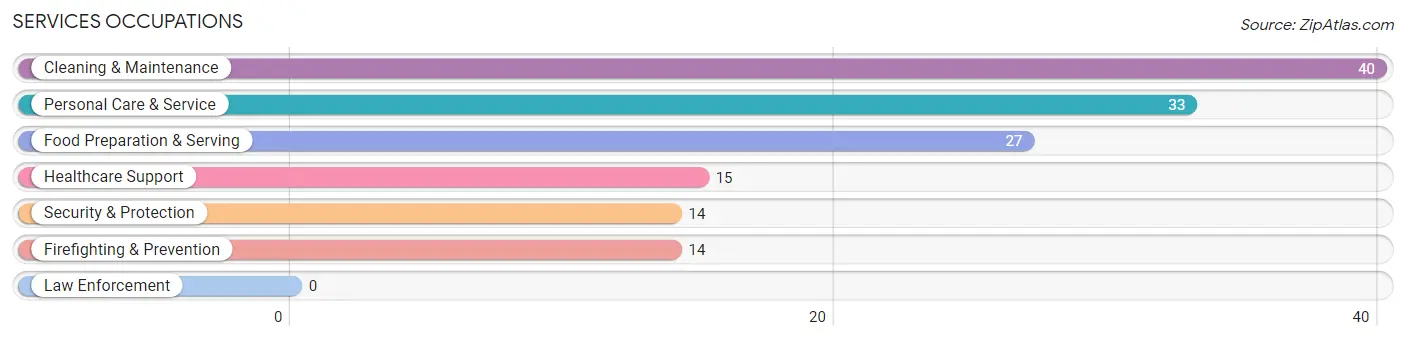
Services Occupations
The most common Services occupations in Kimberling City are Cleaning & Maintenance (40 | 4.3%), Personal Care & Service (33 | 3.6%), Food Preparation & Serving (27 | 2.9%), Healthcare Support (15 | 1.6%), and Security & Protection (14 | 1.5%).
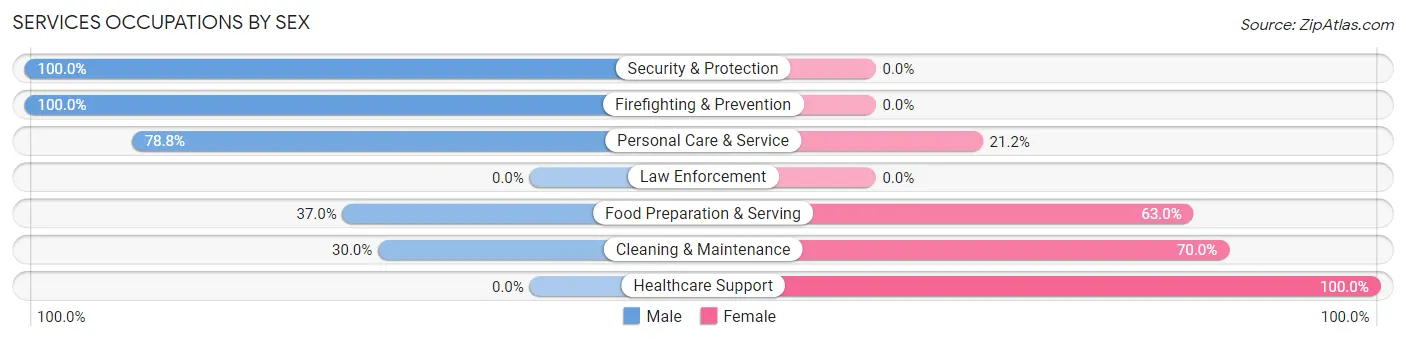
Services Occupations by Sex
Within the Services occupations in Kimberling City, the most male-oriented occupations are Security & Protection (100.0%), Firefighting & Prevention (100.0%), and Personal Care & Service (78.8%), while the most female-oriented occupations are Healthcare Support (100.0%), Cleaning & Maintenance (70.0%), and Food Preparation & Serving (63.0%).
| Occupation | Male | Female |
| Healthcare Support | 0 (0.0%) | 15 (100.0%) |
| Security & Protection | 14 (100.0%) | 0 (0.0%) |
| Firefighting & Prevention | 14 (100.0%) | 0 (0.0%) |
| Law Enforcement | 0 (0.0%) | 0 (0.0%) |
| Food Preparation & Serving | 10 (37.0%) | 17 (63.0%) |
| Cleaning & Maintenance | 12 (30.0%) | 28 (70.0%) |
| Personal Care & Service | 26 (78.8%) | 7 (21.2%) |
| Total (Category) | 62 (48.1%) | 67 (51.9%) |
| Total (Overall) | 461 (49.9%) | 462 (50.0%) |
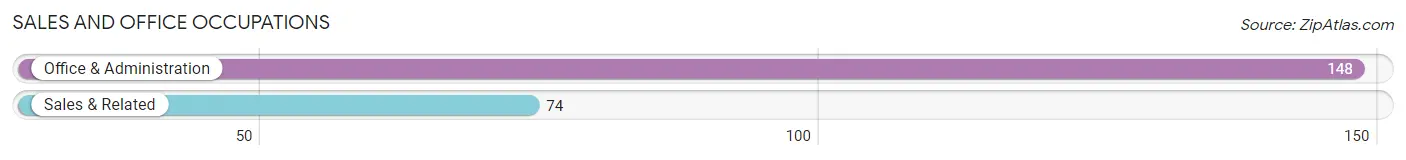
Sales and Office Occupations
The most common Sales and Office occupations in Kimberling City are Office & Administration (148 | 16.0%), and Sales & Related (74 | 8.0%).
Sales and Office Occupations by Sex
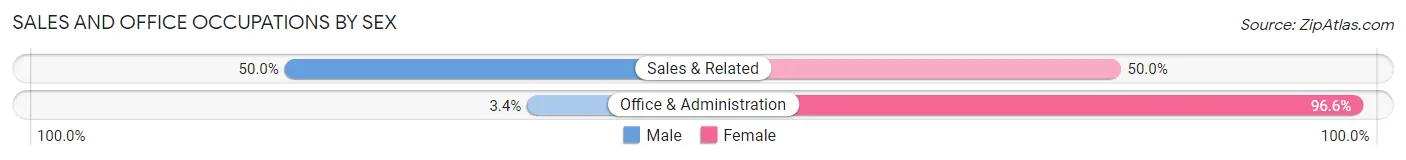
| Occupation | Male | Female |
| Sales & Related | 37 (50.0%) | 37 (50.0%) |
| Office & Administration | 5 (3.4%) | 143 (96.6%) |
| Total (Category) | 42 (18.9%) | 180 (81.1%) |
| Total (Overall) | 461 (49.9%) | 462 (50.0%) |
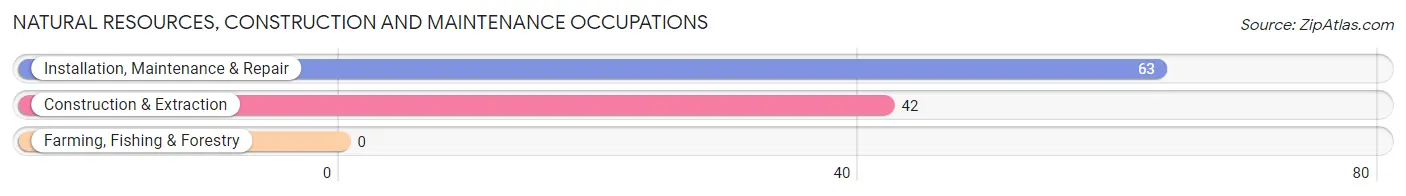
Natural Resources, Construction and Maintenance Occupations
The most common Natural Resources, Construction and Maintenance occupations in Kimberling City are Installation, Maintenance & Repair (63 | 6.8%), and Construction & Extraction (42 | 4.5%).
Natural Resources, Construction and Maintenance Occupations by Sex
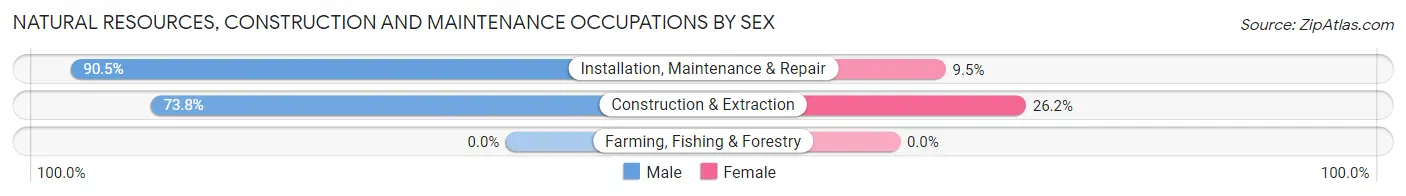
| Occupation | Male | Female |
| Farming, Fishing & Forestry | 0 (0.0%) | 0 (0.0%) |
| Construction & Extraction | 31 (73.8%) | 11 (26.2%) |
| Installation, Maintenance & Repair | 57 (90.5%) | 6 (9.5%) |
| Total (Category) | 88 (83.8%) | 17 (16.2%) |
| Total (Overall) | 461 (49.9%) | 462 (50.0%) |
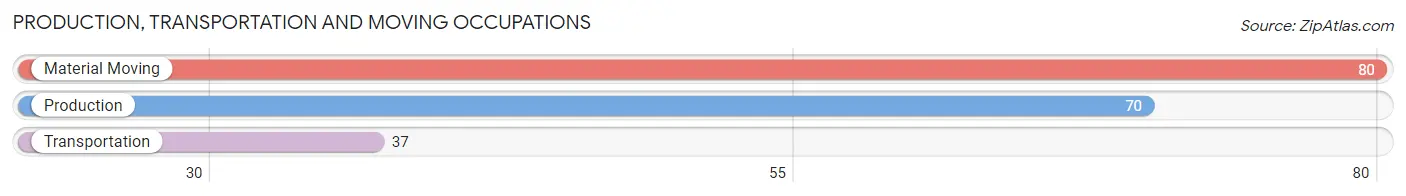
Production, Transportation and Moving Occupations
The most common Production, Transportation and Moving occupations in Kimberling City are Material Moving (80 | 8.7%), Production (70 | 7.6%), and Transportation (37 | 4.0%).
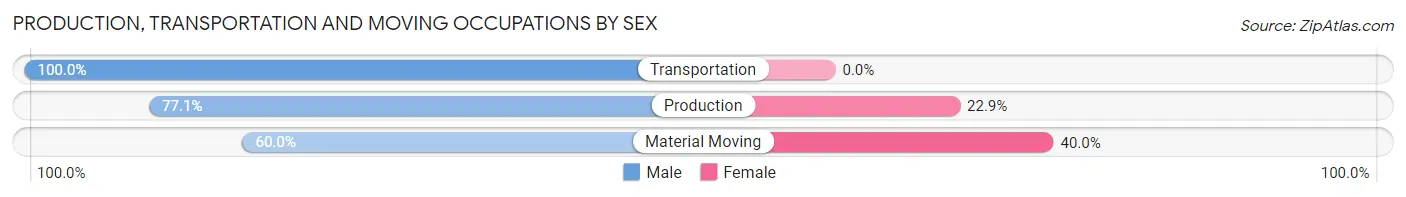
Production, Transportation and Moving Occupations by Sex
| Occupation | Male | Female |
| Production | 54 (77.1%) | 16 (22.9%) |
| Transportation | 37 (100.0%) | 0 (0.0%) |
| Material Moving | 48 (60.0%) | 32 (40.0%) |
| Total (Category) | 139 (74.3%) | 48 (25.7%) |
| Total (Overall) | 461 (49.9%) | 462 (50.0%) |
Employment Industries by Sex in Kimberling City
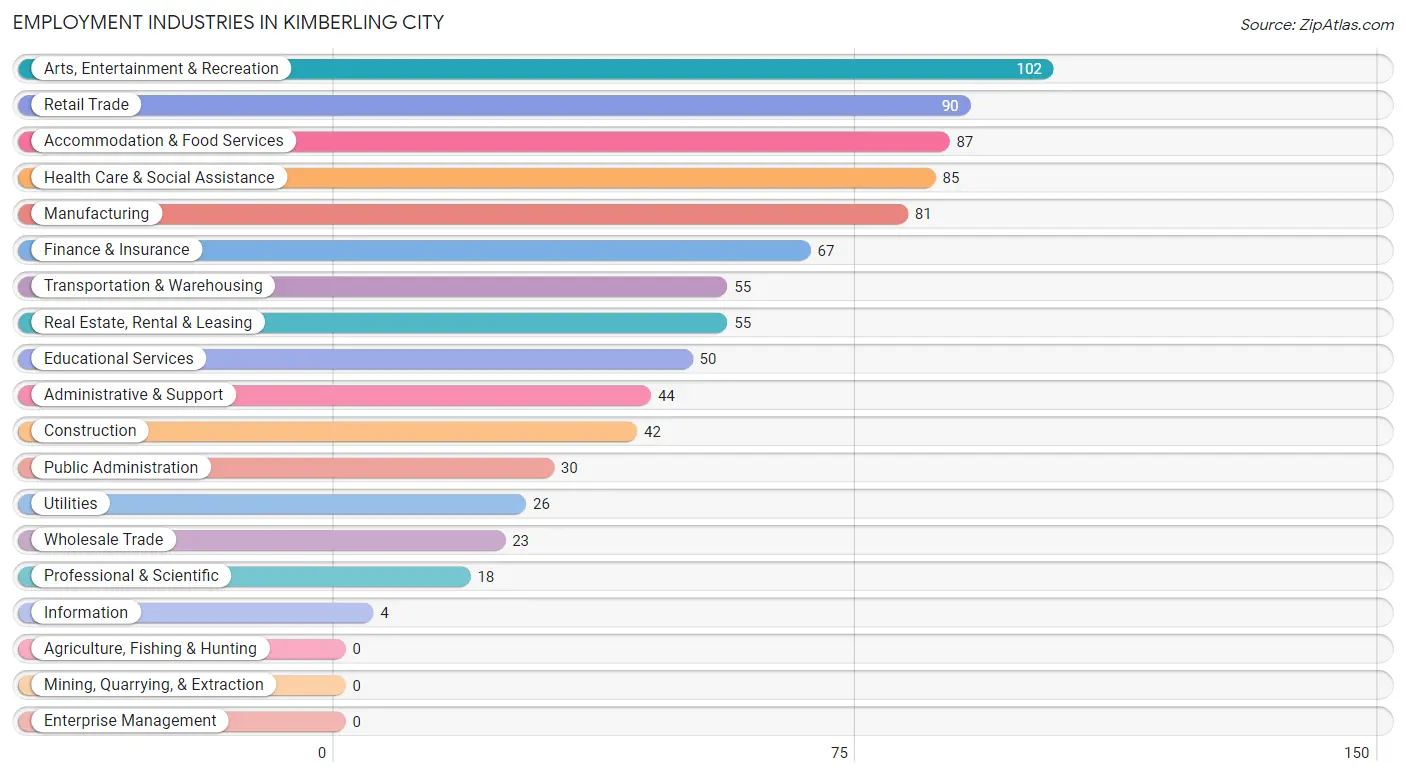
Employment Industries in Kimberling City
The major employment industries in Kimberling City include Arts, Entertainment & Recreation (102 | 11.1%), Retail Trade (90 | 9.8%), Accommodation & Food Services (87 | 9.4%), Health Care & Social Assistance (85 | 9.2%), and Manufacturing (81 | 8.8%).
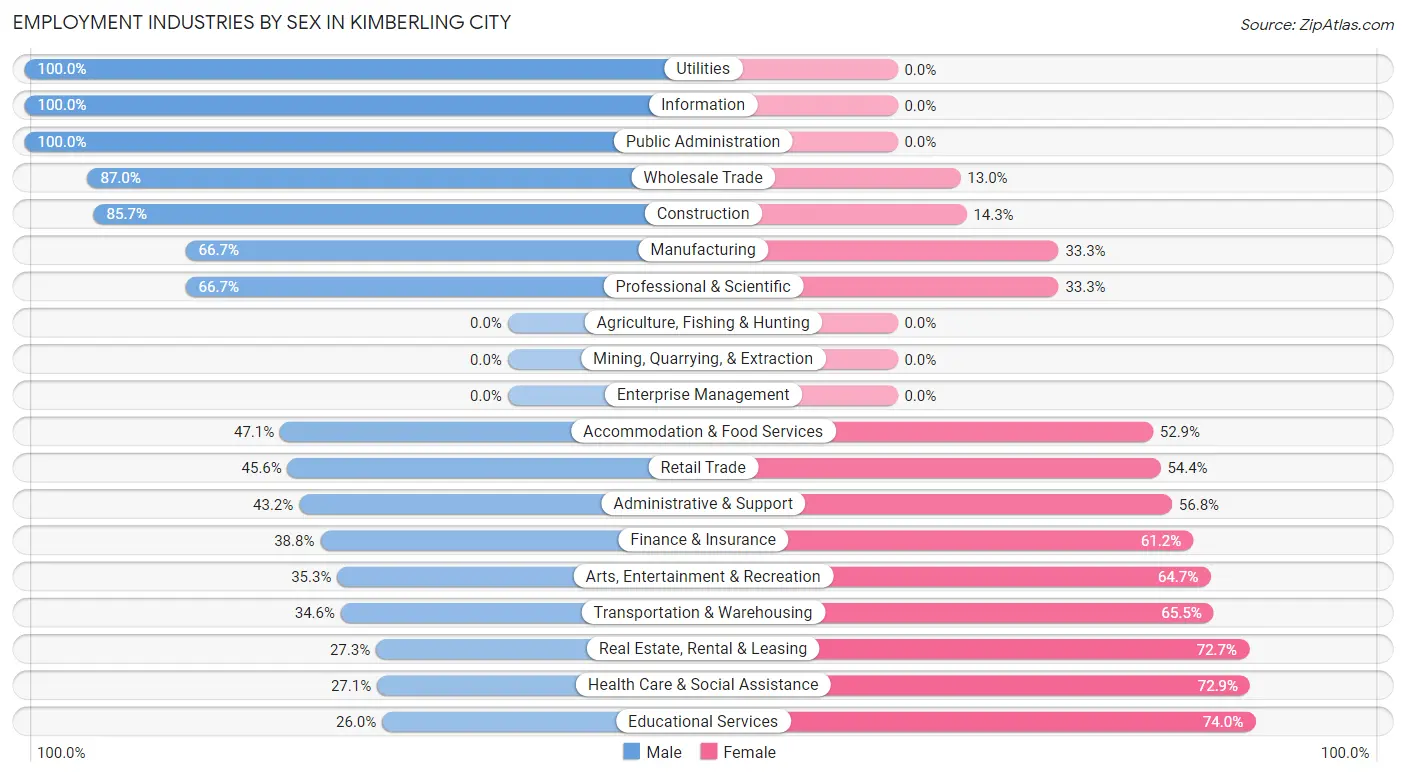
Employment Industries by Sex in Kimberling City
The Kimberling City industries that see more men than women are Utilities (100.0%), Information (100.0%), and Public Administration (100.0%), whereas the industries that tend to have a higher number of women are Educational Services (74.0%), Health Care & Social Assistance (72.9%), and Real Estate, Rental & Leasing (72.7%).
| Industry | Male | Female |
| Agriculture, Fishing & Hunting | 0 (0.0%) | 0 (0.0%) |
| Mining, Quarrying, & Extraction | 0 (0.0%) | 0 (0.0%) |
| Construction | 36 (85.7%) | 6 (14.3%) |
| Manufacturing | 54 (66.7%) | 27 (33.3%) |
| Wholesale Trade | 20 (87.0%) | 3 (13.0%) |
| Retail Trade | 41 (45.6%) | 49 (54.4%) |
| Transportation & Warehousing | 19 (34.5%) | 36 (65.4%) |
| Utilities | 26 (100.0%) | 0 (0.0%) |
| Information | 4 (100.0%) | 0 (0.0%) |
| Finance & Insurance | 26 (38.8%) | 41 (61.2%) |
| Real Estate, Rental & Leasing | 15 (27.3%) | 40 (72.7%) |
| Professional & Scientific | 12 (66.7%) | 6 (33.3%) |
| Enterprise Management | 0 (0.0%) | 0 (0.0%) |
| Administrative & Support | 19 (43.2%) | 25 (56.8%) |
| Educational Services | 13 (26.0%) | 37 (74.0%) |
| Health Care & Social Assistance | 23 (27.1%) | 62 (72.9%) |
| Arts, Entertainment & Recreation | 36 (35.3%) | 66 (64.7%) |
| Accommodation & Food Services | 41 (47.1%) | 46 (52.9%) |
| Public Administration | 30 (100.0%) | 0 (0.0%) |
| Total | 461 (49.9%) | 462 (50.0%) |
Education in Kimberling City
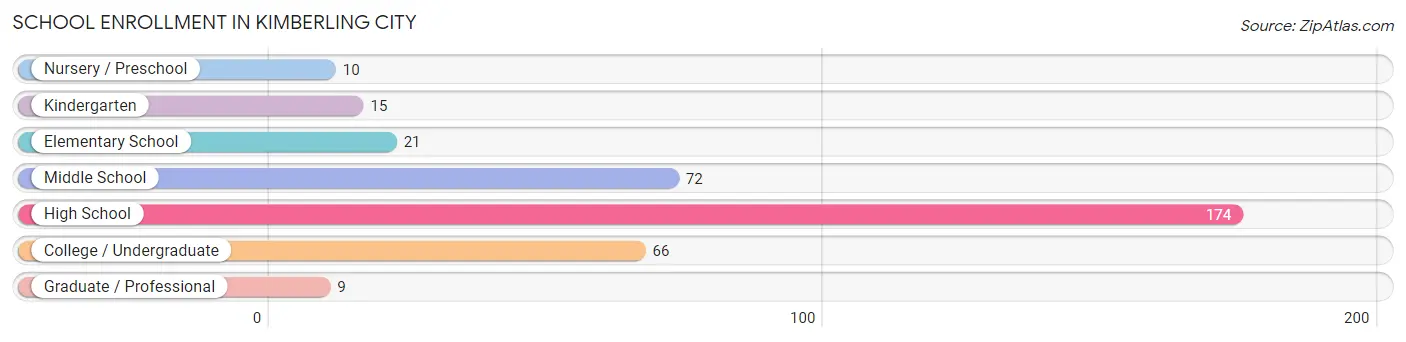
School Enrollment in Kimberling City
The most common levels of schooling among the 367 students in Kimberling City are high school (174 | 47.4%), middle school (72 | 19.6%), and college / undergraduate (66 | 18.0%).
| School Level | # Students | % Students |
| Nursery / Preschool | 10 | 2.7% |
| Kindergarten | 15 | 4.1% |
| Elementary School | 21 | 5.7% |
| Middle School | 72 | 19.6% |
| High School | 174 | 47.4% |
| College / Undergraduate | 66 | 18.0% |
| Graduate / Professional | 9 | 2.5% |
| Total | 367 | 100.0% |
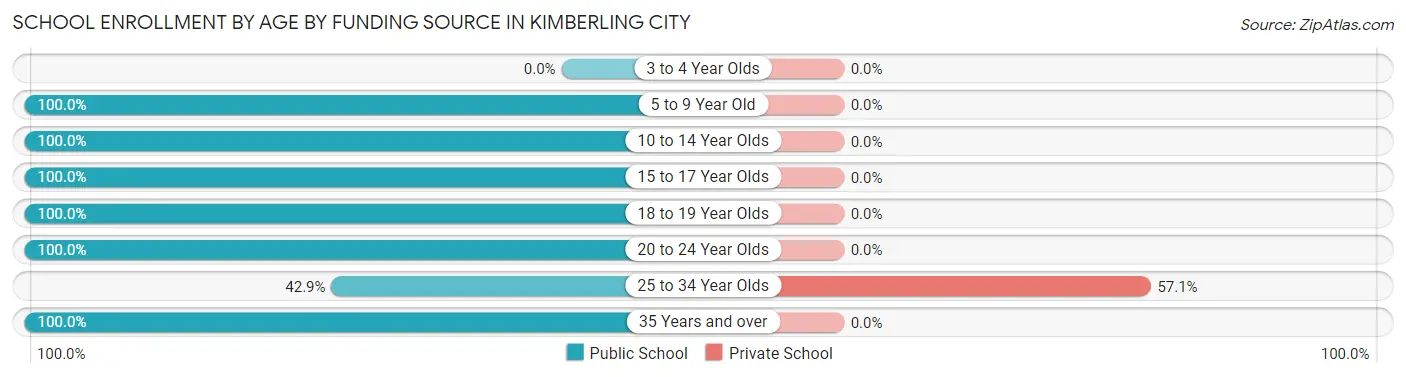
School Enrollment by Age by Funding Source in Kimberling City
Out of a total of 367 students who are enrolled in schools in Kimberling City, 12 (3.3%) attend a private institution, while the remaining 355 (96.7%) are enrolled in public schools. The age group of 25 to 34 year olds has the highest likelihood of being enrolled in private schools, with 12 (57.1% in the age bracket) enrolled. Conversely, the age group of 5 to 9 year old has the lowest likelihood of being enrolled in a private school, with 25 (100.0% in the age bracket) attending a public institution.
| Age Bracket | Public School | Private School |
| 3 to 4 Year Olds | 0 (0.0%) | 0 (0.0%) |
| 5 to 9 Year Old | 25 (100.0%) | 0 (0.0%) |
| 10 to 14 Year Olds | 143 (100.0%) | 0 (0.0%) |
| 15 to 17 Year Olds | 112 (100.0%) | 0 (0.0%) |
| 18 to 19 Year Olds | 31 (100.0%) | 0 (0.0%) |
| 20 to 24 Year Olds | 26 (100.0%) | 0 (0.0%) |
| 25 to 34 Year Olds | 9 (42.9%) | 12 (57.1%) |
| 35 Years and over | 9 (100.0%) | 0 (0.0%) |
| Total | 355 (96.7%) | 12 (3.3%) |
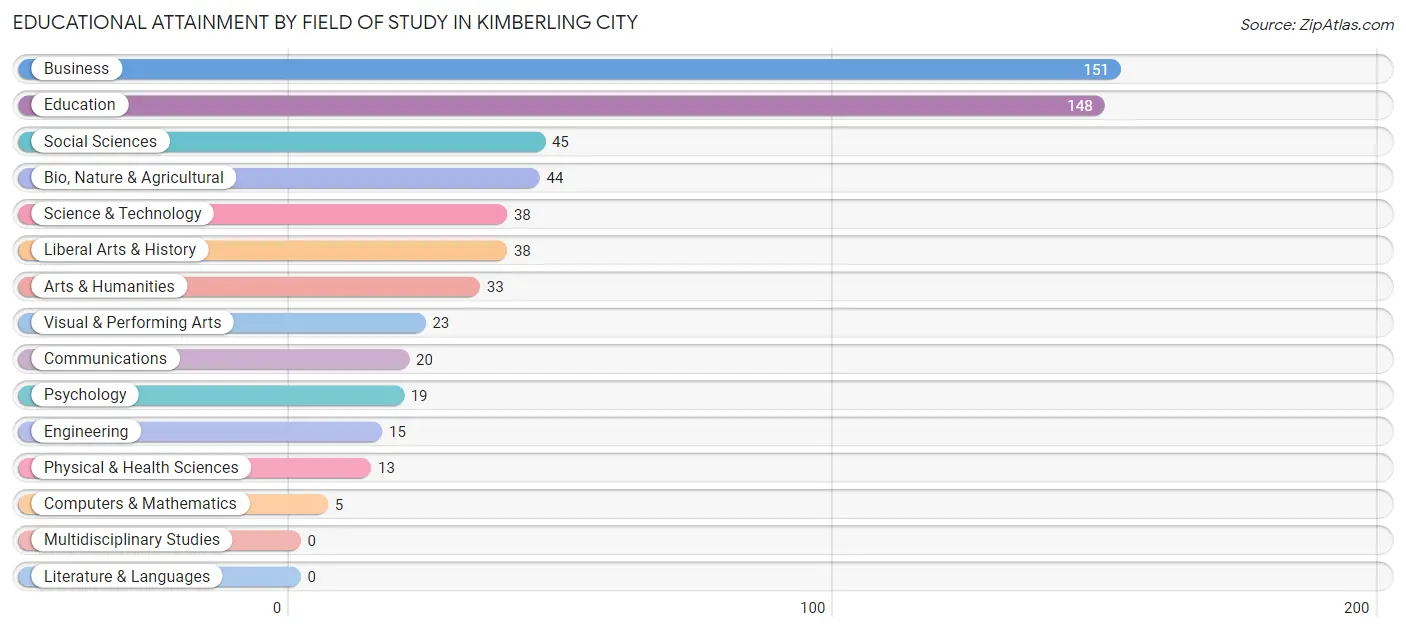
Educational Attainment by Field of Study in Kimberling City
Business (151 | 25.5%), education (148 | 25.0%), social sciences (45 | 7.6%), bio, nature & agricultural (44 | 7.4%), and science & technology (38 | 6.4%) are the most common fields of study among 592 individuals in Kimberling City who have obtained a bachelor's degree or higher.
| Field of Study | # Graduates | % Graduates |
| Computers & Mathematics | 5 | 0.8% |
| Bio, Nature & Agricultural | 44 | 7.4% |
| Physical & Health Sciences | 13 | 2.2% |
| Psychology | 19 | 3.2% |
| Social Sciences | 45 | 7.6% |
| Engineering | 15 | 2.5% |
| Multidisciplinary Studies | 0 | 0.0% |
| Science & Technology | 38 | 6.4% |
| Business | 151 | 25.5% |
| Education | 148 | 25.0% |
| Literature & Languages | 0 | 0.0% |
| Liberal Arts & History | 38 | 6.4% |
| Visual & Performing Arts | 23 | 3.9% |
| Communications | 20 | 3.4% |
| Arts & Humanities | 33 | 5.6% |
| Total | 592 | 100.0% |
Transportation & Commute in Kimberling City
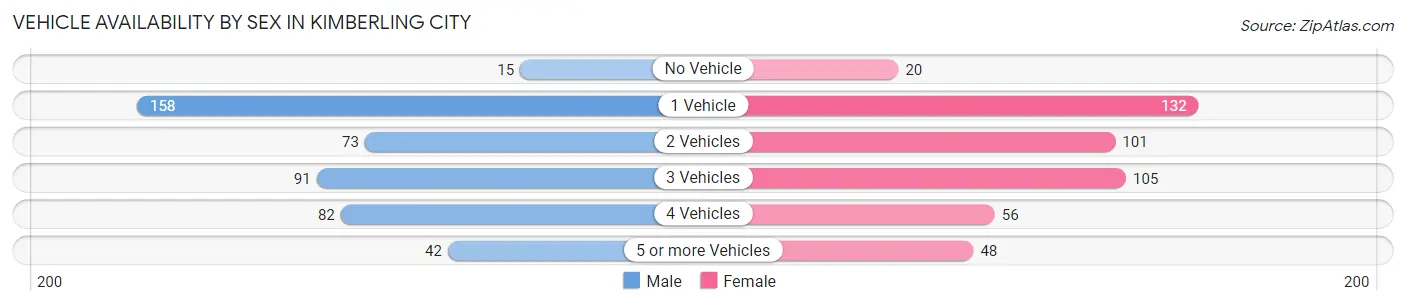
Vehicle Availability by Sex in Kimberling City
The most prevalent vehicle ownership categories in Kimberling City are males with 1 vehicle (158, accounting for 34.3%) and females with 1 vehicle (132, making up 34.2%).
| Vehicles Available | Male | Female |
| No Vehicle | 15 (3.3%) | 20 (4.3%) |
| 1 Vehicle | 158 (34.3%) | 132 (28.6%) |
| 2 Vehicles | 73 (15.8%) | 101 (21.9%) |
| 3 Vehicles | 91 (19.7%) | 105 (22.7%) |
| 4 Vehicles | 82 (17.8%) | 56 (12.1%) |
| 5 or more Vehicles | 42 (9.1%) | 48 (10.4%) |
| Total | 461 (100.0%) | 462 (100.0%) |
Commute Time in Kimberling City
The most frequently occuring commute durations in Kimberling City are 5 to 9 minutes (209 commuters, 24.3%), 20 to 24 minutes (185 commuters, 21.5%), and 30 to 34 minutes (101 commuters, 11.7%).
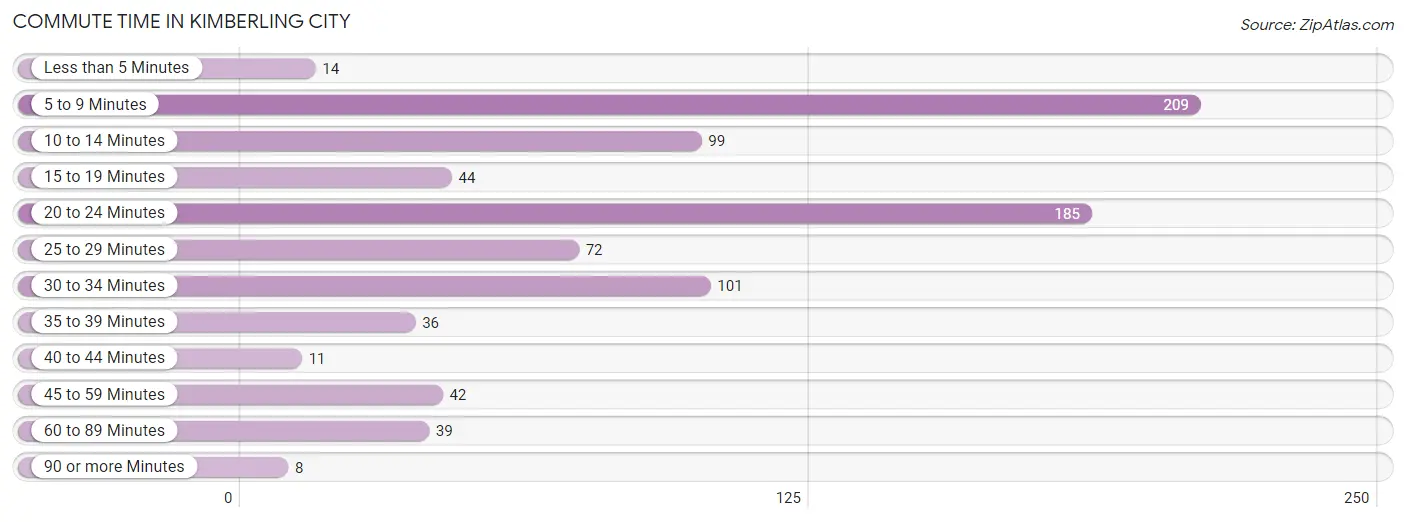
| Commute Time | # Commuters | % Commuters |
| Less than 5 Minutes | 14 | 1.6% |
| 5 to 9 Minutes | 209 | 24.3% |
| 10 to 14 Minutes | 99 | 11.5% |
| 15 to 19 Minutes | 44 | 5.1% |
| 20 to 24 Minutes | 185 | 21.5% |
| 25 to 29 Minutes | 72 | 8.4% |
| 30 to 34 Minutes | 101 | 11.7% |
| 35 to 39 Minutes | 36 | 4.2% |
| 40 to 44 Minutes | 11 | 1.3% |
| 45 to 59 Minutes | 42 | 4.9% |
| 60 to 89 Minutes | 39 | 4.5% |
| 90 or more Minutes | 8 | 0.9% |
Commute Time by Sex in Kimberling City
The most common commute times in Kimberling City are 5 to 9 minutes (134 commuters, 30.2%) for males and 20 to 24 minutes (106 commuters, 25.5%) for females.
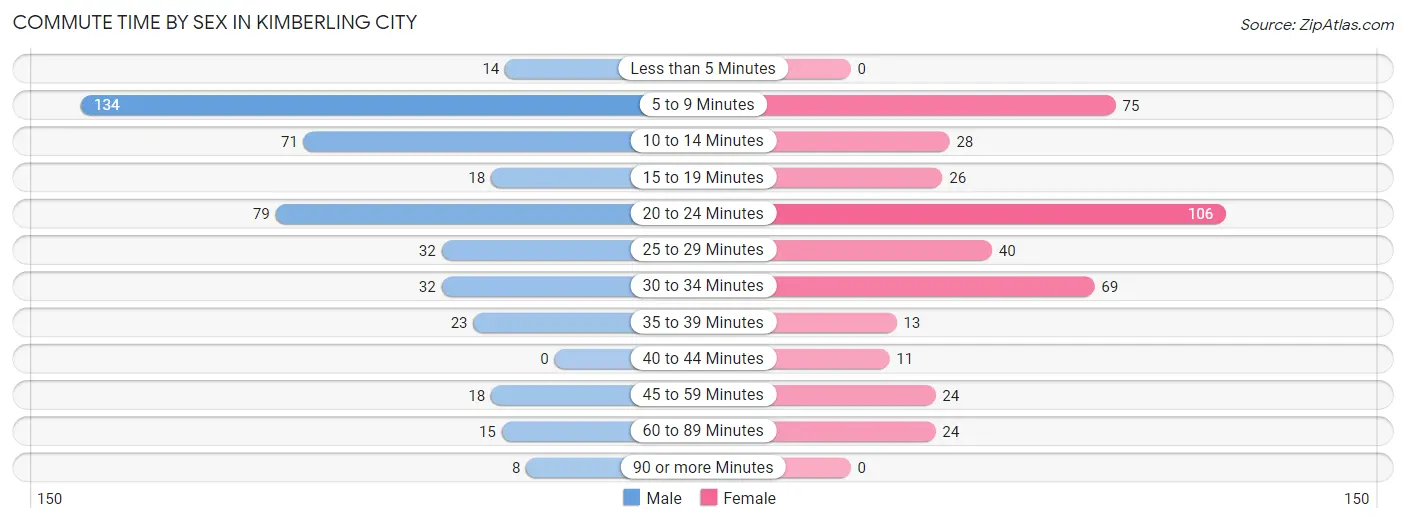
| Commute Time | Male | Female |
| Less than 5 Minutes | 14 (3.2%) | 0 (0.0%) |
| 5 to 9 Minutes | 134 (30.2%) | 75 (18.0%) |
| 10 to 14 Minutes | 71 (16.0%) | 28 (6.7%) |
| 15 to 19 Minutes | 18 (4.1%) | 26 (6.2%) |
| 20 to 24 Minutes | 79 (17.8%) | 106 (25.5%) |
| 25 to 29 Minutes | 32 (7.2%) | 40 (9.6%) |
| 30 to 34 Minutes | 32 (7.2%) | 69 (16.6%) |
| 35 to 39 Minutes | 23 (5.2%) | 13 (3.1%) |
| 40 to 44 Minutes | 0 (0.0%) | 11 (2.6%) |
| 45 to 59 Minutes | 18 (4.1%) | 24 (5.8%) |
| 60 to 89 Minutes | 15 (3.4%) | 24 (5.8%) |
| 90 or more Minutes | 8 (1.8%) | 0 (0.0%) |
Time of Departure to Work by Sex in Kimberling City
The most frequent times of departure to work in Kimberling City are 7:30 AM to 7:59 AM (72, 16.2%) for males and 7:30 AM to 7:59 AM (86, 20.7%) for females.
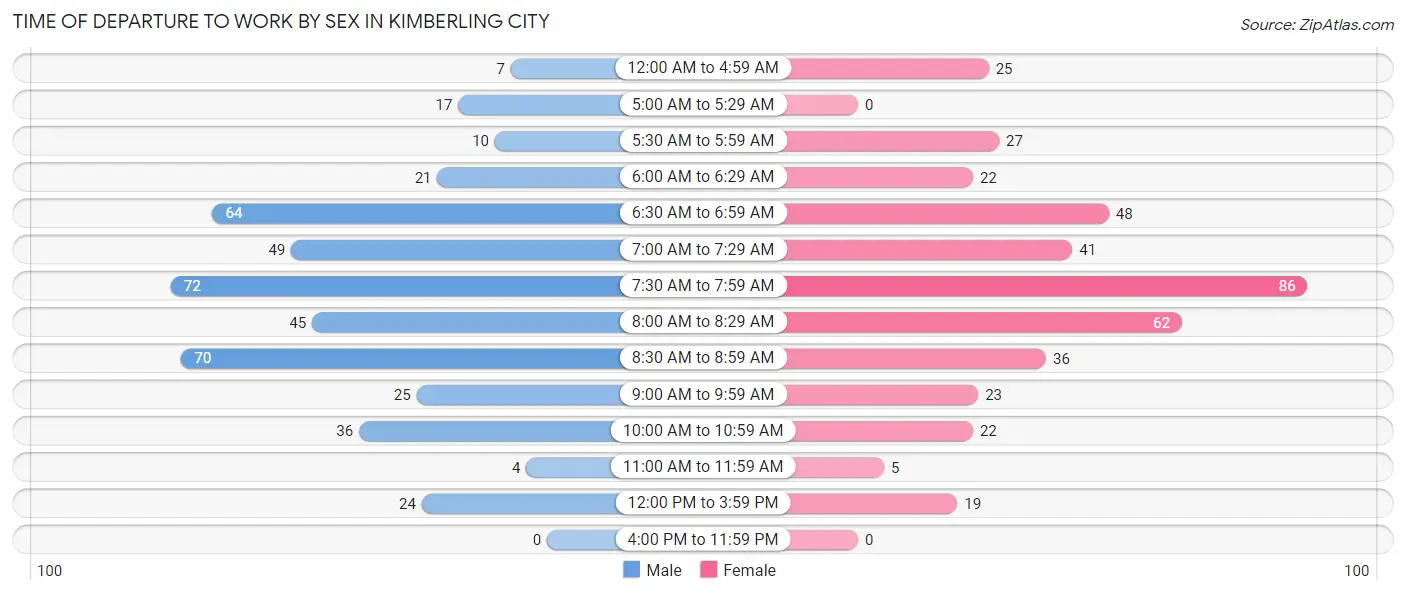
| Time of Departure | Male | Female |
| 12:00 AM to 4:59 AM | 7 (1.6%) | 25 (6.0%) |
| 5:00 AM to 5:29 AM | 17 (3.8%) | 0 (0.0%) |
| 5:30 AM to 5:59 AM | 10 (2.2%) | 27 (6.5%) |
| 6:00 AM to 6:29 AM | 21 (4.7%) | 22 (5.3%) |
| 6:30 AM to 6:59 AM | 64 (14.4%) | 48 (11.5%) |
| 7:00 AM to 7:29 AM | 49 (11.0%) | 41 (9.9%) |
| 7:30 AM to 7:59 AM | 72 (16.2%) | 86 (20.7%) |
| 8:00 AM to 8:29 AM | 45 (10.1%) | 62 (14.9%) |
| 8:30 AM to 8:59 AM | 70 (15.8%) | 36 (8.6%) |
| 9:00 AM to 9:59 AM | 25 (5.6%) | 23 (5.5%) |
| 10:00 AM to 10:59 AM | 36 (8.1%) | 22 (5.3%) |
| 11:00 AM to 11:59 AM | 4 (0.9%) | 5 (1.2%) |
| 12:00 PM to 3:59 PM | 24 (5.4%) | 19 (4.6%) |
| 4:00 PM to 11:59 PM | 0 (0.0%) | 0 (0.0%) |
| Total | 444 (100.0%) | 416 (100.0%) |
Housing Occupancy in Kimberling City
Occupancy by Ownership in Kimberling City
Of the total 1,183 dwellings in Kimberling City, owner-occupied units account for 898 (75.9%), while renter-occupied units make up 285 (24.1%).
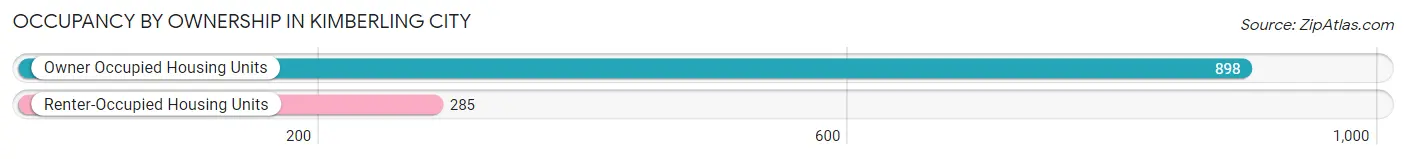
| Occupancy | # Housing Units | % Housing Units |
| Owner Occupied Housing Units | 898 | 75.9% |
| Renter-Occupied Housing Units | 285 | 24.1% |
| Total Occupied Housing Units | 1,183 | 100.0% |
Occupancy by Household Size in Kimberling City
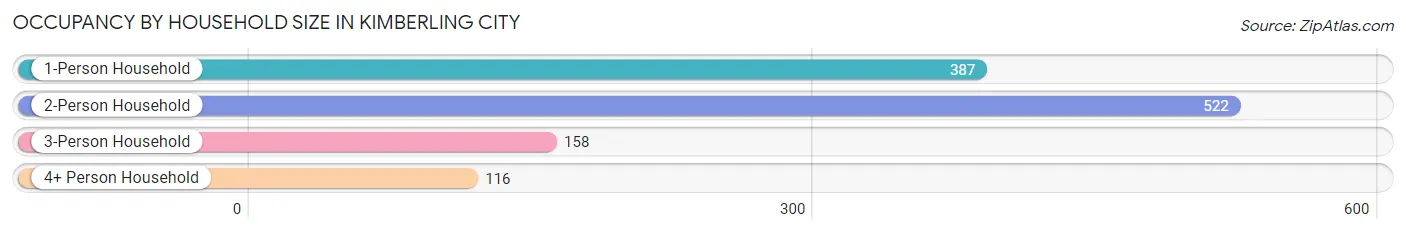
| Household Size | # Housing Units | % Housing Units |
| 1-Person Household | 387 | 32.7% |
| 2-Person Household | 522 | 44.1% |
| 3-Person Household | 158 | 13.4% |
| 4+ Person Household | 116 | 9.8% |
| Total Housing Units | 1,183 | 100.0% |
Occupancy by Ownership by Household Size in Kimberling City
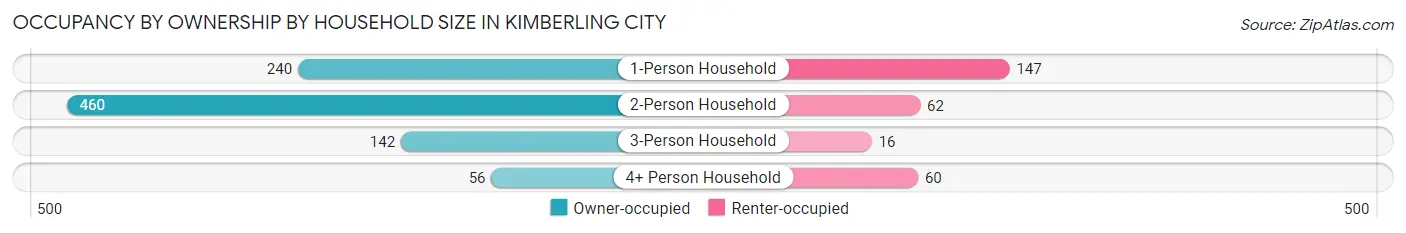
| Household Size | Owner-occupied | Renter-occupied |
| 1-Person Household | 240 (62.0%) | 147 (38.0%) |
| 2-Person Household | 460 (88.1%) | 62 (11.9%) |
| 3-Person Household | 142 (89.9%) | 16 (10.1%) |
| 4+ Person Household | 56 (48.3%) | 60 (51.7%) |
| Total Housing Units | 898 (75.9%) | 285 (24.1%) |
Occupancy by Educational Attainment in Kimberling City
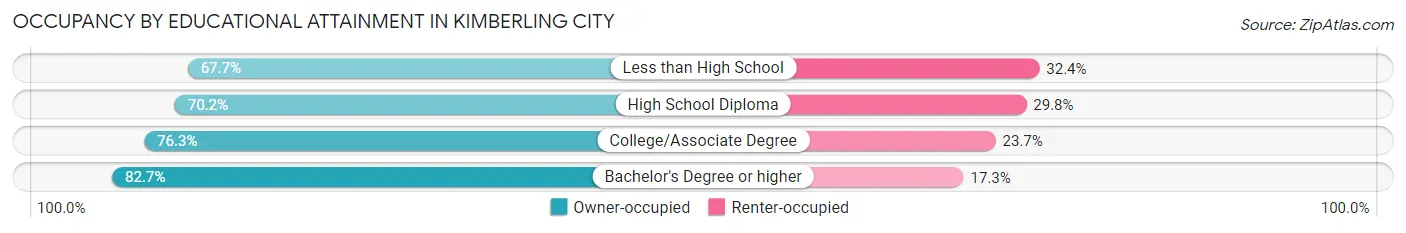
| Household Size | Owner-occupied | Renter-occupied |
| Less than High School | 46 (67.6%) | 22 (32.4%) |
| High School Diploma | 224 (70.2%) | 95 (29.8%) |
| College/Associate Degree | 361 (76.3%) | 112 (23.7%) |
| Bachelor's Degree or higher | 267 (82.7%) | 56 (17.3%) |
Occupancy by Age of Householder in Kimberling City
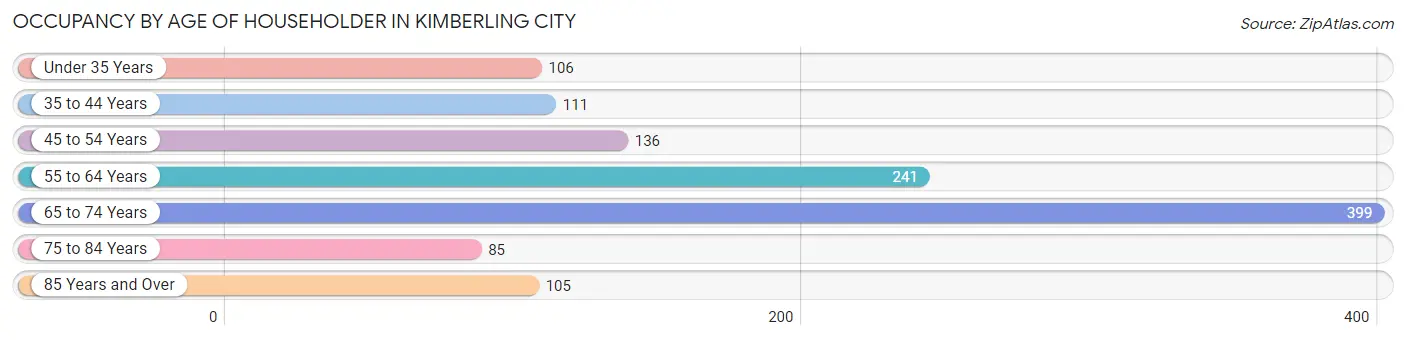
| Age Bracket | # Households | % Households |
| Under 35 Years | 106 | 9.0% |
| 35 to 44 Years | 111 | 9.4% |
| 45 to 54 Years | 136 | 11.5% |
| 55 to 64 Years | 241 | 20.4% |
| 65 to 74 Years | 399 | 33.7% |
| 75 to 84 Years | 85 | 7.2% |
| 85 Years and Over | 105 | 8.9% |
| Total | 1,183 | 100.0% |
Housing Finances in Kimberling City
Median Income by Occupancy in Kimberling City
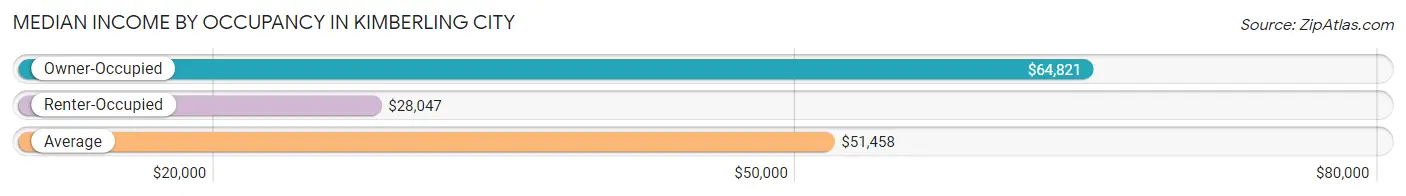
| Occupancy Type | # Households | Median Income |
| Owner-Occupied | 898 (75.9%) | $64,821 |
| Renter-Occupied | 285 (24.1%) | $28,047 |
| Average | 1,183 (100.0%) | $51,458 |
Occupancy by Householder Income Bracket in Kimberling City
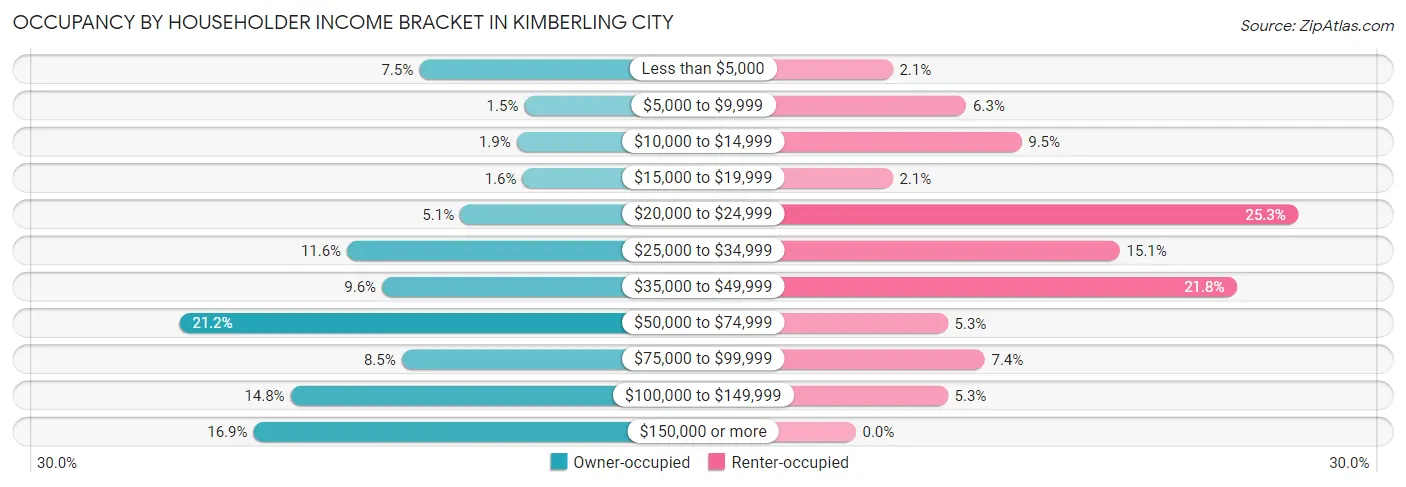
| Income Bracket | Owner-occupied | Renter-occupied |
| Less than $5,000 | 67 (7.5%) | 6 (2.1%) |
| $5,000 to $9,999 | 13 (1.5%) | 18 (6.3%) |
| $10,000 to $14,999 | 17 (1.9%) | 27 (9.5%) |
| $15,000 to $19,999 | 14 (1.6%) | 6 (2.1%) |
| $20,000 to $24,999 | 46 (5.1%) | 72 (25.3%) |
| $25,000 to $34,999 | 104 (11.6%) | 43 (15.1%) |
| $35,000 to $49,999 | 86 (9.6%) | 62 (21.7%) |
| $50,000 to $74,999 | 190 (21.2%) | 15 (5.3%) |
| $75,000 to $99,999 | 76 (8.5%) | 21 (7.4%) |
| $100,000 to $149,999 | 133 (14.8%) | 15 (5.3%) |
| $150,000 or more | 152 (16.9%) | 0 (0.0%) |
| Total | 898 (100.0%) | 285 (100.0%) |
Monthly Housing Cost Tiers in Kimberling City
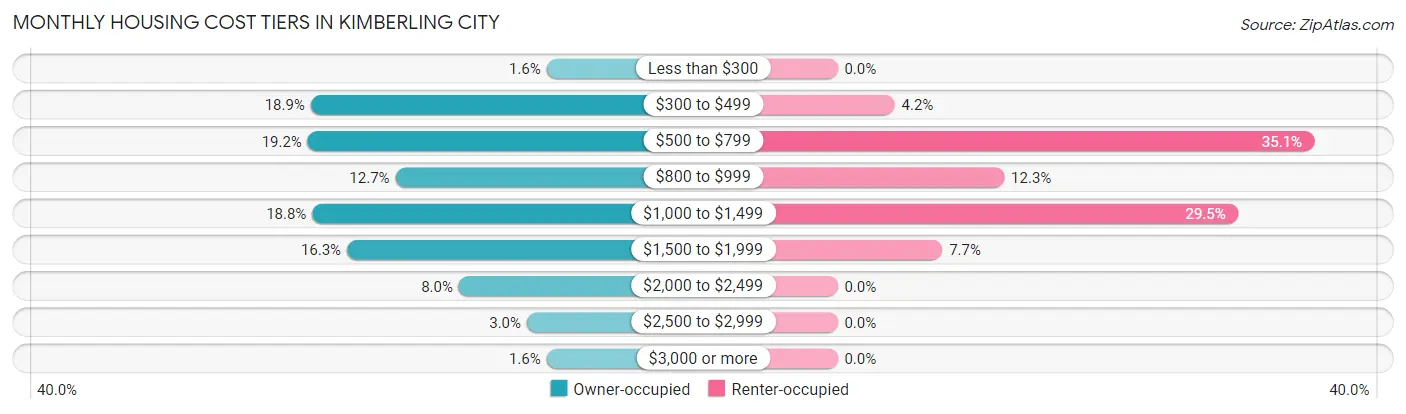
| Monthly Cost | Owner-occupied | Renter-occupied |
| Less than $300 | 14 (1.6%) | 0 (0.0%) |
| $300 to $499 | 170 (18.9%) | 12 (4.2%) |
| $500 to $799 | 172 (19.2%) | 100 (35.1%) |
| $800 to $999 | 114 (12.7%) | 35 (12.3%) |
| $1,000 to $1,499 | 169 (18.8%) | 84 (29.5%) |
| $1,500 to $1,999 | 146 (16.3%) | 22 (7.7%) |
| $2,000 to $2,499 | 72 (8.0%) | 0 (0.0%) |
| $2,500 to $2,999 | 27 (3.0%) | 0 (0.0%) |
| $3,000 or more | 14 (1.6%) | 0 (0.0%) |
| Total | 898 (100.0%) | 285 (100.0%) |
Physical Housing Characteristics in Kimberling City
Housing Structures in Kimberling City
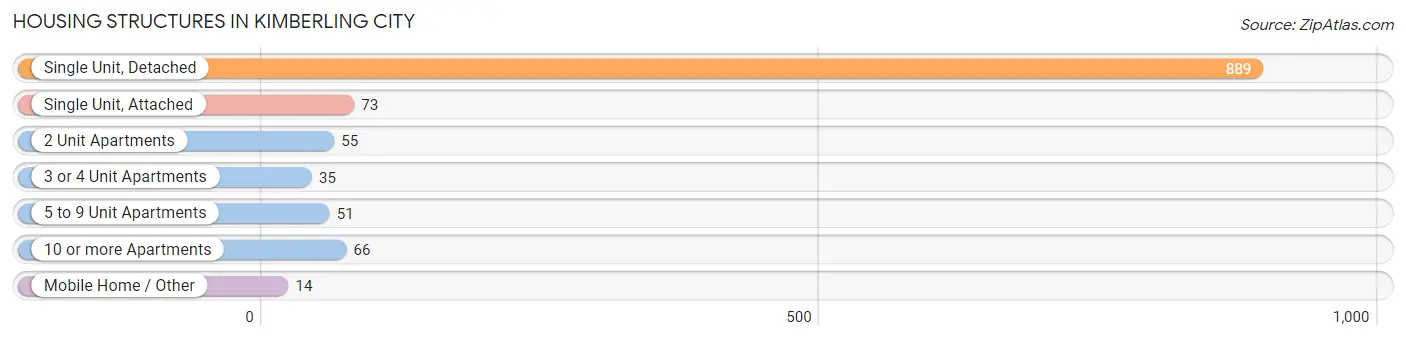
| Structure Type | # Housing Units | % Housing Units |
| Single Unit, Detached | 889 | 75.1% |
| Single Unit, Attached | 73 | 6.2% |
| 2 Unit Apartments | 55 | 4.6% |
| 3 or 4 Unit Apartments | 35 | 3.0% |
| 5 to 9 Unit Apartments | 51 | 4.3% |
| 10 or more Apartments | 66 | 5.6% |
| Mobile Home / Other | 14 | 1.2% |
| Total | 1,183 | 100.0% |
Housing Structures by Occupancy in Kimberling City
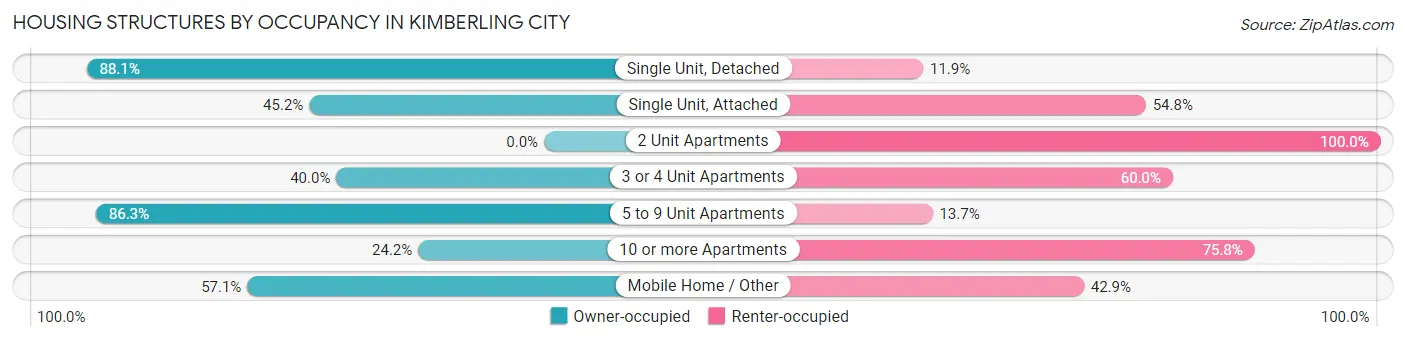
| Structure Type | Owner-occupied | Renter-occupied |
| Single Unit, Detached | 783 (88.1%) | 106 (11.9%) |
| Single Unit, Attached | 33 (45.2%) | 40 (54.8%) |
| 2 Unit Apartments | 0 (0.0%) | 55 (100.0%) |
| 3 or 4 Unit Apartments | 14 (40.0%) | 21 (60.0%) |
| 5 to 9 Unit Apartments | 44 (86.3%) | 7 (13.7%) |
| 10 or more Apartments | 16 (24.2%) | 50 (75.8%) |
| Mobile Home / Other | 8 (57.1%) | 6 (42.9%) |
| Total | 898 (75.9%) | 285 (24.1%) |
Housing Structures by Number of Rooms in Kimberling City
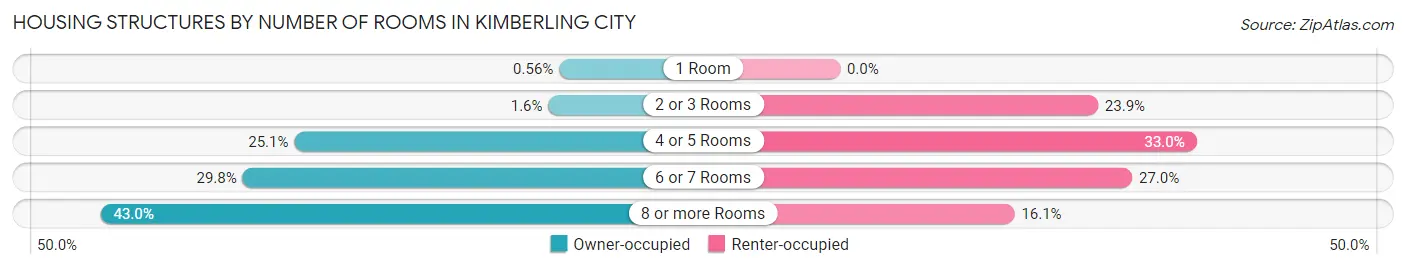
| Number of Rooms | Owner-occupied | Renter-occupied |
| 1 Room | 5 (0.6%) | 0 (0.0%) |
| 2 or 3 Rooms | 14 (1.6%) | 68 (23.9%) |
| 4 or 5 Rooms | 225 (25.1%) | 94 (33.0%) |
| 6 or 7 Rooms | 268 (29.8%) | 77 (27.0%) |
| 8 or more Rooms | 386 (43.0%) | 46 (16.1%) |
| Total | 898 (100.0%) | 285 (100.0%) |
Housing Structure by Heating Type in Kimberling City
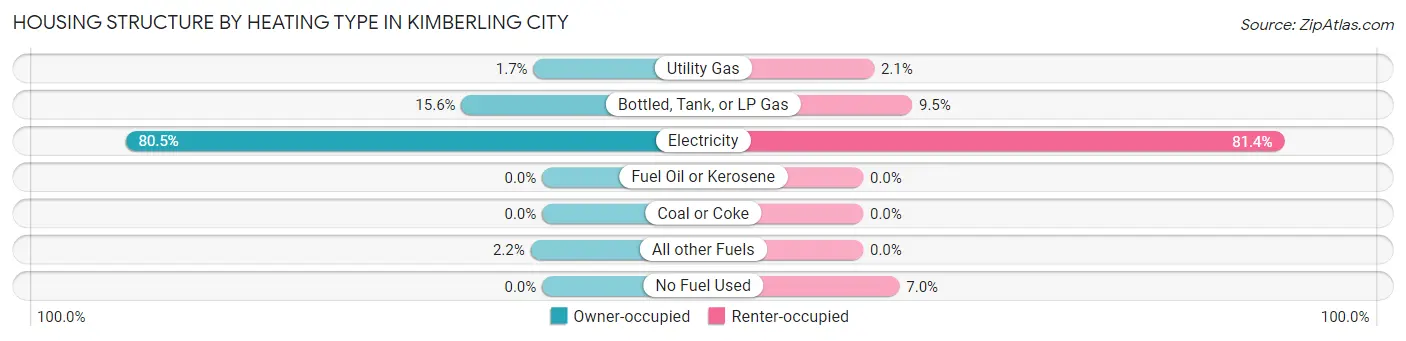
| Heating Type | Owner-occupied | Renter-occupied |
| Utility Gas | 15 (1.7%) | 6 (2.1%) |
| Bottled, Tank, or LP Gas | 140 (15.6%) | 27 (9.5%) |
| Electricity | 723 (80.5%) | 232 (81.4%) |
| Fuel Oil or Kerosene | 0 (0.0%) | 0 (0.0%) |
| Coal or Coke | 0 (0.0%) | 0 (0.0%) |
| All other Fuels | 20 (2.2%) | 0 (0.0%) |
| No Fuel Used | 0 (0.0%) | 20 (7.0%) |
| Total | 898 (100.0%) | 285 (100.0%) |
Household Vehicle Usage in Kimberling City
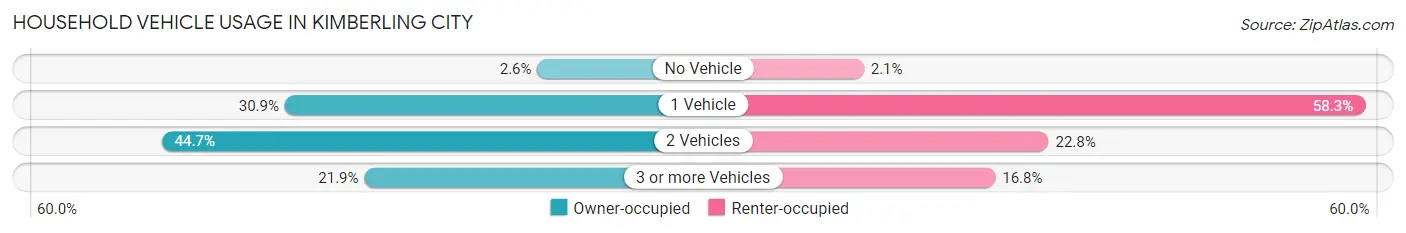
| Vehicles per Household | Owner-occupied | Renter-occupied |
| No Vehicle | 23 (2.6%) | 6 (2.1%) |
| 1 Vehicle | 277 (30.8%) | 166 (58.3%) |
| 2 Vehicles | 401 (44.7%) | 65 (22.8%) |
| 3 or more Vehicles | 197 (21.9%) | 48 (16.8%) |
| Total | 898 (100.0%) | 285 (100.0%) |
Real Estate & Mortgages in Kimberling City
Real Estate and Mortgage Overview in Kimberling City
| Characteristic | Without Mortgage | With Mortgage |
| Housing Units | 360 | 538 |
| Median Property Value | $235,300 | $196,900 |
| Median Household Income | $62,679 | $114 |
| Monthly Housing Costs | $500 | $14 |
| Real Estate Taxes | $1,185 | $1 |
Property Value by Mortgage Status in Kimberling City
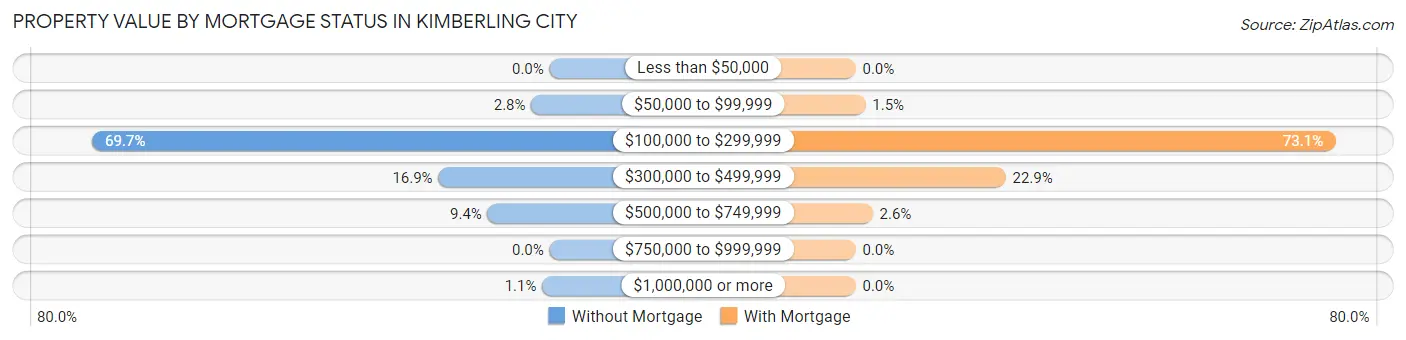
| Property Value | Without Mortgage | With Mortgage |
| Less than $50,000 | 0 (0.0%) | 0 (0.0%) |
| $50,000 to $99,999 | 10 (2.8%) | 8 (1.5%) |
| $100,000 to $299,999 | 251 (69.7%) | 393 (73.1%) |
| $300,000 to $499,999 | 61 (16.9%) | 123 (22.9%) |
| $500,000 to $749,999 | 34 (9.4%) | 14 (2.6%) |
| $750,000 to $999,999 | 0 (0.0%) | 0 (0.0%) |
| $1,000,000 or more | 4 (1.1%) | 0 (0.0%) |
| Total | 360 (100.0%) | 538 (100.0%) |
Household Income by Mortgage Status in Kimberling City
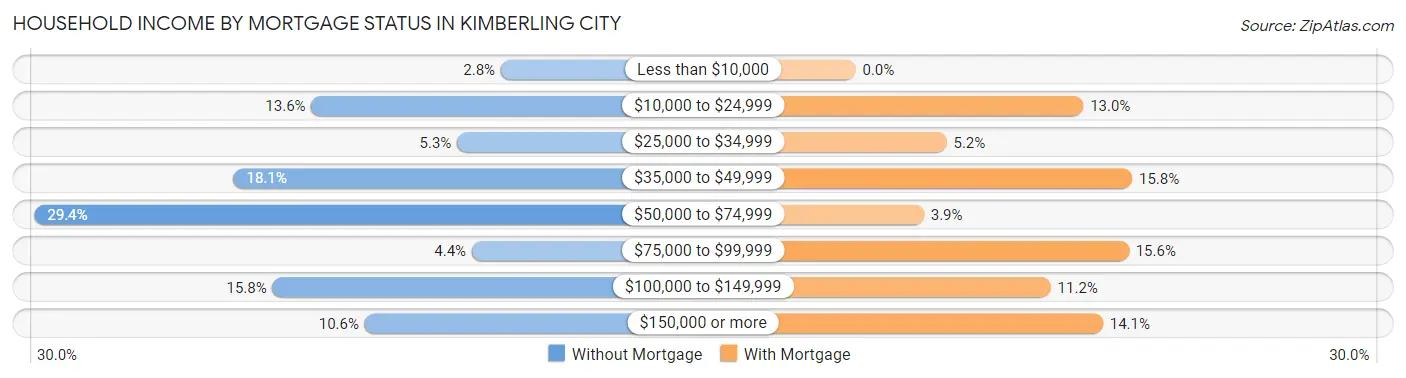
| Household Income | Without Mortgage | With Mortgage |
| Less than $10,000 | 10 (2.8%) | 0 (0.0%) |
| $10,000 to $24,999 | 49 (13.6%) | 70 (13.0%) |
| $25,000 to $34,999 | 19 (5.3%) | 28 (5.2%) |
| $35,000 to $49,999 | 65 (18.1%) | 85 (15.8%) |
| $50,000 to $74,999 | 106 (29.4%) | 21 (3.9%) |
| $75,000 to $99,999 | 16 (4.4%) | 84 (15.6%) |
| $100,000 to $149,999 | 57 (15.8%) | 60 (11.2%) |
| $150,000 or more | 38 (10.6%) | 76 (14.1%) |
| Total | 360 (100.0%) | 538 (100.0%) |
Property Value to Household Income Ratio in Kimberling City
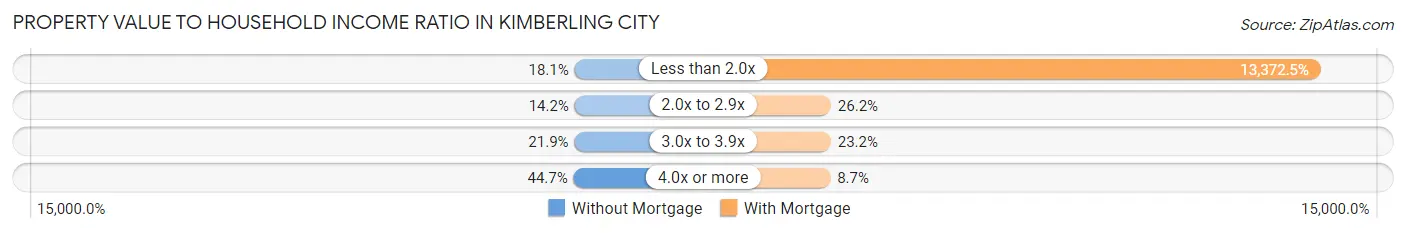
| Value-to-Income Ratio | Without Mortgage | With Mortgage |
| Less than 2.0x | 65 (18.1%) | 71,944 (13,372.5%) |
| 2.0x to 2.9x | 51 (14.2%) | 141 (26.2%) |
| 3.0x to 3.9x | 79 (21.9%) | 125 (23.2%) |
| 4.0x or more | 161 (44.7%) | 47 (8.7%) |
| Total | 360 (100.0%) | 538 (100.0%) |
Real Estate Taxes by Mortgage Status in Kimberling City
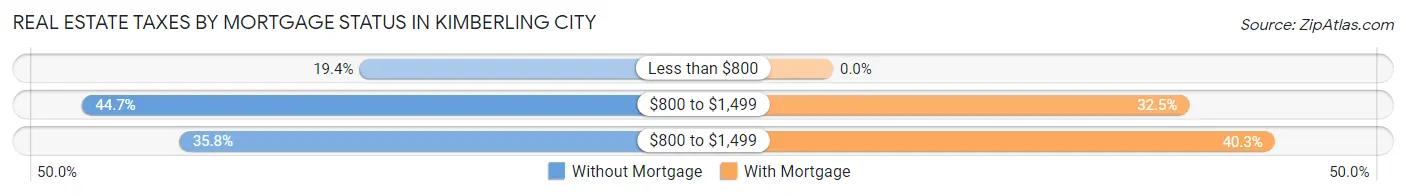
| Property Taxes | Without Mortgage | With Mortgage |
| Less than $800 | 70 (19.4%) | 0 (0.0%) |
| $800 to $1,499 | 161 (44.7%) | 175 (32.5%) |
| $800 to $1,499 | 129 (35.8%) | 217 (40.3%) |
| Total | 360 (100.0%) | 538 (100.0%) |
Health & Disability in Kimberling City
Health Insurance Coverage by Age in Kimberling City
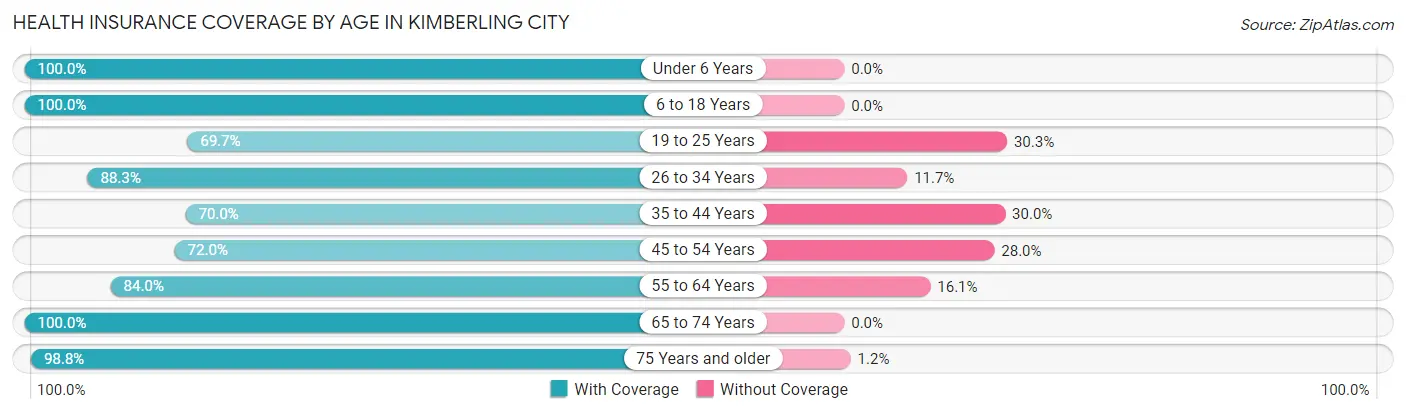
| Age Bracket | With Coverage | Without Coverage |
| Under 6 Years | 71 (100.0%) | 0 (0.0%) |
| 6 to 18 Years | 314 (100.0%) | 0 (0.0%) |
| 19 to 25 Years | 62 (69.7%) | 27 (30.3%) |
| 26 to 34 Years | 173 (88.3%) | 23 (11.7%) |
| 35 to 44 Years | 168 (70.0%) | 72 (30.0%) |
| 45 to 54 Years | 193 (72.0%) | 75 (28.0%) |
| 55 to 64 Years | 408 (84.0%) | 78 (16.1%) |
| 65 to 74 Years | 625 (100.0%) | 0 (0.0%) |
| 75 Years and older | 332 (98.8%) | 4 (1.2%) |
| Total | 2,346 (89.4%) | 279 (10.6%) |
Health Insurance Coverage by Citizenship Status in Kimberling City
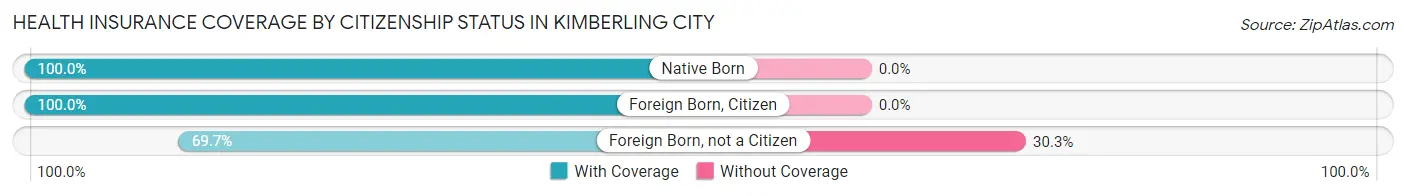
| Citizenship Status | With Coverage | Without Coverage |
| Native Born | 71 (100.0%) | 0 (0.0%) |
| Foreign Born, Citizen | 314 (100.0%) | 0 (0.0%) |
| Foreign Born, not a Citizen | 62 (69.7%) | 27 (30.3%) |
Health Insurance Coverage by Household Income in Kimberling City
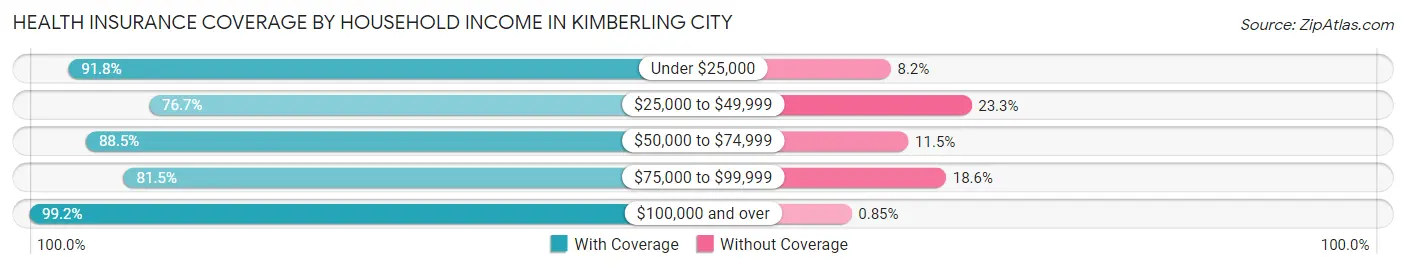
| Household Income | With Coverage | Without Coverage |
| Under $25,000 | 414 (91.8%) | 37 (8.2%) |
| $25,000 to $49,999 | 391 (76.7%) | 119 (23.3%) |
| $50,000 to $74,999 | 500 (88.5%) | 65 (11.5%) |
| $75,000 to $99,999 | 224 (81.5%) | 51 (18.5%) |
| $100,000 and over | 817 (99.2%) | 7 (0.9%) |
Public vs Private Health Insurance Coverage by Age in Kimberling City
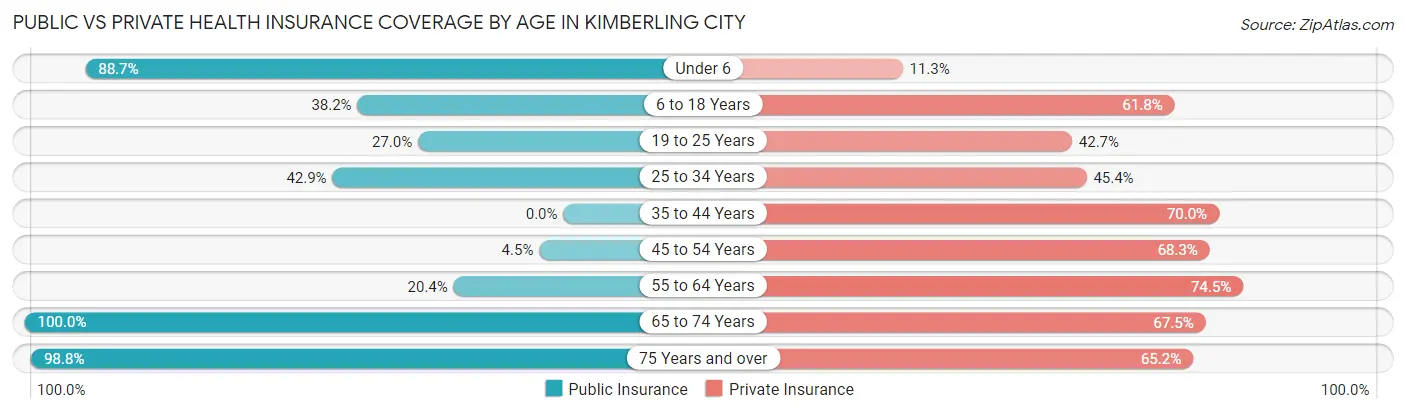
| Age Bracket | Public Insurance | Private Insurance |
| Under 6 | 63 (88.7%) | 8 (11.3%) |
| 6 to 18 Years | 120 (38.2%) | 194 (61.8%) |
| 19 to 25 Years | 24 (27.0%) | 38 (42.7%) |
| 25 to 34 Years | 84 (42.9%) | 89 (45.4%) |
| 35 to 44 Years | 0 (0.0%) | 168 (70.0%) |
| 45 to 54 Years | 12 (4.5%) | 183 (68.3%) |
| 55 to 64 Years | 99 (20.4%) | 362 (74.5%) |
| 65 to 74 Years | 625 (100.0%) | 422 (67.5%) |
| 75 Years and over | 332 (98.8%) | 219 (65.2%) |
| Total | 1,359 (51.8%) | 1,683 (64.1%) |
Disability Status by Sex by Age in Kimberling City
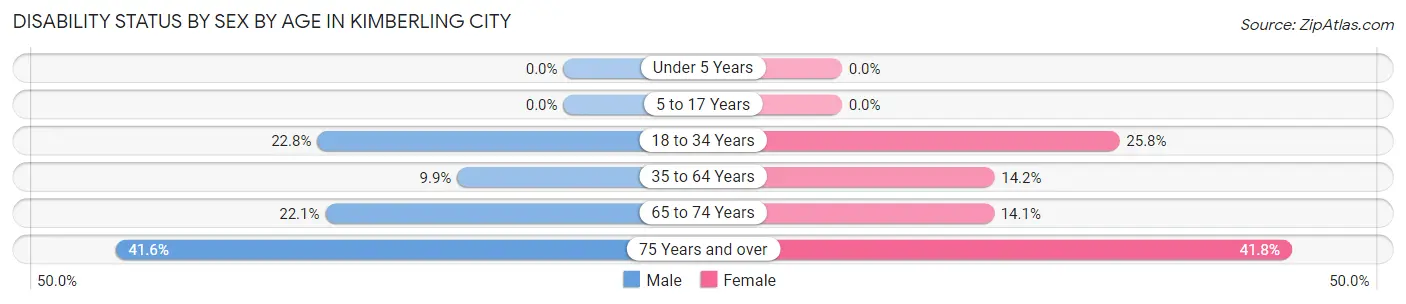
| Age Bracket | Male | Female |
| Under 5 Years | 0 (0.0%) | 0 (0.0%) |
| 5 to 17 Years | 0 (0.0%) | 0 (0.0%) |
| 18 to 34 Years | 45 (22.8%) | 34 (25.8%) |
| 35 to 64 Years | 45 (9.9%) | 76 (14.1%) |
| 65 to 74 Years | 55 (22.1%) | 53 (14.1%) |
| 75 Years and over | 64 (41.6%) | 76 (41.8%) |
Disability Class by Sex by Age in Kimberling City
Disability Class: Hearing Difficulty
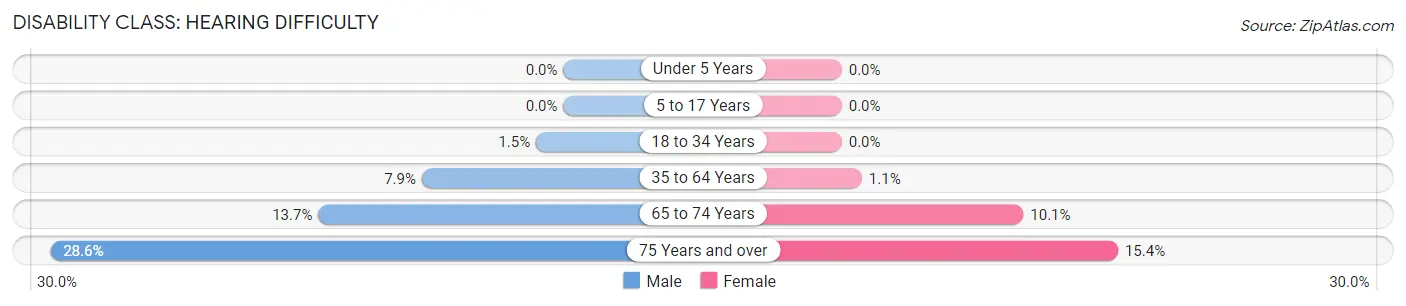
| Age Bracket | Male | Female |
| Under 5 Years | 0 (0.0%) | 0 (0.0%) |
| 5 to 17 Years | 0 (0.0%) | 0 (0.0%) |
| 18 to 34 Years | 3 (1.5%) | 0 (0.0%) |
| 35 to 64 Years | 36 (7.9%) | 6 (1.1%) |
| 65 to 74 Years | 34 (13.7%) | 38 (10.1%) |
| 75 Years and over | 44 (28.6%) | 28 (15.4%) |
Disability Class: Vision Difficulty
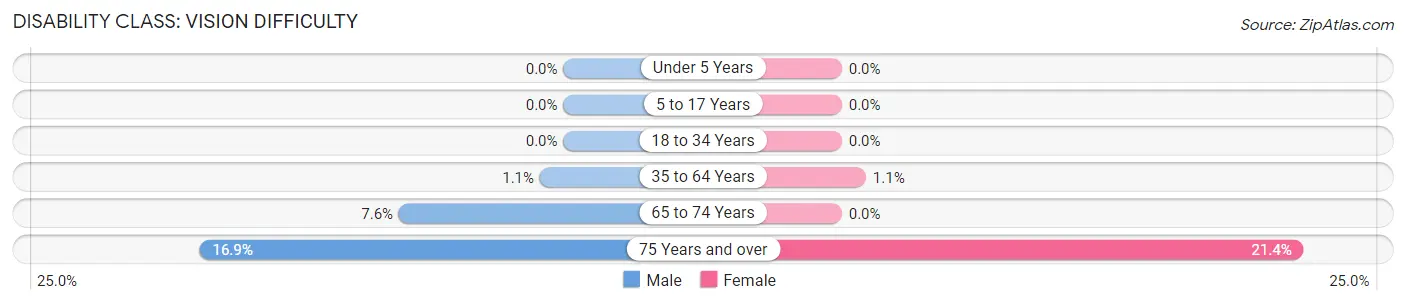
| Age Bracket | Male | Female |
| Under 5 Years | 0 (0.0%) | 0 (0.0%) |
| 5 to 17 Years | 0 (0.0%) | 0 (0.0%) |
| 18 to 34 Years | 0 (0.0%) | 0 (0.0%) |
| 35 to 64 Years | 5 (1.1%) | 6 (1.1%) |
| 65 to 74 Years | 19 (7.6%) | 0 (0.0%) |
| 75 Years and over | 26 (16.9%) | 39 (21.4%) |
Disability Class: Cognitive Difficulty
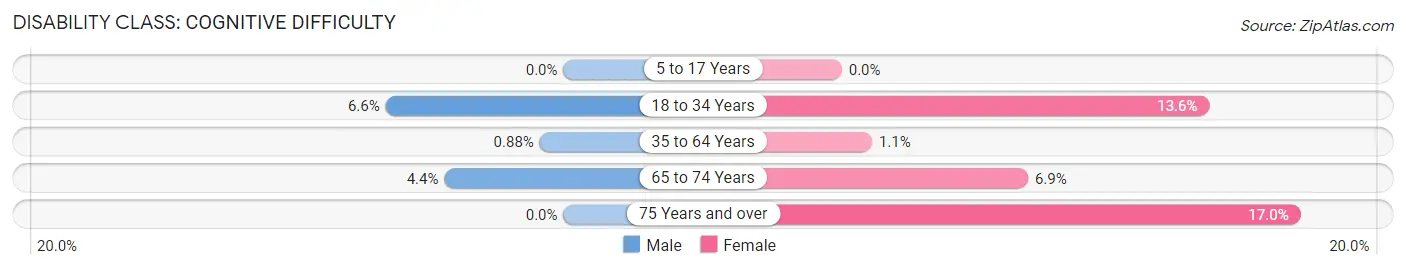
| Age Bracket | Male | Female |
| 5 to 17 Years | 0 (0.0%) | 0 (0.0%) |
| 18 to 34 Years | 13 (6.6%) | 18 (13.6%) |
| 35 to 64 Years | 4 (0.9%) | 6 (1.1%) |
| 65 to 74 Years | 11 (4.4%) | 26 (6.9%) |
| 75 Years and over | 0 (0.0%) | 31 (17.0%) |
Disability Class: Ambulatory Difficulty
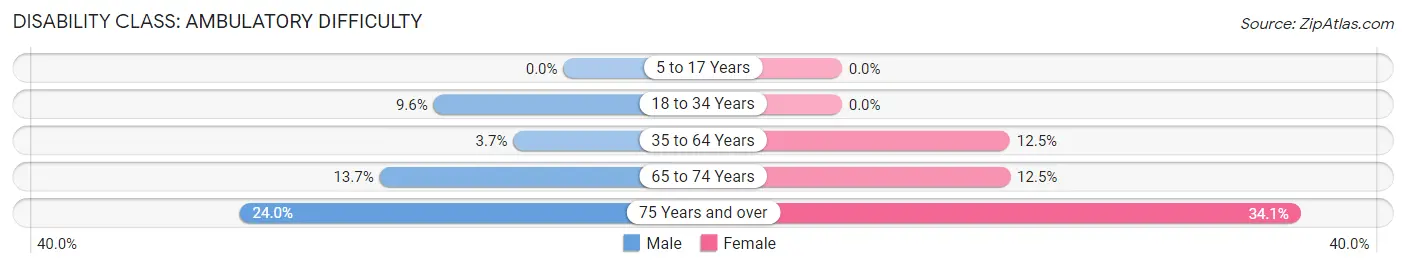
| Age Bracket | Male | Female |
| 5 to 17 Years | 0 (0.0%) | 0 (0.0%) |
| 18 to 34 Years | 19 (9.6%) | 0 (0.0%) |
| 35 to 64 Years | 17 (3.7%) | 67 (12.5%) |
| 65 to 74 Years | 34 (13.7%) | 47 (12.5%) |
| 75 Years and over | 37 (24.0%) | 62 (34.1%) |
Disability Class: Self-Care Difficulty
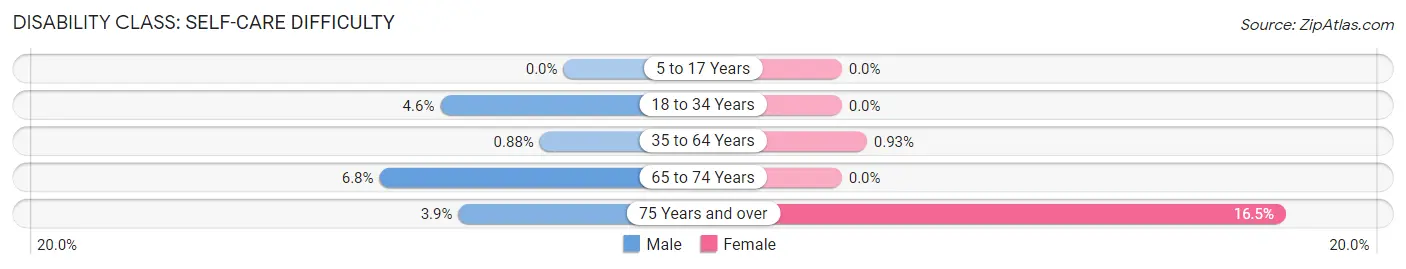
| Age Bracket | Male | Female |
| 5 to 17 Years | 0 (0.0%) | 0 (0.0%) |
| 18 to 34 Years | 9 (4.6%) | 0 (0.0%) |
| 35 to 64 Years | 4 (0.9%) | 5 (0.9%) |
| 65 to 74 Years | 17 (6.8%) | 0 (0.0%) |
| 75 Years and over | 6 (3.9%) | 30 (16.5%) |
Technology Access in Kimberling City
Computing Device Access in Kimberling City
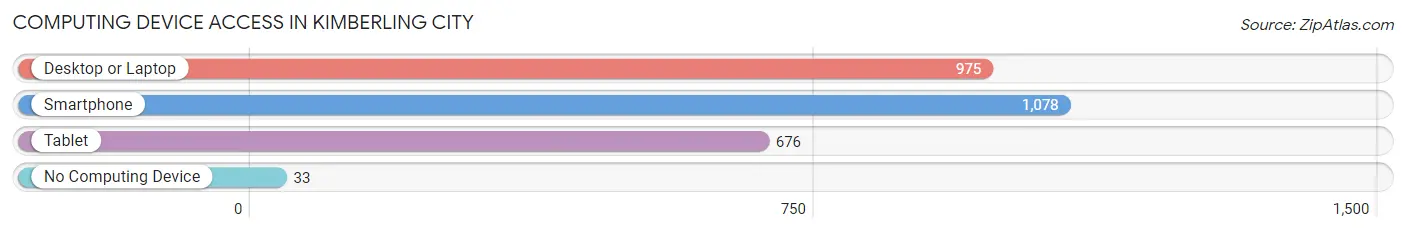
| Device Type | # Households | % Households |
| Desktop or Laptop | 975 | 82.4% |
| Smartphone | 1,078 | 91.1% |
| Tablet | 676 | 57.1% |
| No Computing Device | 33 | 2.8% |
| Total | 1,183 | 100.0% |
Internet Access in Kimberling City
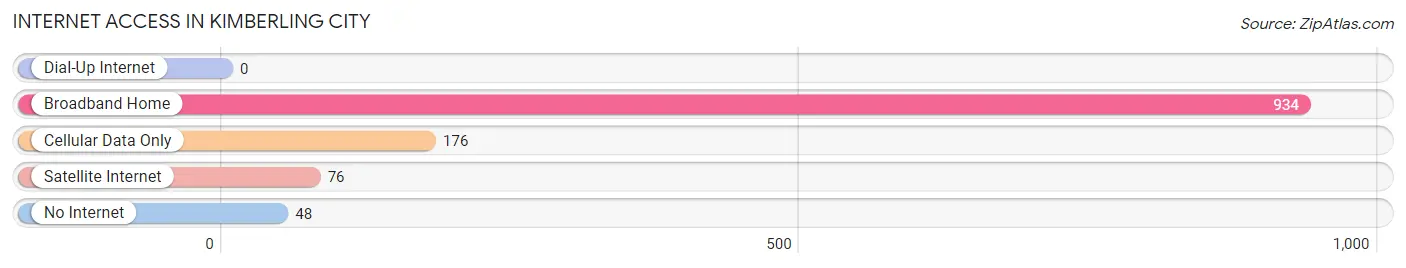
| Internet Type | # Households | % Households |
| Dial-Up Internet | 0 | 0.0% |
| Broadband Home | 934 | 78.9% |
| Cellular Data Only | 176 | 14.9% |
| Satellite Internet | 76 | 6.4% |
| No Internet | 48 | 4.1% |
| Total | 1,183 | 100.0% |
Kimberling City Summary
Kimberling City is a small city located in Stone County, Missouri. It is situated on the shores of Table Rock Lake, a popular destination for tourists and locals alike. The city has a population of approximately 1,500 people and is part of the Branson, Missouri metropolitan area.
History
Kimberling City was founded in the late 1800s by a group of settlers from the nearby town of Kimberling. The settlers were looking for a place to settle and build a new community. The town was named after the original settlers, and the name was later changed to Kimberling City.
The city was incorporated in the early 1900s and quickly grew in population. The city was a popular destination for tourists and locals alike, and it was known for its beautiful scenery and recreational activities.
In the 1950s, the city began to experience a decline in population as people moved away to larger cities. However, in the late 1970s, the city began to experience a resurgence in population as people began to move back to the area.
Geography
Kimberling City is located in Stone County, Missouri. It is situated on the shores of Table Rock Lake, a popular destination for tourists and locals alike. The city is located in the Ozark Mountains and is surrounded by rolling hills and lush forests.
The city has a total area of 2.2 square miles, all of which is land. The city has a humid subtropical climate, with hot, humid summers and mild winters.
Economy
Kimberling City’s economy is largely based on tourism. The city is home to several resorts and hotels, as well as a variety of restaurants and shops. The city is also home to several marinas, which provide access to Table Rock Lake.
The city is also home to several manufacturing companies, including a furniture factory and a plastics factory. The city is also home to a number of small businesses, including a grocery store, a hardware store, and a variety of other retail stores.
Demographics
Kimberling City has a population of approximately 1,500 people. The population is predominantly white, with a small percentage of African Americans and Hispanics. The median household income is $37,000, and the median age is 44.
The city has a low crime rate and is considered to be a safe place to live. The city is served by the Stone County Sheriff’s Office and the Kimberling City Police Department.
Conclusion
Kimberling City is a small city located in Stone County, Missouri. It is situated on the shores of Table Rock Lake, a popular destination for tourists and locals alike. The city has a population of approximately 1,500 people and is part of the Branson, Missouri metropolitan area. The city’s economy is largely based on tourism, and it is home to several resorts and hotels, as well as a variety of restaurants and shops. The city has a low crime rate and is considered to be a safe place to live.
Common Questions
What is Per Capita Income in Kimberling City?
Per Capita income in Kimberling City is $35,384.
What is the Median Family Income in Kimberling City?
Median Family Income in Kimberling City is $65,616.
What is the Median Household income in Kimberling City?
Median Household Income in Kimberling City is $51,458.
What is Income or Wage Gap in Kimberling City?
Income or Wage Gap in Kimberling City is 7.1%.
Women in Kimberling City earn 92.9 cents for every dollar earned by a man.
What is Inequality or Gini Index in Kimberling City?
Inequality or Gini Index in Kimberling City is 0.48.
What is the Total Population of Kimberling City?
Total Population of Kimberling City is 2,625.
What is the Total Male Population of Kimberling City?
Total Male Population of Kimberling City is 1,224.
What is the Total Female Population of Kimberling City?
Total Female Population of Kimberling City is 1,401.
What is the Ratio of Males per 100 Females in Kimberling City?
There are 87.37 Males per 100 Females in Kimberling City.
What is the Ratio of Females per 100 Males in Kimberling City?
There are 114.46 Females per 100 Males in Kimberling City.
What is the Median Population Age in Kimberling City?
Median Population Age in Kimberling City is 59.4 Years.
What is the Average Family Size in Kimberling City
Average Family Size in Kimberling City is 2.7 People.
What is the Average Household Size in Kimberling City
Average Household Size in Kimberling City is 2.2 People.
How Large is the Labor Force in Kimberling City?
There are 1,047 People in the Labor Forcein in Kimberling City.
What is the Percentage of People in the Labor Force in Kimberling City?
44.1% of People are in the Labor Force in Kimberling City.
What is the Unemployment Rate in Kimberling City?
Unemployment Rate in Kimberling City is 11.8%.