Cities with the Highest Percentage of Peruvian Population in Missouri
RELATED REPORTS & OPTIONS
Peruvian
Missouri
Compare Cities
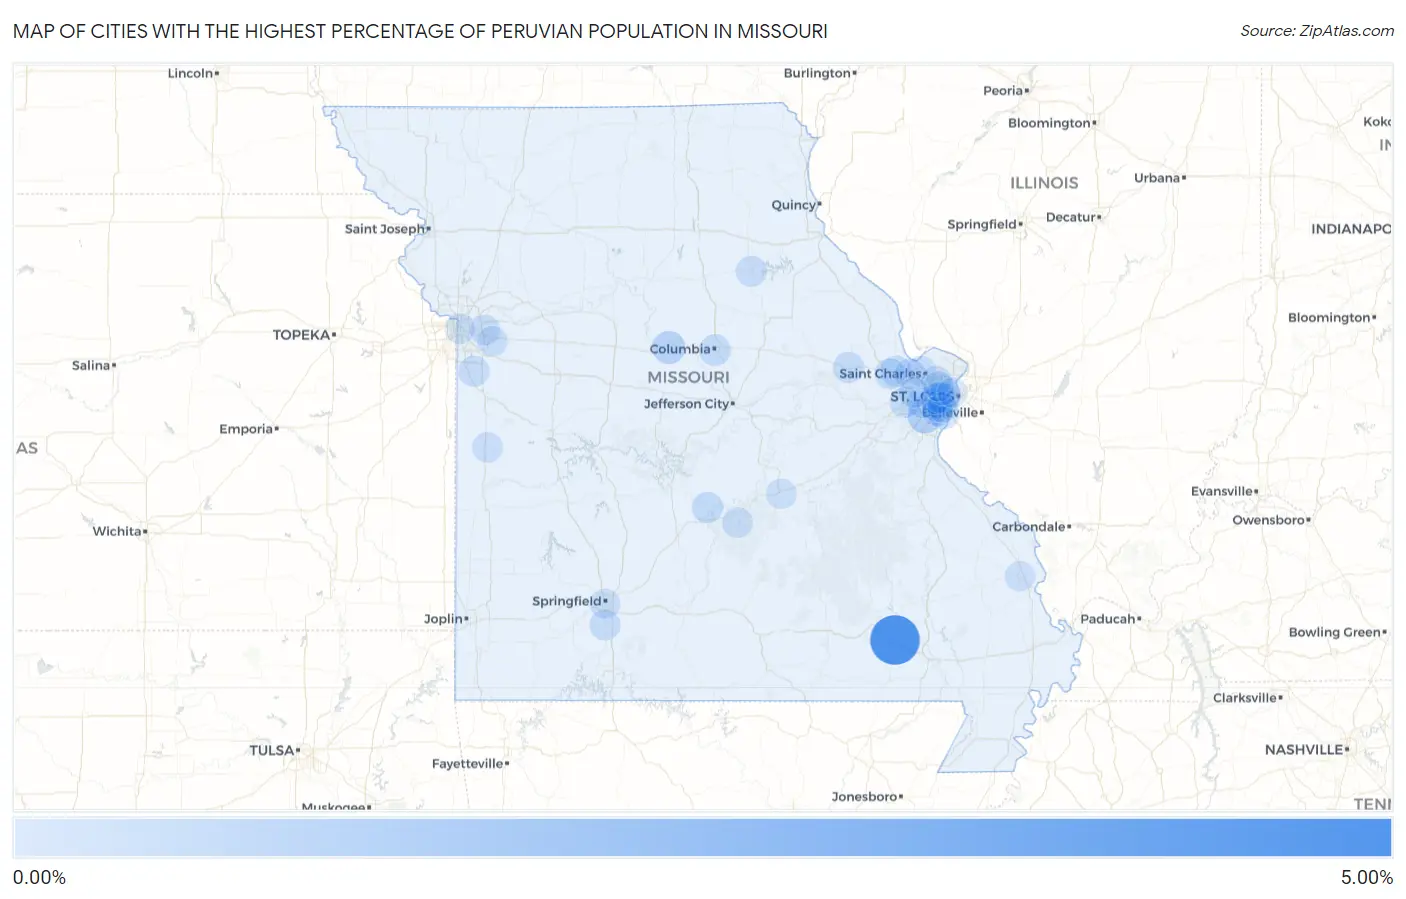
Map of Cities with the Highest Percentage of Peruvian Population in Missouri
0.00%
5.00%
Cities with the Highest Percentage of Peruvian Population in Missouri
| City | Peruvian | vs State | vs National | |
| 1. | Ellsinore | 4.07% | 0.037%(+4.04)#1 | 0.22%(+3.86)#96 |
| 2. | Murphy | 0.81% | 0.037%(+0.770)#2 | 0.22%(+0.592)#849 |
| 3. | Boonville | 0.57% | 0.037%(+0.532)#3 | 0.22%(+0.354)#1,146 |
| 4. | Rock Hill | 0.36% | 0.037%(+0.322)#4 | 0.22%(+0.144)#1,649 |
| 5. | Columbia | 0.26% | 0.037%(+0.226)#5 | 0.22%(+0.048)#1,982 |
| 6. | Maplewood | 0.26% | 0.037%(+0.219)#6 | 0.22%(+0.041)#2,023 |
| 7. | O Fallon | 0.25% | 0.037%(+0.211)#7 | 0.22%(+0.033)#2,066 |
| 8. | Manchester | 0.24% | 0.037%(+0.204)#8 | 0.22%(+0.026)#2,095 |
| 9. | Richland | 0.22% | 0.037%(+0.179)#9 | 0.22%(+0.001)#2,192 |
| 10. | Warrenton | 0.21% | 0.037%(+0.171)#10 | 0.22%(-0.007)#2,246 |
| 11. | Kirkwood | 0.21% | 0.037%(+0.171)#11 | 0.22%(-0.007)#2,247 |
| 12. | Mehlville | 0.19% | 0.037%(+0.148)#12 | 0.22%(-0.030)#2,372 |
| 13. | Wildwood | 0.17% | 0.037%(+0.136)#13 | 0.22%(-0.042)#2,439 |
| 14. | Crestwood | 0.17% | 0.037%(+0.133)#14 | 0.22%(-0.045)#2,451 |
| 15. | Raymore | 0.16% | 0.037%(+0.126)#15 | 0.22%(-0.052)#2,484 |
| 16. | Lake St Louis | 0.16% | 0.037%(+0.121)#16 | 0.22%(-0.057)#2,520 |
| 17. | Nixa | 0.15% | 0.037%(+0.112)#17 | 0.22%(-0.066)#2,583 |
| 18. | Paris | 0.14% | 0.037%(+0.107)#18 | 0.22%(-0.071)#2,610 |
| 19. | Warson Woods | 0.14% | 0.037%(+0.105)#19 | 0.22%(-0.073)#2,619 |
| 20. | Brentwood | 0.11% | 0.037%(+0.073)#20 | 0.22%(-0.105)#2,832 |
| 21. | Sappington | 0.099% | 0.037%(+0.062)#21 | 0.22%(-0.116)#2,903 |
| 22. | Fort Leonard Wood | 0.090% | 0.037%(+0.052)#22 | 0.22%(-0.126)#2,984 |
| 23. | St Peters | 0.081% | 0.037%(+0.044)#23 | 0.22%(-0.134)#3,046 |
| 24. | Independence | 0.073% | 0.037%(+0.036)#24 | 0.22%(-0.142)#3,120 |
| 25. | University City | 0.072% | 0.037%(+0.034)#25 | 0.22%(-0.144)#3,135 |
| 26. | St Charles | 0.068% | 0.037%(+0.031)#26 | 0.22%(-0.147)#3,176 |
| 27. | Butler | 0.066% | 0.037%(+0.029)#27 | 0.22%(-0.149)#3,194 |
| 28. | Kansas City | 0.056% | 0.037%(+0.019)#28 | 0.22%(-0.159)#3,279 |
| 29. | Blue Springs | 0.056% | 0.037%(+0.019)#29 | 0.22%(-0.159)#3,282 |
| 30. | Rolla | 0.055% | 0.037%(+0.018)#30 | 0.22%(-0.160)#3,296 |
| 31. | St Ann | 0.054% | 0.037%(+0.017)#31 | 0.22%(-0.161)#3,301 |
| 32. | Affton | 0.050% | 0.037%(+0.013)#32 | 0.22%(-0.165)#3,346 |
| 33. | Overland | 0.038% | 0.037%(+0.001)#33 | 0.22%(-0.177)#3,451 |
| 34. | Chesterfield | 0.034% | 0.037%(-0.003)#34 | 0.22%(-0.181)#3,487 |
| 35. | Jackson | 0.032% | 0.037%(-0.005)#35 | 0.22%(-0.183)#3,501 |
| 36. | Springfield | 0.032% | 0.037%(-0.005)#36 | 0.22%(-0.183)#3,503 |
| 37. | St Louis | 0.027% | 0.037%(-0.010)#37 | 0.22%(-0.188)#3,547 |
Common Questions
What are the Top 10 Cities with the Highest Percentage of Peruvian Population in Missouri?
Top 10 Cities with the Highest Percentage of Peruvian Population in Missouri are:
What city has the Highest Percentage of Peruvian Population in Missouri?
Ellsinore has the Highest Percentage of Peruvian Population in Missouri with 4.07%.
What is the Percentage of Peruvian Population in the State of Missouri?
Percentage of Peruvian Population in Missouri is 0.037%.
What is the Percentage of Peruvian Population in the United States?
Percentage of Peruvian Population in the United States is 0.22%.