Marthasville, MO Map & Demographics
Marthasville Map
Marthasville Overview
$30,270
PER CAPITA INCOME
$112,650
AVG FAMILY INCOME
$103,750
AVG HOUSEHOLD INCOME
19.8%
WAGE / INCOME GAP [ % ]
80.2¢/ $1
WAGE / INCOME GAP [ $ ]
0.29
INEQUALITY / GINI INDEX
2,616
TOTAL POPULATION
1,384
MALE POPULATION
1,232
FEMALE POPULATION
112.34
MALES / 100 FEMALES
89.02
FEMALES / 100 MALES
30.9
MEDIAN AGE
3.7
AVG FAMILY SIZE
3.4
AVG HOUSEHOLD SIZE
1,522
LABOR FORCE [ PEOPLE ]
83.1%
PERCENT IN LABOR FORCE
0.7%
UNEMPLOYMENT RATE
Marthasville Zip Codes
Marthasville Area Codes
Income in Marthasville
Income Overview in Marthasville
Per Capita Income in Marthasville is $30,270, while median incomes of families and households are $112,650 and $103,750 respectively.
| Characteristic | Number | Measure |
| Per Capita Income | 2,616 | $30,270 |
| Median Family Income | 637 | $112,650 |
| Mean Family Income | 637 | $103,463 |
| Median Household Income | 778 | $103,750 |
| Mean Household Income | 778 | $101,345 |
| Income Deficit | 637 | $0 |
| Wage / Income Gap (%) | 2,616 | 19.79% |
| Wage / Income Gap ($) | 2,616 | 80.21¢ per $1 |
| Gini / Inequality Index | 2,616 | 0.29 |
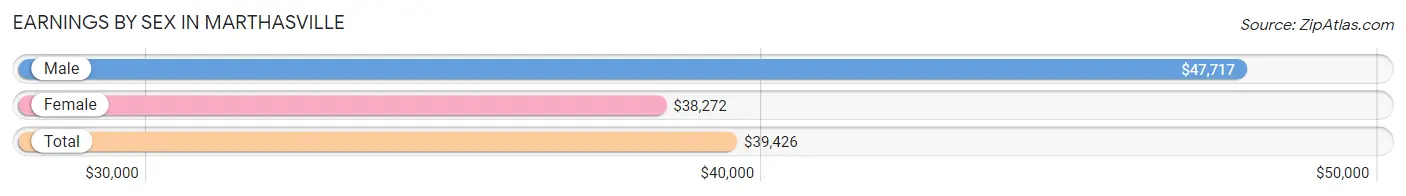
Earnings by Sex in Marthasville
Average Earnings in Marthasville are $39,426, $47,717 for men and $38,272 for women, a difference of 19.8%.
| Sex | Number | Average Earnings |
| Male | 862 (56.0%) | $47,717 |
| Female | 676 (44.0%) | $38,272 |
| Total | 1,538 (100.0%) | $39,426 |
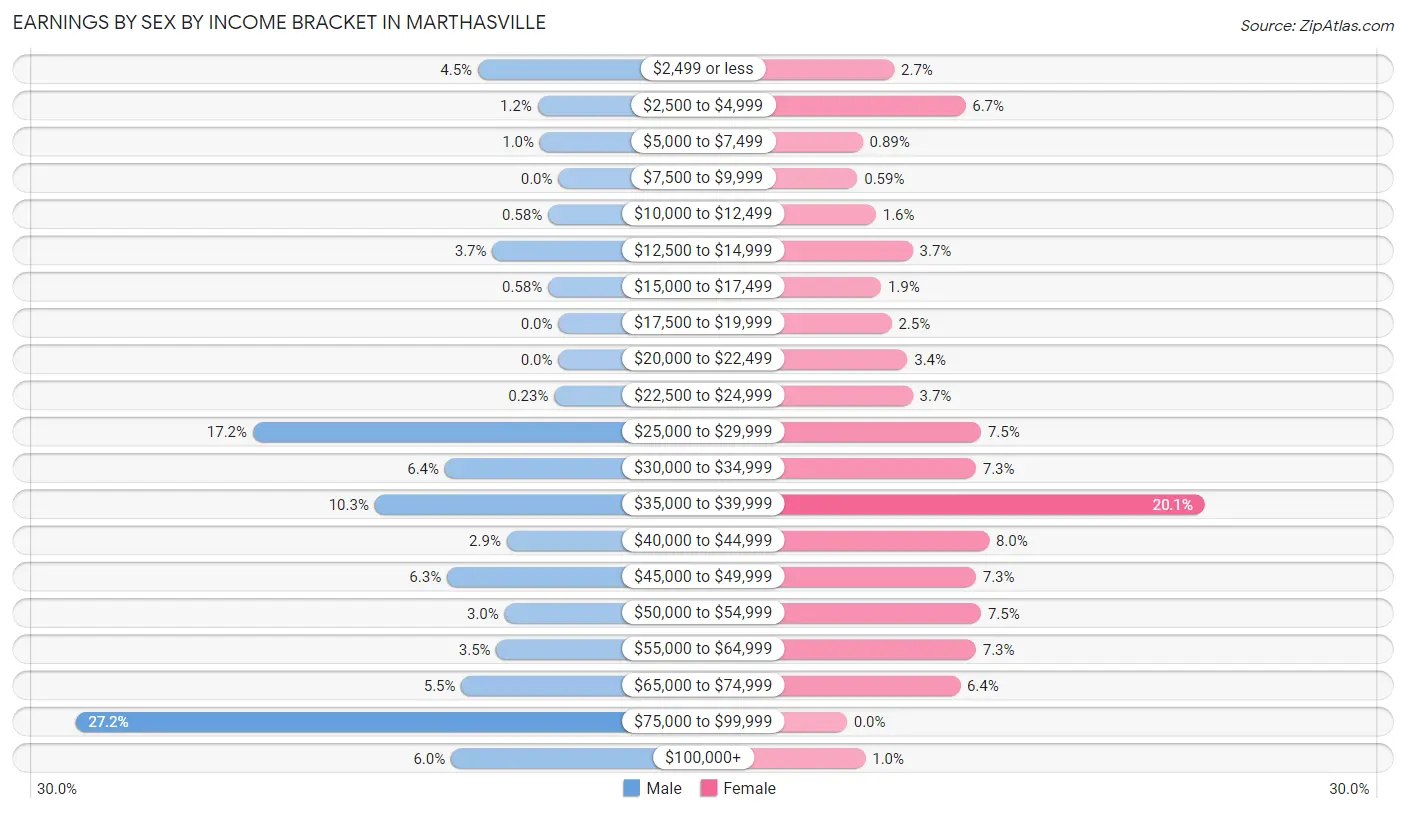
Earnings by Sex by Income Bracket in Marthasville
The most common earnings brackets in Marthasville are $75,000 to $99,999 for men (234 | 27.2%) and $35,000 to $39,999 for women (136 | 20.1%).
| Income | Male | Female |
| $2,499 or less | 39 (4.5%) | 18 (2.7%) |
| $2,500 to $4,999 | 10 (1.2%) | 45 (6.7%) |
| $5,000 to $7,499 | 9 (1.0%) | 6 (0.9%) |
| $7,500 to $9,999 | 0 (0.0%) | 4 (0.6%) |
| $10,000 to $12,499 | 5 (0.6%) | 11 (1.6%) |
| $12,500 to $14,999 | 32 (3.7%) | 25 (3.7%) |
| $15,000 to $17,499 | 5 (0.6%) | 13 (1.9%) |
| $17,500 to $19,999 | 0 (0.0%) | 17 (2.5%) |
| $20,000 to $22,499 | 0 (0.0%) | 23 (3.4%) |
| $22,500 to $24,999 | 2 (0.2%) | 25 (3.7%) |
| $25,000 to $29,999 | 148 (17.2%) | 51 (7.5%) |
| $30,000 to $34,999 | 55 (6.4%) | 49 (7.2%) |
| $35,000 to $39,999 | 89 (10.3%) | 136 (20.1%) |
| $40,000 to $44,999 | 25 (2.9%) | 54 (8.0%) |
| $45,000 to $49,999 | 54 (6.3%) | 49 (7.2%) |
| $50,000 to $54,999 | 26 (3.0%) | 51 (7.5%) |
| $55,000 to $64,999 | 30 (3.5%) | 49 (7.2%) |
| $65,000 to $74,999 | 47 (5.4%) | 43 (6.4%) |
| $75,000 to $99,999 | 234 (27.2%) | 0 (0.0%) |
| $100,000+ | 52 (6.0%) | 7 (1.0%) |
| Total | 862 (100.0%) | 676 (100.0%) |
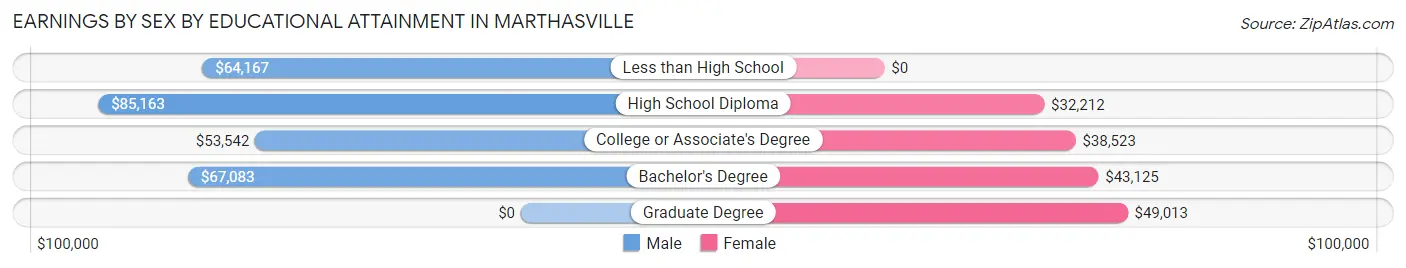
Earnings by Sex by Educational Attainment in Marthasville
Average earnings in Marthasville are $67,150 for men and $38,897 for women, a difference of 42.1%. Men with an educational attainment of high school diploma enjoy the highest average annual earnings of $85,163, while those with college or associate's degree education earn the least with $53,542. Women with an educational attainment of graduate degree earn the most with the average annual earnings of $49,013, while those with high school diploma education have the smallest earnings of $32,212.
| Educational Attainment | Male Income | Female Income |
| Less than High School | $64,167 | $0 |
| High School Diploma | $85,163 | $32,212 |
| College or Associate's Degree | $53,542 | $38,523 |
| Bachelor's Degree | $67,083 | $43,125 |
| Graduate Degree | - | - |
| Total | $67,150 | $38,897 |
Family Income in Marthasville
Family Income Brackets in Marthasville
According to the Marthasville family income data, there are 329 families falling into the $100,000 to $149,999 income range, which is the most common income bracket and makes up 51.6% of all families.
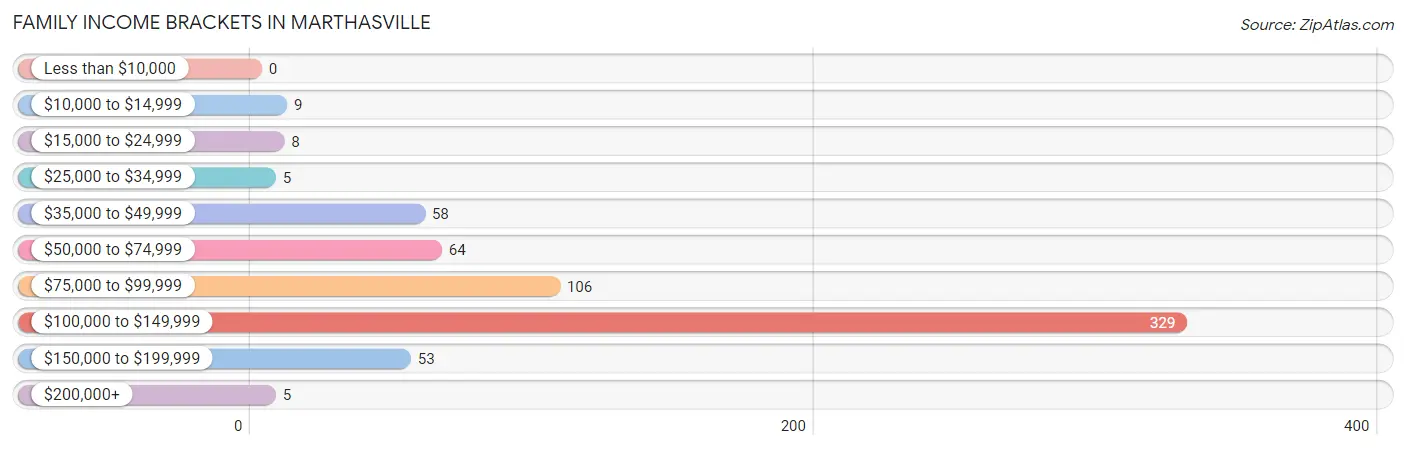
| Income Bracket | # Families | % Families |
| Less than $10,000 | 0 | 0.0% |
| $10,000 to $14,999 | 9 | 1.4% |
| $15,000 to $24,999 | 8 | 1.3% |
| $25,000 to $34,999 | 5 | 0.8% |
| $35,000 to $49,999 | 58 | 9.1% |
| $50,000 to $74,999 | 64 | 10.0% |
| $75,000 to $99,999 | 106 | 16.6% |
| $100,000 to $149,999 | 329 | 51.6% |
| $150,000 to $199,999 | 53 | 8.3% |
| $200,000+ | 5 | 0.8% |
Family Income by Famaliy Size in Marthasville
6-person families (28 | 4.4%) account for the highest median family income in Marthasville with $124,643 per family, while 2-person families (215 | 33.8%) have the highest median income of $40,767 per family member.
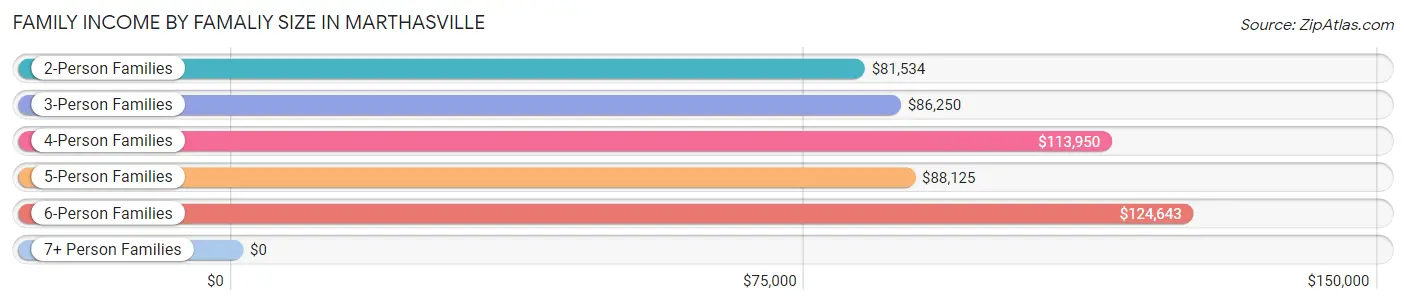
| Income Bracket | # Families | Median Income |
| 2-Person Families | 215 (33.8%) | $81,534 |
| 3-Person Families | 105 (16.5%) | $86,250 |
| 4-Person Families | 224 (35.2%) | $113,950 |
| 5-Person Families | 47 (7.4%) | $88,125 |
| 6-Person Families | 28 (4.4%) | $124,643 |
| 7+ Person Families | 18 (2.8%) | $0 |
| Total | 637 (100.0%) | $112,650 |
Family Income by Number of Earners in Marthasville
The median family income in Marthasville is $112,650, with families comprising 3+ earners (94) having the highest median family income of $137,273, while families with no earners (28) have the lowest median family income of $59,167, accounting for 14.8% and 4.4% of families, respectively.
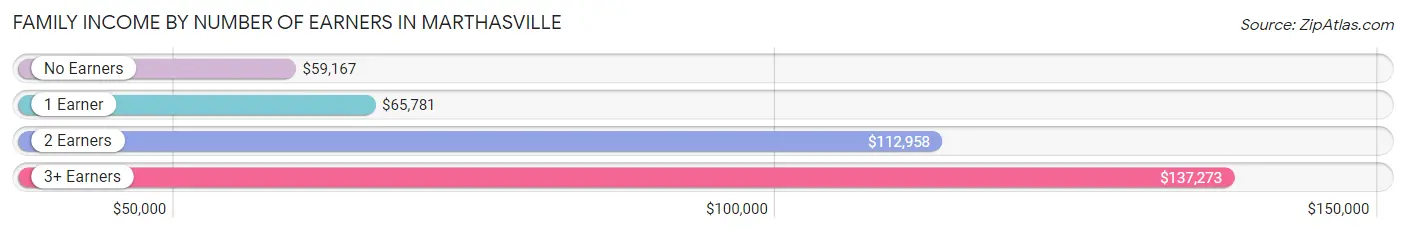
| Number of Earners | # Families | Median Income |
| No Earners | 28 (4.4%) | $59,167 |
| 1 Earner | 125 (19.6%) | $65,781 |
| 2 Earners | 390 (61.2%) | $112,958 |
| 3+ Earners | 94 (14.8%) | $137,273 |
| Total | 637 (100.0%) | $112,650 |
Household Income in Marthasville
Household Income Brackets in Marthasville
With 208 households falling in the category, the $150,000 to $199,999 income range is the most frequent in Marthasville, accounting for 26.7% of all households.
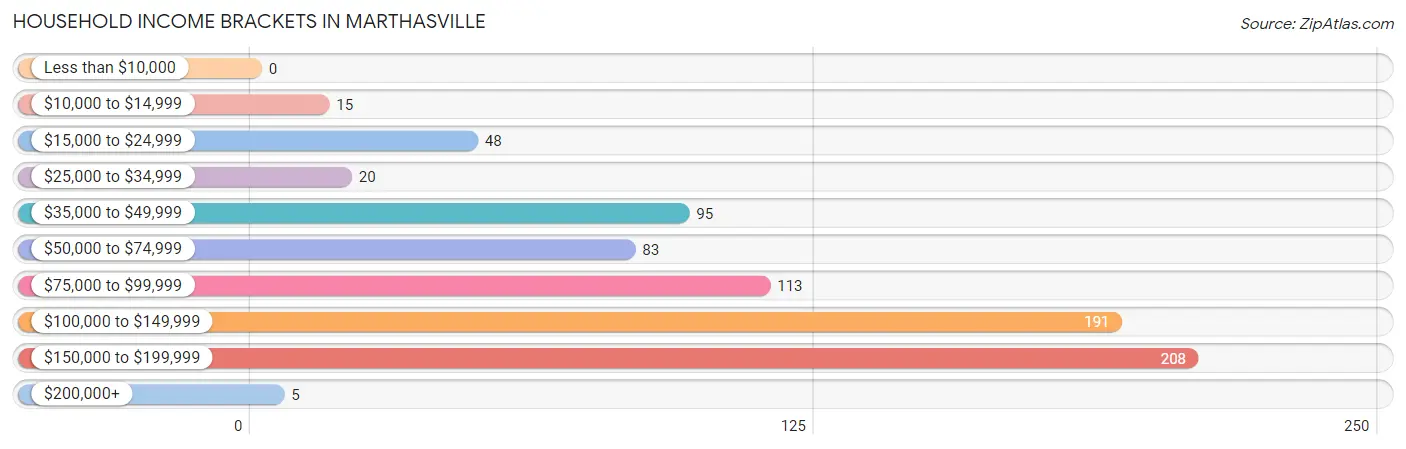
| Income Bracket | # Households | % Households |
| Less than $10,000 | 0 | 0.0% |
| $10,000 to $14,999 | 15 | 1.9% |
| $15,000 to $24,999 | 48 | 6.2% |
| $25,000 to $34,999 | 20 | 2.6% |
| $35,000 to $49,999 | 95 | 12.2% |
| $50,000 to $74,999 | 83 | 10.7% |
| $75,000 to $99,999 | 113 | 14.5% |
| $100,000 to $149,999 | 191 | 24.6% |
| $150,000 to $199,999 | 208 | 26.7% |
| $200,000+ | 5 | 0.6% |
Household Income by Householder Age in Marthasville
The median household income in Marthasville is $103,750, with the highest median household income of $150,060 found in the 45 to 64 years age bracket for the primary householder. A total of 381 households (49.0%) fall into this category. Meanwhile, the 15 to 24 years age bracket for the primary householder has the lowest median household income of $0, with 4 households (0.5%) in this group.
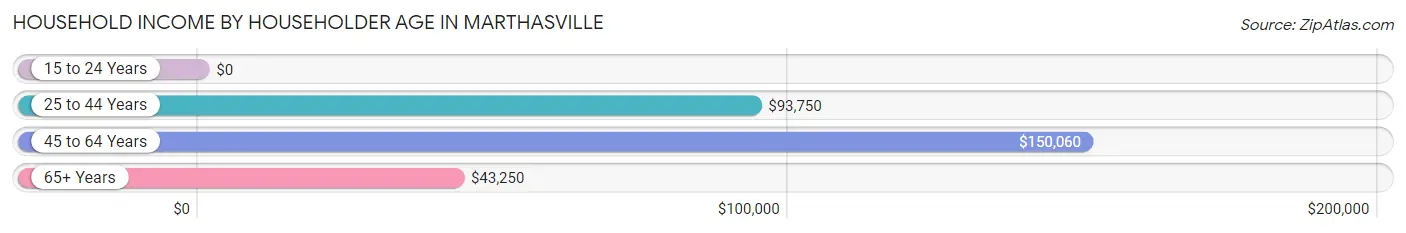
| Income Bracket | # Households | Median Income |
| 15 to 24 Years | 4 (0.5%) | $0 |
| 25 to 44 Years | 282 (36.2%) | $93,750 |
| 45 to 64 Years | 381 (49.0%) | $150,060 |
| 65+ Years | 111 (14.3%) | $43,250 |
| Total | 778 (100.0%) | $103,750 |
Poverty in Marthasville
Income Below Poverty by Sex and Age in Marthasville
With 2.3% poverty level for males and 0.6% for females among the residents of Marthasville, under 5 year old males and 65 to 74 year old females are the most vulnerable to poverty, with 5 males (11.1%) and 5 females (7.6%) in their respective age groups living below the poverty level.
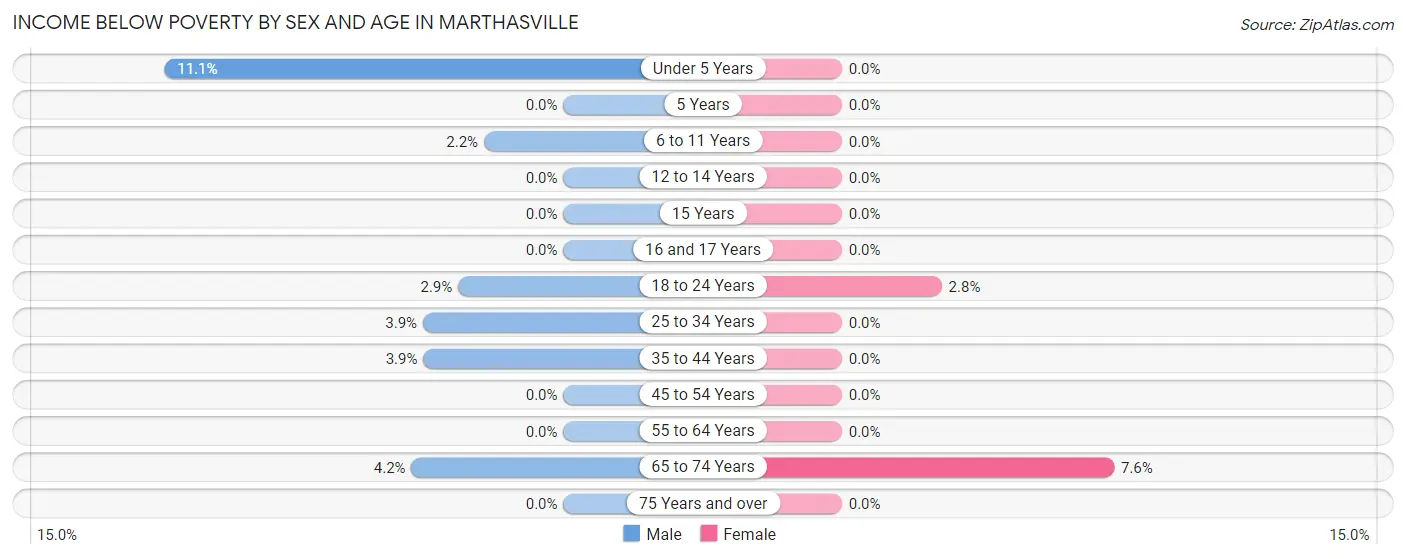
| Age Bracket | Male | Female |
| Under 5 Years | 5 (11.1%) | 0 (0.0%) |
| 5 Years | 0 (0.0%) | 0 (0.0%) |
| 6 to 11 Years | 6 (2.2%) | 0 (0.0%) |
| 12 to 14 Years | 0 (0.0%) | 0 (0.0%) |
| 15 Years | 0 (0.0%) | 0 (0.0%) |
| 16 and 17 Years | 0 (0.0%) | 0 (0.0%) |
| 18 to 24 Years | 7 (2.9%) | 2 (2.8%) |
| 25 to 34 Years | 5 (3.9%) | 0 (0.0%) |
| 35 to 44 Years | 6 (3.9%) | 0 (0.0%) |
| 45 to 54 Years | 0 (0.0%) | 0 (0.0%) |
| 55 to 64 Years | 0 (0.0%) | 0 (0.0%) |
| 65 to 74 Years | 3 (4.2%) | 5 (7.6%) |
| 75 Years and over | 0 (0.0%) | 0 (0.0%) |
| Total | 32 (2.3%) | 7 (0.6%) |
Income Above Poverty by Sex and Age in Marthasville
According to the poverty statistics in Marthasville, males aged 12 to 14 years and females aged under 5 years are the age groups that are most secure financially, with 100.0% of males and 100.0% of females in these age groups living above the poverty line.
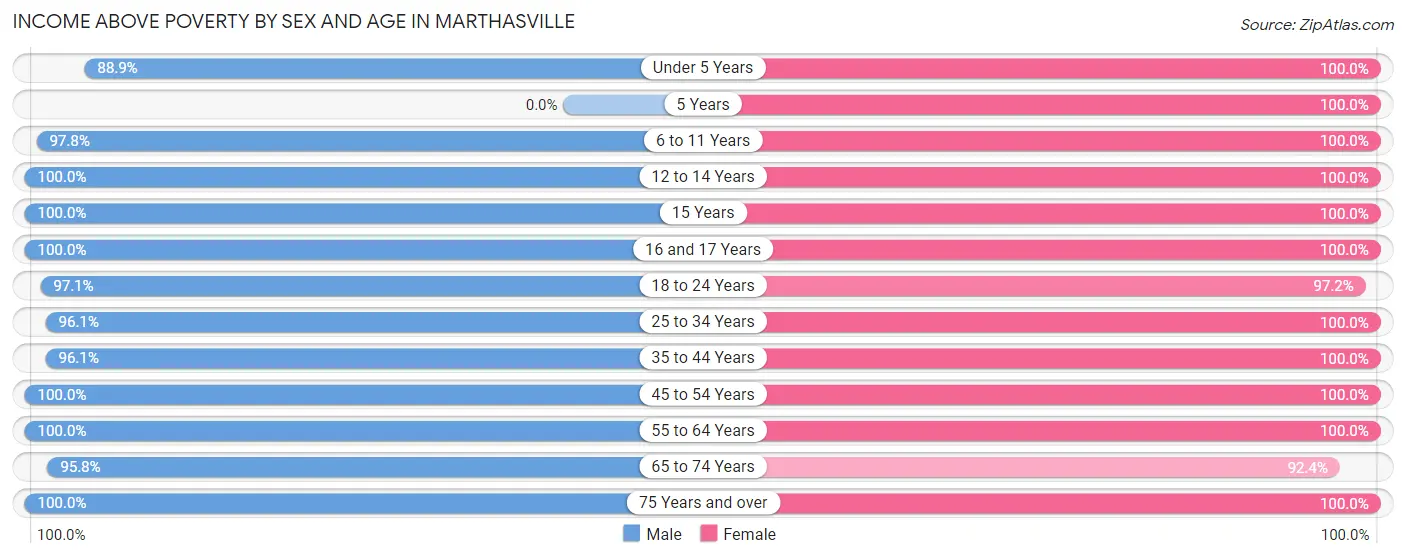
| Age Bracket | Male | Female |
| Under 5 Years | 40 (88.9%) | 71 (100.0%) |
| 5 Years | 0 (0.0%) | 33 (100.0%) |
| 6 to 11 Years | 265 (97.8%) | 202 (100.0%) |
| 12 to 14 Years | 38 (100.0%) | 53 (100.0%) |
| 15 Years | 32 (100.0%) | 34 (100.0%) |
| 16 and 17 Years | 36 (100.0%) | 32 (100.0%) |
| 18 to 24 Years | 232 (97.1%) | 70 (97.2%) |
| 25 to 34 Years | 123 (96.1%) | 253 (100.0%) |
| 35 to 44 Years | 148 (96.1%) | 187 (100.0%) |
| 45 to 54 Years | 250 (100.0%) | 121 (100.0%) |
| 55 to 64 Years | 100 (100.0%) | 93 (100.0%) |
| 65 to 74 Years | 68 (95.8%) | 61 (92.4%) |
| 75 Years and over | 15 (100.0%) | 15 (100.0%) |
| Total | 1,347 (97.7%) | 1,225 (99.4%) |
Income Below Poverty Among Married-Couple Families in Marthasville
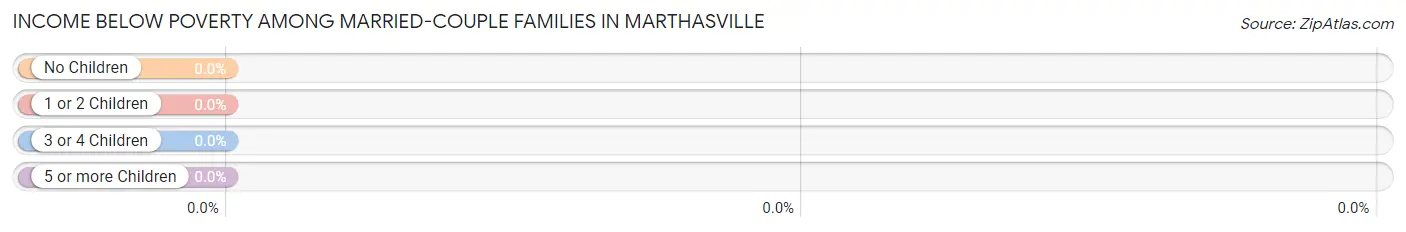
| Children | Above Poverty | Below Poverty |
| No Children | 219 (100.0%) | 0 (0.0%) |
| 1 or 2 Children | 116 (100.0%) | 0 (0.0%) |
| 3 or 4 Children | 58 (100.0%) | 0 (0.0%) |
| 5 or more Children | 0 (0.0%) | 0 (0.0%) |
| Total | 393 (100.0%) | 0 (0.0%) |
Income Below Poverty Among Single-Parent Households in Marthasville
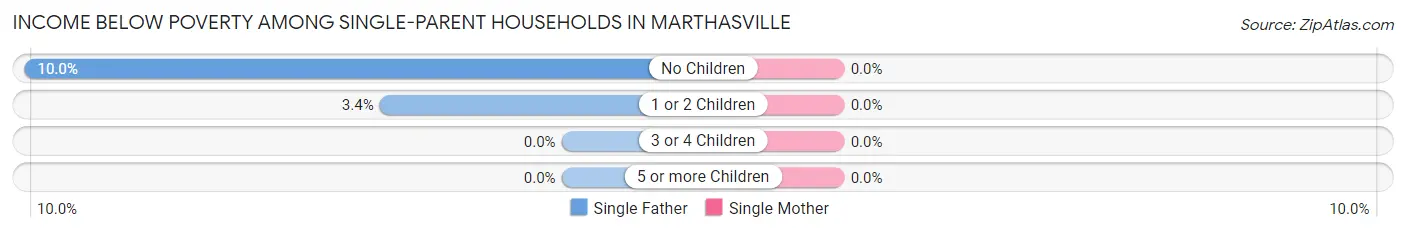
| Children | Single Father | Single Mother |
| No Children | 3 (10.0%) | 0 (0.0%) |
| 1 or 2 Children | 6 (3.4%) | 0 (0.0%) |
| 3 or 4 Children | 0 (0.0%) | 0 (0.0%) |
| 5 or more Children | 0 (0.0%) | 0 (0.0%) |
| Total | 9 (4.1%) | 0 (0.0%) |
Income Below Poverty Among Married-Couple vs Single-Parent Households in Marthasville
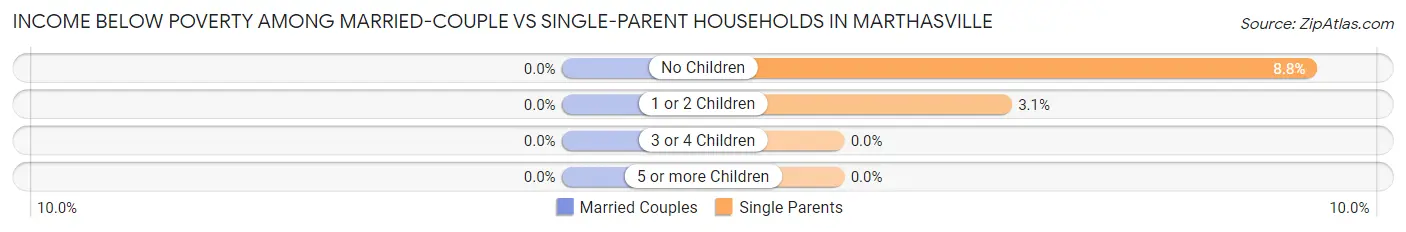
| Children | Married-Couple Families | Single-Parent Households |
| No Children | 0 (0.0%) | 3 (8.8%) |
| 1 or 2 Children | 0 (0.0%) | 6 (3.1%) |
| 3 or 4 Children | 0 (0.0%) | 0 (0.0%) |
| 5 or more Children | 0 (0.0%) | 0 (0.0%) |
| Total | 0 (0.0%) | 9 (3.7%) |
Race in Marthasville
The most populous races in Marthasville are White / Caucasian (2,539 | 97.1%), Hispanic or Latino (64 | 2.5%), and Two or more Races (41 | 1.6%).
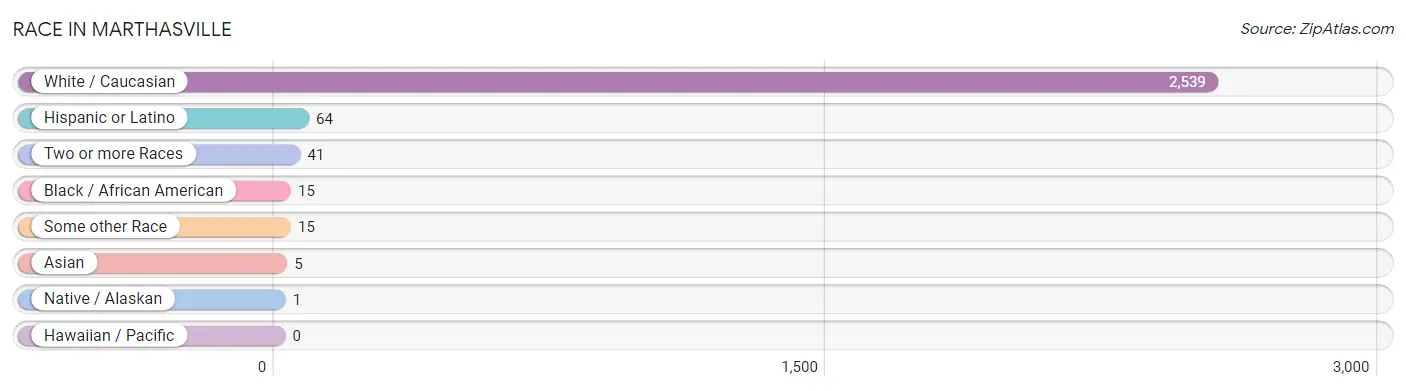
| Race | # Population | % Population |
| Asian | 5 | 0.2% |
| Black / African American | 15 | 0.6% |
| Hawaiian / Pacific | 0 | 0.0% |
| Hispanic or Latino | 64 | 2.5% |
| Native / Alaskan | 1 | 0.0% |
| White / Caucasian | 2,539 | 97.1% |
| Two or more Races | 41 | 1.6% |
| Some other Race | 15 | 0.6% |
| Total | 2,616 | 100.0% |
Ancestry in Marthasville
The most populous ancestries reported in Marthasville are German (951 | 36.3%), English (395 | 15.1%), Irish (317 | 12.1%), American (82 | 3.1%), and French (74 | 2.8%), together accounting for 69.5% of all Marthasville residents.
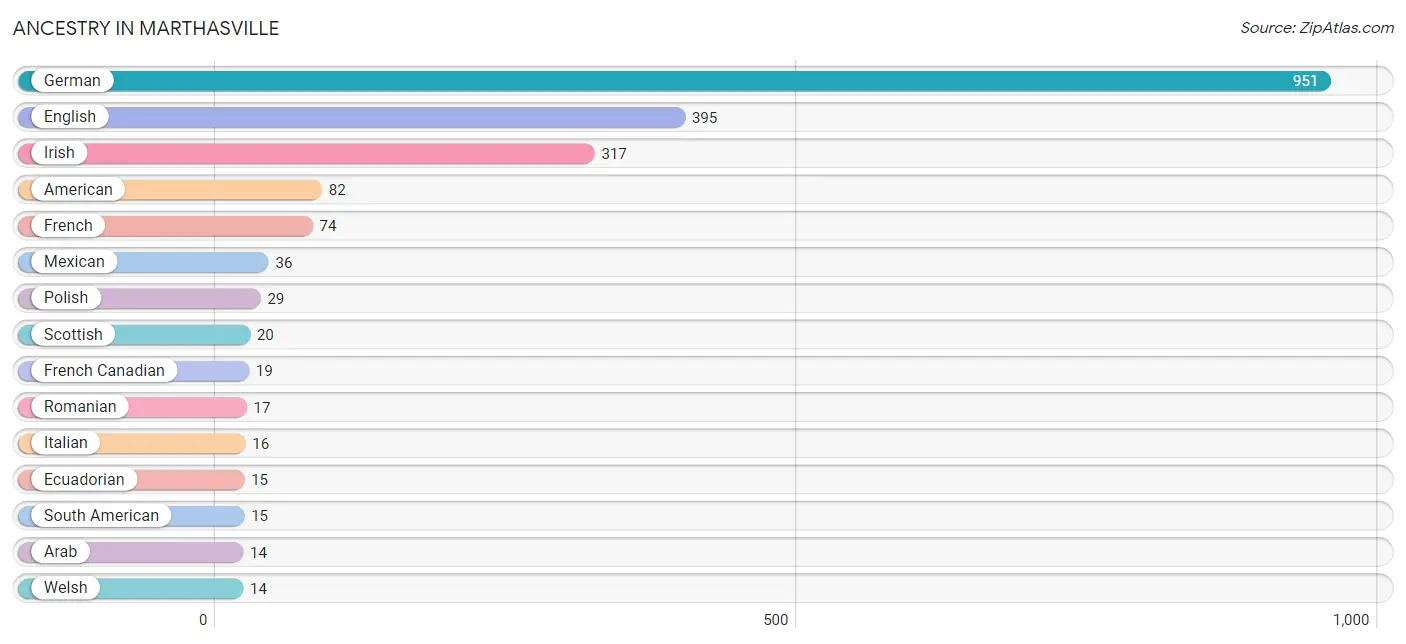
| Ancestry | # Population | % Population |
| American | 82 | 3.1% |
| Arab | 14 | 0.5% |
| Cherokee | 1 | 0.0% |
| Croatian | 1 | 0.0% |
| Crow | 1 | 0.0% |
| Czech | 11 | 0.4% |
| Dutch | 2 | 0.1% |
| Ecuadorian | 15 | 0.6% |
| English | 395 | 15.1% |
| French | 74 | 2.8% |
| French Canadian | 19 | 0.7% |
| German | 951 | 36.3% |
| Irish | 317 | 12.1% |
| Iroquois | 1 | 0.0% |
| Italian | 16 | 0.6% |
| Jordanian | 3 | 0.1% |
| Lebanese | 11 | 0.4% |
| Mexican | 36 | 1.4% |
| Polish | 29 | 1.1% |
| Romanian | 17 | 0.6% |
| Scandinavian | 7 | 0.3% |
| Scottish | 20 | 0.8% |
| South American | 15 | 0.6% |
| Spanish | 13 | 0.5% |
| Welsh | 14 | 0.5% | View All 25 Rows |
Immigrants in Marthasville
The most numerous immigrant groups reported in Marthasville came from Ecuador (15 | 0.6%), Latin America (15 | 0.6%), South America (15 | 0.6%), Asia (3 | 0.1%), and Jordan (3 | 0.1%), together accounting for 1.9% of all Marthasville residents.
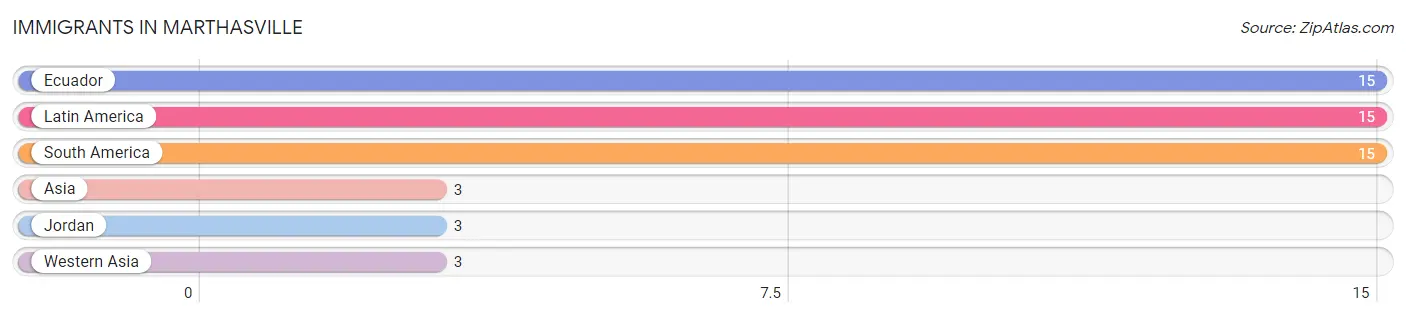
| Immigration Origin | # Population | % Population |
| Asia | 3 | 0.1% |
| Ecuador | 15 | 0.6% |
| Jordan | 3 | 0.1% |
| Latin America | 15 | 0.6% |
| South America | 15 | 0.6% |
| Western Asia | 3 | 0.1% | View All 6 Rows |
Sex and Age in Marthasville
Sex and Age in Marthasville
The most populous age groups in Marthasville are 5 to 9 Years (246 | 17.8%) for men and 5 to 9 Years (229 | 18.6%) for women.
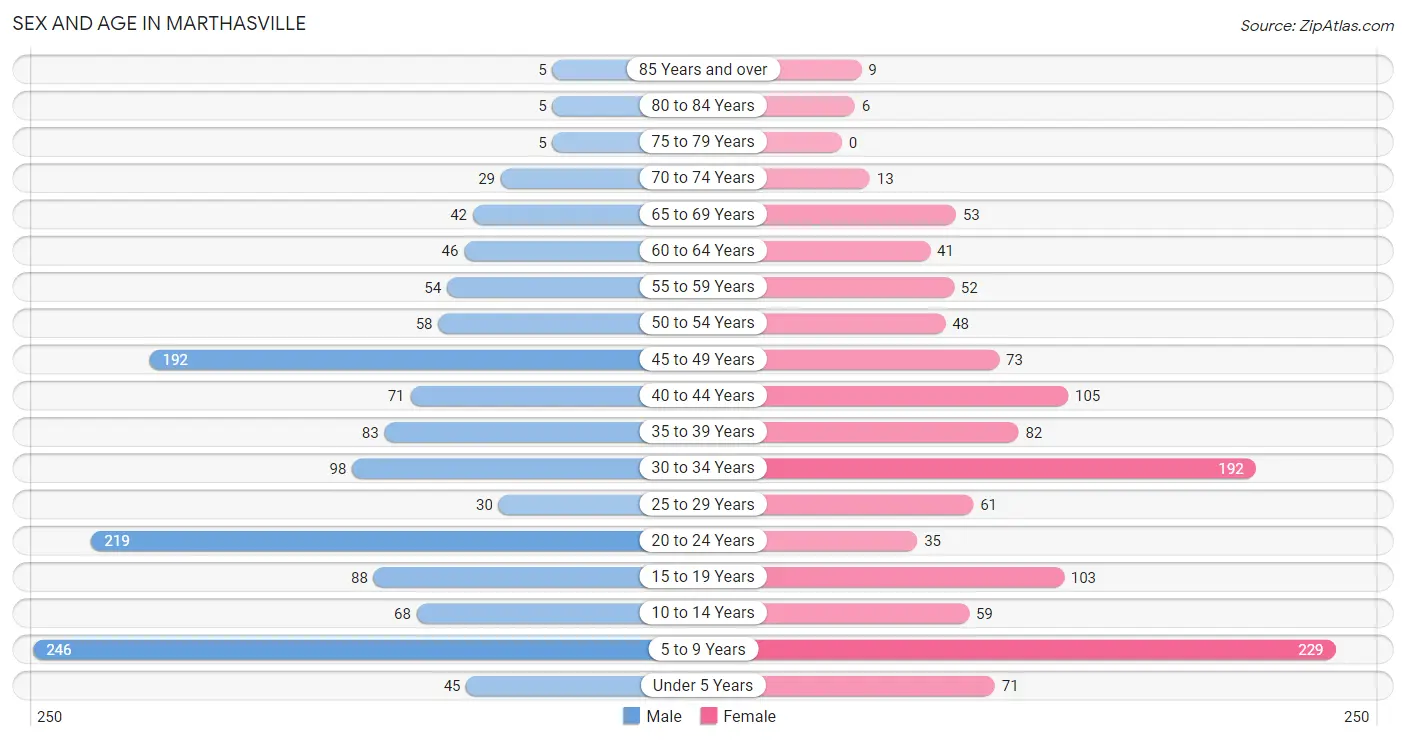
| Age Bracket | Male | Female |
| Under 5 Years | 45 (3.3%) | 71 (5.8%) |
| 5 to 9 Years | 246 (17.8%) | 229 (18.6%) |
| 10 to 14 Years | 68 (4.9%) | 59 (4.8%) |
| 15 to 19 Years | 88 (6.4%) | 103 (8.4%) |
| 20 to 24 Years | 219 (15.8%) | 35 (2.8%) |
| 25 to 29 Years | 30 (2.2%) | 61 (5.0%) |
| 30 to 34 Years | 98 (7.1%) | 192 (15.6%) |
| 35 to 39 Years | 83 (6.0%) | 82 (6.7%) |
| 40 to 44 Years | 71 (5.1%) | 105 (8.5%) |
| 45 to 49 Years | 192 (13.9%) | 73 (5.9%) |
| 50 to 54 Years | 58 (4.2%) | 48 (3.9%) |
| 55 to 59 Years | 54 (3.9%) | 52 (4.2%) |
| 60 to 64 Years | 46 (3.3%) | 41 (3.3%) |
| 65 to 69 Years | 42 (3.0%) | 53 (4.3%) |
| 70 to 74 Years | 29 (2.1%) | 13 (1.1%) |
| 75 to 79 Years | 5 (0.4%) | 0 (0.0%) |
| 80 to 84 Years | 5 (0.4%) | 6 (0.5%) |
| 85 Years and over | 5 (0.4%) | 9 (0.7%) |
| Total | 1,384 (100.0%) | 1,232 (100.0%) |
Families and Households in Marthasville
Median Family Size in Marthasville
The median family size in Marthasville is 3.66 persons per family, with single male/father families (218 | 34.2%) accounting for the largest median family size of 4.22 persons per family. On the other hand, single female/mother families (26 | 4.1%) represent the smallest median family size with 3.15 persons per family.
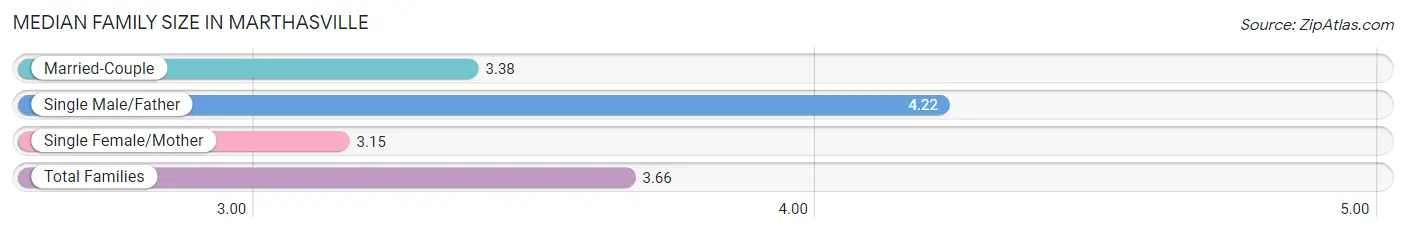
| Family Type | # Families | Family Size |
| Married-Couple | 393 (61.7%) | 3.38 |
| Single Male/Father | 218 (34.2%) | 4.22 |
| Single Female/Mother | 26 (4.1%) | 3.15 |
| Total Families | 637 (100.0%) | 3.66 |
Median Household Size in Marthasville
The median household size in Marthasville is 3.36 persons per household, with single male/father households (218 | 28.0%) accounting for the largest median household size of 4.8 persons per household. non-family households (141 | 18.1%) represent the smallest median household size with 1.08 persons per household.
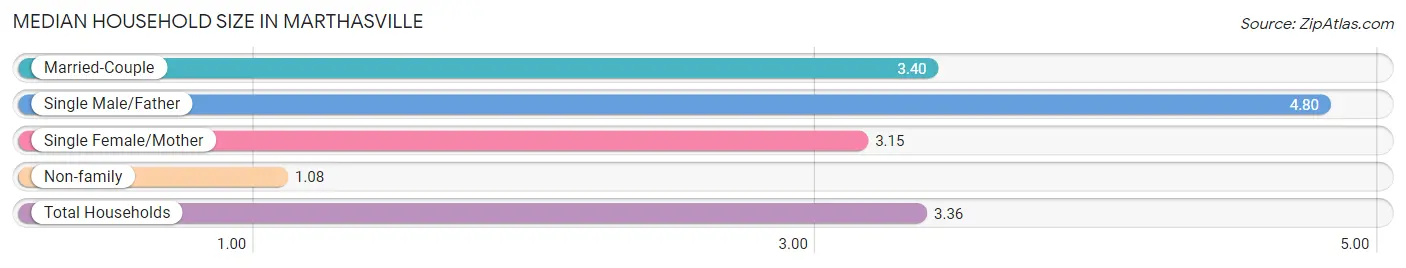
| Household Type | # Households | Household Size |
| Married-Couple | 393 (50.5%) | 3.40 |
| Single Male/Father | 218 (28.0%) | 4.80 |
| Single Female/Mother | 26 (3.3%) | 3.15 |
| Non-family | 141 (18.1%) | 1.08 |
| Total Households | 778 (100.0%) | 3.36 |
Household Size by Marriage Status in Marthasville
Out of a total of 778 households in Marthasville, 637 (81.9%) are family households, while 141 (18.1%) are nonfamily households. The most numerous type of family households are 2-person households, comprising 203, and the most common type of nonfamily households are 1-person households, comprising 130.
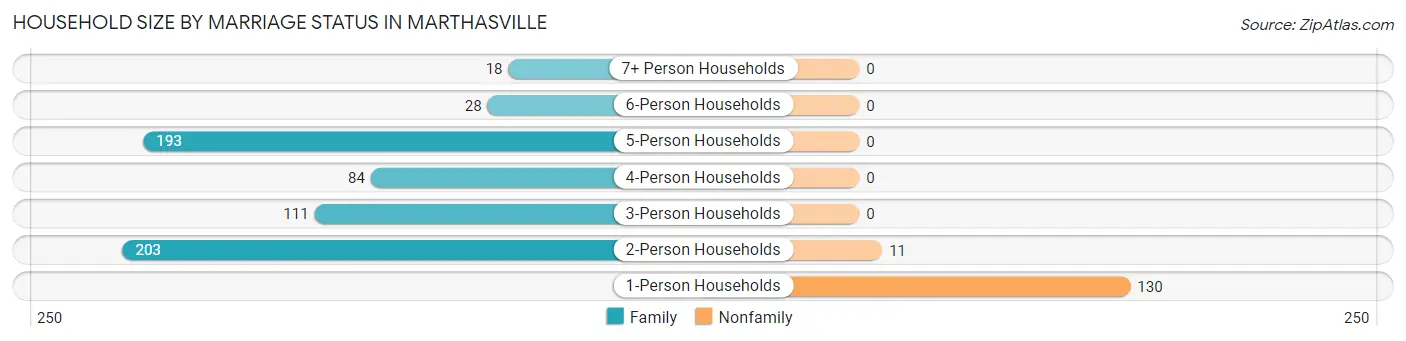
| Household Size | Family Households | Nonfamily Households |
| 1-Person Households | - | 130 (16.7%) |
| 2-Person Households | 203 (26.1%) | 11 (1.4%) |
| 3-Person Households | 111 (14.3%) | 0 (0.0%) |
| 4-Person Households | 84 (10.8%) | 0 (0.0%) |
| 5-Person Households | 193 (24.8%) | 0 (0.0%) |
| 6-Person Households | 28 (3.6%) | 0 (0.0%) |
| 7+ Person Households | 18 (2.3%) | 0 (0.0%) |
| Total | 637 (81.9%) | 141 (18.1%) |
Female Fertility in Marthasville
Fertility by Age in Marthasville
Average fertility rate in Marthasville is 24.0 births per 1,000 women. Women in the age bracket of 20 to 34 years have the highest fertility rate with 56.0 births per 1,000 women. Women in the age bracket of 20 to 34 years acount for 100.0% of all women with births.
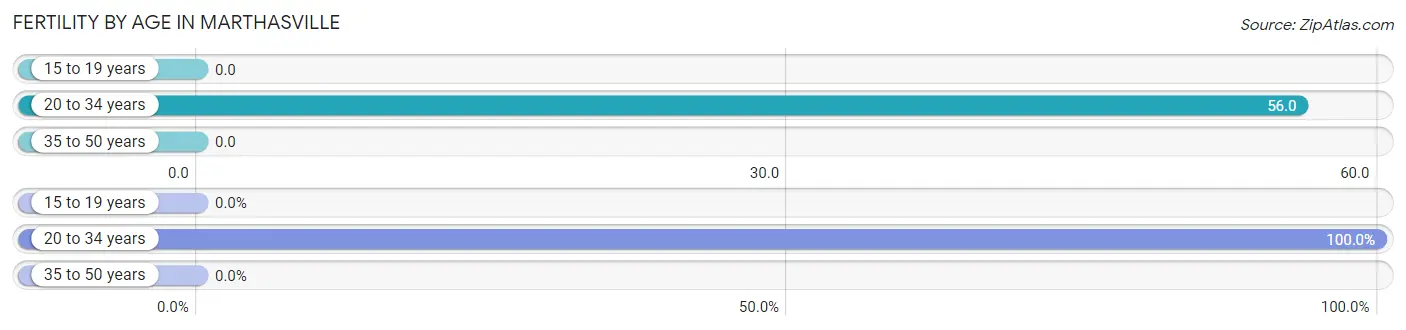
| Age Bracket | Women with Births | Births / 1,000 Women |
| 15 to 19 years | 0 (0.0%) | 0.0 |
| 20 to 34 years | 16 (100.0%) | 56.0 |
| 35 to 50 years | 0 (0.0%) | 0.0 |
| Total | 16 (100.0%) | 24.0 |
Fertility by Age by Marriage Status in Marthasville
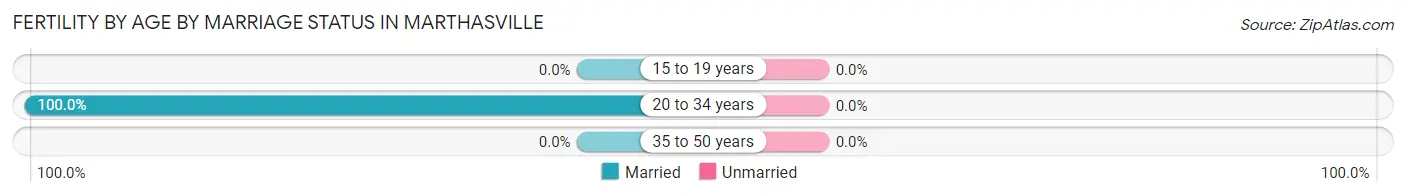
| Age Bracket | Married | Unmarried |
| 15 to 19 years | 0 (0.0%) | 0 (0.0%) |
| 20 to 34 years | 16 (100.0%) | 0 (0.0%) |
| 35 to 50 years | 0 (0.0%) | 0 (0.0%) |
| Total | 16 (100.0%) | 0 (0.0%) |
Fertility by Education in Marthasville
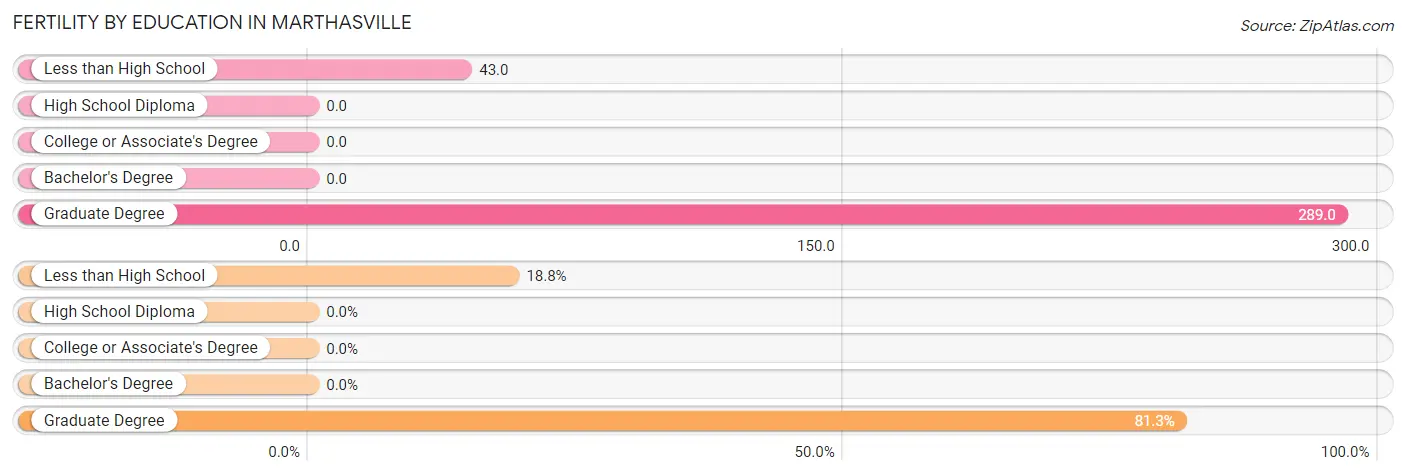
| Educational Attainment | Women with Births | Births / 1,000 Women |
| Less than High School | 3 (18.8%) | 43.0 |
| High School Diploma | 0 (0.0%) | 0.0 |
| College or Associate's Degree | 0 (0.0%) | 0.0 |
| Bachelor's Degree | 0 (0.0%) | 0.0 |
| Graduate Degree | 13 (81.2%) | 289.0 |
| Total | 16 (100.0%) | 24.0 |
Fertility by Education by Marriage Status in Marthasville
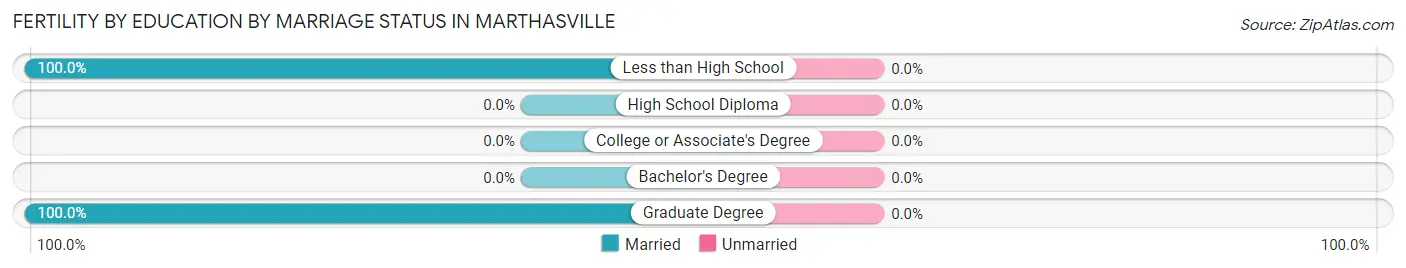
| Educational Attainment | Married | Unmarried |
| Less than High School | 3 (100.0%) | 0 (0.0%) |
| High School Diploma | 0 (0.0%) | 0 (0.0%) |
| College or Associate's Degree | 0 (0.0%) | 0 (0.0%) |
| Bachelor's Degree | 0 (0.0%) | 0 (0.0%) |
| Graduate Degree | 13 (100.0%) | 0 (0.0%) |
| Total | 16 (100.0%) | 0 (0.0%) |
Employment Characteristics in Marthasville
Employment by Class of Employer in Marthasville
Among the 1,472 employed individuals in Marthasville, private company employees (1,106 | 75.1%), not-for-profit organizations (155 | 10.5%), and state government employees (124 | 8.4%) make up the most common classes of employment.
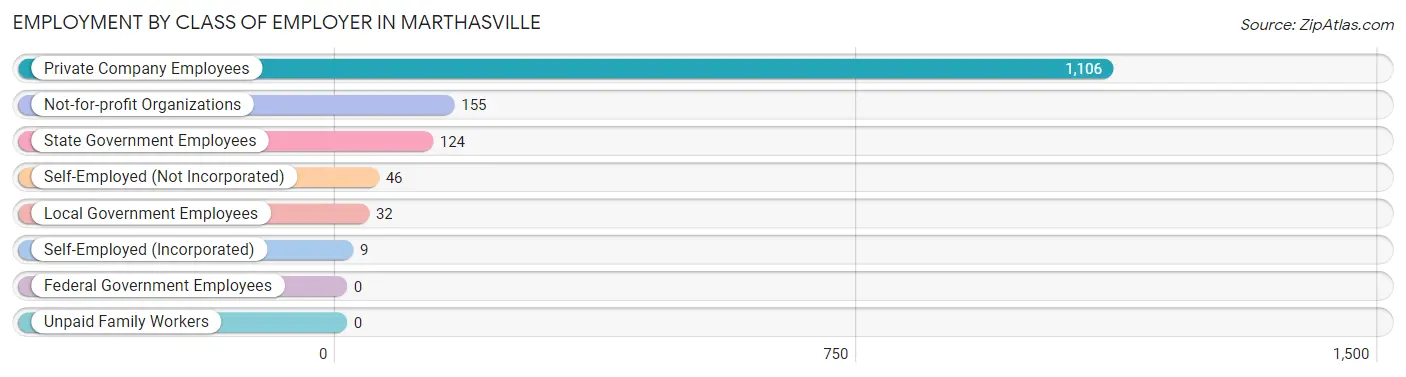
| Employer Class | # Employees | % Employees |
| Private Company Employees | 1,106 | 75.1% |
| Self-Employed (Incorporated) | 9 | 0.6% |
| Self-Employed (Not Incorporated) | 46 | 3.1% |
| Not-for-profit Organizations | 155 | 10.5% |
| Local Government Employees | 32 | 2.2% |
| State Government Employees | 124 | 8.4% |
| Federal Government Employees | 0 | 0.0% |
| Unpaid Family Workers | 0 | 0.0% |
| Total | 1,472 | 100.0% |
Employment Status by Age in Marthasville
According to the labor force statistics for Marthasville, out of the total population over 16 years of age (1,832), 83.1% or 1,522 individuals are in the labor force, with 0.7% or 11 of them unemployed. The age group with the highest labor force participation rate is 20 to 24 years, with 100.0% or 254 individuals in the labor force. Within the labor force, the 25 to 29 years age range has the highest percentage of unemployed individuals, with 4.6% or 4 of them being unemployed.
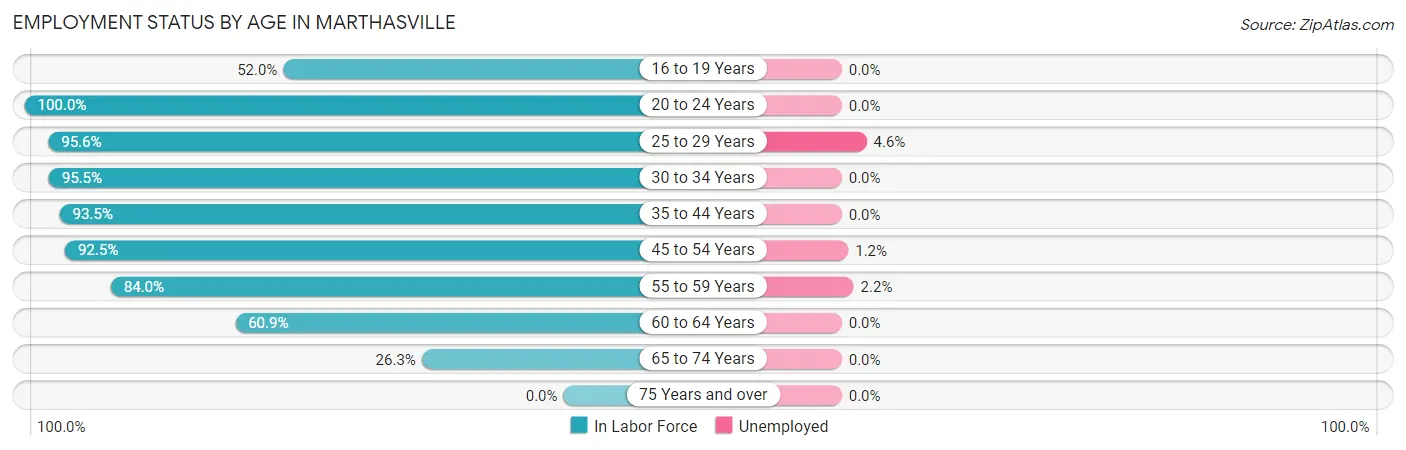
| Age Bracket | In Labor Force | Unemployed |
| 16 to 19 Years | 65 (52.0%) | 0 (0.0%) |
| 20 to 24 Years | 254 (100.0%) | 0 (0.0%) |
| 25 to 29 Years | 87 (95.6%) | 4 (4.6%) |
| 30 to 34 Years | 277 (95.5%) | 0 (0.0%) |
| 35 to 44 Years | 319 (93.5%) | 0 (0.0%) |
| 45 to 54 Years | 343 (92.5%) | 4 (1.2%) |
| 55 to 59 Years | 89 (84.0%) | 2 (2.2%) |
| 60 to 64 Years | 53 (60.9%) | 0 (0.0%) |
| 65 to 74 Years | 36 (26.3%) | 0 (0.0%) |
| 75 Years and over | 0 (0.0%) | 0 (0.0%) |
| Total | 1,522 (83.1%) | 11 (0.7%) |
Employment Status by Educational Attainment in Marthasville
According to labor force statistics for Marthasville, 90.8% of individuals (1,168) out of the total population between 25 and 64 years of age (1,286) are in the labor force, with 0.9% or 11 of them being unemployed. The group with the highest labor force participation rate are those with the educational attainment of bachelor's degree or higher, with 97.4% or 226 individuals in the labor force. Within the labor force, individuals with college / associate degree education have the highest percentage of unemployment, with 1.6% or 8 of them being unemployed.
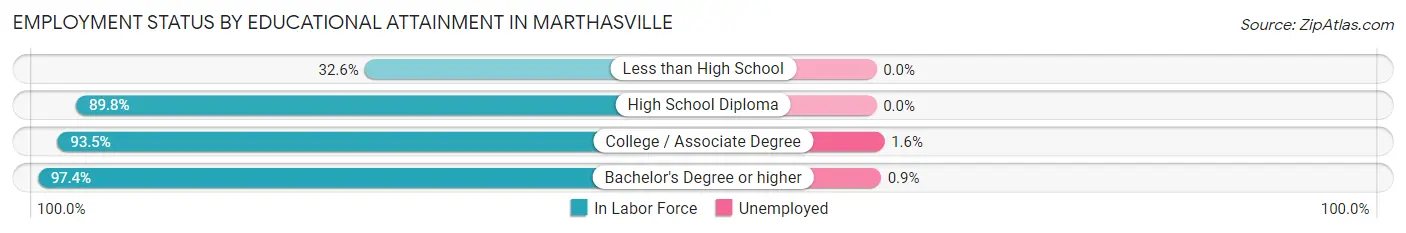
| Educational Attainment | In Labor Force | Unemployed |
| Less than High School | 14 (32.6%) | 0 (0.0%) |
| High School Diploma | 424 (89.8%) | 0 (0.0%) |
| College / Associate Degree | 504 (93.5%) | 9 (1.6%) |
| Bachelor's Degree or higher | 226 (97.4%) | 2 (0.9%) |
| Total | 1,168 (90.8%) | 12 (0.9%) |
Employment Occupations by Sex in Marthasville
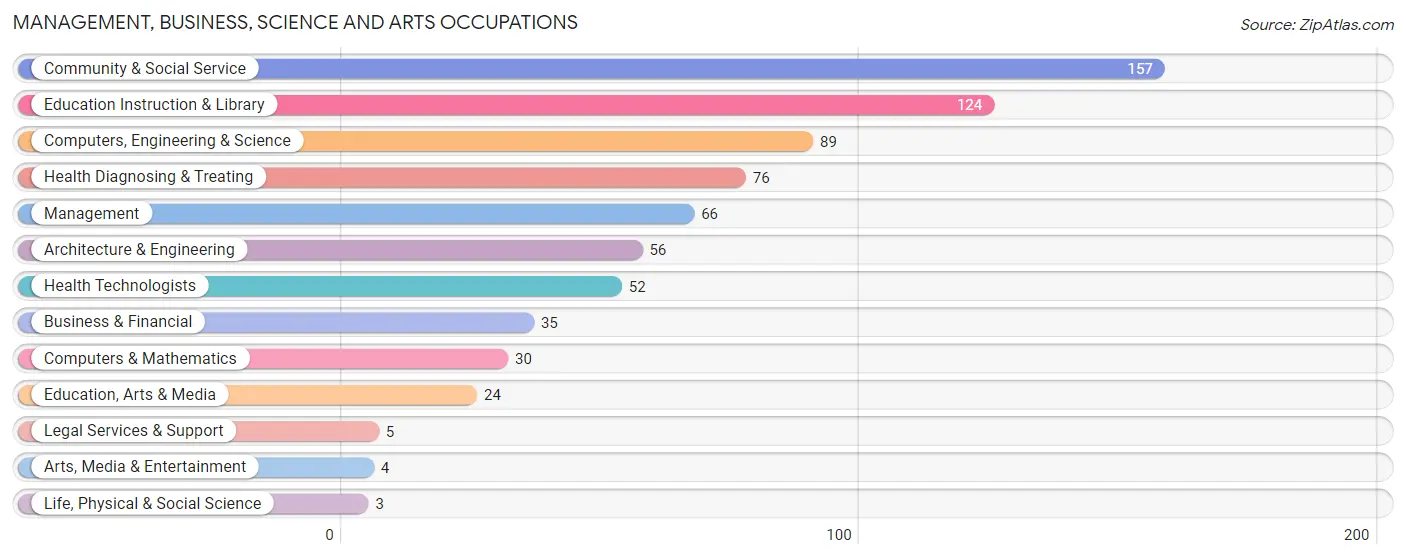
Management, Business, Science and Arts Occupations
The most common Management, Business, Science and Arts occupations in Marthasville are Community & Social Service (157 | 10.4%), Education Instruction & Library (124 | 8.2%), Computers, Engineering & Science (89 | 5.9%), Health Diagnosing & Treating (76 | 5.0%), and Management (66 | 4.4%).
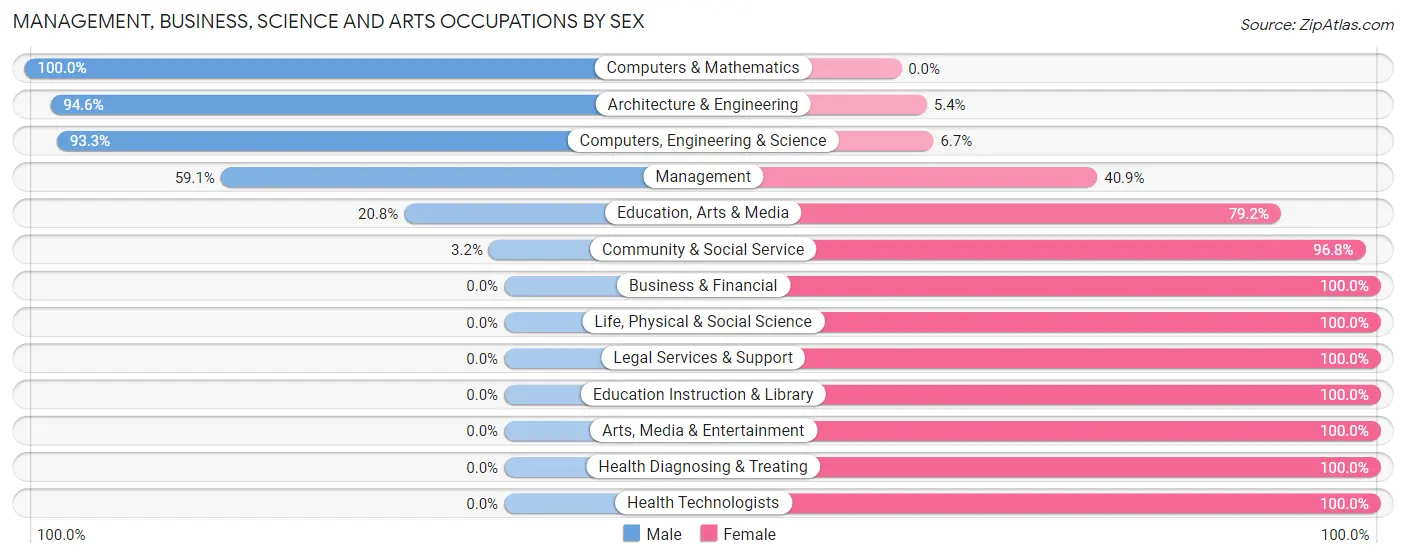
Management, Business, Science and Arts Occupations by Sex
Within the Management, Business, Science and Arts occupations in Marthasville, the most male-oriented occupations are Computers & Mathematics (100.0%), Architecture & Engineering (94.6%), and Computers, Engineering & Science (93.3%), while the most female-oriented occupations are Business & Financial (100.0%), Life, Physical & Social Science (100.0%), and Legal Services & Support (100.0%).
| Occupation | Male | Female |
| Management | 39 (59.1%) | 27 (40.9%) |
| Business & Financial | 0 (0.0%) | 35 (100.0%) |
| Computers, Engineering & Science | 83 (93.3%) | 6 (6.7%) |
| Computers & Mathematics | 30 (100.0%) | 0 (0.0%) |
| Architecture & Engineering | 53 (94.6%) | 3 (5.4%) |
| Life, Physical & Social Science | 0 (0.0%) | 3 (100.0%) |
| Community & Social Service | 5 (3.2%) | 152 (96.8%) |
| Education, Arts & Media | 5 (20.8%) | 19 (79.2%) |
| Legal Services & Support | 0 (0.0%) | 5 (100.0%) |
| Education Instruction & Library | 0 (0.0%) | 124 (100.0%) |
| Arts, Media & Entertainment | 0 (0.0%) | 4 (100.0%) |
| Health Diagnosing & Treating | 0 (0.0%) | 76 (100.0%) |
| Health Technologists | 0 (0.0%) | 52 (100.0%) |
| Total (Category) | 127 (30.0%) | 296 (70.0%) |
| Total (Overall) | 856 (56.6%) | 657 (43.4%) |
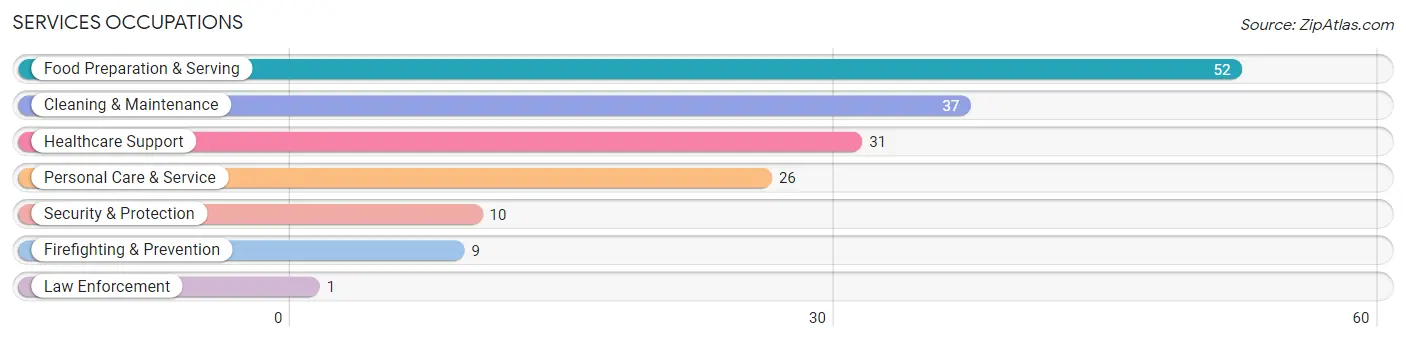
Services Occupations
The most common Services occupations in Marthasville are Food Preparation & Serving (52 | 3.4%), Cleaning & Maintenance (37 | 2.5%), Healthcare Support (31 | 2.1%), Personal Care & Service (26 | 1.7%), and Security & Protection (10 | 0.7%).
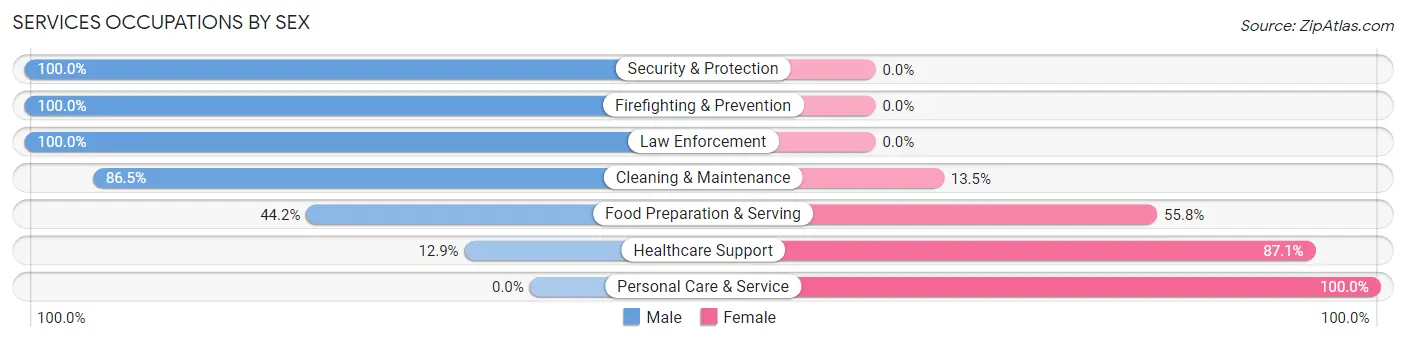
Services Occupations by Sex
Within the Services occupations in Marthasville, the most male-oriented occupations are Security & Protection (100.0%), Firefighting & Prevention (100.0%), and Law Enforcement (100.0%), while the most female-oriented occupations are Personal Care & Service (100.0%), Healthcare Support (87.1%), and Food Preparation & Serving (55.8%).
| Occupation | Male | Female |
| Healthcare Support | 4 (12.9%) | 27 (87.1%) |
| Security & Protection | 10 (100.0%) | 0 (0.0%) |
| Firefighting & Prevention | 9 (100.0%) | 0 (0.0%) |
| Law Enforcement | 1 (100.0%) | 0 (0.0%) |
| Food Preparation & Serving | 23 (44.2%) | 29 (55.8%) |
| Cleaning & Maintenance | 32 (86.5%) | 5 (13.5%) |
| Personal Care & Service | 0 (0.0%) | 26 (100.0%) |
| Total (Category) | 69 (44.2%) | 87 (55.8%) |
| Total (Overall) | 856 (56.6%) | 657 (43.4%) |
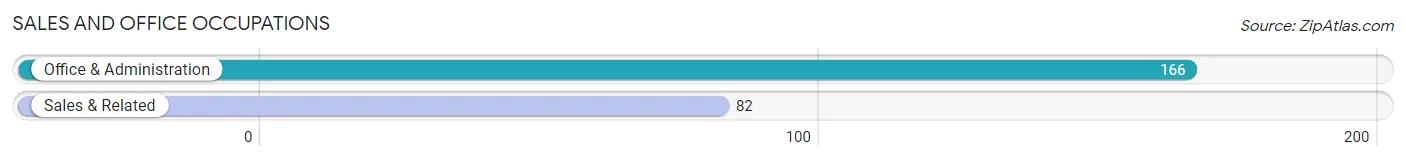
Sales and Office Occupations
The most common Sales and Office occupations in Marthasville are Office & Administration (166 | 11.0%), and Sales & Related (82 | 5.4%).
Sales and Office Occupations by Sex
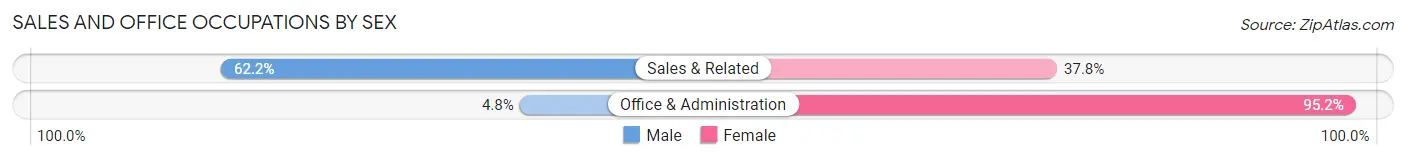
| Occupation | Male | Female |
| Sales & Related | 51 (62.2%) | 31 (37.8%) |
| Office & Administration | 8 (4.8%) | 158 (95.2%) |
| Total (Category) | 59 (23.8%) | 189 (76.2%) |
| Total (Overall) | 856 (56.6%) | 657 (43.4%) |
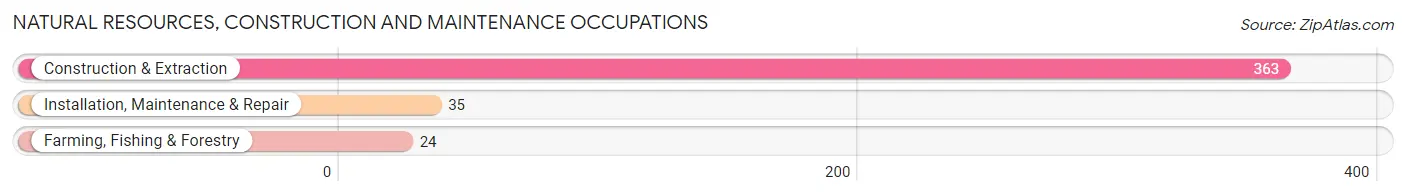
Natural Resources, Construction and Maintenance Occupations
The most common Natural Resources, Construction and Maintenance occupations in Marthasville are Construction & Extraction (363 | 24.0%), Installation, Maintenance & Repair (35 | 2.3%), and Farming, Fishing & Forestry (24 | 1.6%).
Natural Resources, Construction and Maintenance Occupations by Sex
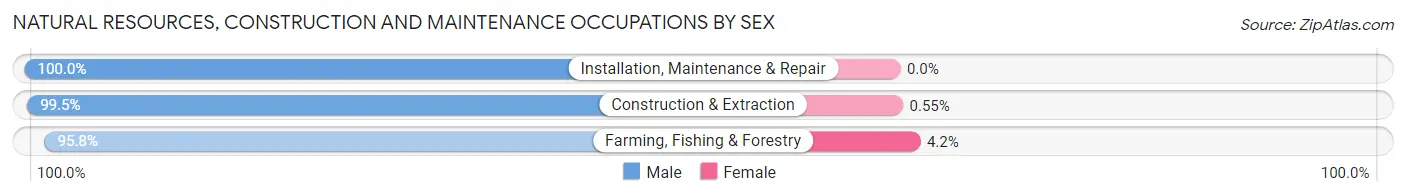
| Occupation | Male | Female |
| Farming, Fishing & Forestry | 23 (95.8%) | 1 (4.2%) |
| Construction & Extraction | 361 (99.5%) | 2 (0.5%) |
| Installation, Maintenance & Repair | 35 (100.0%) | 0 (0.0%) |
| Total (Category) | 419 (99.3%) | 3 (0.7%) |
| Total (Overall) | 856 (56.6%) | 657 (43.4%) |
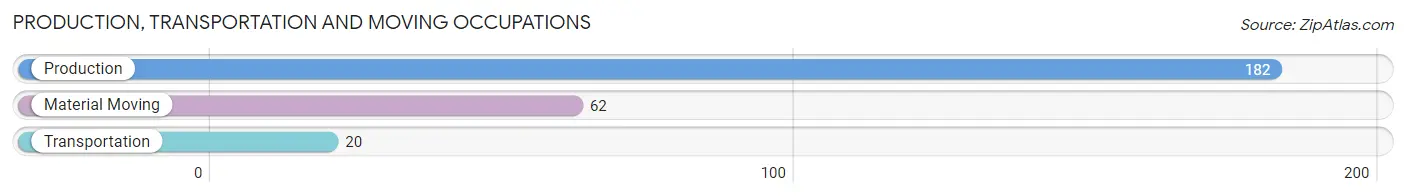
Production, Transportation and Moving Occupations
The most common Production, Transportation and Moving occupations in Marthasville are Production (182 | 12.0%), Material Moving (62 | 4.1%), and Transportation (20 | 1.3%).
Production, Transportation and Moving Occupations by Sex
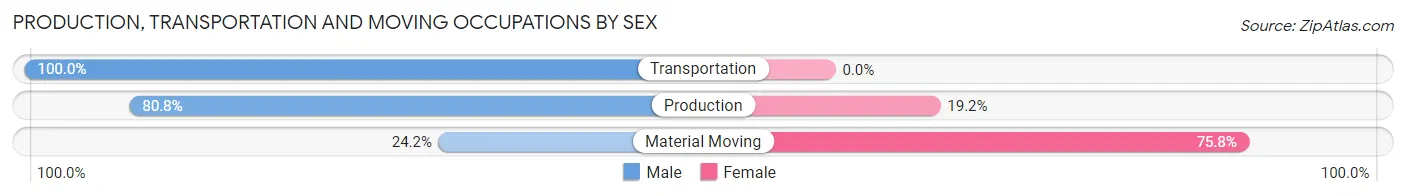
| Occupation | Male | Female |
| Production | 147 (80.8%) | 35 (19.2%) |
| Transportation | 20 (100.0%) | 0 (0.0%) |
| Material Moving | 15 (24.2%) | 47 (75.8%) |
| Total (Category) | 182 (68.9%) | 82 (31.1%) |
| Total (Overall) | 856 (56.6%) | 657 (43.4%) |
Employment Industries by Sex in Marthasville
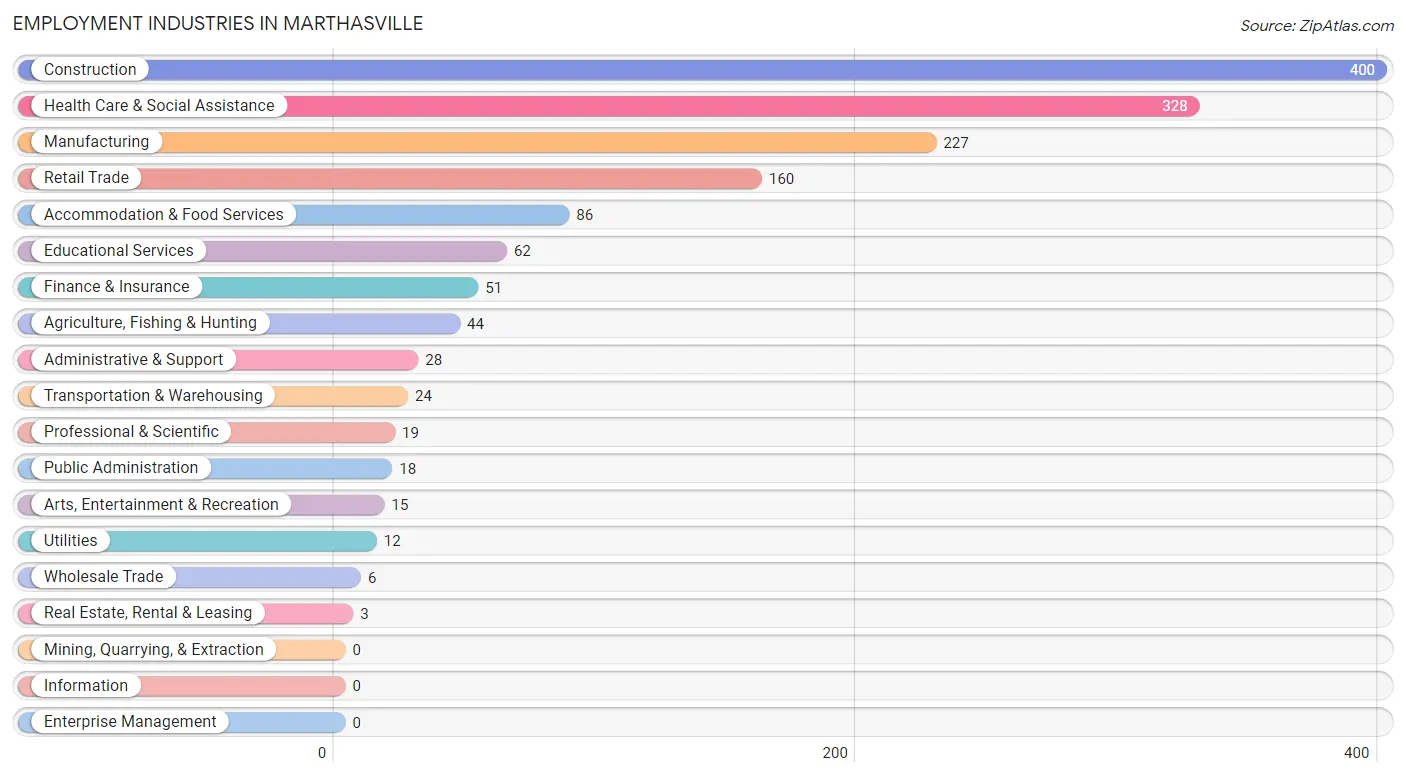
Employment Industries in Marthasville
The major employment industries in Marthasville include Construction (400 | 26.4%), Health Care & Social Assistance (328 | 21.7%), Manufacturing (227 | 15.0%), Retail Trade (160 | 10.6%), and Accommodation & Food Services (86 | 5.7%).
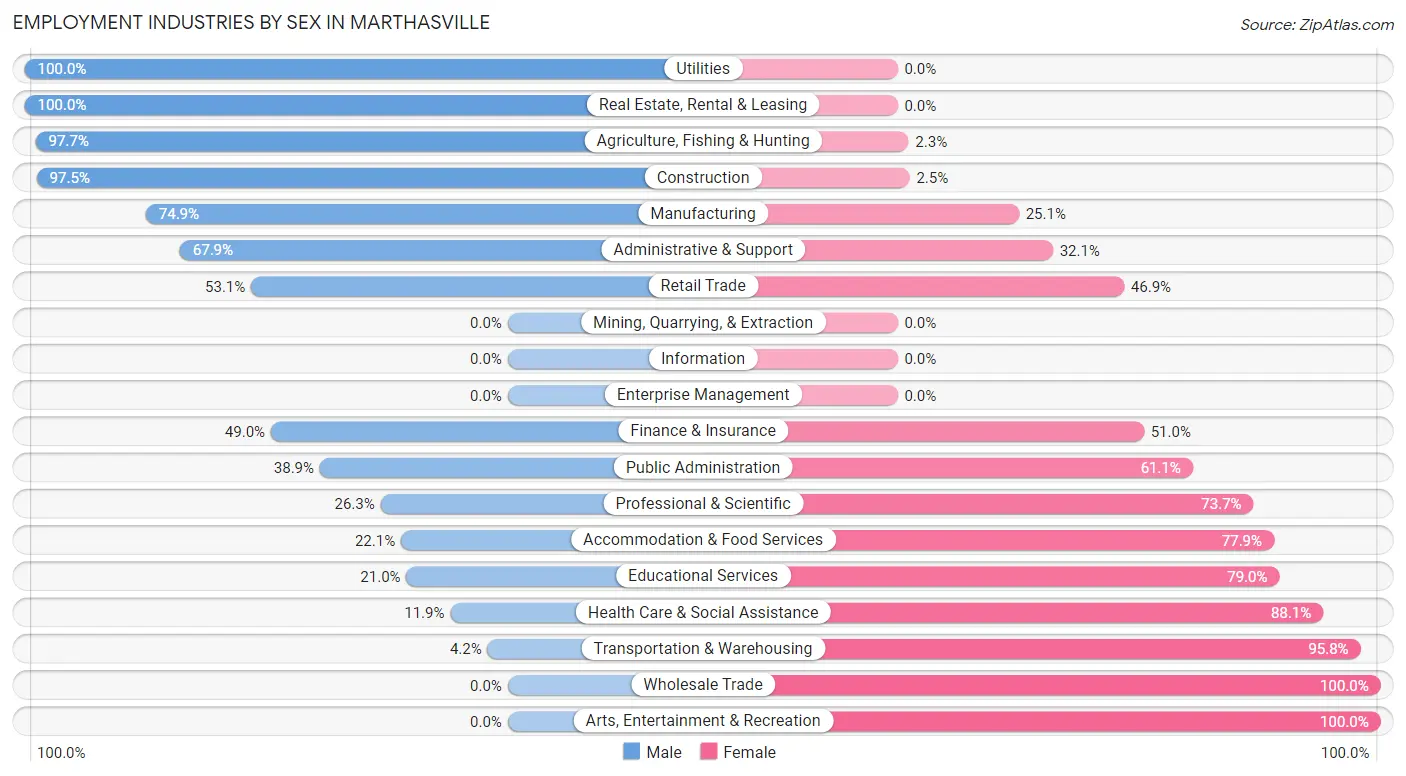
Employment Industries by Sex in Marthasville
The Marthasville industries that see more men than women are Utilities (100.0%), Real Estate, Rental & Leasing (100.0%), and Agriculture, Fishing & Hunting (97.7%), whereas the industries that tend to have a higher number of women are Wholesale Trade (100.0%), Arts, Entertainment & Recreation (100.0%), and Transportation & Warehousing (95.8%).
| Industry | Male | Female |
| Agriculture, Fishing & Hunting | 43 (97.7%) | 1 (2.3%) |
| Mining, Quarrying, & Extraction | 0 (0.0%) | 0 (0.0%) |
| Construction | 390 (97.5%) | 10 (2.5%) |
| Manufacturing | 170 (74.9%) | 57 (25.1%) |
| Wholesale Trade | 0 (0.0%) | 6 (100.0%) |
| Retail Trade | 85 (53.1%) | 75 (46.9%) |
| Transportation & Warehousing | 1 (4.2%) | 23 (95.8%) |
| Utilities | 12 (100.0%) | 0 (0.0%) |
| Information | 0 (0.0%) | 0 (0.0%) |
| Finance & Insurance | 25 (49.0%) | 26 (51.0%) |
| Real Estate, Rental & Leasing | 3 (100.0%) | 0 (0.0%) |
| Professional & Scientific | 5 (26.3%) | 14 (73.7%) |
| Enterprise Management | 0 (0.0%) | 0 (0.0%) |
| Administrative & Support | 19 (67.9%) | 9 (32.1%) |
| Educational Services | 13 (21.0%) | 49 (79.0%) |
| Health Care & Social Assistance | 39 (11.9%) | 289 (88.1%) |
| Arts, Entertainment & Recreation | 0 (0.0%) | 15 (100.0%) |
| Accommodation & Food Services | 19 (22.1%) | 67 (77.9%) |
| Public Administration | 7 (38.9%) | 11 (61.1%) |
| Total | 856 (56.6%) | 657 (43.4%) |
Education in Marthasville
School Enrollment in Marthasville
The most common levels of schooling among the 723 students in Marthasville are elementary school (282 | 39.0%), high school (160 | 22.1%), and middle school (112 | 15.5%).
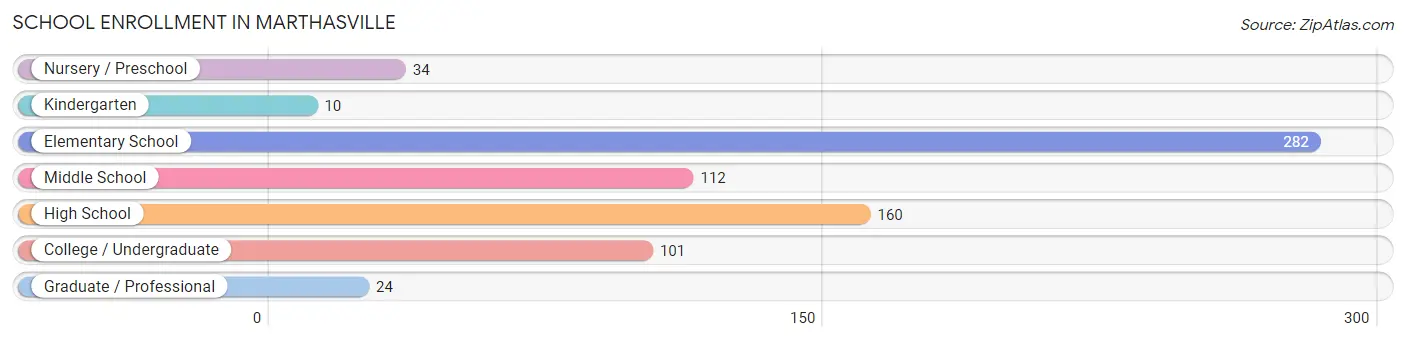
| School Level | # Students | % Students |
| Nursery / Preschool | 34 | 4.7% |
| Kindergarten | 10 | 1.4% |
| Elementary School | 282 | 39.0% |
| Middle School | 112 | 15.5% |
| High School | 160 | 22.1% |
| College / Undergraduate | 101 | 14.0% |
| Graduate / Professional | 24 | 3.3% |
| Total | 723 | 100.0% |
School Enrollment by Age by Funding Source in Marthasville
Out of a total of 723 students who are enrolled in schools in Marthasville, 306 (42.3%) attend a private institution, while the remaining 417 (57.7%) are enrolled in public schools. The age group of 25 to 34 year olds has the highest likelihood of being enrolled in private schools, with 44 (83.0% in the age bracket) enrolled. Conversely, the age group of 15 to 17 year olds has the lowest likelihood of being enrolled in a private school, with 124 (92.5% in the age bracket) attending a public institution.
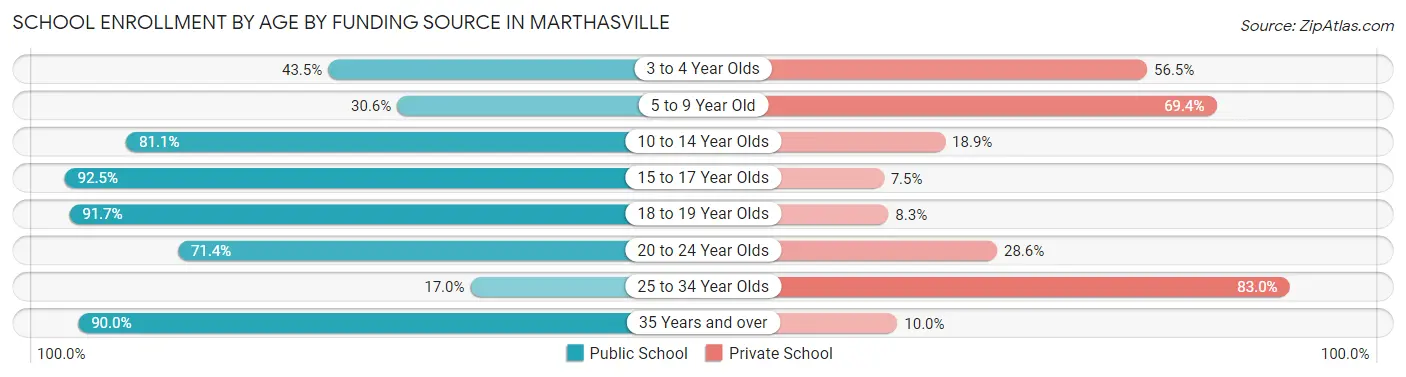
| Age Bracket | Public School | Private School |
| 3 to 4 Year Olds | 10 (43.5%) | 13 (56.5%) |
| 5 to 9 Year Old | 90 (30.6%) | 204 (69.4%) |
| 10 to 14 Year Olds | 103 (81.1%) | 24 (18.9%) |
| 15 to 17 Year Olds | 124 (92.5%) | 10 (7.5%) |
| 18 to 19 Year Olds | 44 (91.7%) | 4 (8.3%) |
| 20 to 24 Year Olds | 10 (71.4%) | 4 (28.6%) |
| 25 to 34 Year Olds | 9 (17.0%) | 44 (83.0%) |
| 35 Years and over | 27 (90.0%) | 3 (10.0%) |
| Total | 417 (57.7%) | 306 (42.3%) |
Educational Attainment by Field of Study in Marthasville
Business (74 | 26.2%), science & technology (51 | 18.1%), liberal arts & history (44 | 15.6%), education (41 | 14.5%), and engineering (18 | 6.4%) are the most common fields of study among 282 individuals in Marthasville who have obtained a bachelor's degree or higher.
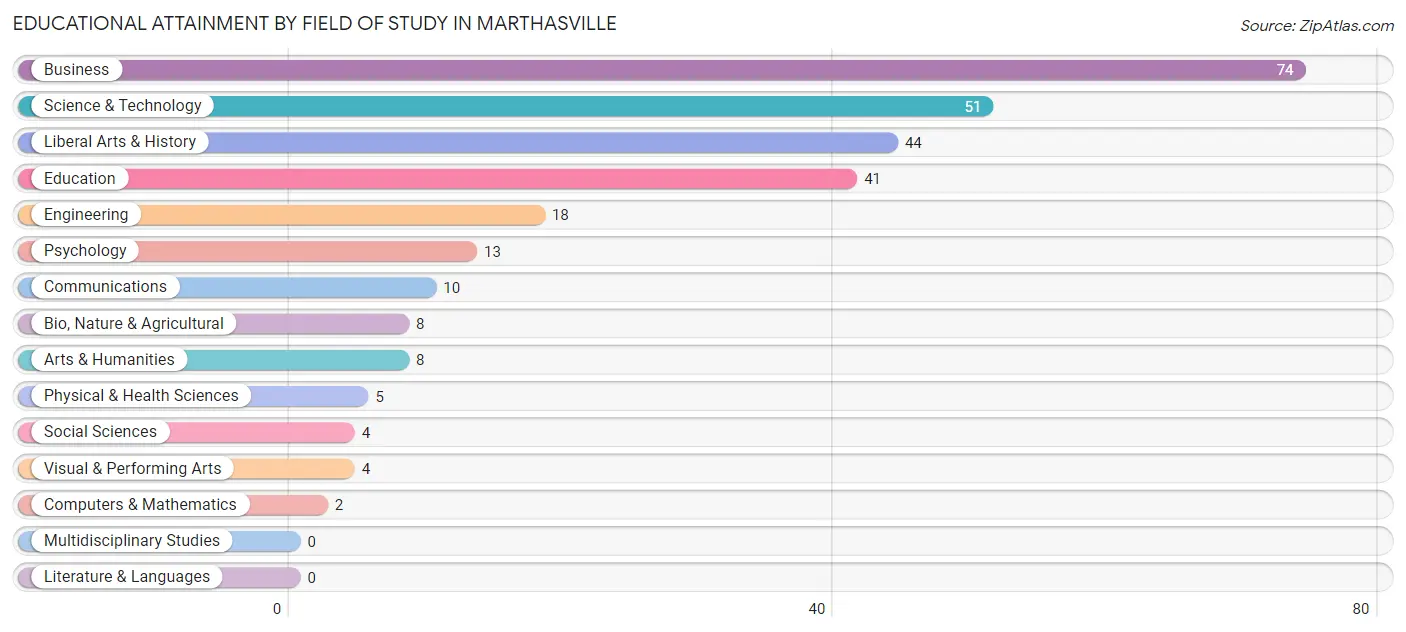
| Field of Study | # Graduates | % Graduates |
| Computers & Mathematics | 2 | 0.7% |
| Bio, Nature & Agricultural | 8 | 2.8% |
| Physical & Health Sciences | 5 | 1.8% |
| Psychology | 13 | 4.6% |
| Social Sciences | 4 | 1.4% |
| Engineering | 18 | 6.4% |
| Multidisciplinary Studies | 0 | 0.0% |
| Science & Technology | 51 | 18.1% |
| Business | 74 | 26.2% |
| Education | 41 | 14.5% |
| Literature & Languages | 0 | 0.0% |
| Liberal Arts & History | 44 | 15.6% |
| Visual & Performing Arts | 4 | 1.4% |
| Communications | 10 | 3.5% |
| Arts & Humanities | 8 | 2.8% |
| Total | 282 | 100.0% |
Transportation & Commute in Marthasville
Vehicle Availability by Sex in Marthasville
The most prevalent vehicle ownership categories in Marthasville are males with 3 vehicles (464, accounting for 55.0%) and females with 3 vehicles (315, making up 73.9%).
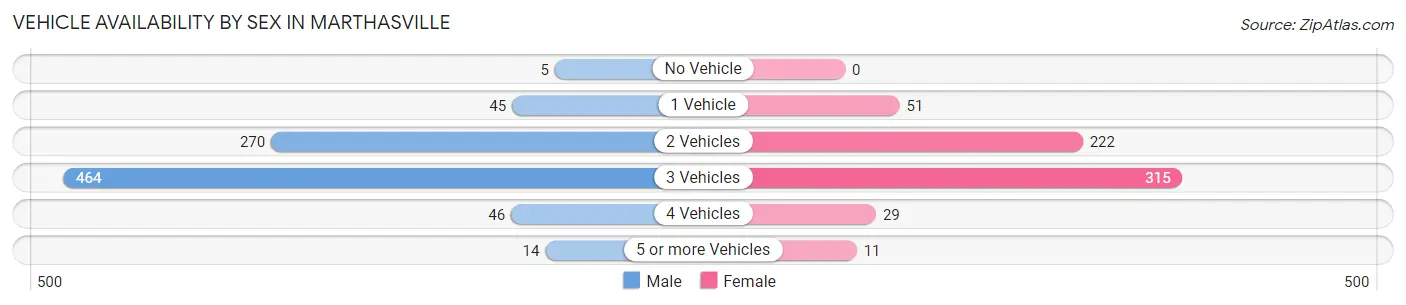
| Vehicles Available | Male | Female |
| No Vehicle | 5 (0.6%) | 0 (0.0%) |
| 1 Vehicle | 45 (5.3%) | 51 (8.1%) |
| 2 Vehicles | 270 (32.0%) | 222 (35.3%) |
| 3 Vehicles | 464 (55.0%) | 315 (50.2%) |
| 4 Vehicles | 46 (5.4%) | 29 (4.6%) |
| 5 or more Vehicles | 14 (1.7%) | 11 (1.8%) |
| Total | 844 (100.0%) | 628 (100.0%) |
Commute Time in Marthasville
The most frequently occuring commute durations in Marthasville are 60 to 89 minutes (387 commuters, 29.2%), 15 to 19 minutes (210 commuters, 15.9%), and 45 to 59 minutes (174 commuters, 13.1%).
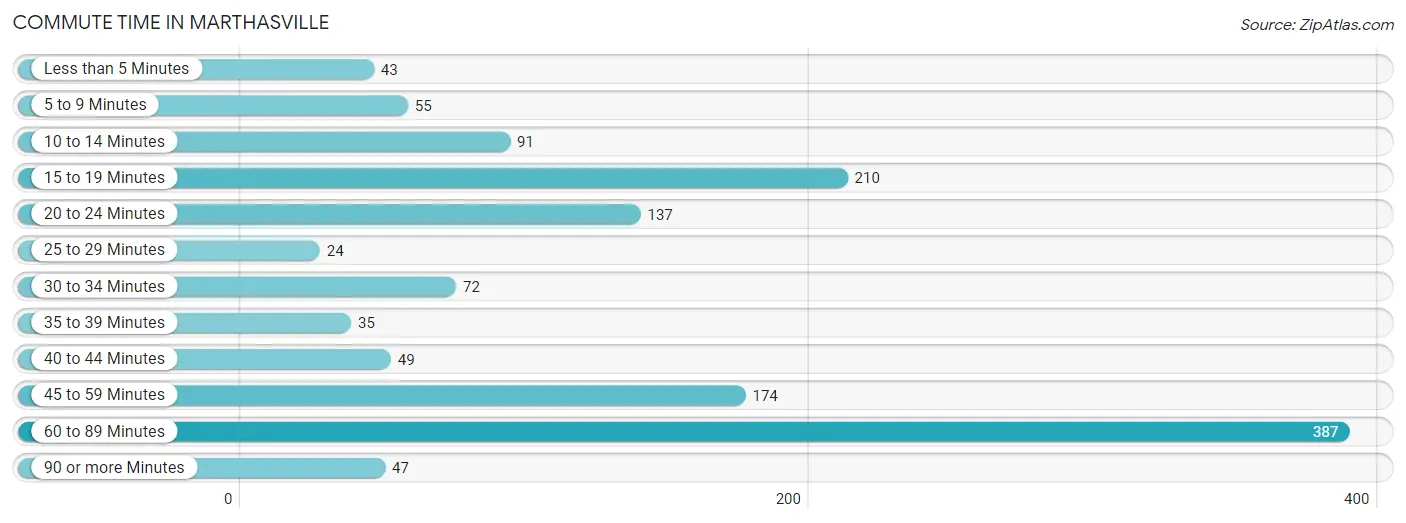
| Commute Time | # Commuters | % Commuters |
| Less than 5 Minutes | 43 | 3.3% |
| 5 to 9 Minutes | 55 | 4.2% |
| 10 to 14 Minutes | 91 | 6.9% |
| 15 to 19 Minutes | 210 | 15.9% |
| 20 to 24 Minutes | 137 | 10.3% |
| 25 to 29 Minutes | 24 | 1.8% |
| 30 to 34 Minutes | 72 | 5.4% |
| 35 to 39 Minutes | 35 | 2.6% |
| 40 to 44 Minutes | 49 | 3.7% |
| 45 to 59 Minutes | 174 | 13.1% |
| 60 to 89 Minutes | 387 | 29.2% |
| 90 or more Minutes | 47 | 3.5% |
Commute Time by Sex in Marthasville
The most common commute times in Marthasville are 60 to 89 minutes (357 commuters, 42.5%) for males and 45 to 59 minutes (111 commuters, 22.9%) for females.
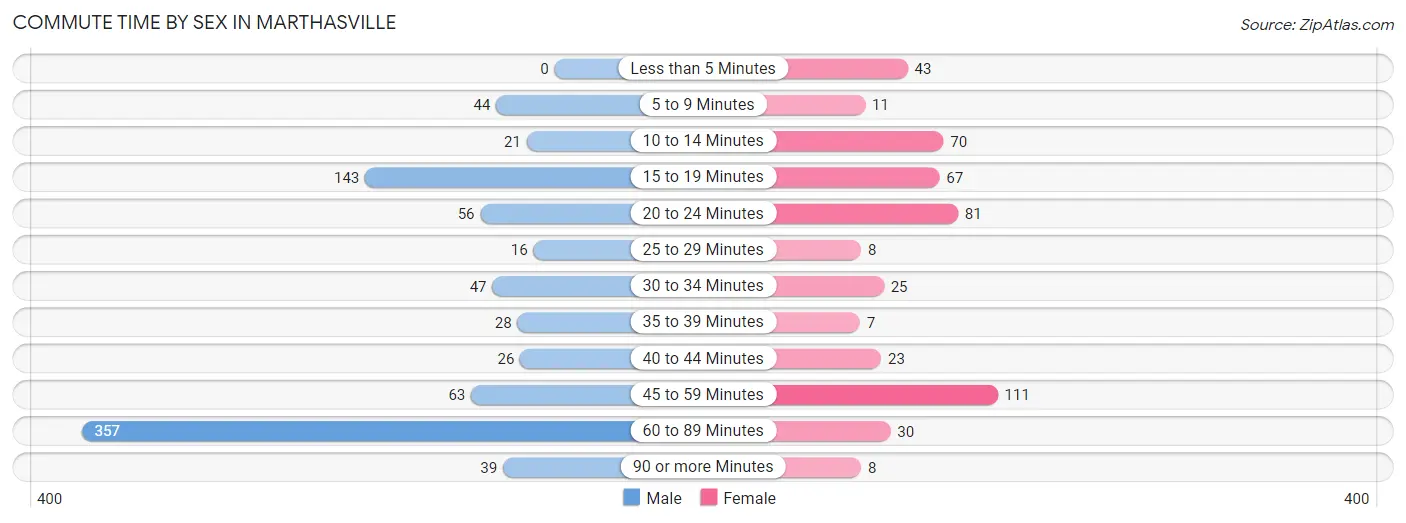
| Commute Time | Male | Female |
| Less than 5 Minutes | 0 (0.0%) | 43 (8.9%) |
| 5 to 9 Minutes | 44 (5.2%) | 11 (2.3%) |
| 10 to 14 Minutes | 21 (2.5%) | 70 (14.5%) |
| 15 to 19 Minutes | 143 (17.0%) | 67 (13.8%) |
| 20 to 24 Minutes | 56 (6.7%) | 81 (16.7%) |
| 25 to 29 Minutes | 16 (1.9%) | 8 (1.7%) |
| 30 to 34 Minutes | 47 (5.6%) | 25 (5.2%) |
| 35 to 39 Minutes | 28 (3.3%) | 7 (1.5%) |
| 40 to 44 Minutes | 26 (3.1%) | 23 (4.8%) |
| 45 to 59 Minutes | 63 (7.5%) | 111 (22.9%) |
| 60 to 89 Minutes | 357 (42.5%) | 30 (6.2%) |
| 90 or more Minutes | 39 (4.6%) | 8 (1.7%) |
Time of Departure to Work by Sex in Marthasville
The most frequent times of departure to work in Marthasville are 5:30 AM to 5:59 AM (222, 26.4%) for males and 6:00 AM to 6:29 AM (93, 19.2%) for females.
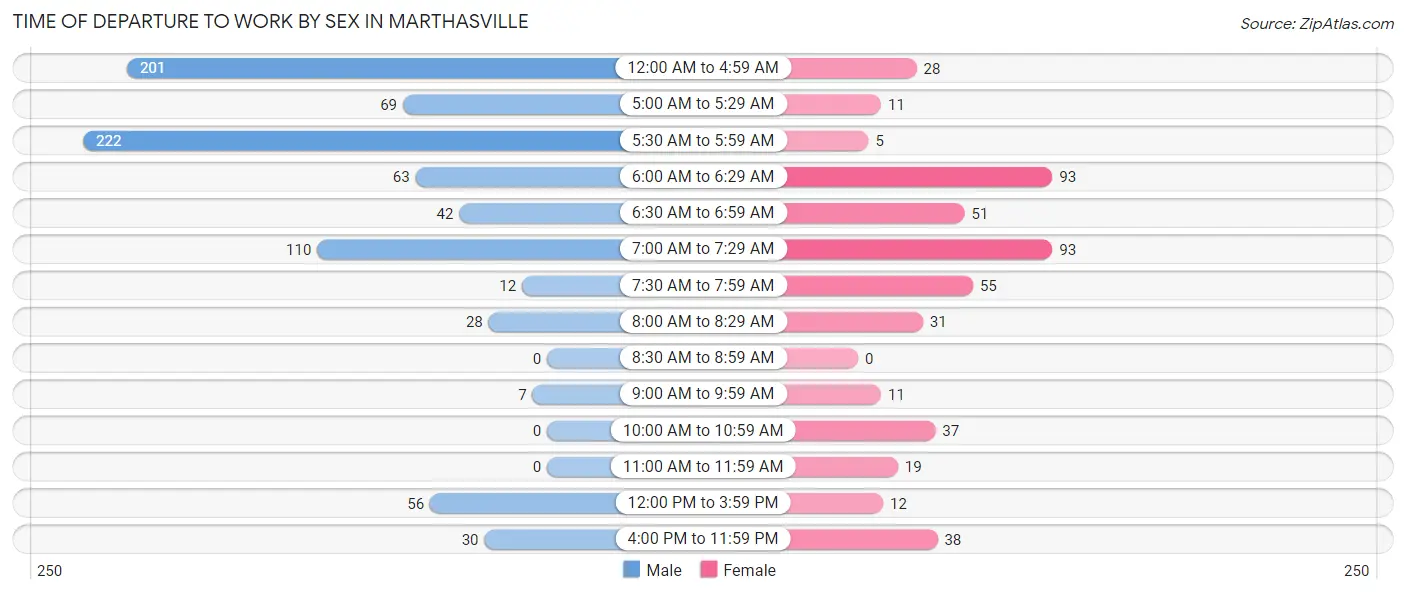
| Time of Departure | Male | Female |
| 12:00 AM to 4:59 AM | 201 (23.9%) | 28 (5.8%) |
| 5:00 AM to 5:29 AM | 69 (8.2%) | 11 (2.3%) |
| 5:30 AM to 5:59 AM | 222 (26.4%) | 5 (1.0%) |
| 6:00 AM to 6:29 AM | 63 (7.5%) | 93 (19.2%) |
| 6:30 AM to 6:59 AM | 42 (5.0%) | 51 (10.5%) |
| 7:00 AM to 7:29 AM | 110 (13.1%) | 93 (19.2%) |
| 7:30 AM to 7:59 AM | 12 (1.4%) | 55 (11.4%) |
| 8:00 AM to 8:29 AM | 28 (3.3%) | 31 (6.4%) |
| 8:30 AM to 8:59 AM | 0 (0.0%) | 0 (0.0%) |
| 9:00 AM to 9:59 AM | 7 (0.8%) | 11 (2.3%) |
| 10:00 AM to 10:59 AM | 0 (0.0%) | 37 (7.6%) |
| 11:00 AM to 11:59 AM | 0 (0.0%) | 19 (3.9%) |
| 12:00 PM to 3:59 PM | 56 (6.7%) | 12 (2.5%) |
| 4:00 PM to 11:59 PM | 30 (3.6%) | 38 (7.9%) |
| Total | 840 (100.0%) | 484 (100.0%) |
Housing Occupancy in Marthasville
Occupancy by Ownership in Marthasville
Of the total 778 dwellings in Marthasville, owner-occupied units account for 672 (86.4%), while renter-occupied units make up 106 (13.6%).
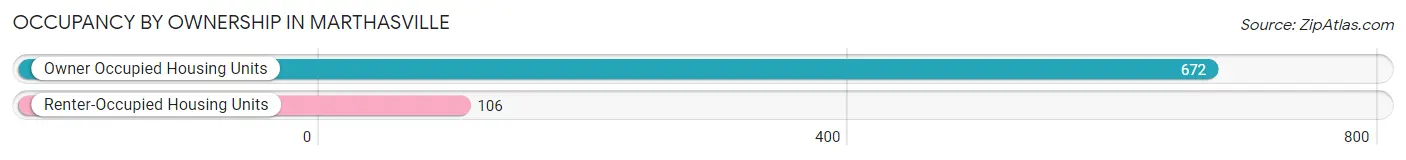
| Occupancy | # Housing Units | % Housing Units |
| Owner Occupied Housing Units | 672 | 86.4% |
| Renter-Occupied Housing Units | 106 | 13.6% |
| Total Occupied Housing Units | 778 | 100.0% |
Occupancy by Household Size in Marthasville
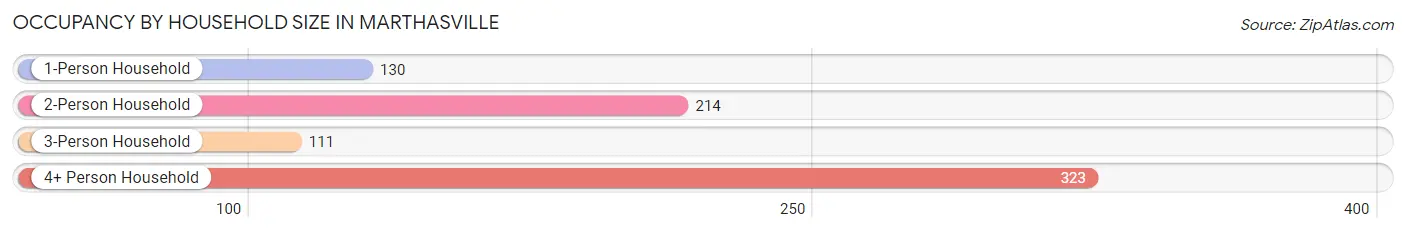
| Household Size | # Housing Units | % Housing Units |
| 1-Person Household | 130 | 16.7% |
| 2-Person Household | 214 | 27.5% |
| 3-Person Household | 111 | 14.3% |
| 4+ Person Household | 323 | 41.5% |
| Total Housing Units | 778 | 100.0% |
Occupancy by Ownership by Household Size in Marthasville
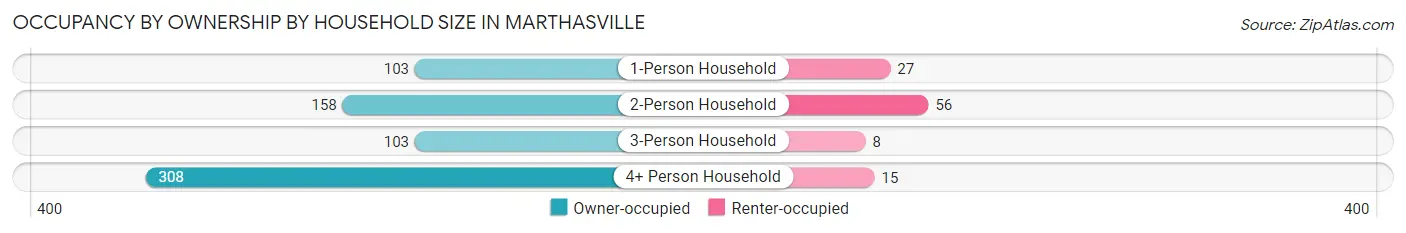
| Household Size | Owner-occupied | Renter-occupied |
| 1-Person Household | 103 (79.2%) | 27 (20.8%) |
| 2-Person Household | 158 (73.8%) | 56 (26.2%) |
| 3-Person Household | 103 (92.8%) | 8 (7.2%) |
| 4+ Person Household | 308 (95.4%) | 15 (4.6%) |
| Total Housing Units | 672 (86.4%) | 106 (13.6%) |
Occupancy by Educational Attainment in Marthasville
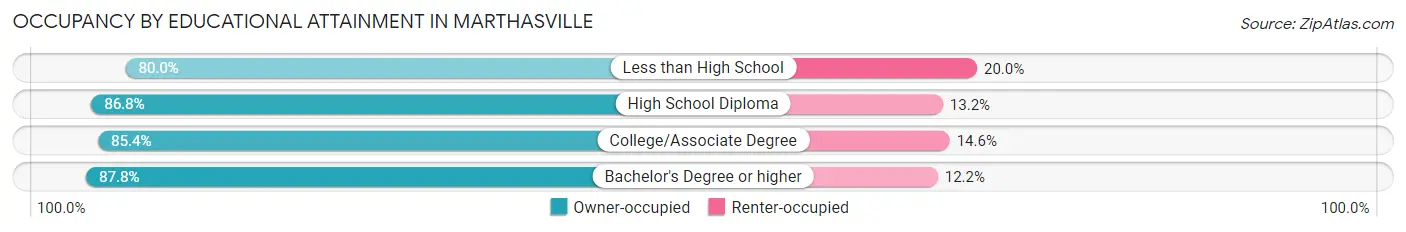
| Household Size | Owner-occupied | Renter-occupied |
| Less than High School | 12 (80.0%) | 3 (20.0%) |
| High School Diploma | 269 (86.8%) | 41 (13.2%) |
| College/Associate Degree | 240 (85.4%) | 41 (14.6%) |
| Bachelor's Degree or higher | 151 (87.8%) | 21 (12.2%) |
Occupancy by Age of Householder in Marthasville
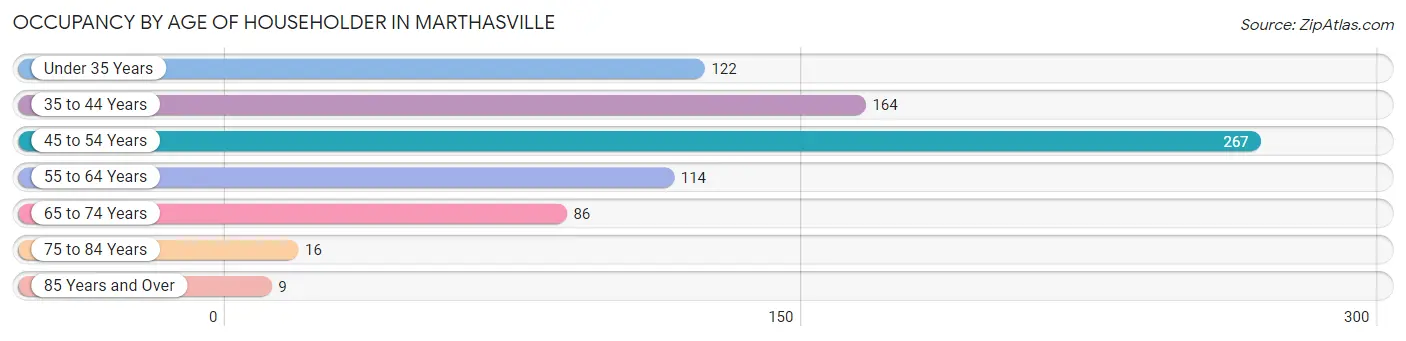
| Age Bracket | # Households | % Households |
| Under 35 Years | 122 | 15.7% |
| 35 to 44 Years | 164 | 21.1% |
| 45 to 54 Years | 267 | 34.3% |
| 55 to 64 Years | 114 | 14.6% |
| 65 to 74 Years | 86 | 11.1% |
| 75 to 84 Years | 16 | 2.1% |
| 85 Years and Over | 9 | 1.2% |
| Total | 778 | 100.0% |
Housing Finances in Marthasville
Median Income by Occupancy in Marthasville
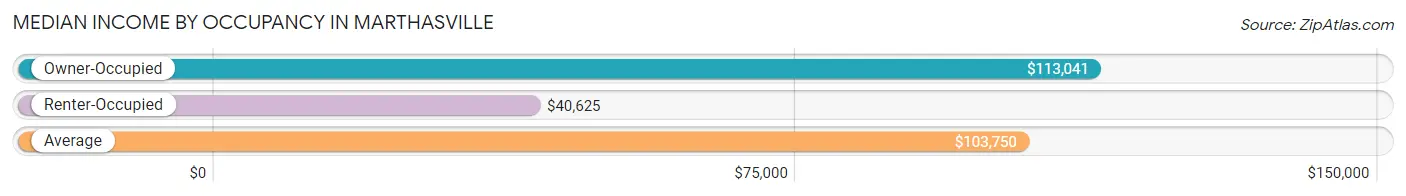
| Occupancy Type | # Households | Median Income |
| Owner-Occupied | 672 (86.4%) | $113,041 |
| Renter-Occupied | 106 (13.6%) | $40,625 |
| Average | 778 (100.0%) | $103,750 |
Occupancy by Householder Income Bracket in Marthasville
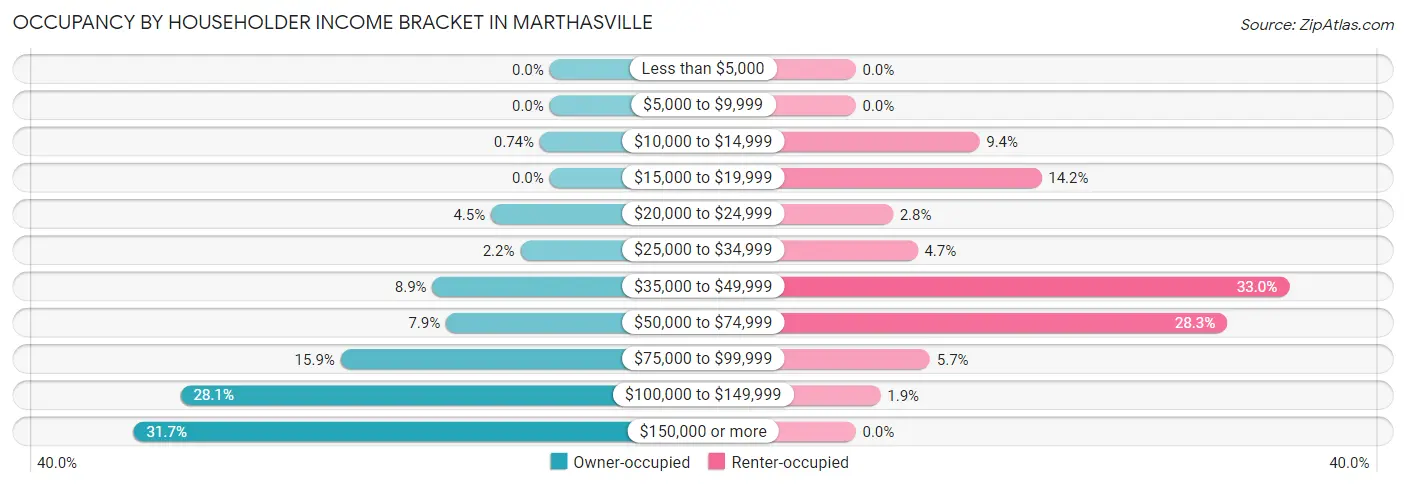
| Income Bracket | Owner-occupied | Renter-occupied |
| Less than $5,000 | 0 (0.0%) | 0 (0.0%) |
| $5,000 to $9,999 | 0 (0.0%) | 0 (0.0%) |
| $10,000 to $14,999 | 5 (0.7%) | 10 (9.4%) |
| $15,000 to $19,999 | 0 (0.0%) | 15 (14.1%) |
| $20,000 to $24,999 | 30 (4.5%) | 3 (2.8%) |
| $25,000 to $34,999 | 15 (2.2%) | 5 (4.7%) |
| $35,000 to $49,999 | 60 (8.9%) | 35 (33.0%) |
| $50,000 to $74,999 | 53 (7.9%) | 30 (28.3%) |
| $75,000 to $99,999 | 107 (15.9%) | 6 (5.7%) |
| $100,000 to $149,999 | 189 (28.1%) | 2 (1.9%) |
| $150,000 or more | 213 (31.7%) | 0 (0.0%) |
| Total | 672 (100.0%) | 106 (100.0%) |
Monthly Housing Cost Tiers in Marthasville
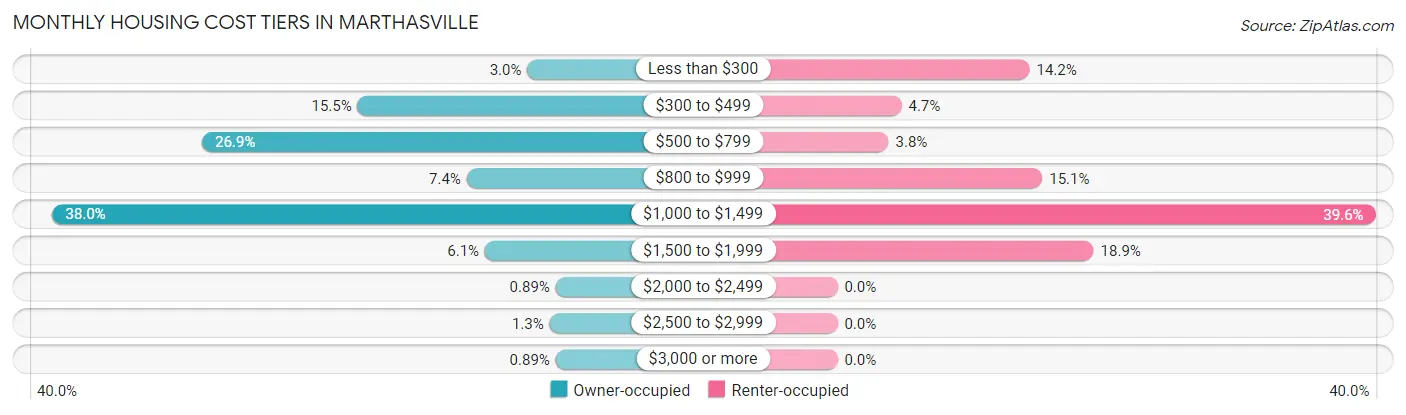
| Monthly Cost | Owner-occupied | Renter-occupied |
| Less than $300 | 20 (3.0%) | 15 (14.1%) |
| $300 to $499 | 104 (15.5%) | 5 (4.7%) |
| $500 to $799 | 181 (26.9%) | 4 (3.8%) |
| $800 to $999 | 50 (7.4%) | 16 (15.1%) |
| $1,000 to $1,499 | 255 (38.0%) | 42 (39.6%) |
| $1,500 to $1,999 | 41 (6.1%) | 20 (18.9%) |
| $2,000 to $2,499 | 6 (0.9%) | 0 (0.0%) |
| $2,500 to $2,999 | 9 (1.3%) | 0 (0.0%) |
| $3,000 or more | 6 (0.9%) | 0 (0.0%) |
| Total | 672 (100.0%) | 106 (100.0%) |
Physical Housing Characteristics in Marthasville
Housing Structures in Marthasville
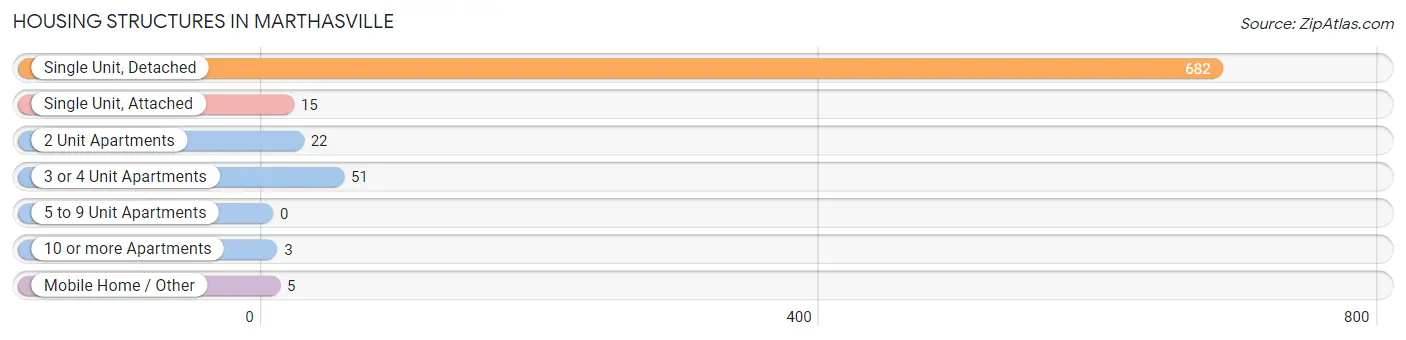
| Structure Type | # Housing Units | % Housing Units |
| Single Unit, Detached | 682 | 87.7% |
| Single Unit, Attached | 15 | 1.9% |
| 2 Unit Apartments | 22 | 2.8% |
| 3 or 4 Unit Apartments | 51 | 6.6% |
| 5 to 9 Unit Apartments | 0 | 0.0% |
| 10 or more Apartments | 3 | 0.4% |
| Mobile Home / Other | 5 | 0.6% |
| Total | 778 | 100.0% |
Housing Structures by Occupancy in Marthasville
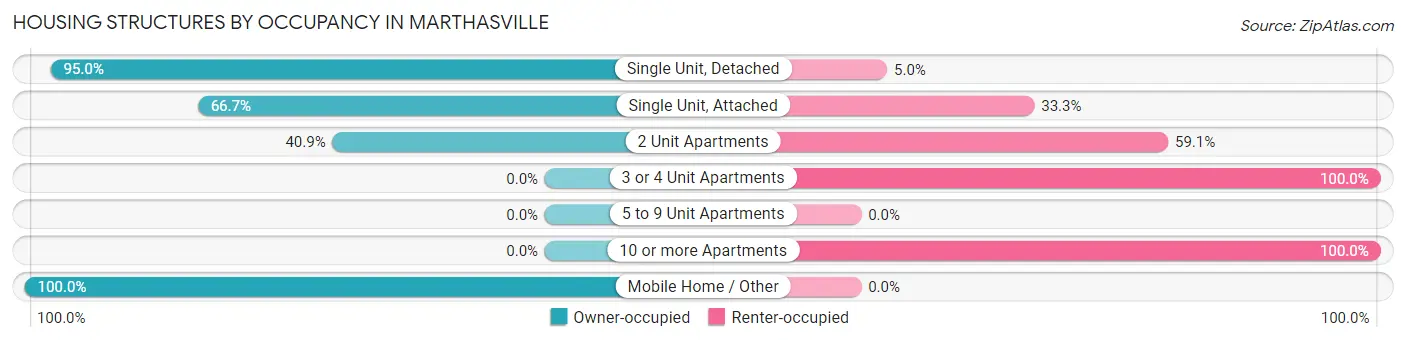
| Structure Type | Owner-occupied | Renter-occupied |
| Single Unit, Detached | 648 (95.0%) | 34 (5.0%) |
| Single Unit, Attached | 10 (66.7%) | 5 (33.3%) |
| 2 Unit Apartments | 9 (40.9%) | 13 (59.1%) |
| 3 or 4 Unit Apartments | 0 (0.0%) | 51 (100.0%) |
| 5 to 9 Unit Apartments | 0 (0.0%) | 0 (0.0%) |
| 10 or more Apartments | 0 (0.0%) | 3 (100.0%) |
| Mobile Home / Other | 5 (100.0%) | 0 (0.0%) |
| Total | 672 (86.4%) | 106 (13.6%) |
Housing Structures by Number of Rooms in Marthasville
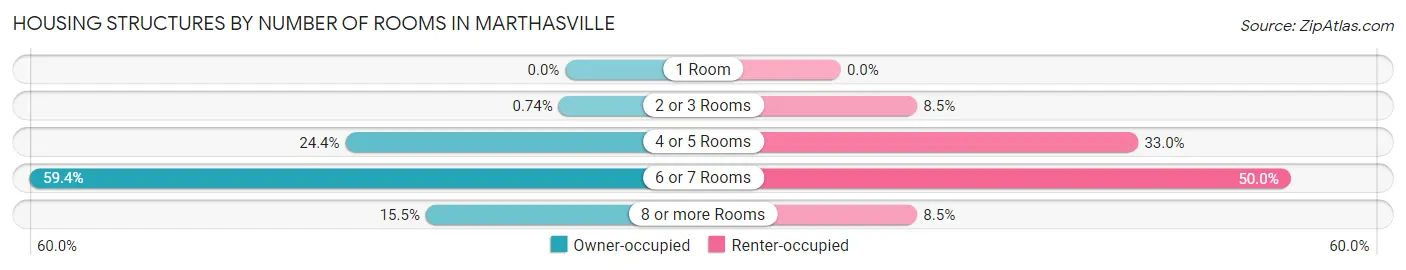
| Number of Rooms | Owner-occupied | Renter-occupied |
| 1 Room | 0 (0.0%) | 0 (0.0%) |
| 2 or 3 Rooms | 5 (0.7%) | 9 (8.5%) |
| 4 or 5 Rooms | 164 (24.4%) | 35 (33.0%) |
| 6 or 7 Rooms | 399 (59.4%) | 53 (50.0%) |
| 8 or more Rooms | 104 (15.5%) | 9 (8.5%) |
| Total | 672 (100.0%) | 106 (100.0%) |
Housing Structure by Heating Type in Marthasville
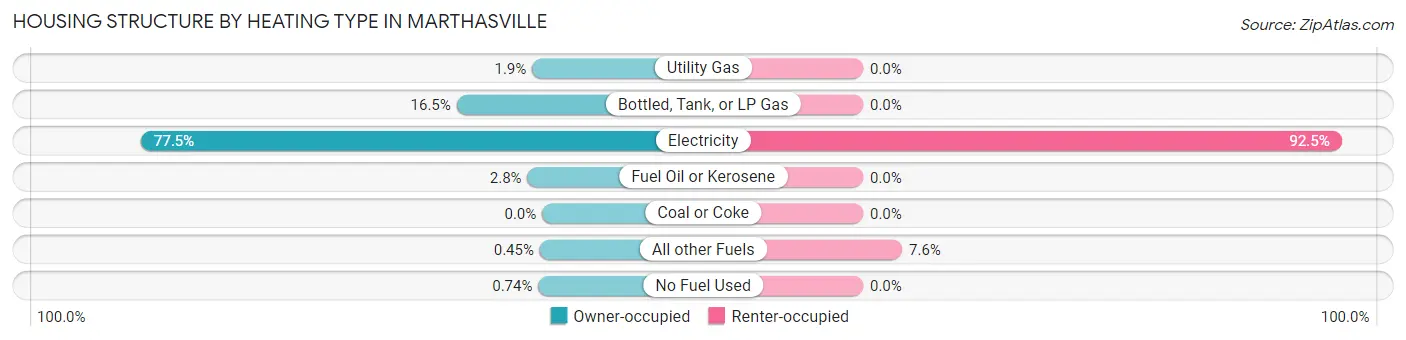
| Heating Type | Owner-occupied | Renter-occupied |
| Utility Gas | 13 (1.9%) | 0 (0.0%) |
| Bottled, Tank, or LP Gas | 111 (16.5%) | 0 (0.0%) |
| Electricity | 521 (77.5%) | 98 (92.4%) |
| Fuel Oil or Kerosene | 19 (2.8%) | 0 (0.0%) |
| Coal or Coke | 0 (0.0%) | 0 (0.0%) |
| All other Fuels | 3 (0.4%) | 8 (7.5%) |
| No Fuel Used | 5 (0.7%) | 0 (0.0%) |
| Total | 672 (100.0%) | 106 (100.0%) |
Household Vehicle Usage in Marthasville
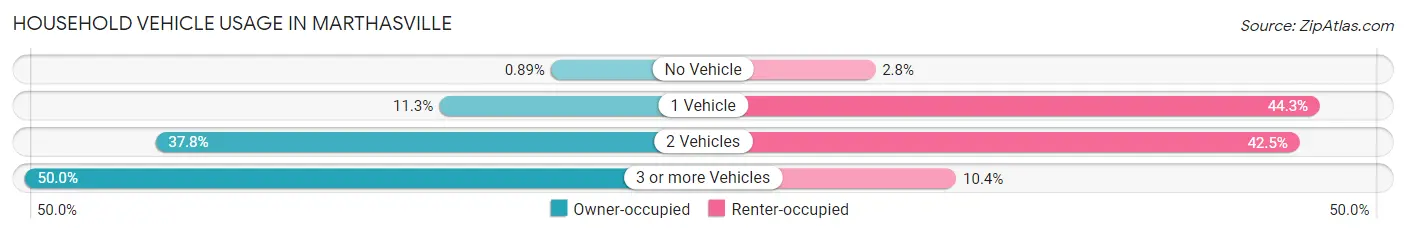
| Vehicles per Household | Owner-occupied | Renter-occupied |
| No Vehicle | 6 (0.9%) | 3 (2.8%) |
| 1 Vehicle | 76 (11.3%) | 47 (44.3%) |
| 2 Vehicles | 254 (37.8%) | 45 (42.4%) |
| 3 or more Vehicles | 336 (50.0%) | 11 (10.4%) |
| Total | 672 (100.0%) | 106 (100.0%) |
Real Estate & Mortgages in Marthasville
Real Estate and Mortgage Overview in Marthasville
| Characteristic | Without Mortgage | With Mortgage |
| Housing Units | 154 | 518 |
| Median Property Value | $157,500 | $155,300 |
| Median Household Income | $95,833 | $188 |
| Monthly Housing Costs | $402 | $6 |
| Real Estate Taxes | $1,336 | $0 |
Property Value by Mortgage Status in Marthasville
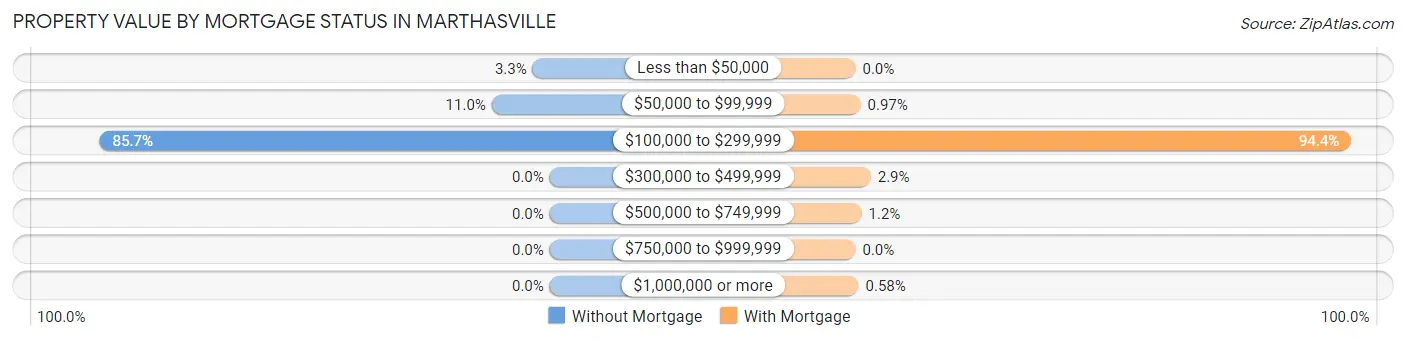
| Property Value | Without Mortgage | With Mortgage |
| Less than $50,000 | 5 (3.3%) | 0 (0.0%) |
| $50,000 to $99,999 | 17 (11.0%) | 5 (1.0%) |
| $100,000 to $299,999 | 132 (85.7%) | 489 (94.4%) |
| $300,000 to $499,999 | 0 (0.0%) | 15 (2.9%) |
| $500,000 to $749,999 | 0 (0.0%) | 6 (1.2%) |
| $750,000 to $999,999 | 0 (0.0%) | 0 (0.0%) |
| $1,000,000 or more | 0 (0.0%) | 3 (0.6%) |
| Total | 154 (100.0%) | 518 (100.0%) |
Household Income by Mortgage Status in Marthasville
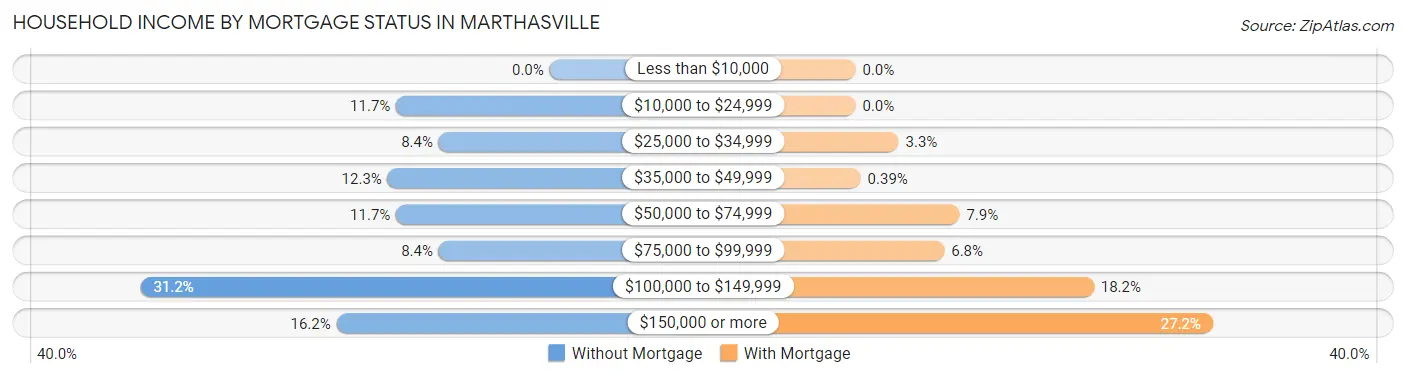
| Household Income | Without Mortgage | With Mortgage |
| Less than $10,000 | 0 (0.0%) | 0 (0.0%) |
| $10,000 to $24,999 | 18 (11.7%) | 0 (0.0%) |
| $25,000 to $34,999 | 13 (8.4%) | 17 (3.3%) |
| $35,000 to $49,999 | 19 (12.3%) | 2 (0.4%) |
| $50,000 to $74,999 | 18 (11.7%) | 41 (7.9%) |
| $75,000 to $99,999 | 13 (8.4%) | 35 (6.8%) |
| $100,000 to $149,999 | 48 (31.2%) | 94 (18.1%) |
| $150,000 or more | 25 (16.2%) | 141 (27.2%) |
| Total | 154 (100.0%) | 518 (100.0%) |
Property Value to Household Income Ratio in Marthasville
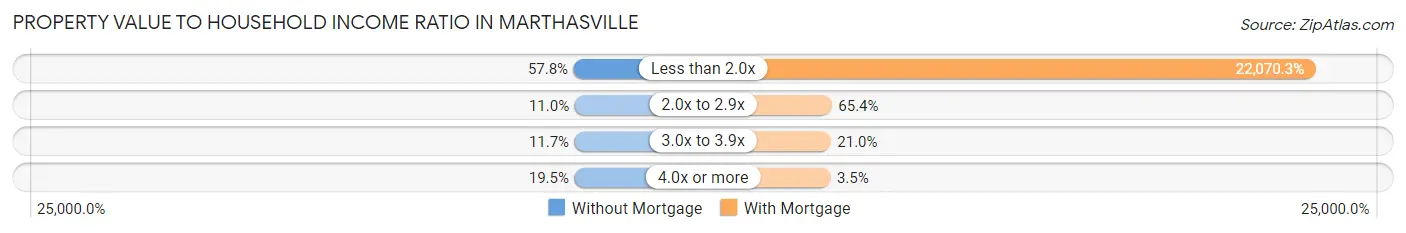
| Value-to-Income Ratio | Without Mortgage | With Mortgage |
| Less than 2.0x | 89 (57.8%) | 114,324 (22,070.3%) |
| 2.0x to 2.9x | 17 (11.0%) | 339 (65.4%) |
| 3.0x to 3.9x | 18 (11.7%) | 109 (21.0%) |
| 4.0x or more | 30 (19.5%) | 18 (3.5%) |
| Total | 154 (100.0%) | 518 (100.0%) |
Real Estate Taxes by Mortgage Status in Marthasville
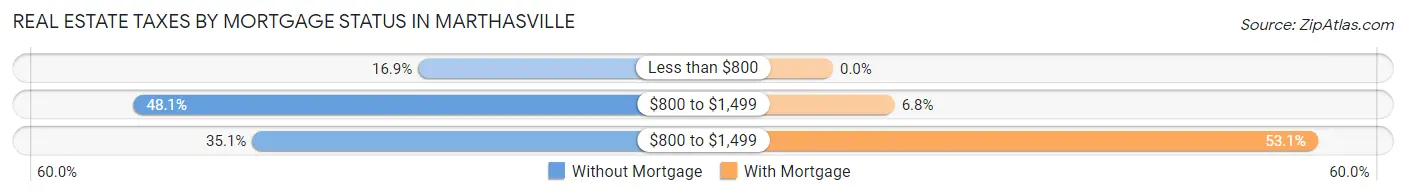
| Property Taxes | Without Mortgage | With Mortgage |
| Less than $800 | 26 (16.9%) | 0 (0.0%) |
| $800 to $1,499 | 74 (48.0%) | 35 (6.8%) |
| $800 to $1,499 | 54 (35.1%) | 275 (53.1%) |
| Total | 154 (100.0%) | 518 (100.0%) |
Health & Disability in Marthasville
Health Insurance Coverage by Age in Marthasville
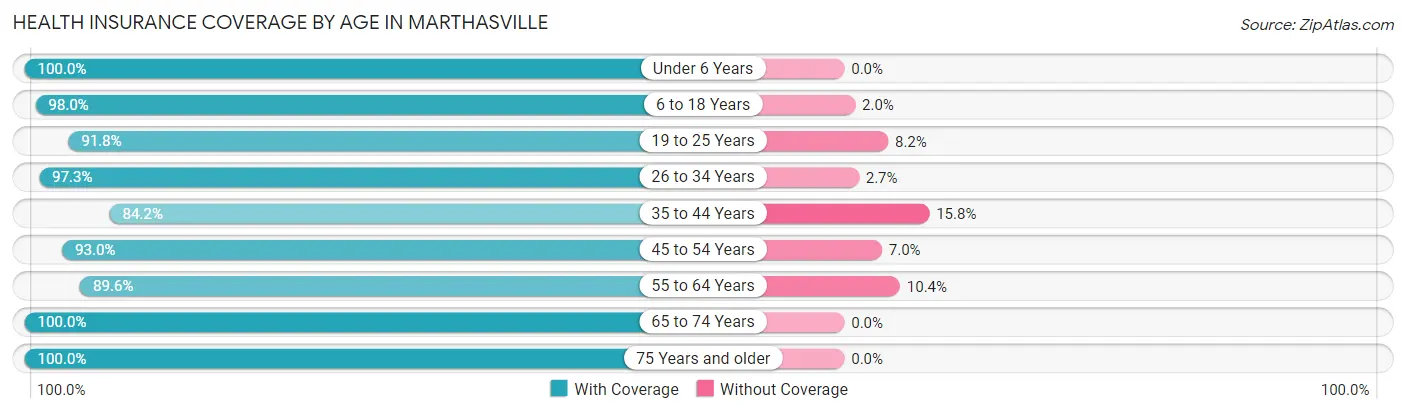
| Age Bracket | With Coverage | Without Coverage |
| Under 6 Years | 149 (100.0%) | 0 (0.0%) |
| 6 to 18 Years | 727 (98.0%) | 15 (2.0%) |
| 19 to 25 Years | 259 (91.8%) | 23 (8.2%) |
| 26 to 34 Years | 361 (97.3%) | 10 (2.7%) |
| 35 to 44 Years | 287 (84.2%) | 54 (15.8%) |
| 45 to 54 Years | 345 (93.0%) | 26 (7.0%) |
| 55 to 64 Years | 173 (89.6%) | 20 (10.4%) |
| 65 to 74 Years | 137 (100.0%) | 0 (0.0%) |
| 75 Years and older | 30 (100.0%) | 0 (0.0%) |
| Total | 2,468 (94.3%) | 148 (5.7%) |
Health Insurance Coverage by Citizenship Status in Marthasville
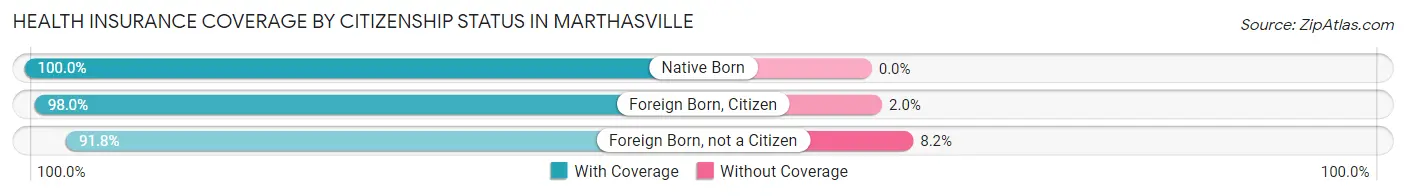
| Citizenship Status | With Coverage | Without Coverage |
| Native Born | 149 (100.0%) | 0 (0.0%) |
| Foreign Born, Citizen | 727 (98.0%) | 15 (2.0%) |
| Foreign Born, not a Citizen | 259 (91.8%) | 23 (8.2%) |
Health Insurance Coverage by Household Income in Marthasville
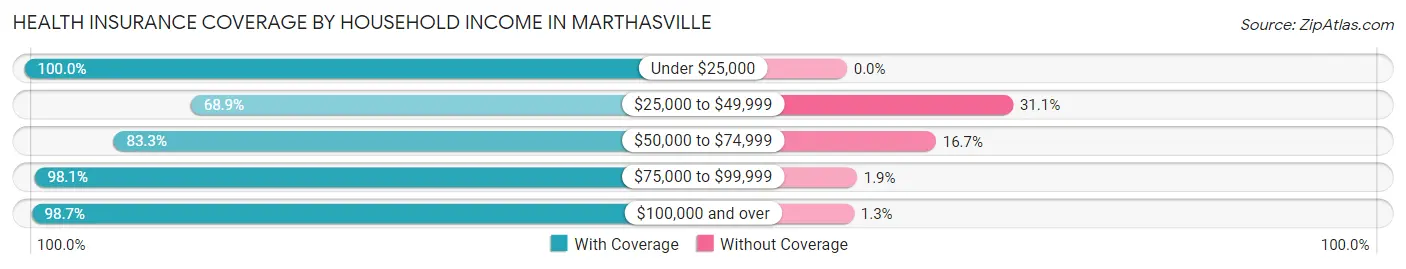
| Household Income | With Coverage | Without Coverage |
| Under $25,000 | 78 (100.0%) | 0 (0.0%) |
| $25,000 to $49,999 | 188 (68.9%) | 85 (31.1%) |
| $50,000 to $74,999 | 170 (83.3%) | 34 (16.7%) |
| $75,000 to $99,999 | 315 (98.1%) | 6 (1.9%) |
| $100,000 and over | 1,717 (98.7%) | 23 (1.3%) |
Public vs Private Health Insurance Coverage by Age in Marthasville
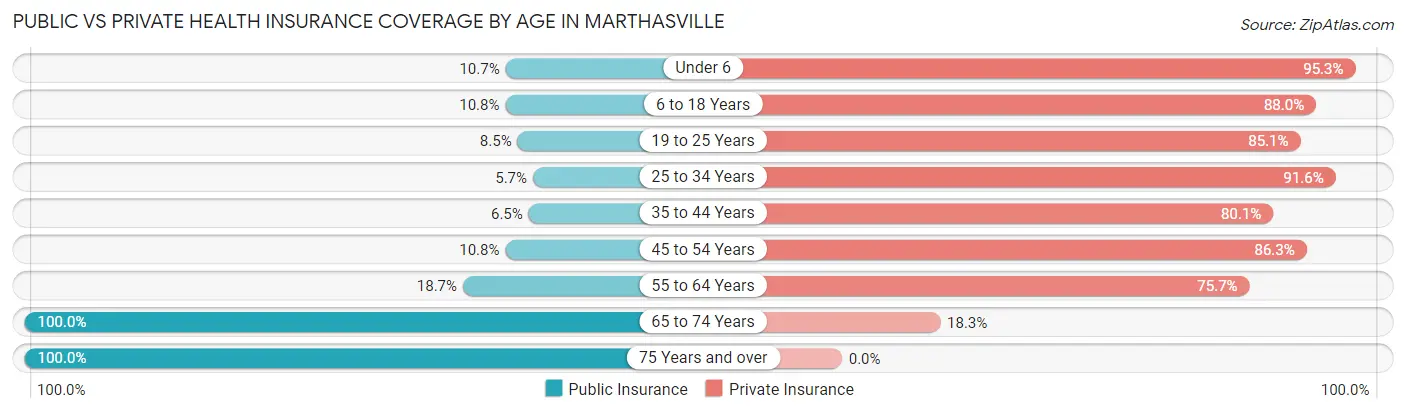
| Age Bracket | Public Insurance | Private Insurance |
| Under 6 | 16 (10.7%) | 142 (95.3%) |
| 6 to 18 Years | 80 (10.8%) | 653 (88.0%) |
| 19 to 25 Years | 24 (8.5%) | 240 (85.1%) |
| 25 to 34 Years | 21 (5.7%) | 340 (91.6%) |
| 35 to 44 Years | 22 (6.5%) | 273 (80.1%) |
| 45 to 54 Years | 40 (10.8%) | 320 (86.3%) |
| 55 to 64 Years | 36 (18.6%) | 146 (75.6%) |
| 65 to 74 Years | 137 (100.0%) | 25 (18.2%) |
| 75 Years and over | 30 (100.0%) | 0 (0.0%) |
| Total | 406 (15.5%) | 2,139 (81.8%) |
Disability Status by Sex by Age in Marthasville
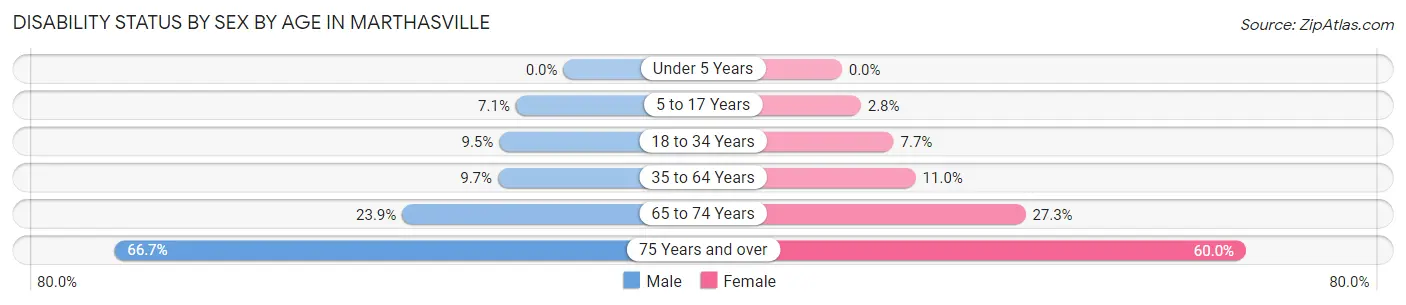
| Age Bracket | Male | Female |
| Under 5 Years | 0 (0.0%) | 0 (0.0%) |
| 5 to 17 Years | 27 (7.1%) | 10 (2.8%) |
| 18 to 34 Years | 35 (9.5%) | 25 (7.7%) |
| 35 to 64 Years | 49 (9.7%) | 44 (11.0%) |
| 65 to 74 Years | 17 (23.9%) | 18 (27.3%) |
| 75 Years and over | 10 (66.7%) | 9 (60.0%) |
Disability Class by Sex by Age in Marthasville
Disability Class: Hearing Difficulty
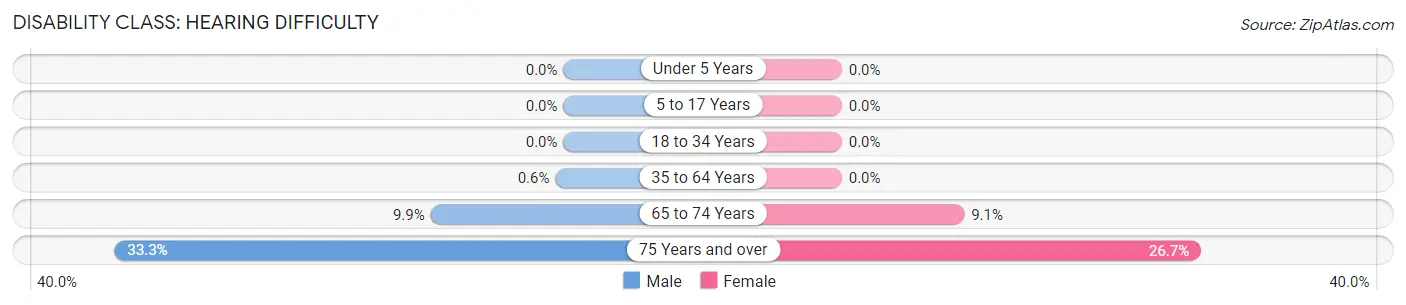
| Age Bracket | Male | Female |
| Under 5 Years | 0 (0.0%) | 0 (0.0%) |
| 5 to 17 Years | 0 (0.0%) | 0 (0.0%) |
| 18 to 34 Years | 0 (0.0%) | 0 (0.0%) |
| 35 to 64 Years | 3 (0.6%) | 0 (0.0%) |
| 65 to 74 Years | 7 (9.9%) | 6 (9.1%) |
| 75 Years and over | 5 (33.3%) | 4 (26.7%) |
Disability Class: Vision Difficulty
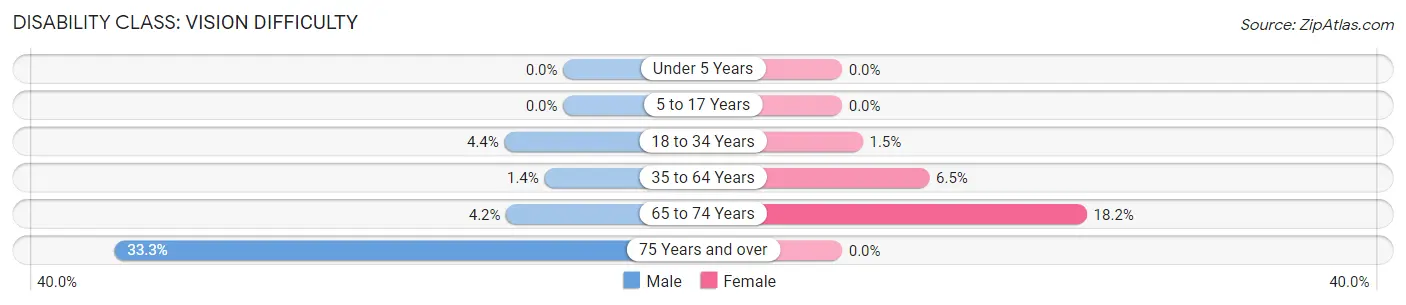
| Age Bracket | Male | Female |
| Under 5 Years | 0 (0.0%) | 0 (0.0%) |
| 5 to 17 Years | 0 (0.0%) | 0 (0.0%) |
| 18 to 34 Years | 16 (4.4%) | 5 (1.5%) |
| 35 to 64 Years | 7 (1.4%) | 26 (6.5%) |
| 65 to 74 Years | 3 (4.2%) | 12 (18.2%) |
| 75 Years and over | 5 (33.3%) | 0 (0.0%) |
Disability Class: Cognitive Difficulty
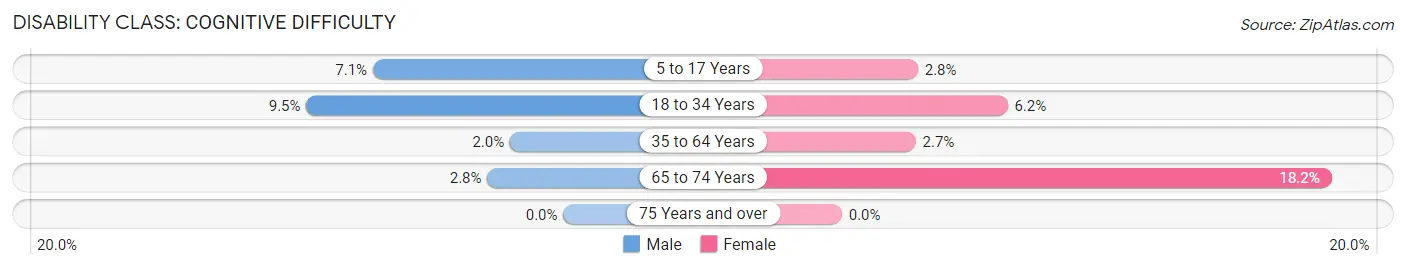
| Age Bracket | Male | Female |
| 5 to 17 Years | 27 (7.1%) | 10 (2.8%) |
| 18 to 34 Years | 35 (9.5%) | 20 (6.1%) |
| 35 to 64 Years | 10 (2.0%) | 11 (2.7%) |
| 65 to 74 Years | 2 (2.8%) | 12 (18.2%) |
| 75 Years and over | 0 (0.0%) | 0 (0.0%) |
Disability Class: Ambulatory Difficulty
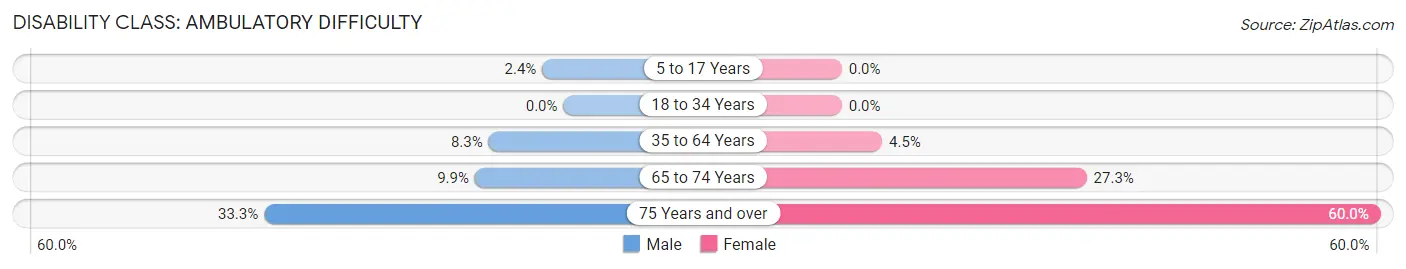
| Age Bracket | Male | Female |
| 5 to 17 Years | 9 (2.4%) | 0 (0.0%) |
| 18 to 34 Years | 0 (0.0%) | 0 (0.0%) |
| 35 to 64 Years | 42 (8.3%) | 18 (4.5%) |
| 65 to 74 Years | 7 (9.9%) | 18 (27.3%) |
| 75 Years and over | 5 (33.3%) | 9 (60.0%) |
Disability Class: Self-Care Difficulty
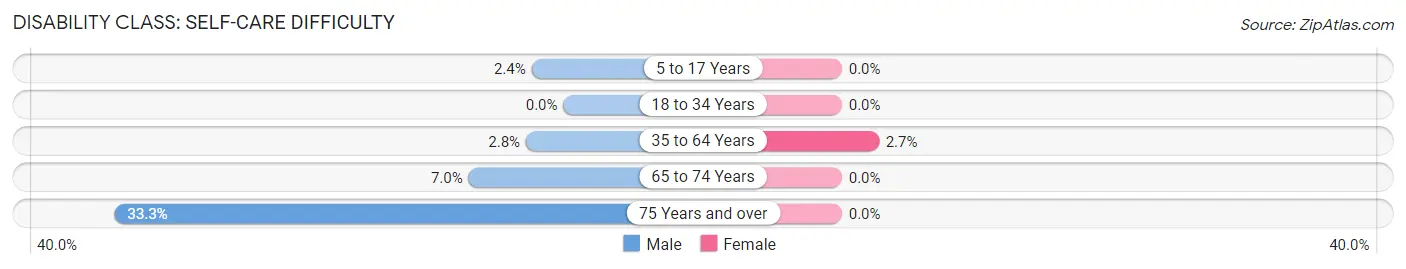
| Age Bracket | Male | Female |
| 5 to 17 Years | 9 (2.4%) | 0 (0.0%) |
| 18 to 34 Years | 0 (0.0%) | 0 (0.0%) |
| 35 to 64 Years | 14 (2.8%) | 11 (2.7%) |
| 65 to 74 Years | 5 (7.0%) | 0 (0.0%) |
| 75 Years and over | 5 (33.3%) | 0 (0.0%) |
Technology Access in Marthasville
Computing Device Access in Marthasville
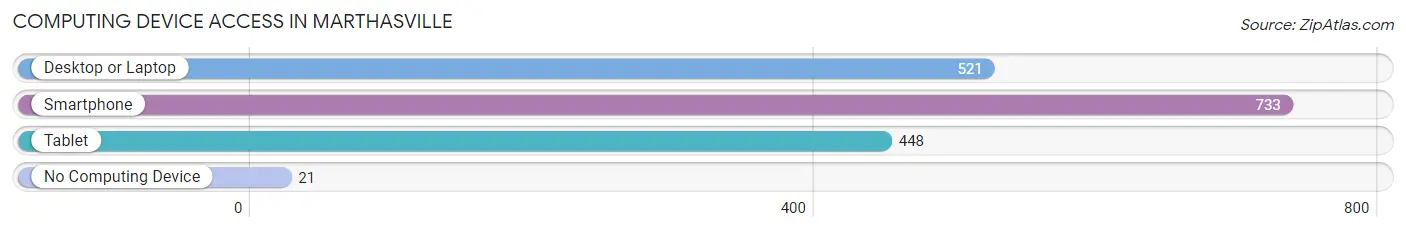
| Device Type | # Households | % Households |
| Desktop or Laptop | 521 | 67.0% |
| Smartphone | 733 | 94.2% |
| Tablet | 448 | 57.6% |
| No Computing Device | 21 | 2.7% |
| Total | 778 | 100.0% |
Internet Access in Marthasville
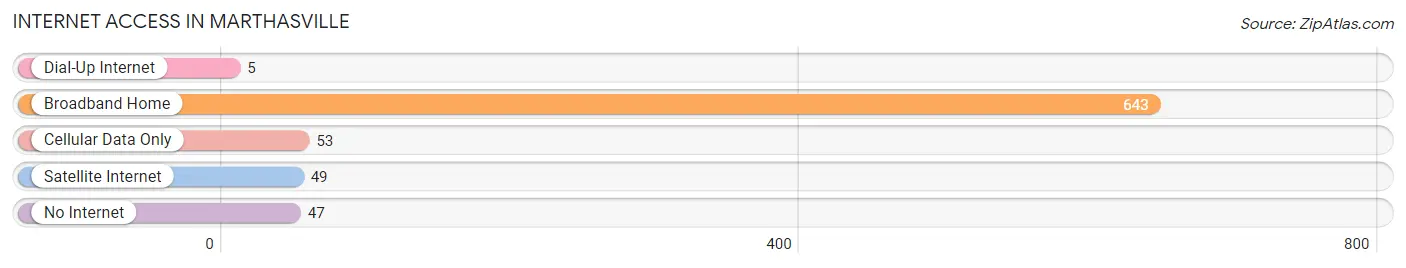
| Internet Type | # Households | % Households |
| Dial-Up Internet | 5 | 0.6% |
| Broadband Home | 643 | 82.7% |
| Cellular Data Only | 53 | 6.8% |
| Satellite Internet | 49 | 6.3% |
| No Internet | 47 | 6.0% |
| Total | 778 | 100.0% |
Marthasville Summary
Marthasville, Missouri is a small town located in Warren County, Missouri, United States. It is situated on the Missouri River, approximately 40 miles west of St. Louis. The town was founded in 1818 and named after Martha Ann Houston, the daughter of the first settler in the area. The population of Marthasville was 1,845 at the 2010 census.
History
Marthasville was founded in 1818 by William Houston, a Revolutionary War veteran who had moved to the area from Kentucky. He named the town after his daughter, Martha Ann Houston. The town was incorporated in 1837 and was the county seat of Warren County until 1855, when the county seat was moved to Warrenton.
Marthasville was an important stop on the Missouri Pacific Railroad, which ran through the town from 1851 to 1871. The railroad brought economic growth to the area, and Marthasville became a center for trade and commerce. The town was also home to several industries, including a flour mill, a sawmill, and a brickyard.
In the late 19th century, Marthasville was a popular tourist destination, with several hotels and resorts located in the area. The town was also home to a number of churches, including the First Baptist Church, which was founded in 1845.
Geography
Marthasville is located in Warren County, Missouri, approximately 40 miles west of St. Louis. The town is situated on the Missouri River, and is surrounded by rolling hills and farmland. The town has a total area of 1.2 square miles, all of which is land.
Economy
Marthasville’s economy is largely based on agriculture and tourism. The town is home to several farms, which produce a variety of crops, including corn, soybeans, and wheat. The town is also home to several wineries, which produce a variety of wines.
Tourism is an important part of the local economy, with many visitors coming to the area to enjoy the town’s historic sites, wineries, and outdoor activities. The town is also home to several festivals and events, including the Marthasville Music Festival and the Marthasville Car Show.
Demographics
As of the 2010 census, Marthasville had a population of 1,845. The racial makeup of the town was 97.2% White, 0.7% African American, 0.2% Native American, 0.2% Asian, 0.2% from other races, and 1.7% from two or more races. Hispanic or Latino of any race were 1.2% of the population.
The median income for a household in Marthasville was $45,938, and the median income for a family was $51,250. The per capita income for the town was $20,945. About 8.2% of families and 10.2% of the population were below the poverty line, including 14.2% of those under age 18 and 8.3% of those age 65 or over.
Common Questions
What is Per Capita Income in Marthasville?
Per Capita income in Marthasville is $30,270.
What is the Median Family Income in Marthasville?
Median Family Income in Marthasville is $112,650.
What is the Median Household income in Marthasville?
Median Household Income in Marthasville is $103,750.
What is Income or Wage Gap in Marthasville?
Income or Wage Gap in Marthasville is 19.8%.
Women in Marthasville earn 80.2 cents for every dollar earned by a man.
What is Inequality or Gini Index in Marthasville?
Inequality or Gini Index in Marthasville is 0.29.
What is the Total Population of Marthasville?
Total Population of Marthasville is 2,616.
What is the Total Male Population of Marthasville?
Total Male Population of Marthasville is 1,384.
What is the Total Female Population of Marthasville?
Total Female Population of Marthasville is 1,232.
What is the Ratio of Males per 100 Females in Marthasville?
There are 112.34 Males per 100 Females in Marthasville.
What is the Ratio of Females per 100 Males in Marthasville?
There are 89.02 Females per 100 Males in Marthasville.
What is the Median Population Age in Marthasville?
Median Population Age in Marthasville is 30.9 Years.
What is the Average Family Size in Marthasville
Average Family Size in Marthasville is 3.7 People.
What is the Average Household Size in Marthasville
Average Household Size in Marthasville is 3.4 People.
How Large is the Labor Force in Marthasville?
There are 1,522 People in the Labor Forcein in Marthasville.
What is the Percentage of People in the Labor Force in Marthasville?
83.1% of People are in the Labor Force in Marthasville.
What is the Unemployment Rate in Marthasville?
Unemployment Rate in Marthasville is 0.7%.