Ellsinore, MO Map & Demographics
Ellsinore Map
Ellsinore Overview
$22,492
PER CAPITA INCOME
$61,250
AVG FAMILY INCOME
$45,938
AVG HOUSEHOLD INCOME
27.2%
WAGE / INCOME GAP [ % ]
72.8¢/ $1
WAGE / INCOME GAP [ $ ]
0.35
INEQUALITY / GINI INDEX
442
TOTAL POPULATION
234
MALE POPULATION
208
FEMALE POPULATION
112.50
MALES / 100 FEMALES
88.89
FEMALES / 100 MALES
36.6
MEDIAN AGE
4.5
AVG FAMILY SIZE
2.4
AVG HOUSEHOLD SIZE
211
LABOR FORCE [ PEOPLE ]
57.2%
PERCENT IN LABOR FORCE
0.9%
UNEMPLOYMENT RATE
Ellsinore Zip Codes
Ellsinore Area Codes
Income in Ellsinore
Income Overview in Ellsinore
Per Capita Income in Ellsinore is $22,492, while median incomes of families and households are $61,250 and $45,938 respectively.
| Characteristic | Number | Measure |
| Per Capita Income | 442 | $22,492 |
| Median Family Income | 65 | $61,250 |
| Mean Family Income | 65 | $66,951 |
| Median Household Income | 188 | $45,938 |
| Mean Household Income | 188 | $50,753 |
| Income Deficit | 65 | $0 |
| Wage / Income Gap (%) | 442 | 27.24% |
| Wage / Income Gap ($) | 442 | 72.76¢ per $1 |
| Gini / Inequality Index | 442 | 0.35 |
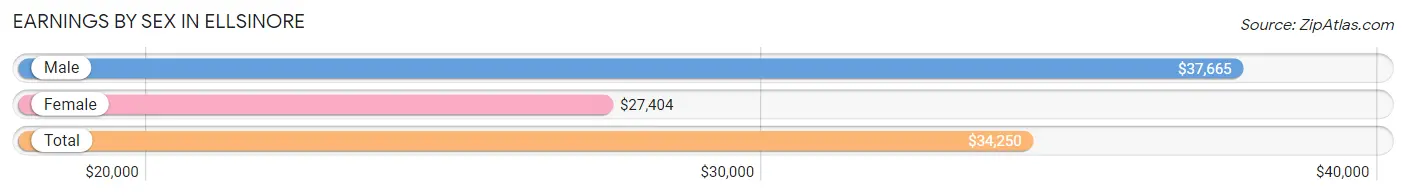
Earnings by Sex in Ellsinore
Average Earnings in Ellsinore are $34,250, $37,665 for men and $27,404 for women, a difference of 27.2%.
| Sex | Number | Average Earnings |
| Male | 153 (66.5%) | $37,665 |
| Female | 77 (33.5%) | $27,404 |
| Total | 230 (100.0%) | $34,250 |
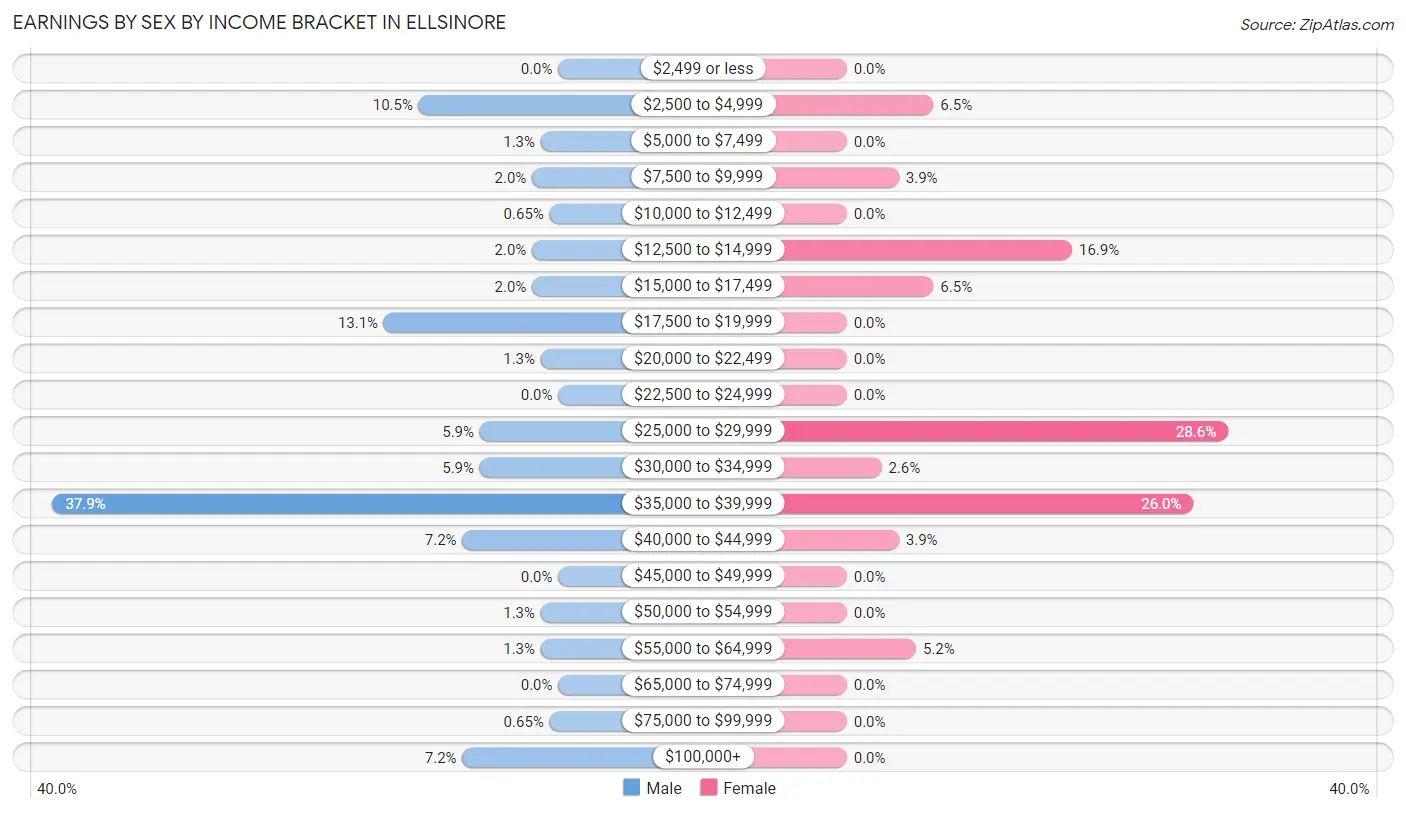
Earnings by Sex by Income Bracket in Ellsinore
The most common earnings brackets in Ellsinore are $35,000 to $39,999 for men (58 | 37.9%) and $25,000 to $29,999 for women (22 | 28.6%).
| Income | Male | Female |
| $2,499 or less | 0 (0.0%) | 0 (0.0%) |
| $2,500 to $4,999 | 16 (10.5%) | 5 (6.5%) |
| $5,000 to $7,499 | 2 (1.3%) | 0 (0.0%) |
| $7,500 to $9,999 | 3 (2.0%) | 3 (3.9%) |
| $10,000 to $12,499 | 1 (0.6%) | 0 (0.0%) |
| $12,500 to $14,999 | 3 (2.0%) | 13 (16.9%) |
| $15,000 to $17,499 | 3 (2.0%) | 5 (6.5%) |
| $17,500 to $19,999 | 20 (13.1%) | 0 (0.0%) |
| $20,000 to $22,499 | 2 (1.3%) | 0 (0.0%) |
| $22,500 to $24,999 | 0 (0.0%) | 0 (0.0%) |
| $25,000 to $29,999 | 9 (5.9%) | 22 (28.6%) |
| $30,000 to $34,999 | 9 (5.9%) | 2 (2.6%) |
| $35,000 to $39,999 | 58 (37.9%) | 20 (26.0%) |
| $40,000 to $44,999 | 11 (7.2%) | 3 (3.9%) |
| $45,000 to $49,999 | 0 (0.0%) | 0 (0.0%) |
| $50,000 to $54,999 | 2 (1.3%) | 0 (0.0%) |
| $55,000 to $64,999 | 2 (1.3%) | 4 (5.2%) |
| $65,000 to $74,999 | 0 (0.0%) | 0 (0.0%) |
| $75,000 to $99,999 | 1 (0.6%) | 0 (0.0%) |
| $100,000+ | 11 (7.2%) | 0 (0.0%) |
| Total | 153 (100.0%) | 77 (100.0%) |
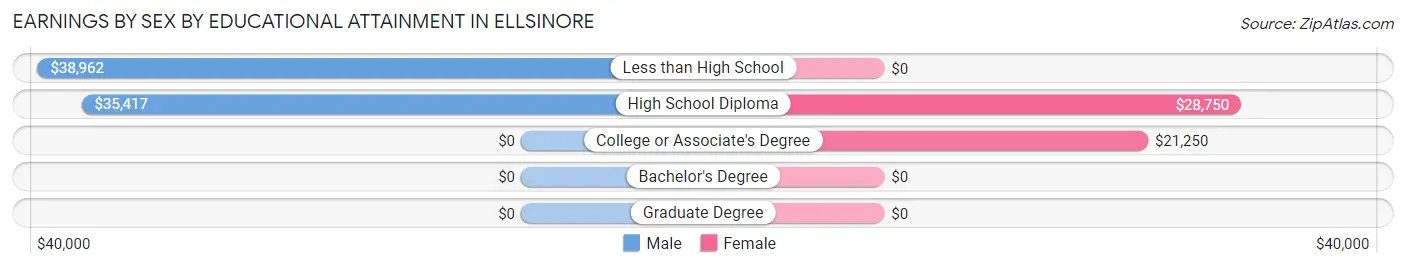
Earnings by Sex by Educational Attainment in Ellsinore
Average earnings in Ellsinore are $38,679 for men and $26,058 for women, a difference of 32.6%. Men with an educational attainment of less than high school enjoy the highest average annual earnings of $38,962, while those with high school diploma education earn the least with $35,417. Women with an educational attainment of high school diploma earn the most with the average annual earnings of $28,750, while those with college or associate's degree education have the smallest earnings of $21,250.
| Educational Attainment | Male Income | Female Income |
| Less than High School | $38,962 | $0 |
| High School Diploma | $35,417 | $28,750 |
| College or Associate's Degree | - | - |
| Bachelor's Degree | - | - |
| Graduate Degree | - | - |
| Total | $38,679 | $26,058 |
Family Income in Ellsinore
Family Income Brackets in Ellsinore
According to the Ellsinore family income data, there are 20 families falling into the $75,000 to $99,999 income range, which is the most common income bracket and makes up 30.8% of all families.
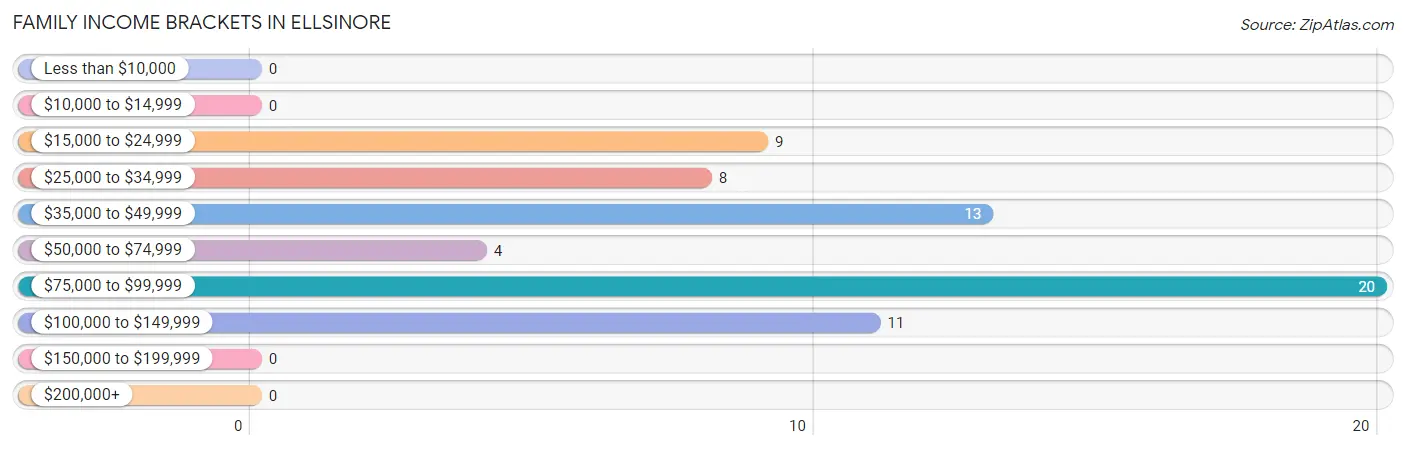
| Income Bracket | # Families | % Families |
| Less than $10,000 | 0 | 0.0% |
| $10,000 to $14,999 | 0 | 0.0% |
| $15,000 to $24,999 | 9 | 13.8% |
| $25,000 to $34,999 | 8 | 12.3% |
| $35,000 to $49,999 | 13 | 20.0% |
| $50,000 to $74,999 | 4 | 6.2% |
| $75,000 to $99,999 | 20 | 30.8% |
| $100,000 to $149,999 | 11 | 16.9% |
| $150,000 to $199,999 | 0 | 0.0% |
| $200,000+ | 0 | 0.0% |
Family Income by Famaliy Size in Ellsinore
3-person families (9 | 13.9%) account for the highest median family income in Ellsinore with $100,417 per family, while 3-person families (9 | 13.9%) have the highest median income of $33,472 per family member.
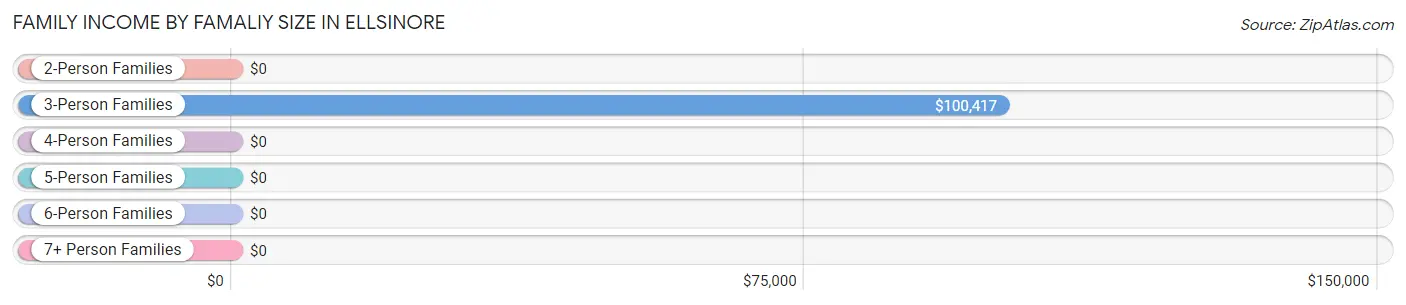
| Income Bracket | # Families | Median Income |
| 2-Person Families | 28 (43.1%) | $0 |
| 3-Person Families | 9 (13.9%) | $100,417 |
| 4-Person Families | 27 (41.5%) | $0 |
| 5-Person Families | 1 (1.5%) | $0 |
| 6-Person Families | 0 (0.0%) | $0 |
| 7+ Person Families | 0 (0.0%) | $0 |
| Total | 65 (100.0%) | $61,250 |
Family Income by Number of Earners in Ellsinore
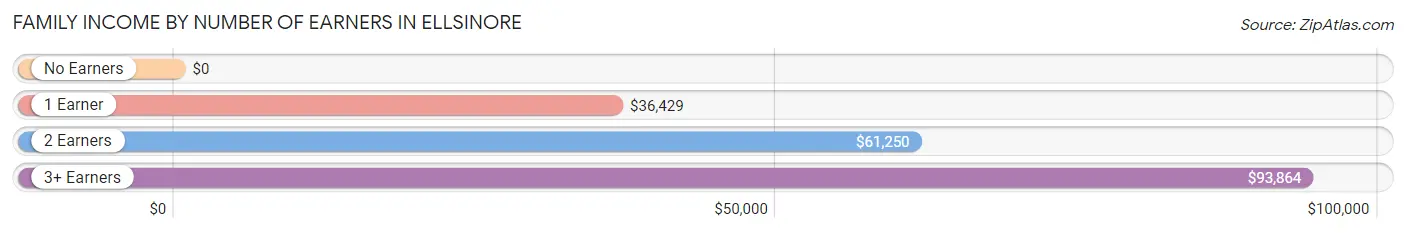
| Number of Earners | # Families | Median Income |
| No Earners | 4 (6.1%) | $0 |
| 1 Earner | 34 (52.3%) | $36,429 |
| 2 Earners | 11 (16.9%) | $61,250 |
| 3+ Earners | 16 (24.6%) | $93,864 |
| Total | 65 (100.0%) | $61,250 |
Household Income in Ellsinore
Household Income Brackets in Ellsinore
With 61 households falling in the category, the $35,000 to $49,999 income range is the most frequent in Ellsinore, accounting for 32.5% of all households.
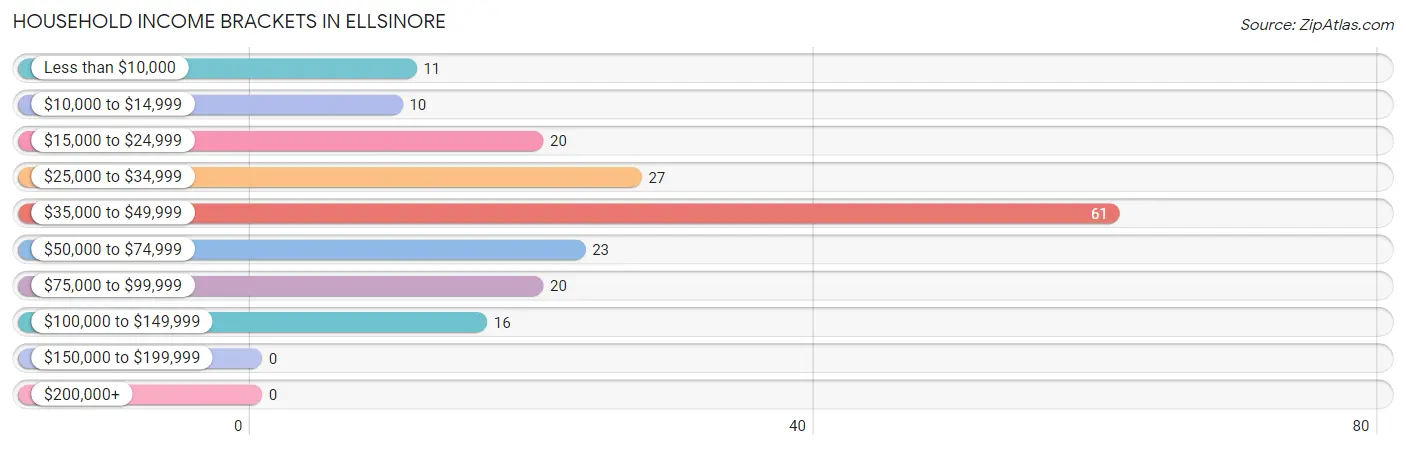
| Income Bracket | # Households | % Households |
| Less than $10,000 | 11 | 5.9% |
| $10,000 to $14,999 | 10 | 5.3% |
| $15,000 to $24,999 | 20 | 10.6% |
| $25,000 to $34,999 | 27 | 14.4% |
| $35,000 to $49,999 | 61 | 32.4% |
| $50,000 to $74,999 | 23 | 12.2% |
| $75,000 to $99,999 | 20 | 10.6% |
| $100,000 to $149,999 | 16 | 8.5% |
| $150,000 to $199,999 | 0 | 0.0% |
| $200,000+ | 0 | 0.0% |
Household Income by Householder Age in Ellsinore
The median household income in Ellsinore is $45,938, with the highest median household income of $46,816 found in the 45 to 64 years age bracket for the primary householder. A total of 87 households (46.3%) fall into this category. Meanwhile, the 15 to 24 years age bracket for the primary householder has the lowest median household income of $0, with 18 households (9.6%) in this group.
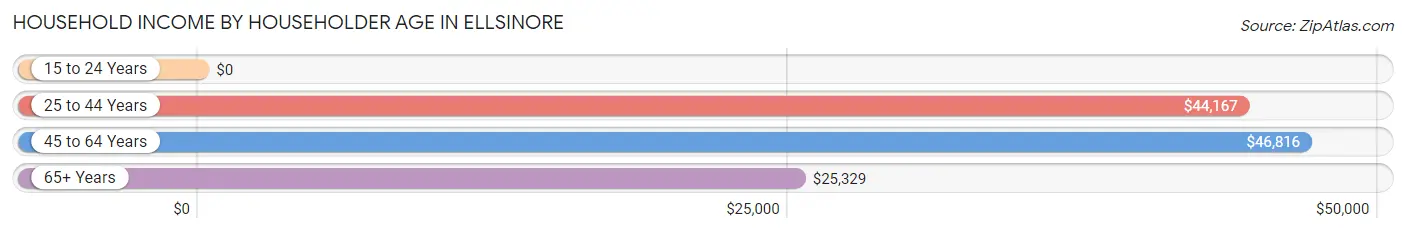
| Income Bracket | # Households | Median Income |
| 15 to 24 Years | 18 (9.6%) | $0 |
| 25 to 44 Years | 22 (11.7%) | $44,167 |
| 45 to 64 Years | 87 (46.3%) | $46,816 |
| 65+ Years | 61 (32.5%) | $25,329 |
| Total | 188 (100.0%) | $45,938 |
Poverty in Ellsinore
Income Below Poverty by Sex and Age in Ellsinore
With 17.9% poverty level for males and 21.6% for females among the residents of Ellsinore, under 5 year old males and 5 year old females are the most vulnerable to poverty, with 21 males (100.0%) and 2 females (100.0%) in their respective age groups living below the poverty level.
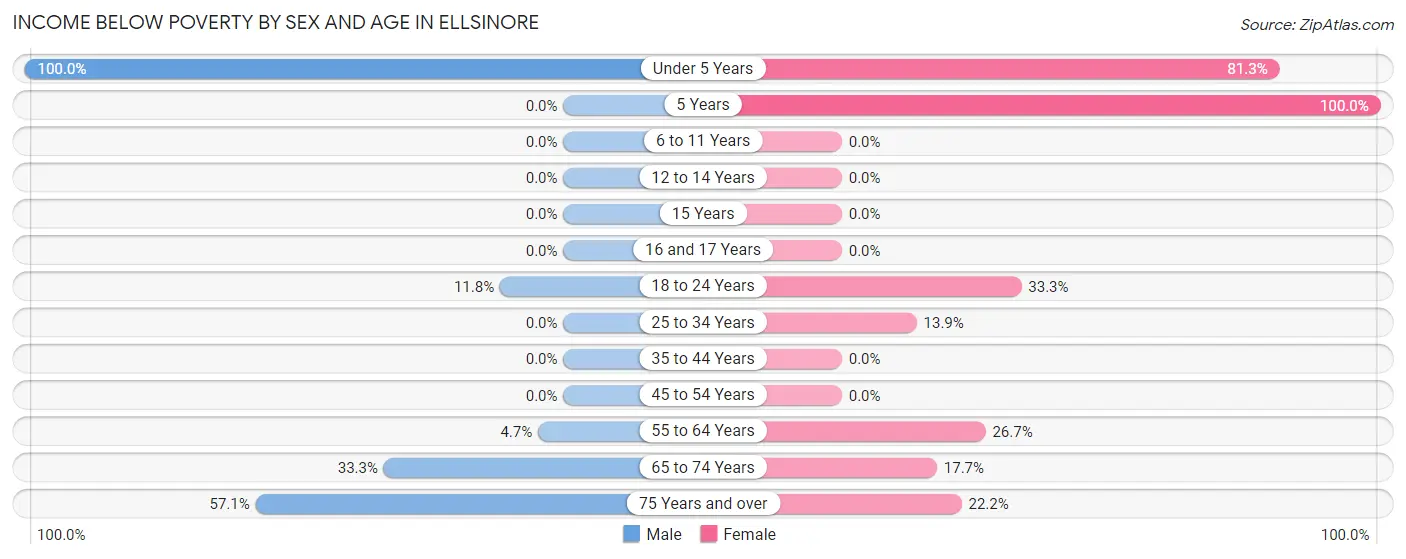
| Age Bracket | Male | Female |
| Under 5 Years | 21 (100.0%) | 13 (81.2%) |
| 5 Years | 0 (0.0%) | 2 (100.0%) |
| 6 to 11 Years | 0 (0.0%) | 0 (0.0%) |
| 12 to 14 Years | 0 (0.0%) | 0 (0.0%) |
| 15 Years | 0 (0.0%) | 0 (0.0%) |
| 16 and 17 Years | 0 (0.0%) | 0 (0.0%) |
| 18 to 24 Years | 8 (11.8%) | 7 (33.3%) |
| 25 to 34 Years | 0 (0.0%) | 5 (13.9%) |
| 35 to 44 Years | 0 (0.0%) | 0 (0.0%) |
| 45 to 54 Years | 0 (0.0%) | 0 (0.0%) |
| 55 to 64 Years | 3 (4.7%) | 8 (26.7%) |
| 65 to 74 Years | 6 (33.3%) | 6 (17.6%) |
| 75 Years and over | 4 (57.1%) | 4 (22.2%) |
| Total | 42 (17.9%) | 45 (21.6%) |
Income Above Poverty by Sex and Age in Ellsinore
According to the poverty statistics in Ellsinore, males aged 5 years and females aged 6 to 11 years are the age groups that are most secure financially, with 100.0% of males and 100.0% of females in these age groups living above the poverty line.
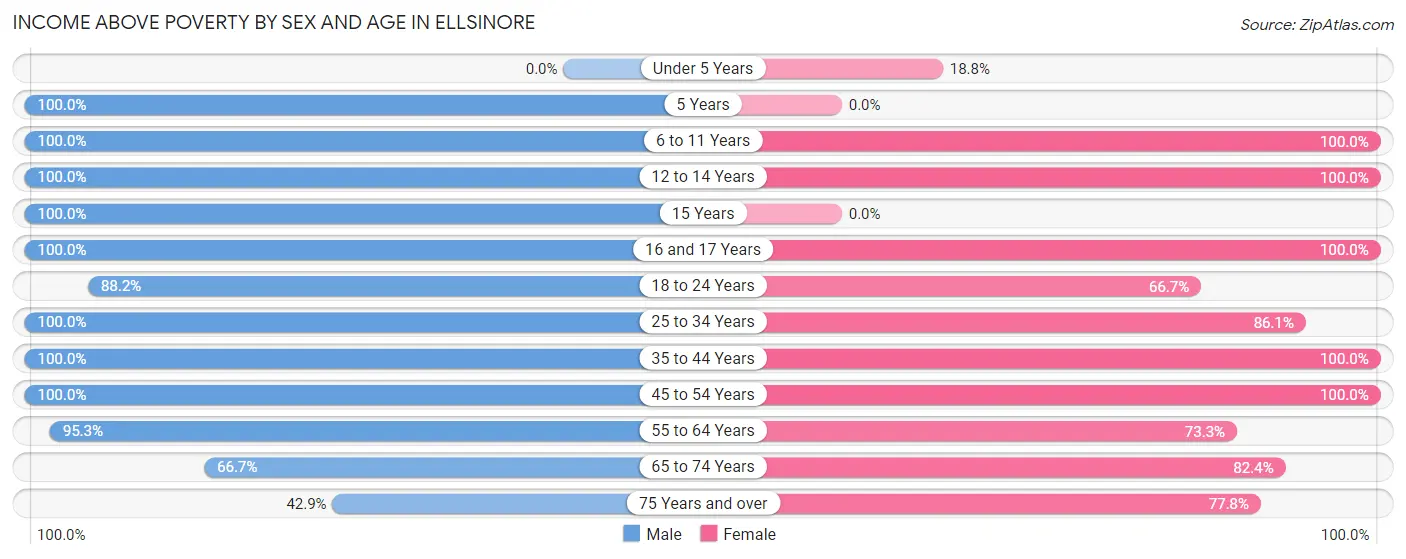
| Age Bracket | Male | Female |
| Under 5 Years | 0 (0.0%) | 3 (18.8%) |
| 5 Years | 2 (100.0%) | 0 (0.0%) |
| 6 to 11 Years | 5 (100.0%) | 5 (100.0%) |
| 12 to 14 Years | 3 (100.0%) | 4 (100.0%) |
| 15 Years | 15 (100.0%) | 0 (0.0%) |
| 16 and 17 Years | 2 (100.0%) | 6 (100.0%) |
| 18 to 24 Years | 60 (88.2%) | 14 (66.7%) |
| 25 to 34 Years | 6 (100.0%) | 31 (86.1%) |
| 35 to 44 Years | 11 (100.0%) | 17 (100.0%) |
| 45 to 54 Years | 12 (100.0%) | 19 (100.0%) |
| 55 to 64 Years | 61 (95.3%) | 22 (73.3%) |
| 65 to 74 Years | 12 (66.7%) | 28 (82.4%) |
| 75 Years and over | 3 (42.9%) | 14 (77.8%) |
| Total | 192 (82.1%) | 163 (78.4%) |
Income Below Poverty Among Married-Couple Families in Ellsinore
The poverty statistics for married-couple families in Ellsinore show that 8.7% or 4 of the total 46 families live below the poverty line. Families with no children have the highest poverty rate of 11.1%, comprising of 4 families. On the other hand, families with 1 or 2 children have the lowest poverty rate of 0.0%, which includes 0 families.
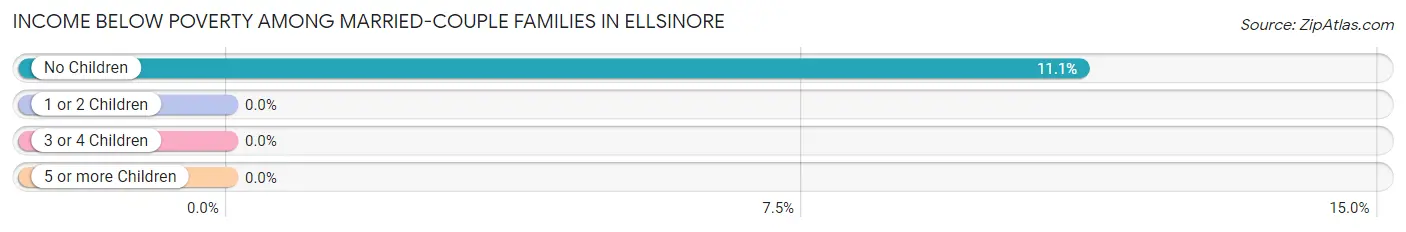
| Children | Above Poverty | Below Poverty |
| No Children | 32 (88.9%) | 4 (11.1%) |
| 1 or 2 Children | 9 (100.0%) | 0 (0.0%) |
| 3 or 4 Children | 1 (100.0%) | 0 (0.0%) |
| 5 or more Children | 0 (0.0%) | 0 (0.0%) |
| Total | 42 (91.3%) | 4 (8.7%) |
Income Below Poverty Among Single-Parent Households in Ellsinore
According to the poverty data in Ellsinore, 71.4% or 5 single-father households and 41.7% or 5 single-mother households are living below the poverty line. Among single-father households, those with 3 or 4 children have the highest poverty rate, with 5 households (71.4%) experiencing poverty. Likewise, among single-mother households, those with 1 or 2 children have the highest poverty rate, with 5 households (71.4%) falling below the poverty line.
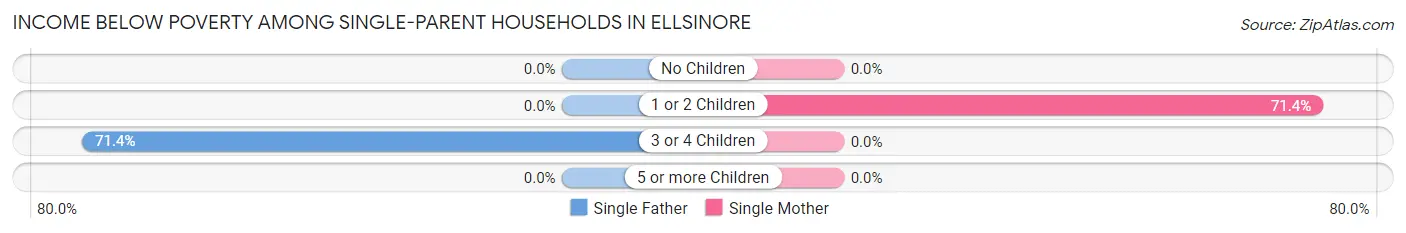
| Children | Single Father | Single Mother |
| No Children | 0 (0.0%) | 0 (0.0%) |
| 1 or 2 Children | 0 (0.0%) | 5 (71.4%) |
| 3 or 4 Children | 5 (71.4%) | 0 (0.0%) |
| 5 or more Children | 0 (0.0%) | 0 (0.0%) |
| Total | 5 (71.4%) | 5 (41.7%) |
Income Below Poverty Among Married-Couple vs Single-Parent Households in Ellsinore
The poverty data for Ellsinore shows that 4 of the married-couple family households (8.7%) and 10 of the single-parent households (52.6%) are living below the poverty level. Within the married-couple family households, those with no children have the highest poverty rate, with 4 households (11.1%) falling below the poverty line. Among the single-parent households, those with 1 or 2 children have the highest poverty rate, with 5 household (71.4%) living below poverty.
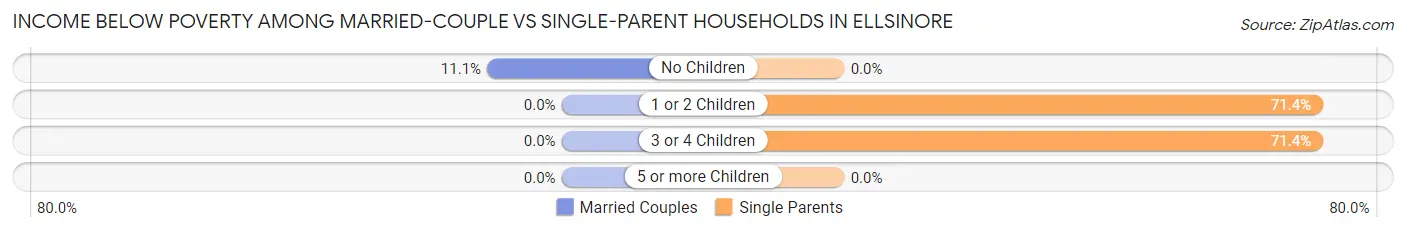
| Children | Married-Couple Families | Single-Parent Households |
| No Children | 4 (11.1%) | 0 (0.0%) |
| 1 or 2 Children | 0 (0.0%) | 5 (71.4%) |
| 3 or 4 Children | 0 (0.0%) | 5 (71.4%) |
| 5 or more Children | 0 (0.0%) | 0 (0.0%) |
| Total | 4 (8.7%) | 10 (52.6%) |
Race in Ellsinore
The most populous races in Ellsinore are White / Caucasian (395 | 89.4%), Two or more Races (44 | 10.0%), and Hispanic or Latino (35 | 7.9%).
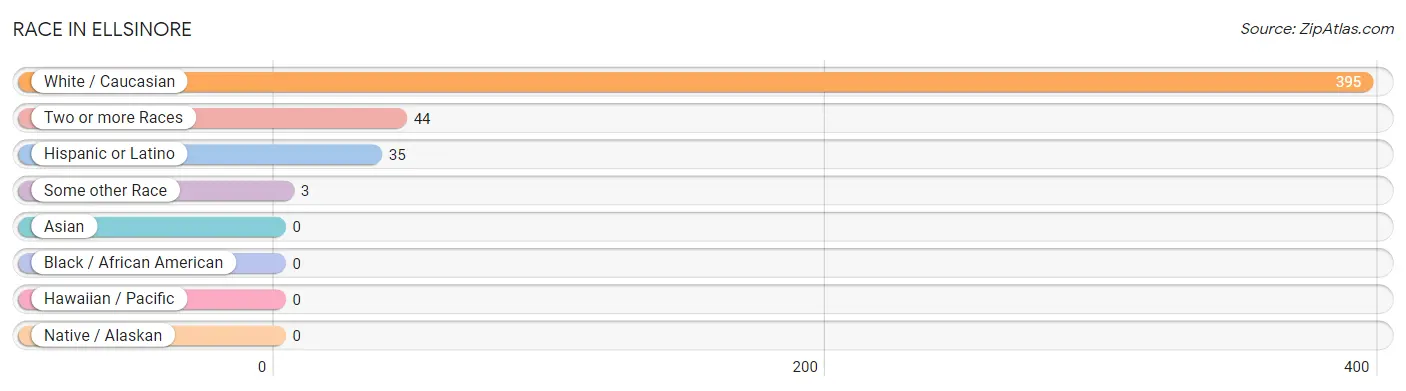
| Race | # Population | % Population |
| Asian | 0 | 0.0% |
| Black / African American | 0 | 0.0% |
| Hawaiian / Pacific | 0 | 0.0% |
| Hispanic or Latino | 35 | 7.9% |
| Native / Alaskan | 0 | 0.0% |
| White / Caucasian | 395 | 89.4% |
| Two or more Races | 44 | 10.0% |
| Some other Race | 3 | 0.7% |
| Total | 442 | 100.0% |
Ancestry in Ellsinore
The most populous ancestries reported in Ellsinore are American (115 | 26.0%), German (37 | 8.4%), Irish (28 | 6.3%), English (21 | 4.8%), and Peruvian (18 | 4.1%), together accounting for 49.5% of all Ellsinore residents.
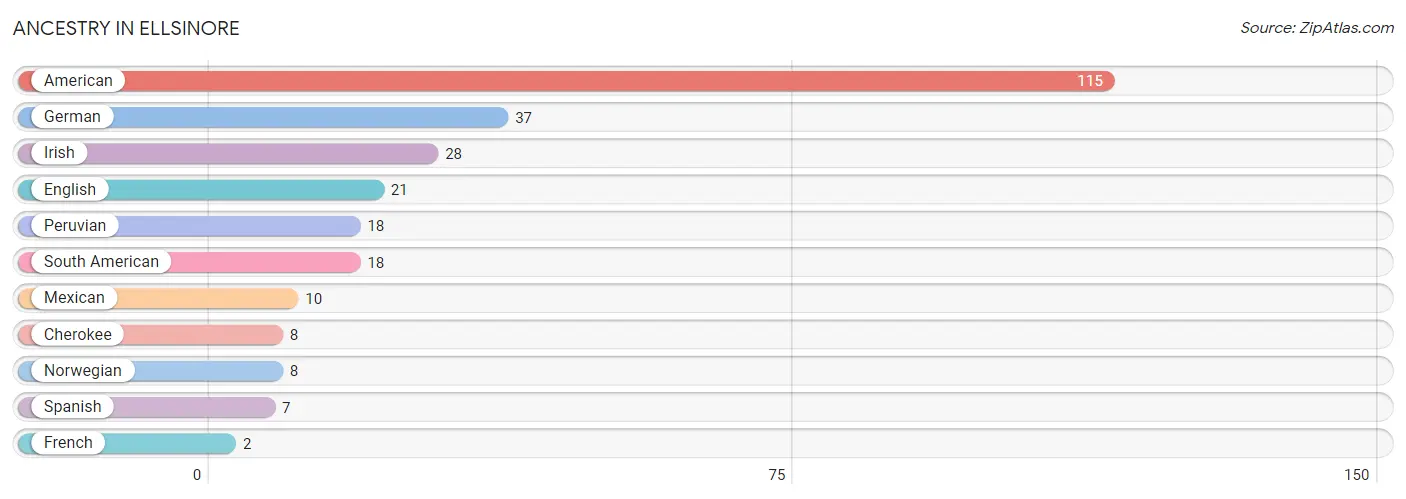
| Ancestry | # Population | % Population |
| American | 115 | 26.0% |
| Cherokee | 8 | 1.8% |
| English | 21 | 4.8% |
| French | 2 | 0.4% |
| German | 37 | 8.4% |
| Irish | 28 | 6.3% |
| Mexican | 10 | 2.3% |
| Norwegian | 8 | 1.8% |
| Peruvian | 18 | 4.1% |
| South American | 18 | 4.1% |
| Spanish | 7 | 1.6% | View All 11 Rows |
Immigrants in Ellsinore
The most numerous immigrant groups reported in Ellsinore came from Latin America (3 | 0.7%), Peru (3 | 0.7%), and South America (3 | 0.7%), together accounting for 2.0% of all Ellsinore residents.
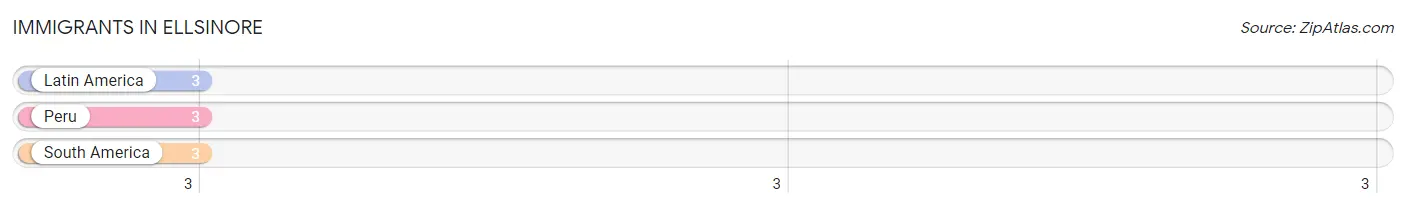
| Immigration Origin | # Population | % Population |
| Latin America | 3 | 0.7% |
| Peru | 3 | 0.7% |
| South America | 3 | 0.7% | View All 3 Rows |
Sex and Age in Ellsinore
Sex and Age in Ellsinore
The most populous age groups in Ellsinore are 60 to 64 Years (55 | 23.5%) for men and 65 to 69 Years (28 | 13.5%) for women.
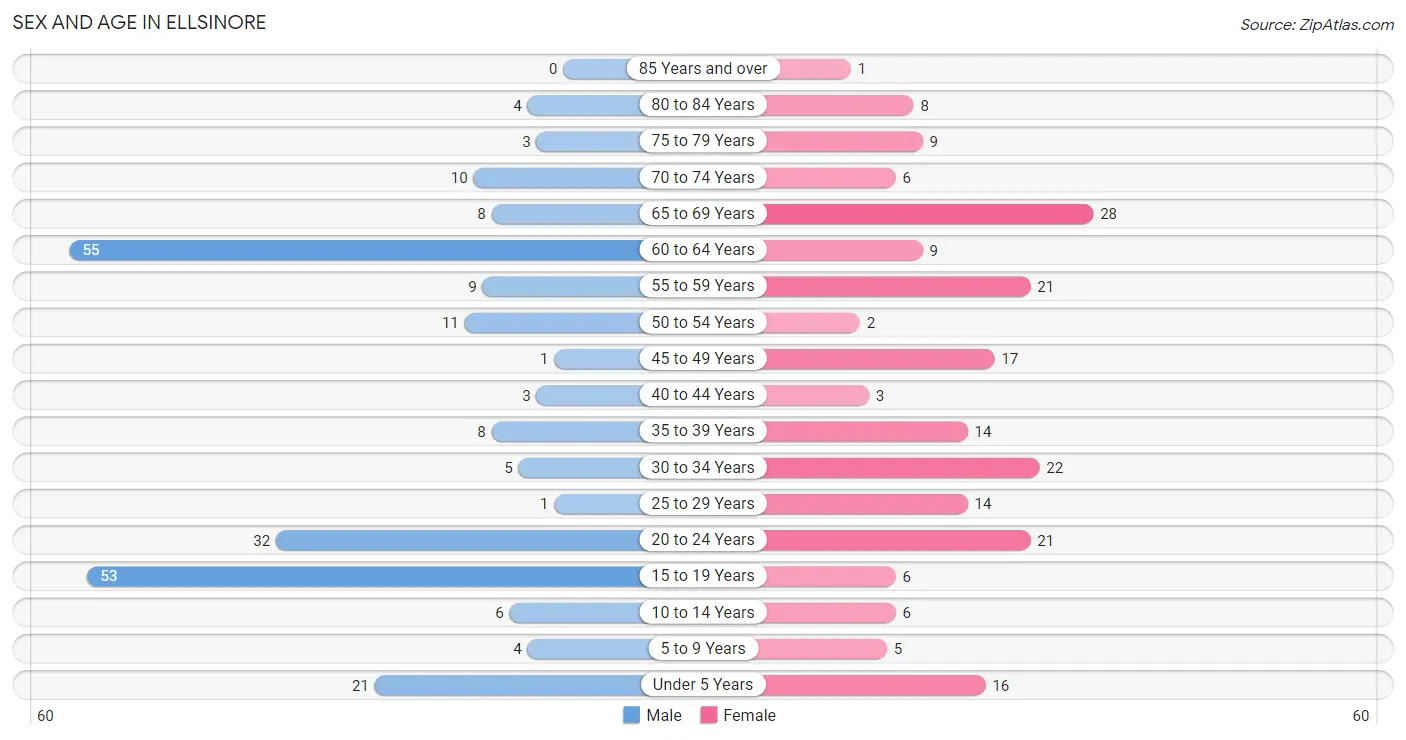
| Age Bracket | Male | Female |
| Under 5 Years | 21 (9.0%) | 16 (7.7%) |
| 5 to 9 Years | 4 (1.7%) | 5 (2.4%) |
| 10 to 14 Years | 6 (2.6%) | 6 (2.9%) |
| 15 to 19 Years | 53 (22.7%) | 6 (2.9%) |
| 20 to 24 Years | 32 (13.7%) | 21 (10.1%) |
| 25 to 29 Years | 1 (0.4%) | 14 (6.7%) |
| 30 to 34 Years | 5 (2.1%) | 22 (10.6%) |
| 35 to 39 Years | 8 (3.4%) | 14 (6.7%) |
| 40 to 44 Years | 3 (1.3%) | 3 (1.4%) |
| 45 to 49 Years | 1 (0.4%) | 17 (8.2%) |
| 50 to 54 Years | 11 (4.7%) | 2 (1.0%) |
| 55 to 59 Years | 9 (3.8%) | 21 (10.1%) |
| 60 to 64 Years | 55 (23.5%) | 9 (4.3%) |
| 65 to 69 Years | 8 (3.4%) | 28 (13.5%) |
| 70 to 74 Years | 10 (4.3%) | 6 (2.9%) |
| 75 to 79 Years | 3 (1.3%) | 9 (4.3%) |
| 80 to 84 Years | 4 (1.7%) | 8 (3.8%) |
| 85 Years and over | 0 (0.0%) | 1 (0.5%) |
| Total | 234 (100.0%) | 208 (100.0%) |
Families and Households in Ellsinore
Median Family Size in Ellsinore
The median family size in Ellsinore is 4.55 persons per family, with single male/father families (7 | 10.8%) accounting for the largest median family size of 6.43 persons per family. On the other hand, single female/mother families (12 | 18.5%) represent the smallest median family size with 3.00 persons per family.
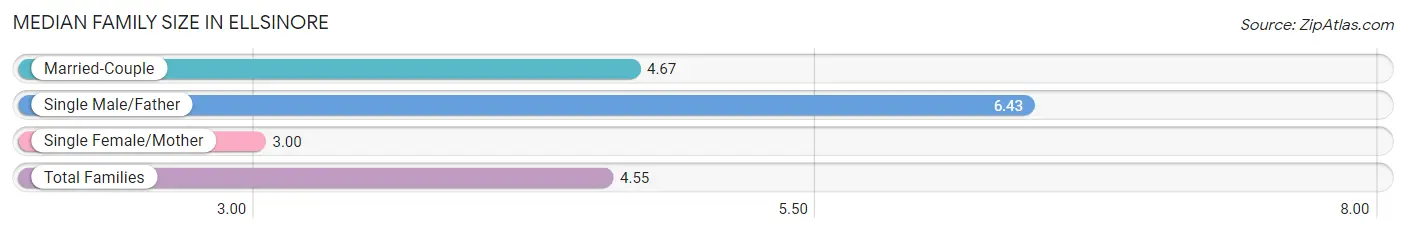
| Family Type | # Families | Family Size |
| Married-Couple | 46 (70.8%) | 4.67 |
| Single Male/Father | 7 (10.8%) | 6.43 |
| Single Female/Mother | 12 (18.5%) | 3.00 |
| Total Families | 65 (100.0%) | 4.55 |
Median Household Size in Ellsinore
The median household size in Ellsinore is 2.35 persons per household, with single male/father households (7 | 3.7%) accounting for the largest median household size of 7.43 persons per household. non-family households (123 | 65.4%) represent the smallest median household size with 1.09 persons per household.
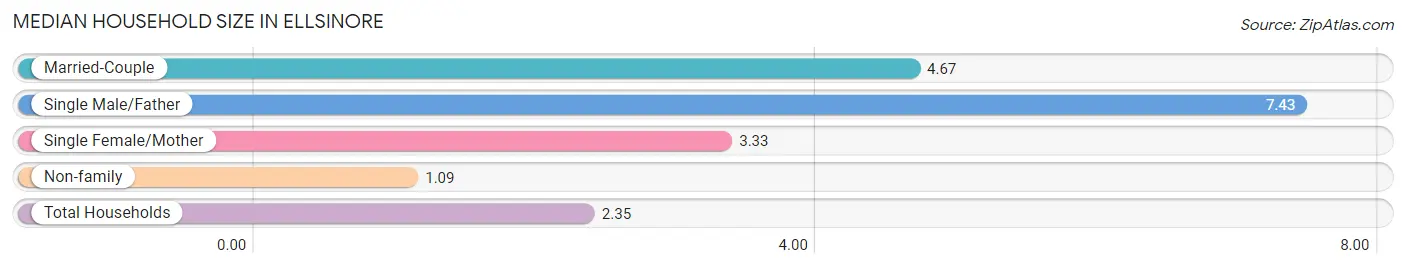
| Household Type | # Households | Household Size |
| Married-Couple | 46 (24.5%) | 4.67 |
| Single Male/Father | 7 (3.7%) | 7.43 |
| Single Female/Mother | 12 (6.4%) | 3.33 |
| Non-family | 123 (65.4%) | 1.09 |
| Total Households | 188 (100.0%) | 2.35 |
Household Size by Marriage Status in Ellsinore
Out of a total of 188 households in Ellsinore, 65 (34.6%) are family households, while 123 (65.4%) are nonfamily households. The most numerous type of family households are 4-person households, comprising 22, and the most common type of nonfamily households are 1-person households, comprising 117.
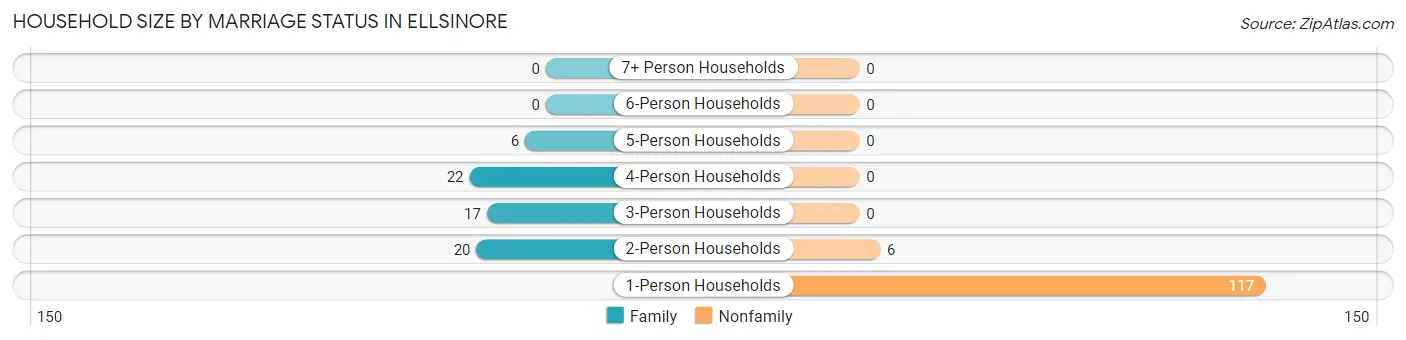
| Household Size | Family Households | Nonfamily Households |
| 1-Person Households | - | 117 (62.2%) |
| 2-Person Households | 20 (10.6%) | 6 (3.2%) |
| 3-Person Households | 17 (9.0%) | 0 (0.0%) |
| 4-Person Households | 22 (11.7%) | 0 (0.0%) |
| 5-Person Households | 6 (3.2%) | 0 (0.0%) |
| 6-Person Households | 0 (0.0%) | 0 (0.0%) |
| 7+ Person Households | 0 (0.0%) | 0 (0.0%) |
| Total | 65 (34.6%) | 123 (65.4%) |
Female Fertility in Ellsinore
Fertility by Age in Ellsinore
Average fertility rate in Ellsinore is 72.0 births per 1,000 women. Women in the age bracket of 20 to 34 years have the highest fertility rate with 123.0 births per 1,000 women. Women in the age bracket of 20 to 34 years acount for 100.0% of all women with births.
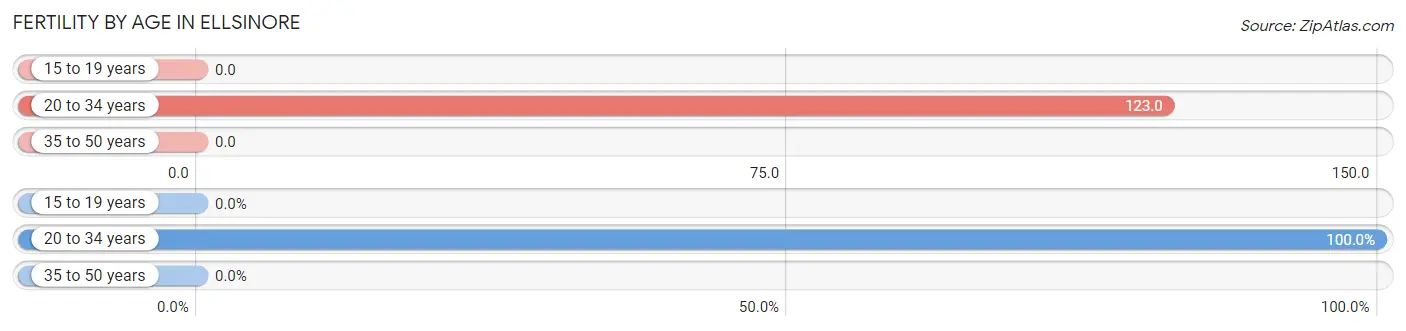
| Age Bracket | Women with Births | Births / 1,000 Women |
| 15 to 19 years | 0 (0.0%) | 0.0 |
| 20 to 34 years | 7 (100.0%) | 123.0 |
| 35 to 50 years | 0 (0.0%) | 0.0 |
| Total | 7 (100.0%) | 72.0 |
Fertility by Age by Marriage Status in Ellsinore
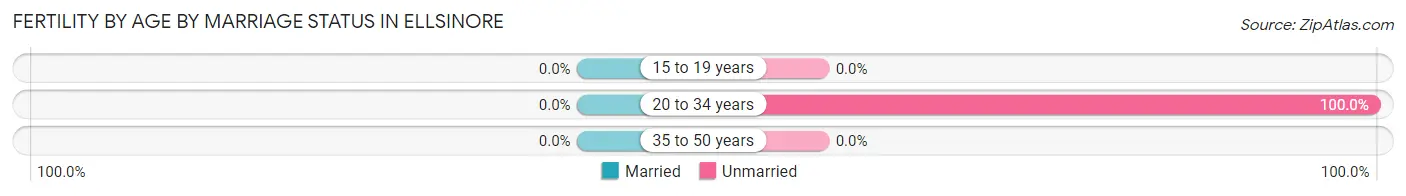
| Age Bracket | Married | Unmarried |
| 15 to 19 years | 0 (0.0%) | 0 (0.0%) |
| 20 to 34 years | 0 (0.0%) | 7 (100.0%) |
| 35 to 50 years | 0 (0.0%) | 0 (0.0%) |
| Total | 0 (0.0%) | 7 (100.0%) |
Fertility by Education in Ellsinore
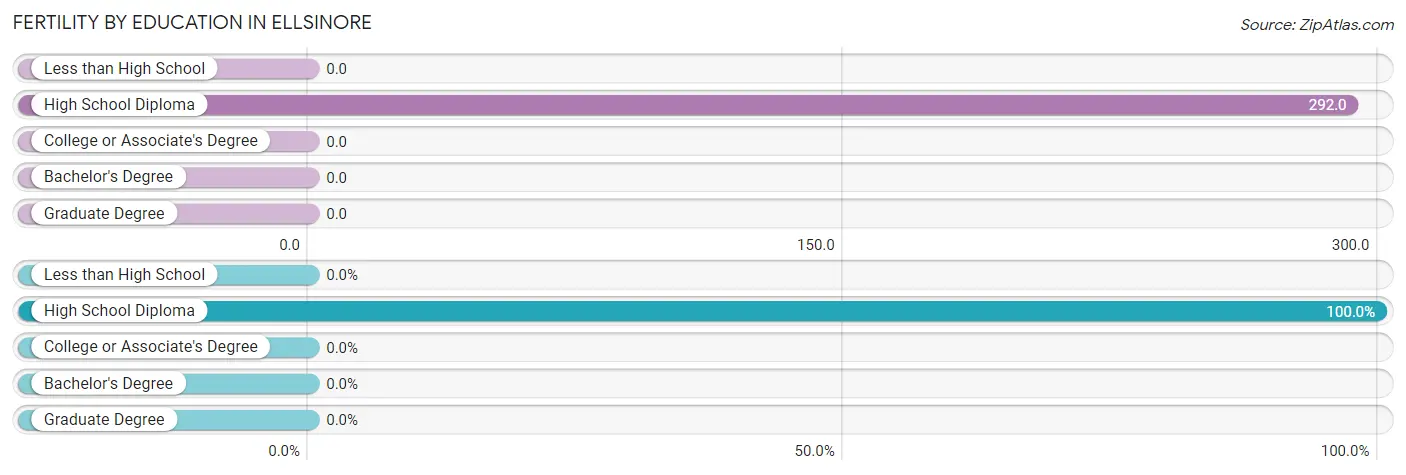
| Educational Attainment | Women with Births | Births / 1,000 Women |
| Less than High School | 0 (0.0%) | 0.0 |
| High School Diploma | 7 (100.0%) | 292.0 |
| College or Associate's Degree | 0 (0.0%) | 0.0 |
| Bachelor's Degree | 0 (0.0%) | 0.0 |
| Graduate Degree | 0 (0.0%) | 0.0 |
| Total | 7 (100.0%) | 72.0 |
Fertility by Education by Marriage Status in Ellsinore
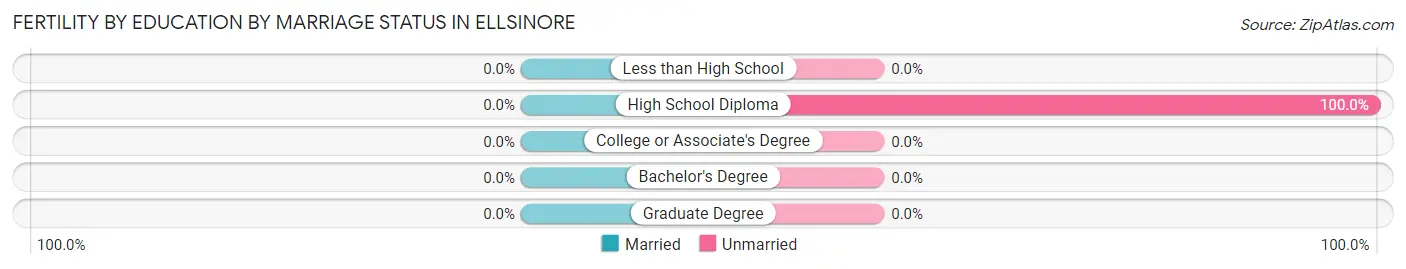
| Educational Attainment | Married | Unmarried |
| Less than High School | 0 (0.0%) | 0 (0.0%) |
| High School Diploma | 0 (0.0%) | 7 (100.0%) |
| College or Associate's Degree | 0 (0.0%) | 0 (0.0%) |
| Bachelor's Degree | 0 (0.0%) | 0 (0.0%) |
| Graduate Degree | 0 (0.0%) | 0 (0.0%) |
| Total | 0 (0.0%) | 7 (100.0%) |
Employment Characteristics in Ellsinore
Employment by Class of Employer in Ellsinore
Among the 209 employed individuals in Ellsinore, private company employees (148 | 70.8%), state government employees (23 | 11.0%), and local government employees (21 | 10.1%) make up the most common classes of employment.
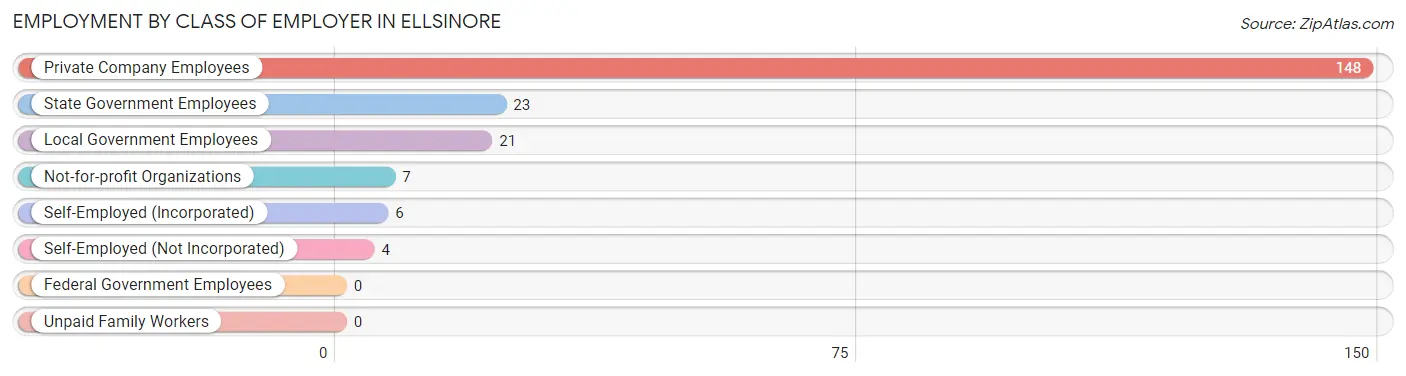
| Employer Class | # Employees | % Employees |
| Private Company Employees | 148 | 70.8% |
| Self-Employed (Incorporated) | 6 | 2.9% |
| Self-Employed (Not Incorporated) | 4 | 1.9% |
| Not-for-profit Organizations | 7 | 3.4% |
| Local Government Employees | 21 | 10.1% |
| State Government Employees | 23 | 11.0% |
| Federal Government Employees | 0 | 0.0% |
| Unpaid Family Workers | 0 | 0.0% |
| Total | 209 | 100.0% |
Employment Status by Age in Ellsinore
According to the labor force statistics for Ellsinore, out of the total population over 16 years of age (369), 57.2% or 211 individuals are in the labor force, with 0.9% or 2 of them unemployed. The age group with the highest labor force participation rate is 25 to 29 years, with 100.0% or 15 individuals in the labor force. Within the labor force, the 30 to 34 years age range has the highest percentage of unemployed individuals, with 7.4% or 2 of them being unemployed.
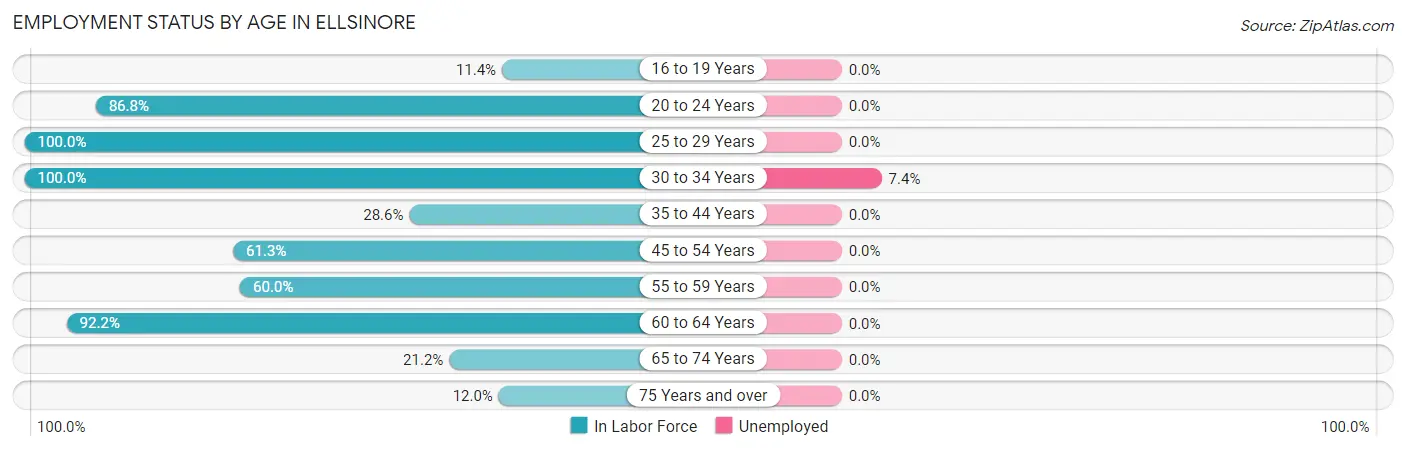
| Age Bracket | In Labor Force | Unemployed |
| 16 to 19 Years | 5 (11.4%) | 0 (0.0%) |
| 20 to 24 Years | 46 (86.8%) | 0 (0.0%) |
| 25 to 29 Years | 15 (100.0%) | 0 (0.0%) |
| 30 to 34 Years | 27 (100.0%) | 2 (7.4%) |
| 35 to 44 Years | 8 (28.6%) | 0 (0.0%) |
| 45 to 54 Years | 19 (61.3%) | 0 (0.0%) |
| 55 to 59 Years | 18 (60.0%) | 0 (0.0%) |
| 60 to 64 Years | 59 (92.2%) | 0 (0.0%) |
| 65 to 74 Years | 11 (21.2%) | 0 (0.0%) |
| 75 Years and over | 3 (12.0%) | 0 (0.0%) |
| Total | 211 (57.2%) | 2 (0.9%) |
Employment Status by Educational Attainment in Ellsinore
According to labor force statistics for Ellsinore, 74.9% of individuals (146) out of the total population between 25 and 64 years of age (195) are in the labor force, with 1.4% or 2 of them being unemployed. The group with the highest labor force participation rate are those with the educational attainment of less than high school, with 80.5% or 66 individuals in the labor force. Within the labor force, individuals with high school diploma education have the highest percentage of unemployment, with 6.3% or 2 of them being unemployed.
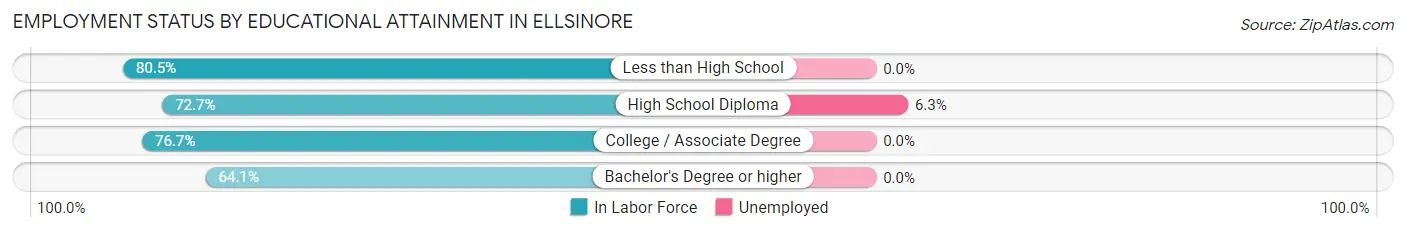
| Educational Attainment | In Labor Force | Unemployed |
| Less than High School | 66 (80.5%) | 0 (0.0%) |
| High School Diploma | 32 (72.7%) | 3 (6.3%) |
| College / Associate Degree | 23 (76.7%) | 0 (0.0%) |
| Bachelor's Degree or higher | 25 (64.1%) | 0 (0.0%) |
| Total | 146 (74.9%) | 3 (1.4%) |
Employment Occupations by Sex in Ellsinore
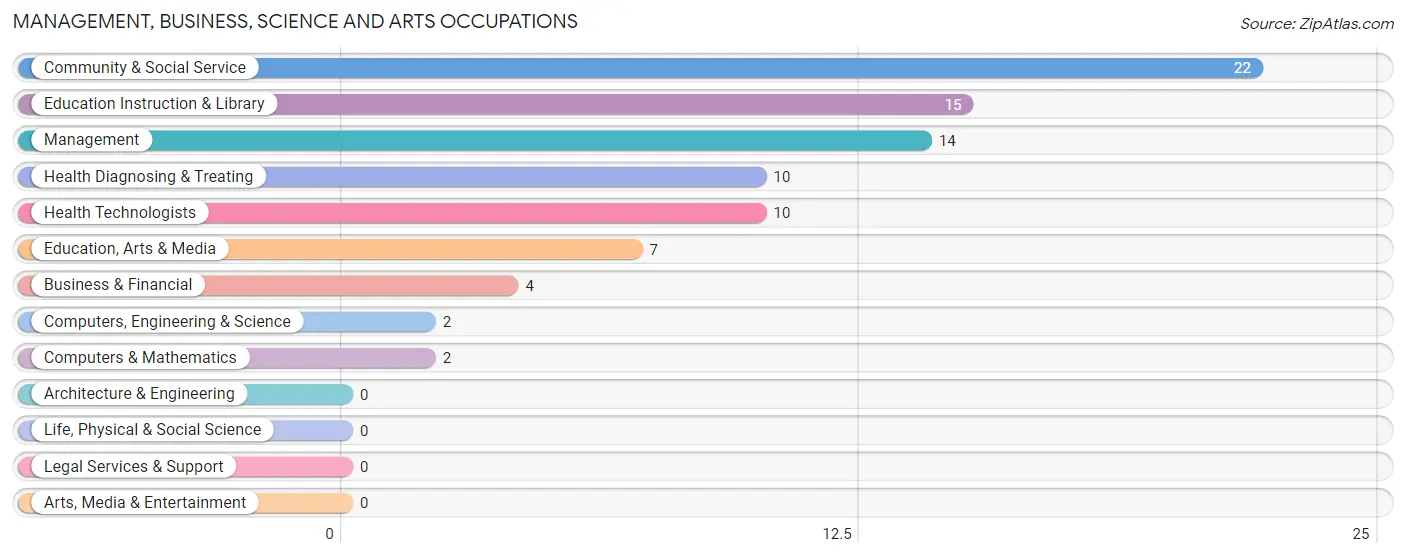
Management, Business, Science and Arts Occupations
The most common Management, Business, Science and Arts occupations in Ellsinore are Community & Social Service (22 | 10.5%), Education Instruction & Library (15 | 7.2%), Management (14 | 6.7%), Health Diagnosing & Treating (10 | 4.8%), and Health Technologists (10 | 4.8%).
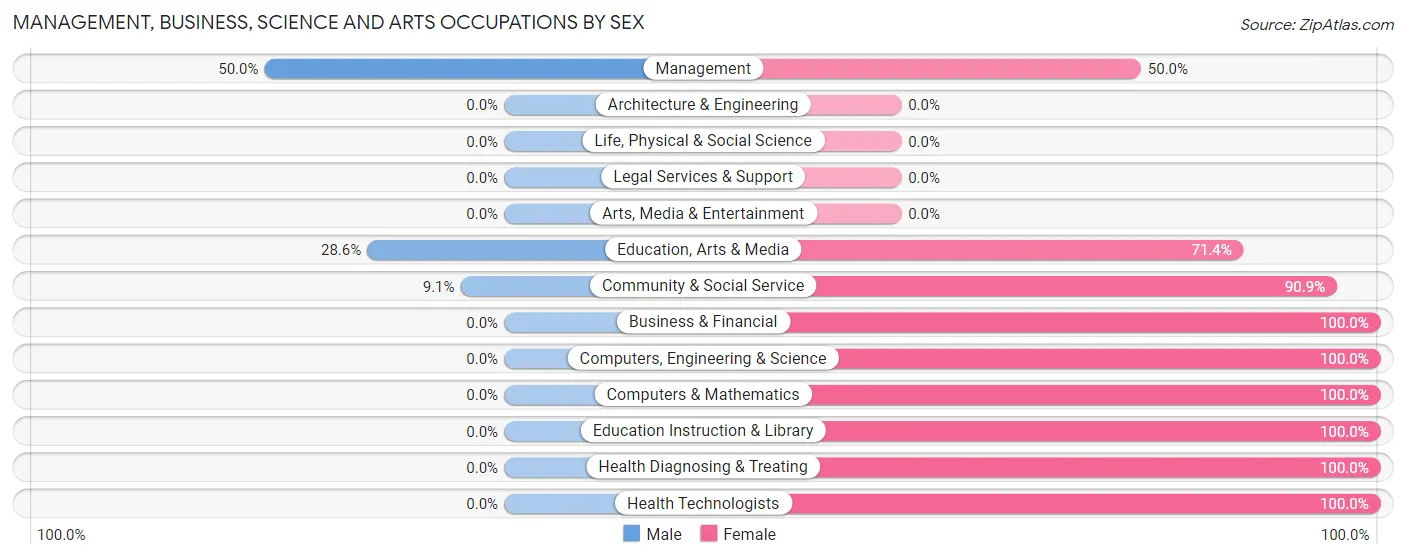
Management, Business, Science and Arts Occupations by Sex
Within the Management, Business, Science and Arts occupations in Ellsinore, the most male-oriented occupations are Management (50.0%), Education, Arts & Media (28.6%), and Community & Social Service (9.1%), while the most female-oriented occupations are Business & Financial (100.0%), Computers, Engineering & Science (100.0%), and Computers & Mathematics (100.0%).
| Occupation | Male | Female |
| Management | 7 (50.0%) | 7 (50.0%) |
| Business & Financial | 0 (0.0%) | 4 (100.0%) |
| Computers, Engineering & Science | 0 (0.0%) | 2 (100.0%) |
| Computers & Mathematics | 0 (0.0%) | 2 (100.0%) |
| Architecture & Engineering | 0 (0.0%) | 0 (0.0%) |
| Life, Physical & Social Science | 0 (0.0%) | 0 (0.0%) |
| Community & Social Service | 2 (9.1%) | 20 (90.9%) |
| Education, Arts & Media | 2 (28.6%) | 5 (71.4%) |
| Legal Services & Support | 0 (0.0%) | 0 (0.0%) |
| Education Instruction & Library | 0 (0.0%) | 15 (100.0%) |
| Arts, Media & Entertainment | 0 (0.0%) | 0 (0.0%) |
| Health Diagnosing & Treating | 0 (0.0%) | 10 (100.0%) |
| Health Technologists | 0 (0.0%) | 10 (100.0%) |
| Total (Category) | 9 (17.3%) | 43 (82.7%) |
| Total (Overall) | 132 (63.2%) | 77 (36.8%) |
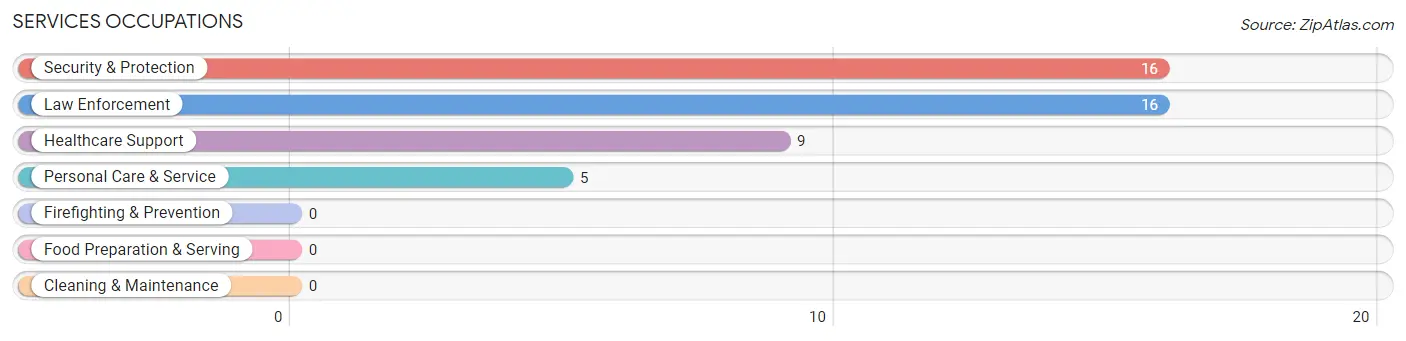
Services Occupations
The most common Services occupations in Ellsinore are Security & Protection (16 | 7.7%), Law Enforcement (16 | 7.7%), Healthcare Support (9 | 4.3%), and Personal Care & Service (5 | 2.4%).
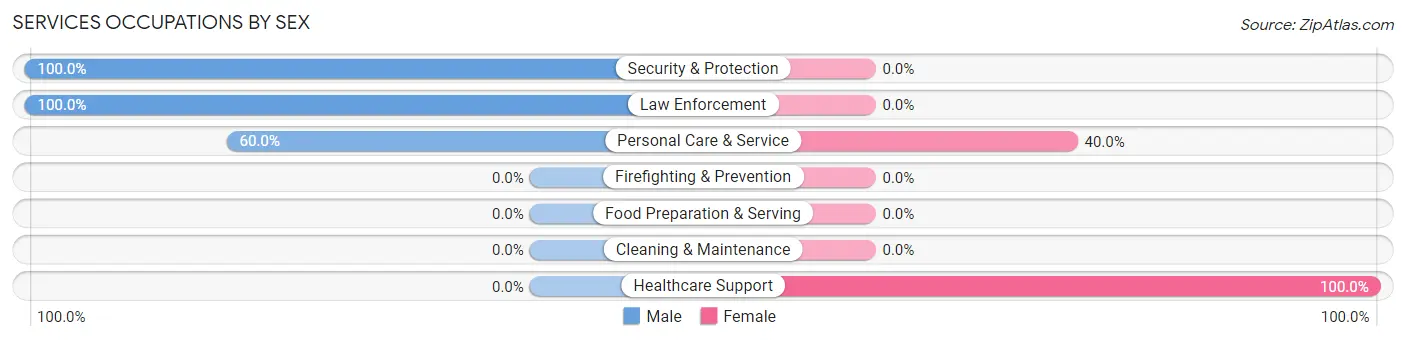
Services Occupations by Sex
Within the Services occupations in Ellsinore, the most male-oriented occupations are Security & Protection (100.0%), Law Enforcement (100.0%), and Personal Care & Service (60.0%), while the most female-oriented occupations are Healthcare Support (100.0%), and Personal Care & Service (40.0%).
| Occupation | Male | Female |
| Healthcare Support | 0 (0.0%) | 9 (100.0%) |
| Security & Protection | 16 (100.0%) | 0 (0.0%) |
| Firefighting & Prevention | 0 (0.0%) | 0 (0.0%) |
| Law Enforcement | 16 (100.0%) | 0 (0.0%) |
| Food Preparation & Serving | 0 (0.0%) | 0 (0.0%) |
| Cleaning & Maintenance | 0 (0.0%) | 0 (0.0%) |
| Personal Care & Service | 3 (60.0%) | 2 (40.0%) |
| Total (Category) | 19 (63.3%) | 11 (36.7%) |
| Total (Overall) | 132 (63.2%) | 77 (36.8%) |
Sales and Office Occupations
The most common Sales and Office occupations in Ellsinore are Office & Administration (17 | 8.1%), and Sales & Related (16 | 7.7%).

Sales and Office Occupations by Sex

| Occupation | Male | Female |
| Sales & Related | 6 (37.5%) | 10 (62.5%) |
| Office & Administration | 4 (23.5%) | 13 (76.5%) |
| Total (Category) | 10 (30.3%) | 23 (69.7%) |
| Total (Overall) | 132 (63.2%) | 77 (36.8%) |
Natural Resources, Construction and Maintenance Occupations
The most common Natural Resources, Construction and Maintenance occupations in Ellsinore are Construction & Extraction (5 | 2.4%), and Farming, Fishing & Forestry (3 | 1.4%).
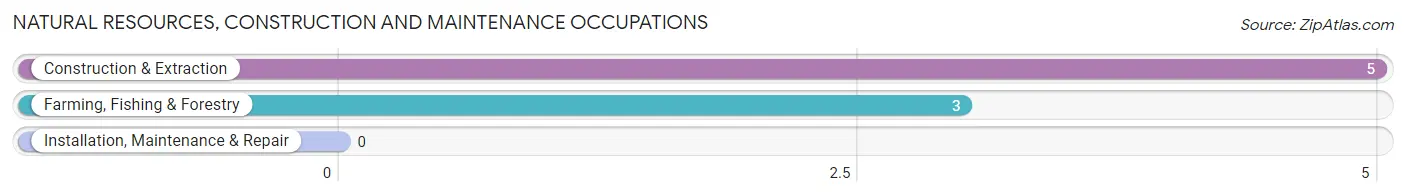
Natural Resources, Construction and Maintenance Occupations by Sex
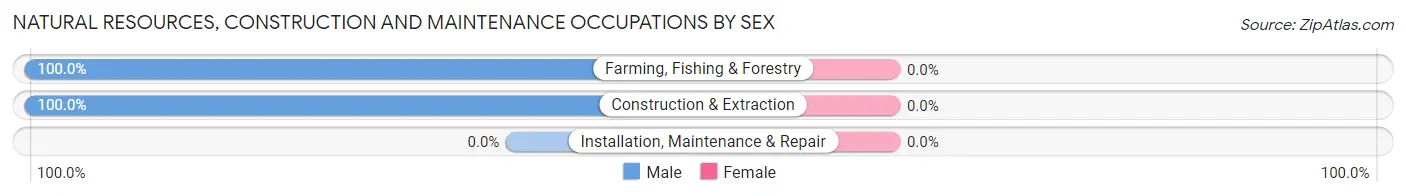
| Occupation | Male | Female |
| Farming, Fishing & Forestry | 3 (100.0%) | 0 (0.0%) |
| Construction & Extraction | 5 (100.0%) | 0 (0.0%) |
| Installation, Maintenance & Repair | 0 (0.0%) | 0 (0.0%) |
| Total (Category) | 8 (100.0%) | 0 (0.0%) |
| Total (Overall) | 132 (63.2%) | 77 (36.8%) |
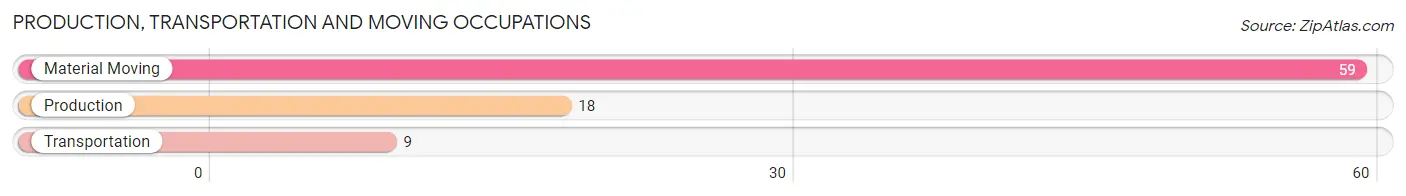
Production, Transportation and Moving Occupations
The most common Production, Transportation and Moving occupations in Ellsinore are Material Moving (59 | 28.2%), Production (18 | 8.6%), and Transportation (9 | 4.3%).
Production, Transportation and Moving Occupations by Sex
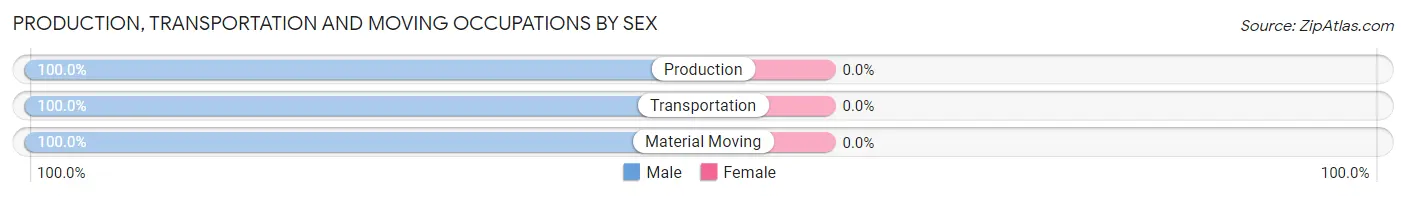
| Occupation | Male | Female |
| Production | 18 (100.0%) | 0 (0.0%) |
| Transportation | 9 (100.0%) | 0 (0.0%) |
| Material Moving | 59 (100.0%) | 0 (0.0%) |
| Total (Category) | 86 (100.0%) | 0 (0.0%) |
| Total (Overall) | 132 (63.2%) | 77 (36.8%) |
Employment Industries by Sex in Ellsinore
Employment Industries in Ellsinore
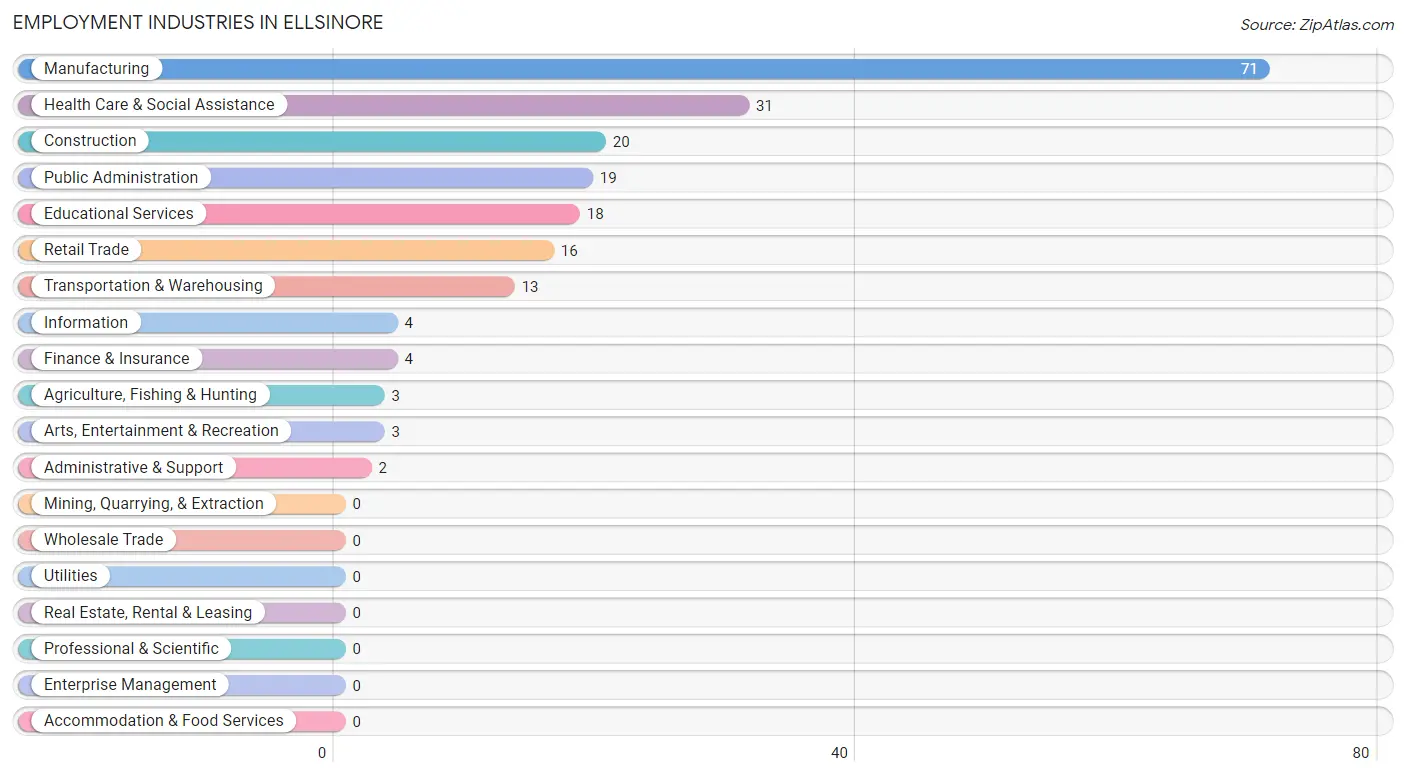
The major employment industries in Ellsinore include Manufacturing (71 | 34.0%), Health Care & Social Assistance (31 | 14.8%), Construction (20 | 9.6%), Public Administration (19 | 9.1%), and Educational Services (18 | 8.6%).
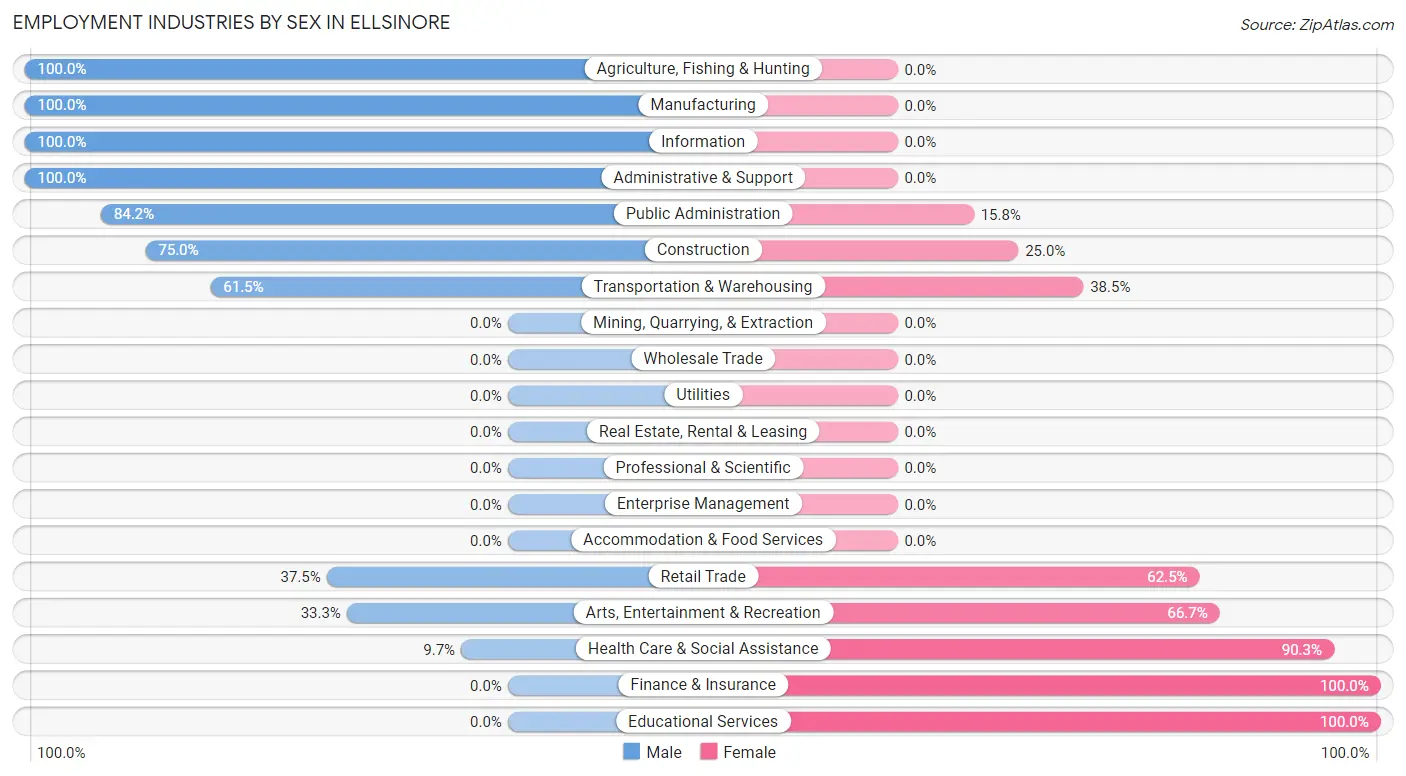
Employment Industries by Sex in Ellsinore
The Ellsinore industries that see more men than women are Agriculture, Fishing & Hunting (100.0%), Manufacturing (100.0%), and Information (100.0%), whereas the industries that tend to have a higher number of women are Finance & Insurance (100.0%), Educational Services (100.0%), and Health Care & Social Assistance (90.3%).
| Industry | Male | Female |
| Agriculture, Fishing & Hunting | 3 (100.0%) | 0 (0.0%) |
| Mining, Quarrying, & Extraction | 0 (0.0%) | 0 (0.0%) |
| Construction | 15 (75.0%) | 5 (25.0%) |
| Manufacturing | 71 (100.0%) | 0 (0.0%) |
| Wholesale Trade | 0 (0.0%) | 0 (0.0%) |
| Retail Trade | 6 (37.5%) | 10 (62.5%) |
| Transportation & Warehousing | 8 (61.5%) | 5 (38.5%) |
| Utilities | 0 (0.0%) | 0 (0.0%) |
| Information | 4 (100.0%) | 0 (0.0%) |
| Finance & Insurance | 0 (0.0%) | 4 (100.0%) |
| Real Estate, Rental & Leasing | 0 (0.0%) | 0 (0.0%) |
| Professional & Scientific | 0 (0.0%) | 0 (0.0%) |
| Enterprise Management | 0 (0.0%) | 0 (0.0%) |
| Administrative & Support | 2 (100.0%) | 0 (0.0%) |
| Educational Services | 0 (0.0%) | 18 (100.0%) |
| Health Care & Social Assistance | 3 (9.7%) | 28 (90.3%) |
| Arts, Entertainment & Recreation | 1 (33.3%) | 2 (66.7%) |
| Accommodation & Food Services | 0 (0.0%) | 0 (0.0%) |
| Public Administration | 16 (84.2%) | 3 (15.8%) |
| Total | 132 (63.2%) | 77 (36.8%) |
Education in Ellsinore
School Enrollment in Ellsinore
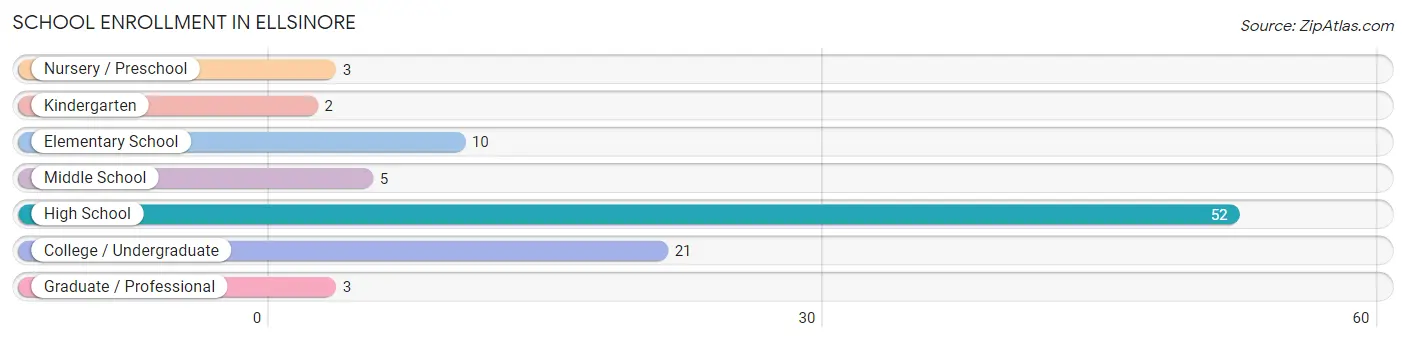
The most common levels of schooling among the 96 students in Ellsinore are high school (52 | 54.2%), college / undergraduate (21 | 21.9%), and elementary school (10 | 10.4%).
| School Level | # Students | % Students |
| Nursery / Preschool | 3 | 3.1% |
| Kindergarten | 2 | 2.1% |
| Elementary School | 10 | 10.4% |
| Middle School | 5 | 5.2% |
| High School | 52 | 54.2% |
| College / Undergraduate | 21 | 21.9% |
| Graduate / Professional | 3 | 3.1% |
| Total | 96 | 100.0% |
School Enrollment by Age by Funding Source in Ellsinore
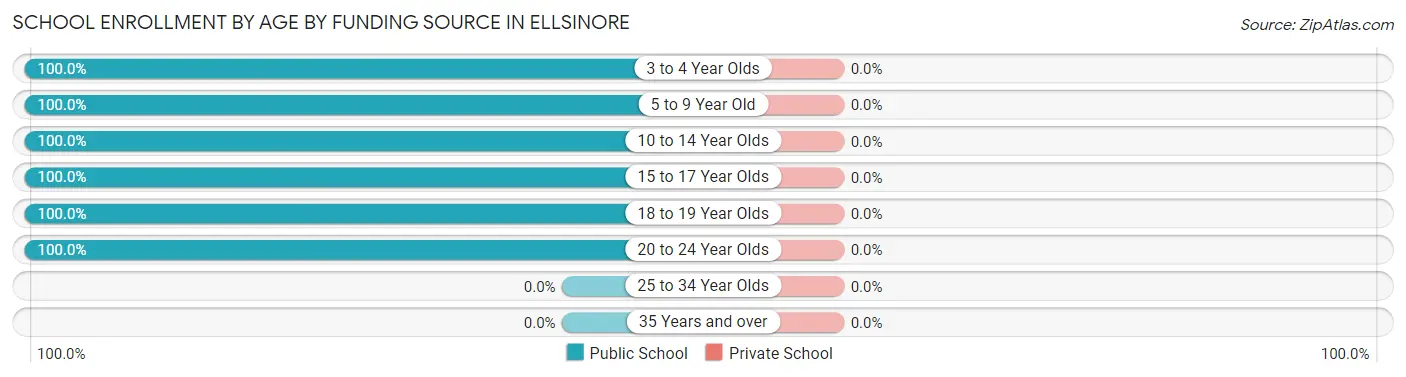
| Age Bracket | Public School | Private School |
| 3 to 4 Year Olds | 3 (100.0%) | 0 (0.0%) |
| 5 to 9 Year Old | 7 (100.0%) | 0 (0.0%) |
| 10 to 14 Year Olds | 10 (100.0%) | 0 (0.0%) |
| 15 to 17 Year Olds | 21 (100.0%) | 0 (0.0%) |
| 18 to 19 Year Olds | 31 (100.0%) | 0 (0.0%) |
| 20 to 24 Year Olds | 24 (100.0%) | 0 (0.0%) |
| 25 to 34 Year Olds | 0 (0.0%) | 0 (0.0%) |
| 35 Years and over | 0 (0.0%) | 0 (0.0%) |
| Total | 96 (100.0%) | 0 (0.0%) |
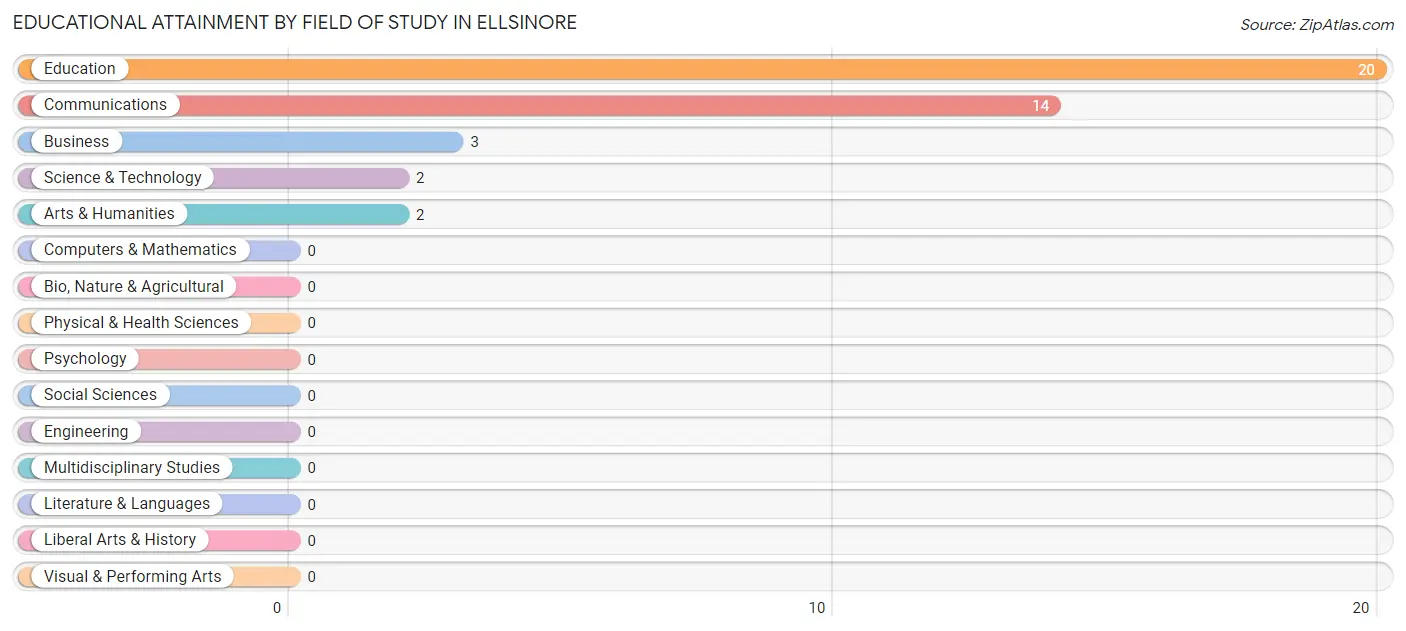
Educational Attainment by Field of Study in Ellsinore
Education (20 | 48.8%), communications (14 | 34.2%), business (3 | 7.3%), science & technology (2 | 4.9%), and arts & humanities (2 | 4.9%) are the most common fields of study among 41 individuals in Ellsinore who have obtained a bachelor's degree or higher.
| Field of Study | # Graduates | % Graduates |
| Computers & Mathematics | 0 | 0.0% |
| Bio, Nature & Agricultural | 0 | 0.0% |
| Physical & Health Sciences | 0 | 0.0% |
| Psychology | 0 | 0.0% |
| Social Sciences | 0 | 0.0% |
| Engineering | 0 | 0.0% |
| Multidisciplinary Studies | 0 | 0.0% |
| Science & Technology | 2 | 4.9% |
| Business | 3 | 7.3% |
| Education | 20 | 48.8% |
| Literature & Languages | 0 | 0.0% |
| Liberal Arts & History | 0 | 0.0% |
| Visual & Performing Arts | 0 | 0.0% |
| Communications | 14 | 34.2% |
| Arts & Humanities | 2 | 4.9% |
| Total | 41 | 100.0% |
Transportation & Commute in Ellsinore
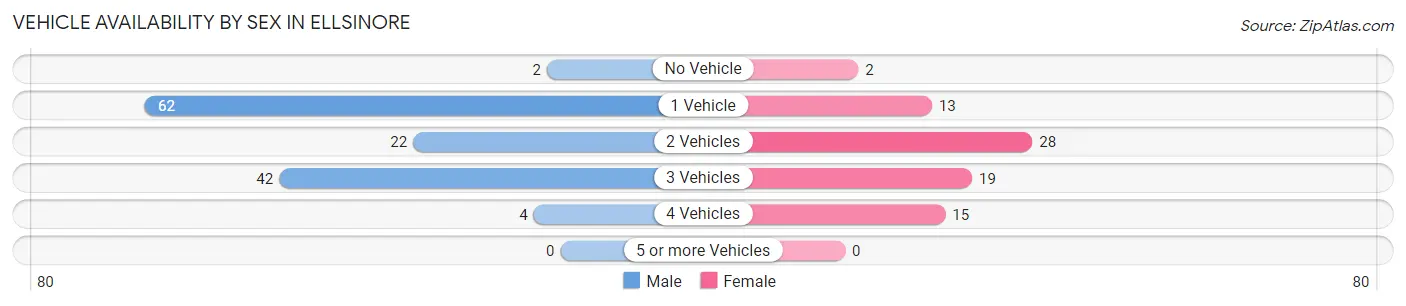
Vehicle Availability by Sex in Ellsinore
The most prevalent vehicle ownership categories in Ellsinore are males with 1 vehicle (62, accounting for 47.0%) and females with 1 vehicle (13, making up 80.5%).
| Vehicles Available | Male | Female |
| No Vehicle | 2 (1.5%) | 2 (2.6%) |
| 1 Vehicle | 62 (47.0%) | 13 (16.9%) |
| 2 Vehicles | 22 (16.7%) | 28 (36.4%) |
| 3 Vehicles | 42 (31.8%) | 19 (24.7%) |
| 4 Vehicles | 4 (3.0%) | 15 (19.5%) |
| 5 or more Vehicles | 0 (0.0%) | 0 (0.0%) |
| Total | 132 (100.0%) | 77 (100.0%) |
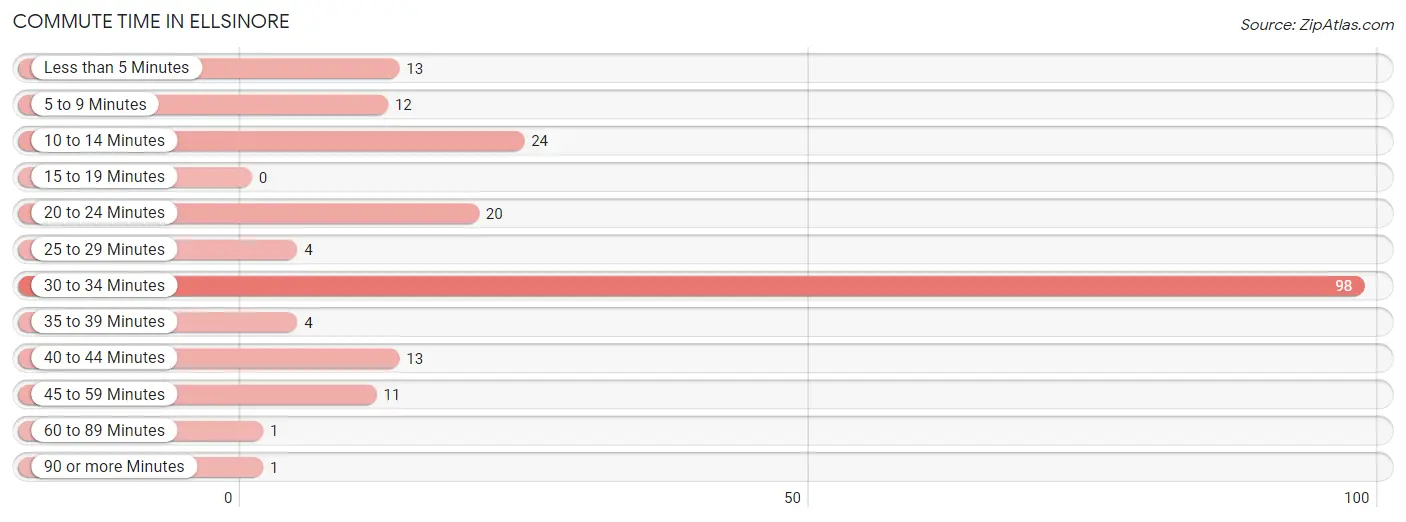
Commute Time in Ellsinore
The most frequently occuring commute durations in Ellsinore are 30 to 34 minutes (98 commuters, 48.8%), 10 to 14 minutes (24 commuters, 11.9%), and 20 to 24 minutes (20 commuters, 10.0%).
| Commute Time | # Commuters | % Commuters |
| Less than 5 Minutes | 13 | 6.5% |
| 5 to 9 Minutes | 12 | 6.0% |
| 10 to 14 Minutes | 24 | 11.9% |
| 15 to 19 Minutes | 0 | 0.0% |
| 20 to 24 Minutes | 20 | 10.0% |
| 25 to 29 Minutes | 4 | 2.0% |
| 30 to 34 Minutes | 98 | 48.8% |
| 35 to 39 Minutes | 4 | 2.0% |
| 40 to 44 Minutes | 13 | 6.5% |
| 45 to 59 Minutes | 11 | 5.5% |
| 60 to 89 Minutes | 1 | 0.5% |
| 90 or more Minutes | 1 | 0.5% |
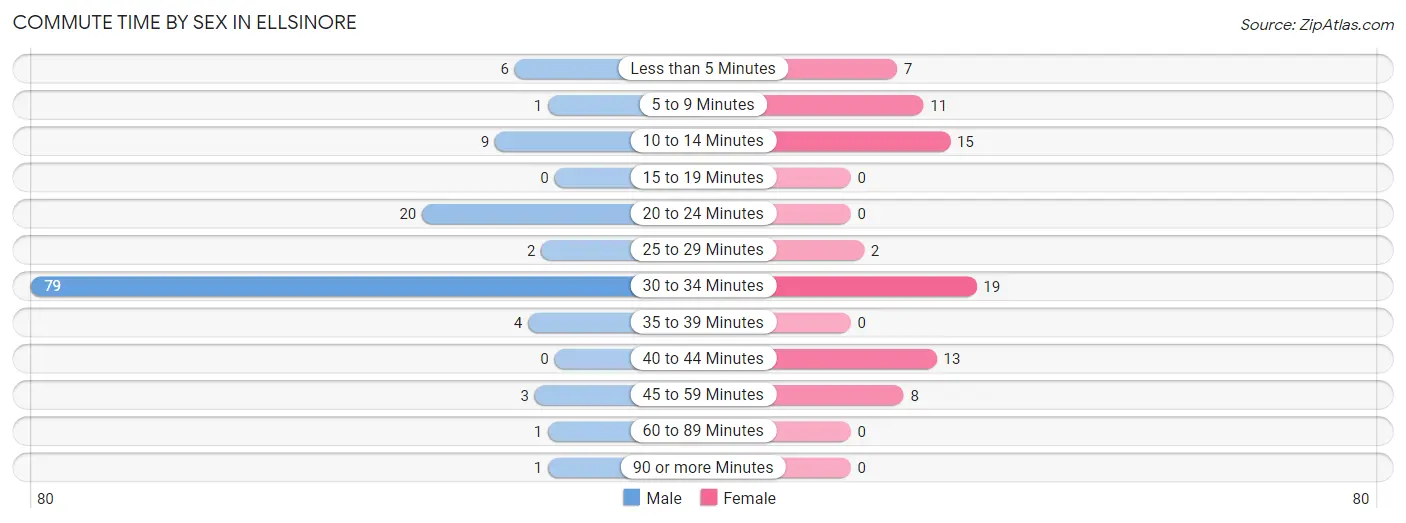
Commute Time by Sex in Ellsinore
The most common commute times in Ellsinore are 30 to 34 minutes (79 commuters, 62.7%) for males and 30 to 34 minutes (19 commuters, 25.3%) for females.
| Commute Time | Male | Female |
| Less than 5 Minutes | 6 (4.8%) | 7 (9.3%) |
| 5 to 9 Minutes | 1 (0.8%) | 11 (14.7%) |
| 10 to 14 Minutes | 9 (7.1%) | 15 (20.0%) |
| 15 to 19 Minutes | 0 (0.0%) | 0 (0.0%) |
| 20 to 24 Minutes | 20 (15.9%) | 0 (0.0%) |
| 25 to 29 Minutes | 2 (1.6%) | 2 (2.7%) |
| 30 to 34 Minutes | 79 (62.7%) | 19 (25.3%) |
| 35 to 39 Minutes | 4 (3.2%) | 0 (0.0%) |
| 40 to 44 Minutes | 0 (0.0%) | 13 (17.3%) |
| 45 to 59 Minutes | 3 (2.4%) | 8 (10.7%) |
| 60 to 89 Minutes | 1 (0.8%) | 0 (0.0%) |
| 90 or more Minutes | 1 (0.8%) | 0 (0.0%) |
Time of Departure to Work by Sex in Ellsinore
The most frequent times of departure to work in Ellsinore are 7:00 AM to 7:29 AM (54, 42.9%) for males and 7:30 AM to 7:59 AM (13, 17.3%) for females.
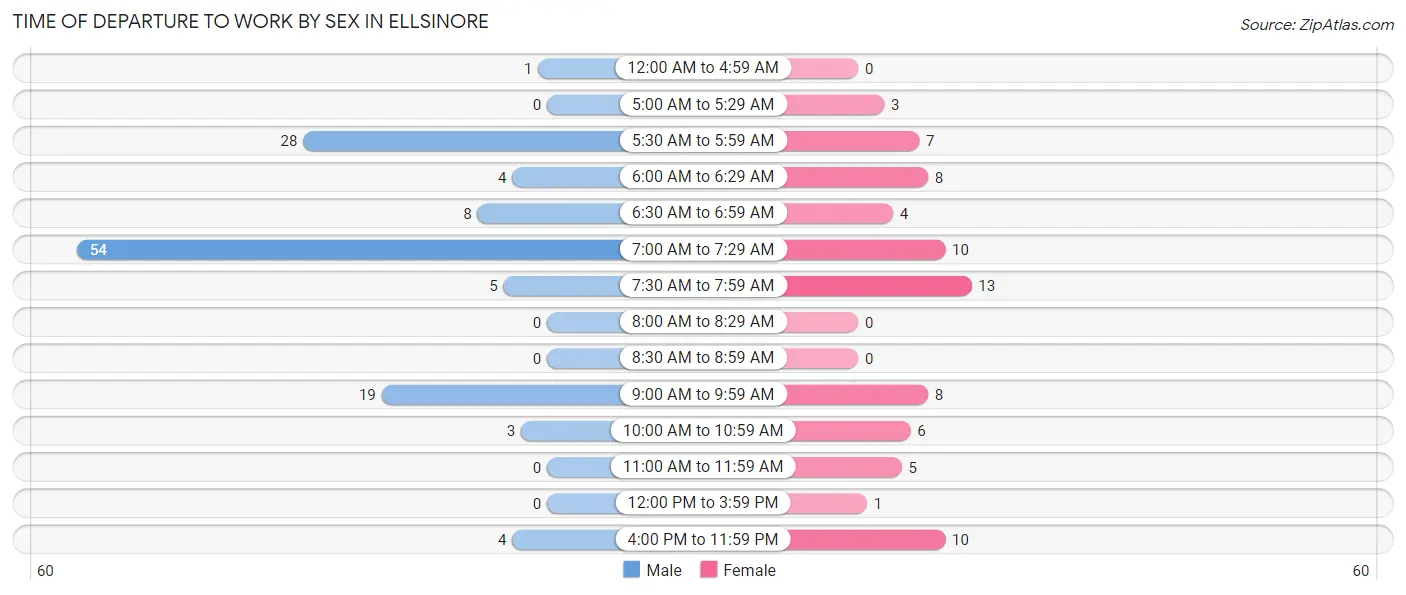
| Time of Departure | Male | Female |
| 12:00 AM to 4:59 AM | 1 (0.8%) | 0 (0.0%) |
| 5:00 AM to 5:29 AM | 0 (0.0%) | 3 (4.0%) |
| 5:30 AM to 5:59 AM | 28 (22.2%) | 7 (9.3%) |
| 6:00 AM to 6:29 AM | 4 (3.2%) | 8 (10.7%) |
| 6:30 AM to 6:59 AM | 8 (6.4%) | 4 (5.3%) |
| 7:00 AM to 7:29 AM | 54 (42.9%) | 10 (13.3%) |
| 7:30 AM to 7:59 AM | 5 (4.0%) | 13 (17.3%) |
| 8:00 AM to 8:29 AM | 0 (0.0%) | 0 (0.0%) |
| 8:30 AM to 8:59 AM | 0 (0.0%) | 0 (0.0%) |
| 9:00 AM to 9:59 AM | 19 (15.1%) | 8 (10.7%) |
| 10:00 AM to 10:59 AM | 3 (2.4%) | 6 (8.0%) |
| 11:00 AM to 11:59 AM | 0 (0.0%) | 5 (6.7%) |
| 12:00 PM to 3:59 PM | 0 (0.0%) | 1 (1.3%) |
| 4:00 PM to 11:59 PM | 4 (3.2%) | 10 (13.3%) |
| Total | 126 (100.0%) | 75 (100.0%) |
Housing Occupancy in Ellsinore
Occupancy by Ownership in Ellsinore
Of the total 188 dwellings in Ellsinore, owner-occupied units account for 72 (38.3%), while renter-occupied units make up 116 (61.7%).
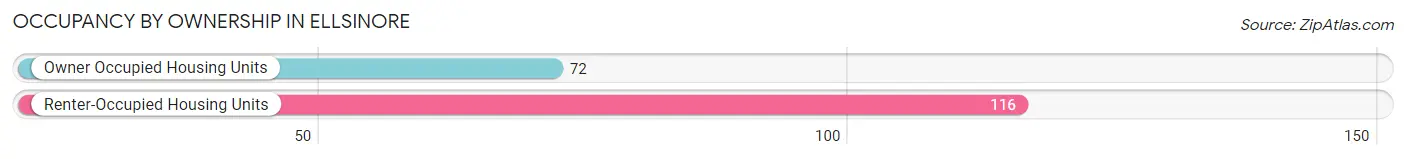
| Occupancy | # Housing Units | % Housing Units |
| Owner Occupied Housing Units | 72 | 38.3% |
| Renter-Occupied Housing Units | 116 | 61.7% |
| Total Occupied Housing Units | 188 | 100.0% |
Occupancy by Household Size in Ellsinore
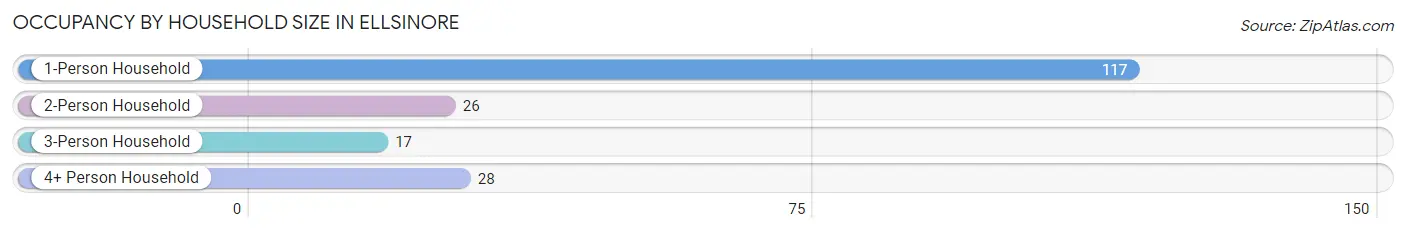
| Household Size | # Housing Units | % Housing Units |
| 1-Person Household | 117 | 62.2% |
| 2-Person Household | 26 | 13.8% |
| 3-Person Household | 17 | 9.0% |
| 4+ Person Household | 28 | 14.9% |
| Total Housing Units | 188 | 100.0% |
Occupancy by Ownership by Household Size in Ellsinore
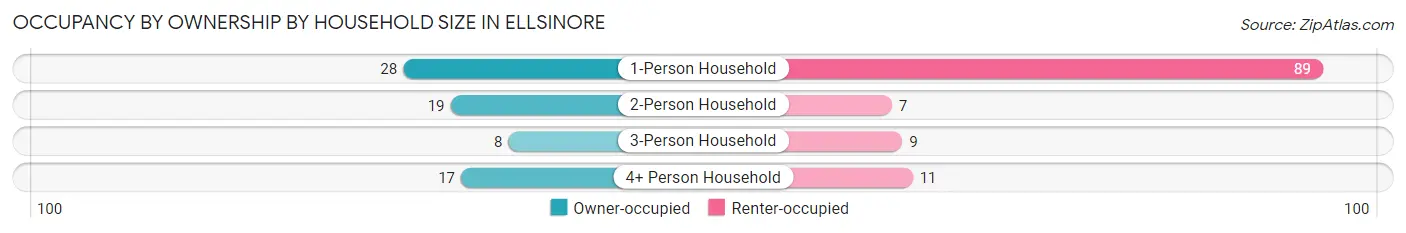
| Household Size | Owner-occupied | Renter-occupied |
| 1-Person Household | 28 (23.9%) | 89 (76.1%) |
| 2-Person Household | 19 (73.1%) | 7 (26.9%) |
| 3-Person Household | 8 (47.1%) | 9 (52.9%) |
| 4+ Person Household | 17 (60.7%) | 11 (39.3%) |
| Total Housing Units | 72 (38.3%) | 116 (61.7%) |
Occupancy by Educational Attainment in Ellsinore
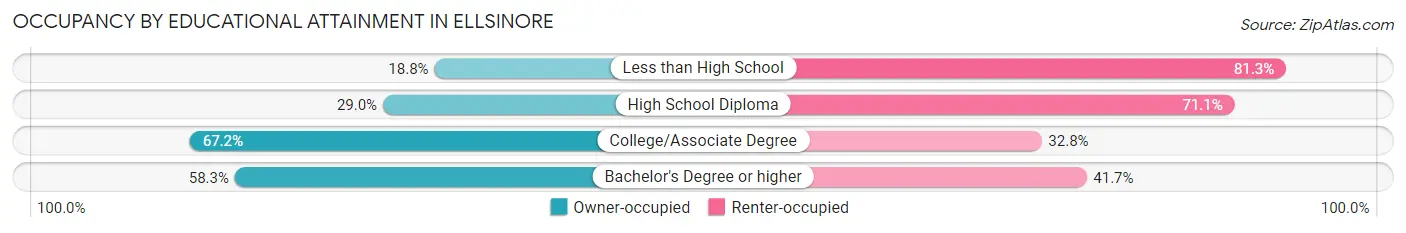
| Household Size | Owner-occupied | Renter-occupied |
| Less than High School | 15 (18.8%) | 65 (81.2%) |
| High School Diploma | 11 (28.9%) | 27 (71.1%) |
| College/Associate Degree | 39 (67.2%) | 19 (32.8%) |
| Bachelor's Degree or higher | 7 (58.3%) | 5 (41.7%) |
Occupancy by Age of Householder in Ellsinore
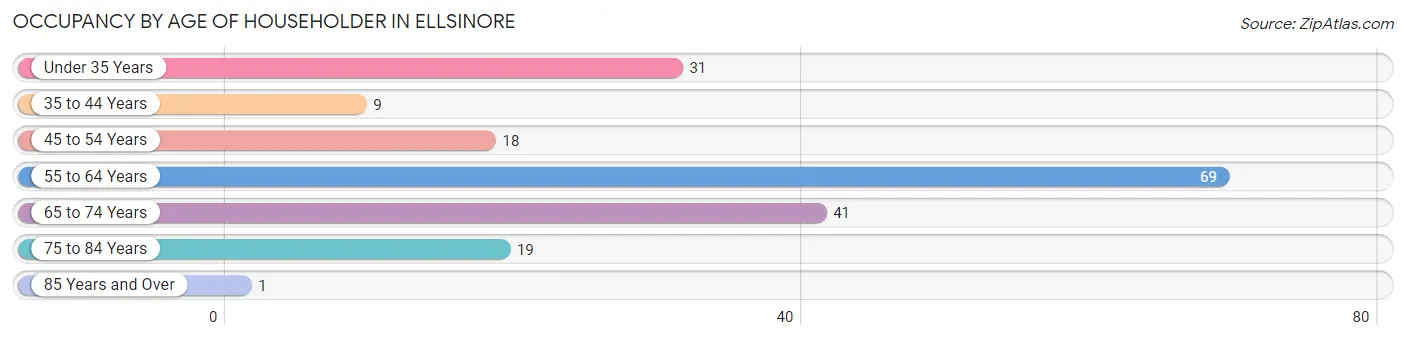
| Age Bracket | # Households | % Households |
| Under 35 Years | 31 | 16.5% |
| 35 to 44 Years | 9 | 4.8% |
| 45 to 54 Years | 18 | 9.6% |
| 55 to 64 Years | 69 | 36.7% |
| 65 to 74 Years | 41 | 21.8% |
| 75 to 84 Years | 19 | 10.1% |
| 85 Years and Over | 1 | 0.5% |
| Total | 188 | 100.0% |
Housing Finances in Ellsinore
Median Income by Occupancy in Ellsinore
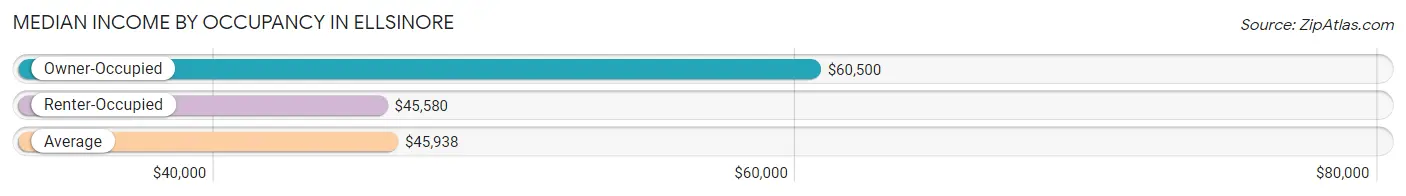
| Occupancy Type | # Households | Median Income |
| Owner-Occupied | 72 (38.3%) | $60,500 |
| Renter-Occupied | 116 (61.7%) | $45,580 |
| Average | 188 (100.0%) | $45,938 |
Occupancy by Householder Income Bracket in Ellsinore
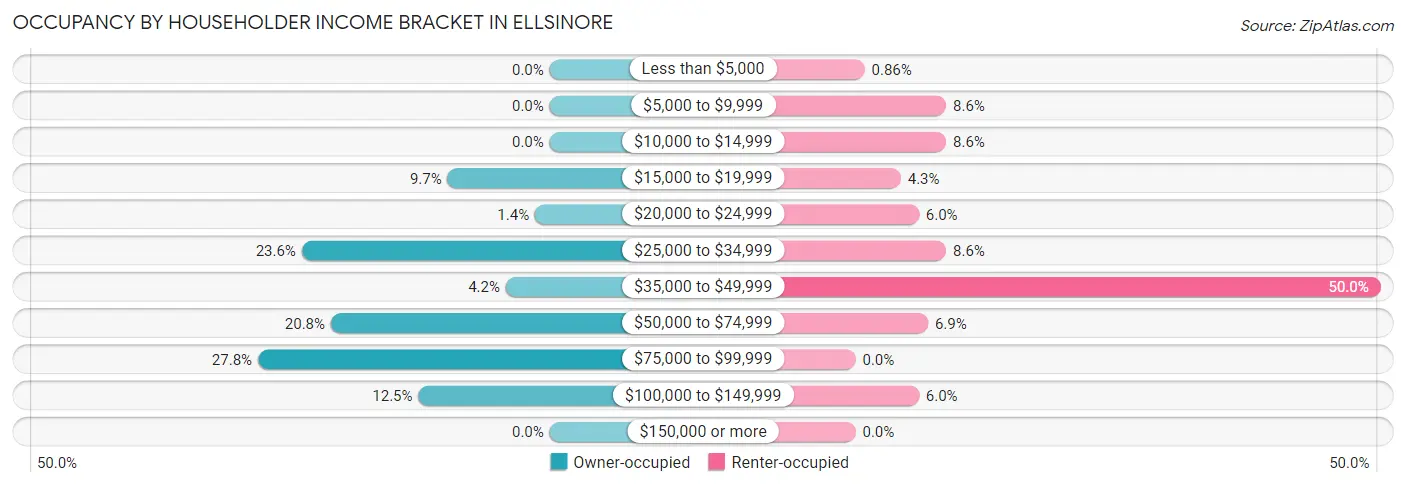
| Income Bracket | Owner-occupied | Renter-occupied |
| Less than $5,000 | 0 (0.0%) | 1 (0.9%) |
| $5,000 to $9,999 | 0 (0.0%) | 10 (8.6%) |
| $10,000 to $14,999 | 0 (0.0%) | 10 (8.6%) |
| $15,000 to $19,999 | 7 (9.7%) | 5 (4.3%) |
| $20,000 to $24,999 | 1 (1.4%) | 7 (6.0%) |
| $25,000 to $34,999 | 17 (23.6%) | 10 (8.6%) |
| $35,000 to $49,999 | 3 (4.2%) | 58 (50.0%) |
| $50,000 to $74,999 | 15 (20.8%) | 8 (6.9%) |
| $75,000 to $99,999 | 20 (27.8%) | 0 (0.0%) |
| $100,000 to $149,999 | 9 (12.5%) | 7 (6.0%) |
| $150,000 or more | 0 (0.0%) | 0 (0.0%) |
| Total | 72 (100.0%) | 116 (100.0%) |
Monthly Housing Cost Tiers in Ellsinore
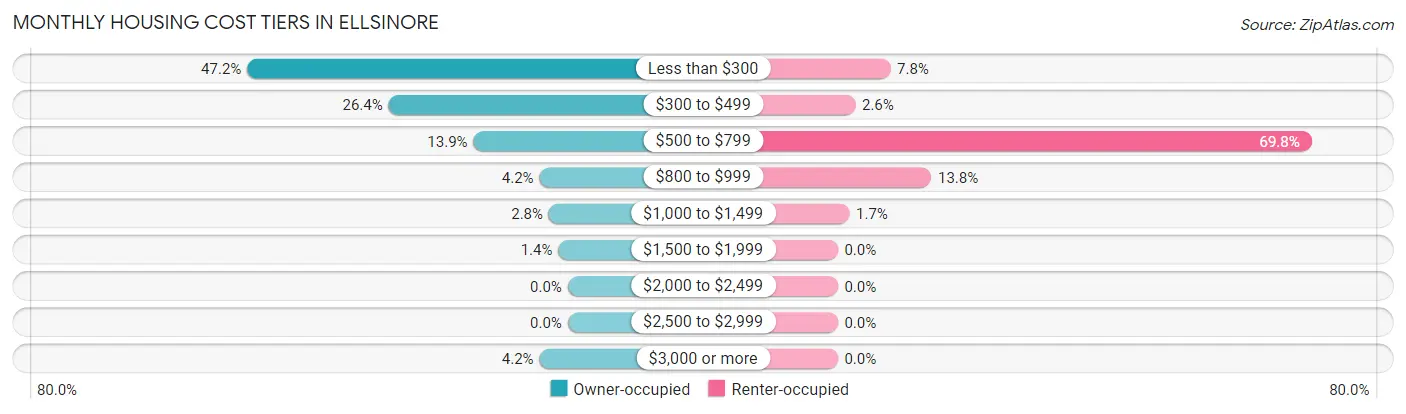
| Monthly Cost | Owner-occupied | Renter-occupied |
| Less than $300 | 34 (47.2%) | 9 (7.8%) |
| $300 to $499 | 19 (26.4%) | 3 (2.6%) |
| $500 to $799 | 10 (13.9%) | 81 (69.8%) |
| $800 to $999 | 3 (4.2%) | 16 (13.8%) |
| $1,000 to $1,499 | 2 (2.8%) | 2 (1.7%) |
| $1,500 to $1,999 | 1 (1.4%) | 0 (0.0%) |
| $2,000 to $2,499 | 0 (0.0%) | 0 (0.0%) |
| $2,500 to $2,999 | 0 (0.0%) | 0 (0.0%) |
| $3,000 or more | 3 (4.2%) | 0 (0.0%) |
| Total | 72 (100.0%) | 116 (100.0%) |
Physical Housing Characteristics in Ellsinore
Housing Structures in Ellsinore
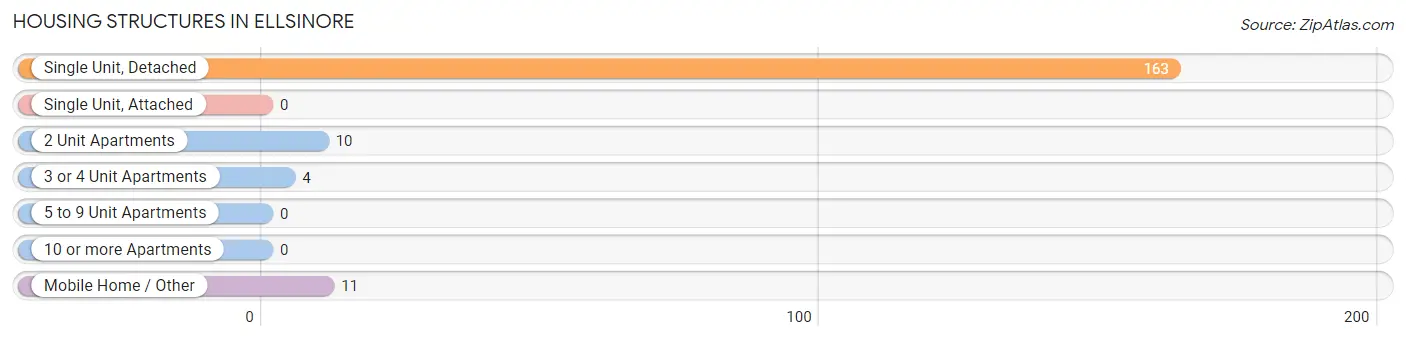
| Structure Type | # Housing Units | % Housing Units |
| Single Unit, Detached | 163 | 86.7% |
| Single Unit, Attached | 0 | 0.0% |
| 2 Unit Apartments | 10 | 5.3% |
| 3 or 4 Unit Apartments | 4 | 2.1% |
| 5 to 9 Unit Apartments | 0 | 0.0% |
| 10 or more Apartments | 0 | 0.0% |
| Mobile Home / Other | 11 | 5.9% |
| Total | 188 | 100.0% |
Housing Structures by Occupancy in Ellsinore
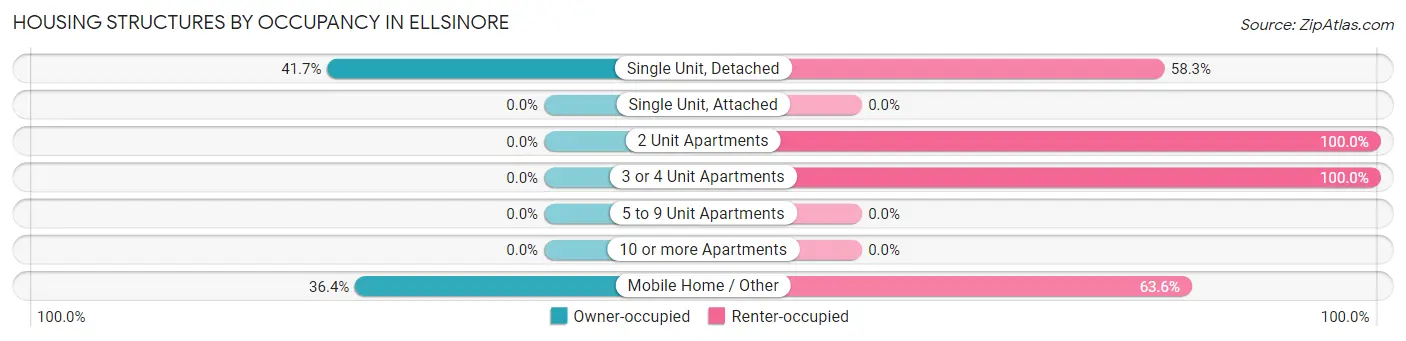
| Structure Type | Owner-occupied | Renter-occupied |
| Single Unit, Detached | 68 (41.7%) | 95 (58.3%) |
| Single Unit, Attached | 0 (0.0%) | 0 (0.0%) |
| 2 Unit Apartments | 0 (0.0%) | 10 (100.0%) |
| 3 or 4 Unit Apartments | 0 (0.0%) | 4 (100.0%) |
| 5 to 9 Unit Apartments | 0 (0.0%) | 0 (0.0%) |
| 10 or more Apartments | 0 (0.0%) | 0 (0.0%) |
| Mobile Home / Other | 4 (36.4%) | 7 (63.6%) |
| Total | 72 (38.3%) | 116 (61.7%) |
Housing Structures by Number of Rooms in Ellsinore
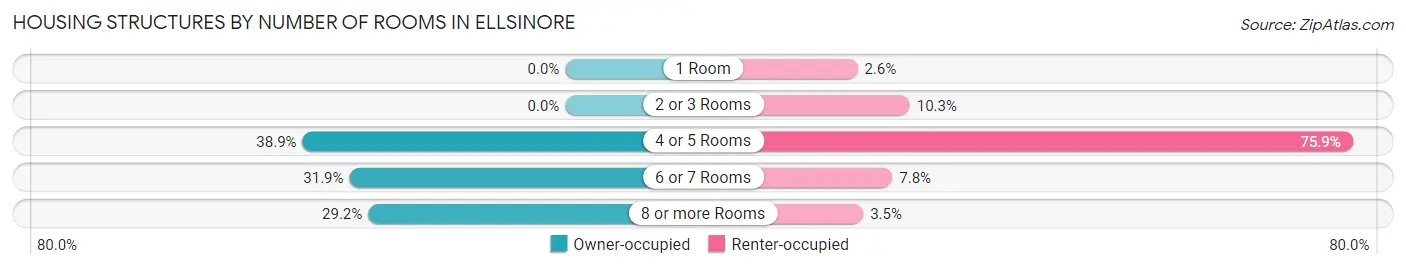
| Number of Rooms | Owner-occupied | Renter-occupied |
| 1 Room | 0 (0.0%) | 3 (2.6%) |
| 2 or 3 Rooms | 0 (0.0%) | 12 (10.3%) |
| 4 or 5 Rooms | 28 (38.9%) | 88 (75.9%) |
| 6 or 7 Rooms | 23 (31.9%) | 9 (7.8%) |
| 8 or more Rooms | 21 (29.2%) | 4 (3.5%) |
| Total | 72 (100.0%) | 116 (100.0%) |
Housing Structure by Heating Type in Ellsinore
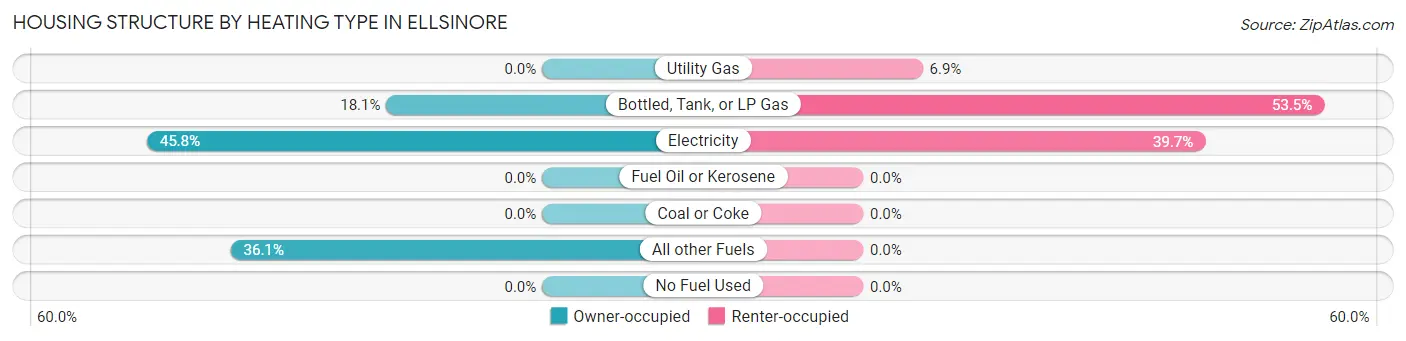
| Heating Type | Owner-occupied | Renter-occupied |
| Utility Gas | 0 (0.0%) | 8 (6.9%) |
| Bottled, Tank, or LP Gas | 13 (18.1%) | 62 (53.4%) |
| Electricity | 33 (45.8%) | 46 (39.7%) |
| Fuel Oil or Kerosene | 0 (0.0%) | 0 (0.0%) |
| Coal or Coke | 0 (0.0%) | 0 (0.0%) |
| All other Fuels | 26 (36.1%) | 0 (0.0%) |
| No Fuel Used | 0 (0.0%) | 0 (0.0%) |
| Total | 72 (100.0%) | 116 (100.0%) |
Household Vehicle Usage in Ellsinore
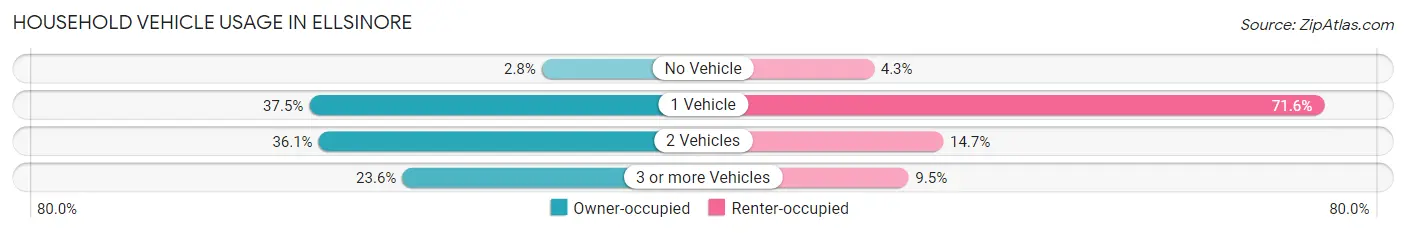
| Vehicles per Household | Owner-occupied | Renter-occupied |
| No Vehicle | 2 (2.8%) | 5 (4.3%) |
| 1 Vehicle | 27 (37.5%) | 83 (71.6%) |
| 2 Vehicles | 26 (36.1%) | 17 (14.7%) |
| 3 or more Vehicles | 17 (23.6%) | 11 (9.5%) |
| Total | 72 (100.0%) | 116 (100.0%) |
Real Estate & Mortgages in Ellsinore
Real Estate and Mortgage Overview in Ellsinore
| Characteristic | Without Mortgage | With Mortgage |
| Housing Units | 51 | 21 |
| Median Property Value | - | - |
| Median Household Income | $60,313 | $0 |
| Monthly Housing Costs | - | - |
| Real Estate Taxes | $707 | $0 |
Property Value by Mortgage Status in Ellsinore
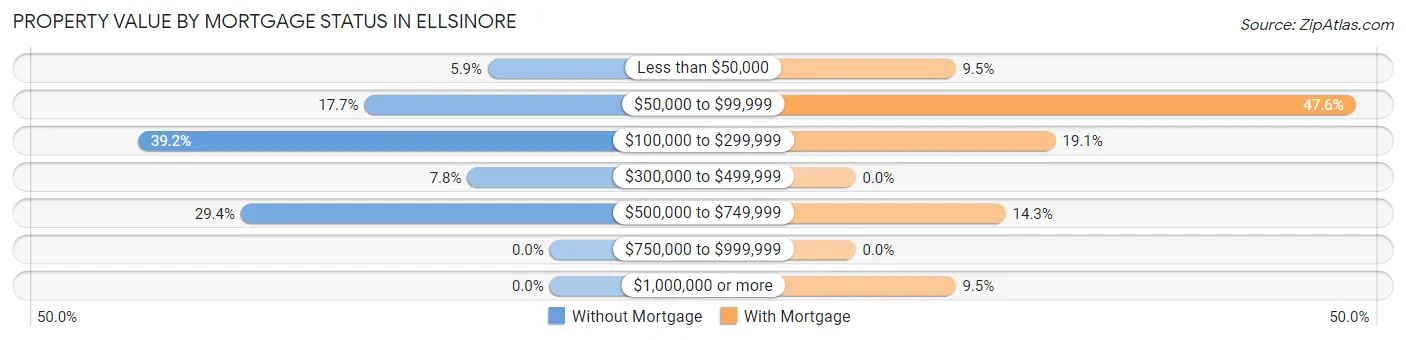
| Property Value | Without Mortgage | With Mortgage |
| Less than $50,000 | 3 (5.9%) | 2 (9.5%) |
| $50,000 to $99,999 | 9 (17.6%) | 10 (47.6%) |
| $100,000 to $299,999 | 20 (39.2%) | 4 (19.1%) |
| $300,000 to $499,999 | 4 (7.8%) | 0 (0.0%) |
| $500,000 to $749,999 | 15 (29.4%) | 3 (14.3%) |
| $750,000 to $999,999 | 0 (0.0%) | 0 (0.0%) |
| $1,000,000 or more | 0 (0.0%) | 2 (9.5%) |
| Total | 51 (100.0%) | 21 (100.0%) |
Household Income by Mortgage Status in Ellsinore
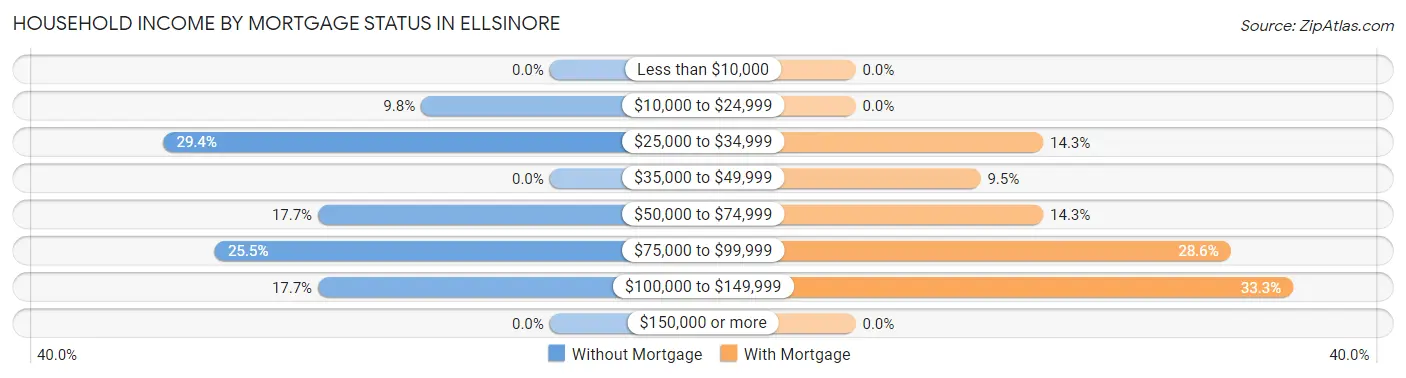
| Household Income | Without Mortgage | With Mortgage |
| Less than $10,000 | 0 (0.0%) | 0 (0.0%) |
| $10,000 to $24,999 | 5 (9.8%) | 0 (0.0%) |
| $25,000 to $34,999 | 15 (29.4%) | 3 (14.3%) |
| $35,000 to $49,999 | 0 (0.0%) | 2 (9.5%) |
| $50,000 to $74,999 | 9 (17.6%) | 3 (14.3%) |
| $75,000 to $99,999 | 13 (25.5%) | 6 (28.6%) |
| $100,000 to $149,999 | 9 (17.6%) | 7 (33.3%) |
| $150,000 or more | 0 (0.0%) | 0 (0.0%) |
| Total | 51 (100.0%) | 21 (100.0%) |
Property Value to Household Income Ratio in Ellsinore
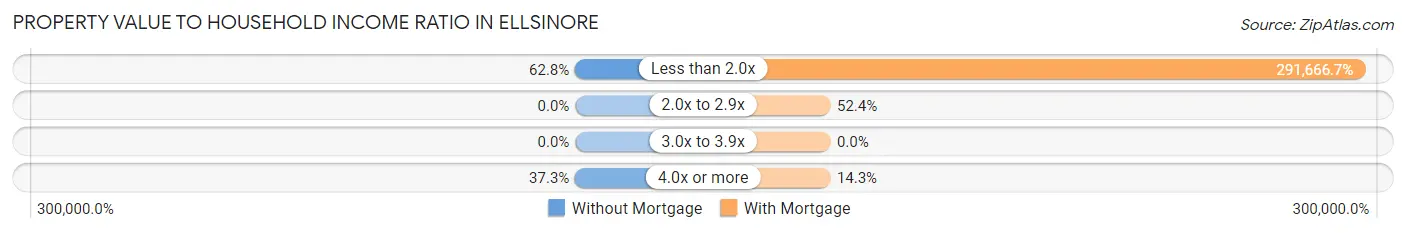
| Value-to-Income Ratio | Without Mortgage | With Mortgage |
| Less than 2.0x | 32 (62.7%) | 61,250 (291,666.7%) |
| 2.0x to 2.9x | 0 (0.0%) | 11 (52.4%) |
| 3.0x to 3.9x | 0 (0.0%) | 0 (0.0%) |
| 4.0x or more | 19 (37.2%) | 3 (14.3%) |
| Total | 51 (100.0%) | 21 (100.0%) |
Real Estate Taxes by Mortgage Status in Ellsinore
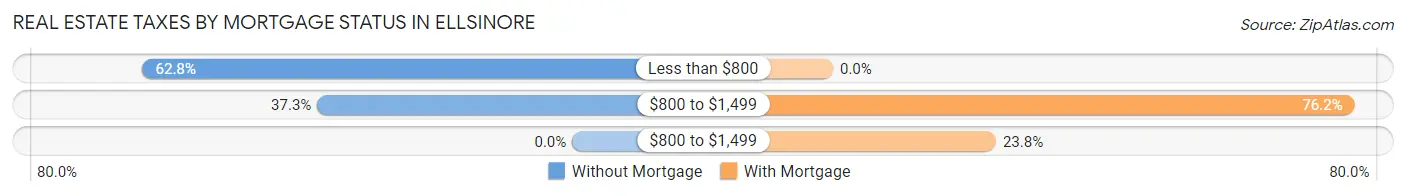
| Property Taxes | Without Mortgage | With Mortgage |
| Less than $800 | 32 (62.7%) | 0 (0.0%) |
| $800 to $1,499 | 19 (37.2%) | 16 (76.2%) |
| $800 to $1,499 | 0 (0.0%) | 5 (23.8%) |
| Total | 51 (100.0%) | 21 (100.0%) |
Health & Disability in Ellsinore
Health Insurance Coverage by Age in Ellsinore
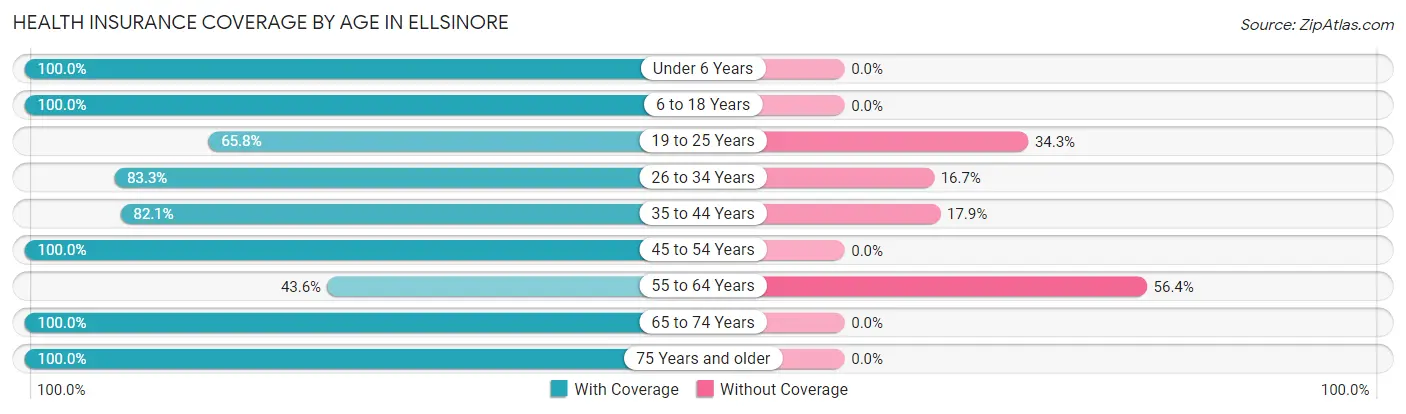
| Age Bracket | With Coverage | Without Coverage |
| Under 6 Years | 41 (100.0%) | 0 (0.0%) |
| 6 to 18 Years | 56 (100.0%) | 0 (0.0%) |
| 19 to 25 Years | 48 (65.7%) | 25 (34.3%) |
| 26 to 34 Years | 35 (83.3%) | 7 (16.7%) |
| 35 to 44 Years | 23 (82.1%) | 5 (17.9%) |
| 45 to 54 Years | 31 (100.0%) | 0 (0.0%) |
| 55 to 64 Years | 41 (43.6%) | 53 (56.4%) |
| 65 to 74 Years | 52 (100.0%) | 0 (0.0%) |
| 75 Years and older | 25 (100.0%) | 0 (0.0%) |
| Total | 352 (79.6%) | 90 (20.4%) |
Health Insurance Coverage by Citizenship Status in Ellsinore

| Citizenship Status | With Coverage | Without Coverage |
| Native Born | 41 (100.0%) | 0 (0.0%) |
| Foreign Born, Citizen | 56 (100.0%) | 0 (0.0%) |
| Foreign Born, not a Citizen | 48 (65.7%) | 25 (34.3%) |
Health Insurance Coverage by Household Income in Ellsinore
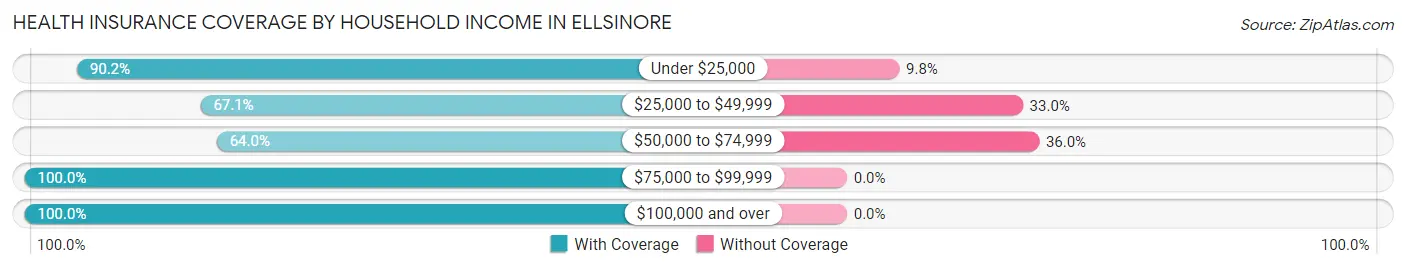
| Household Income | With Coverage | Without Coverage |
| Under $25,000 | 46 (90.2%) | 5 (9.8%) |
| $25,000 to $49,999 | 118 (67.0%) | 58 (33.0%) |
| $50,000 to $74,999 | 48 (64.0%) | 27 (36.0%) |
| $75,000 to $99,999 | 95 (100.0%) | 0 (0.0%) |
| $100,000 and over | 44 (100.0%) | 0 (0.0%) |
Public vs Private Health Insurance Coverage by Age in Ellsinore
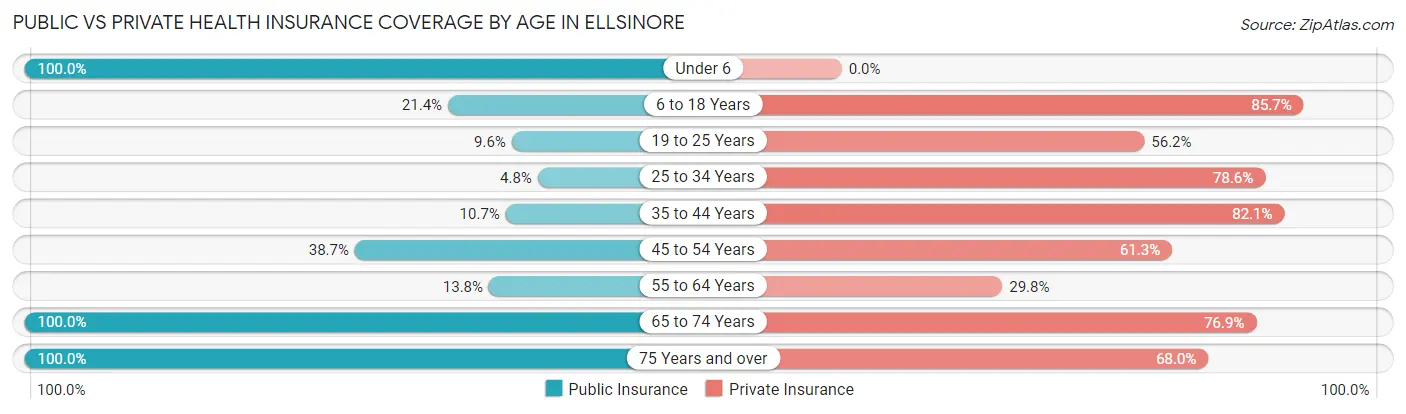
| Age Bracket | Public Insurance | Private Insurance |
| Under 6 | 41 (100.0%) | 0 (0.0%) |
| 6 to 18 Years | 12 (21.4%) | 48 (85.7%) |
| 19 to 25 Years | 7 (9.6%) | 41 (56.2%) |
| 25 to 34 Years | 2 (4.8%) | 33 (78.6%) |
| 35 to 44 Years | 3 (10.7%) | 23 (82.1%) |
| 45 to 54 Years | 12 (38.7%) | 19 (61.3%) |
| 55 to 64 Years | 13 (13.8%) | 28 (29.8%) |
| 65 to 74 Years | 52 (100.0%) | 40 (76.9%) |
| 75 Years and over | 25 (100.0%) | 17 (68.0%) |
| Total | 167 (37.8%) | 249 (56.3%) |
Disability Status by Sex by Age in Ellsinore
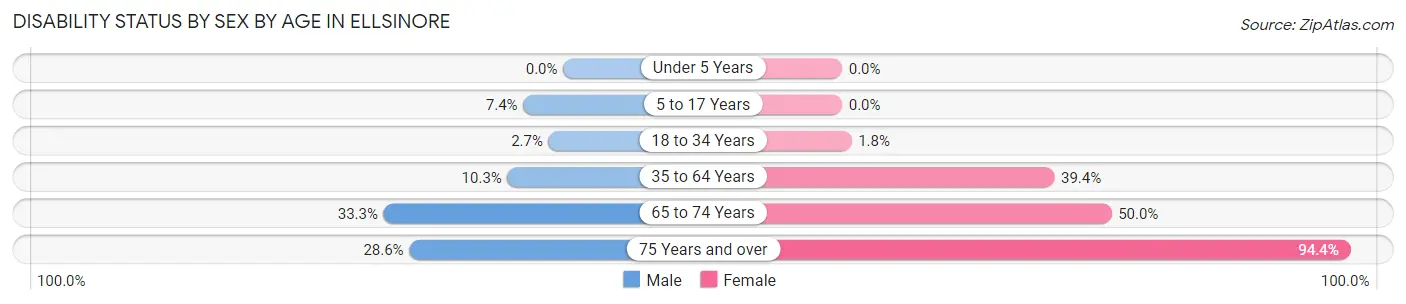
| Age Bracket | Male | Female |
| Under 5 Years | 0 (0.0%) | 0 (0.0%) |
| 5 to 17 Years | 2 (7.4%) | 0 (0.0%) |
| 18 to 34 Years | 2 (2.7%) | 1 (1.8%) |
| 35 to 64 Years | 9 (10.3%) | 26 (39.4%) |
| 65 to 74 Years | 6 (33.3%) | 17 (50.0%) |
| 75 Years and over | 2 (28.6%) | 17 (94.4%) |
Disability Class by Sex by Age in Ellsinore
Disability Class: Hearing Difficulty
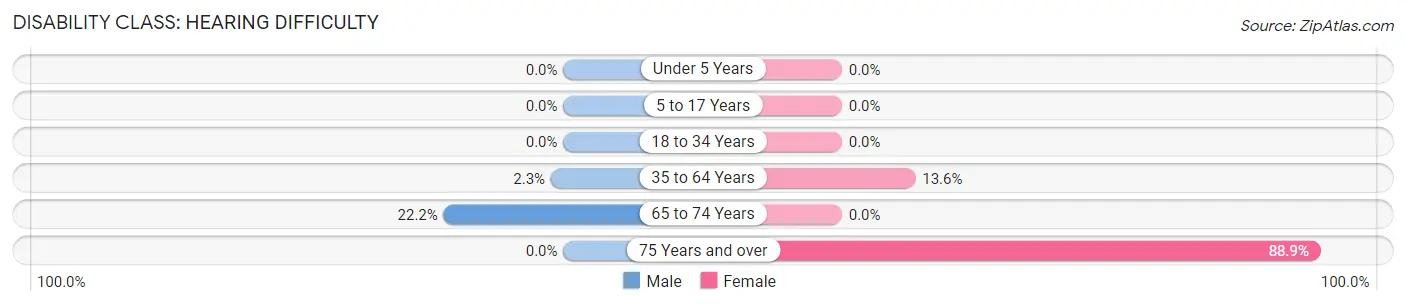
| Age Bracket | Male | Female |
| Under 5 Years | 0 (0.0%) | 0 (0.0%) |
| 5 to 17 Years | 0 (0.0%) | 0 (0.0%) |
| 18 to 34 Years | 0 (0.0%) | 0 (0.0%) |
| 35 to 64 Years | 2 (2.3%) | 9 (13.6%) |
| 65 to 74 Years | 4 (22.2%) | 0 (0.0%) |
| 75 Years and over | 0 (0.0%) | 16 (88.9%) |
Disability Class: Vision Difficulty
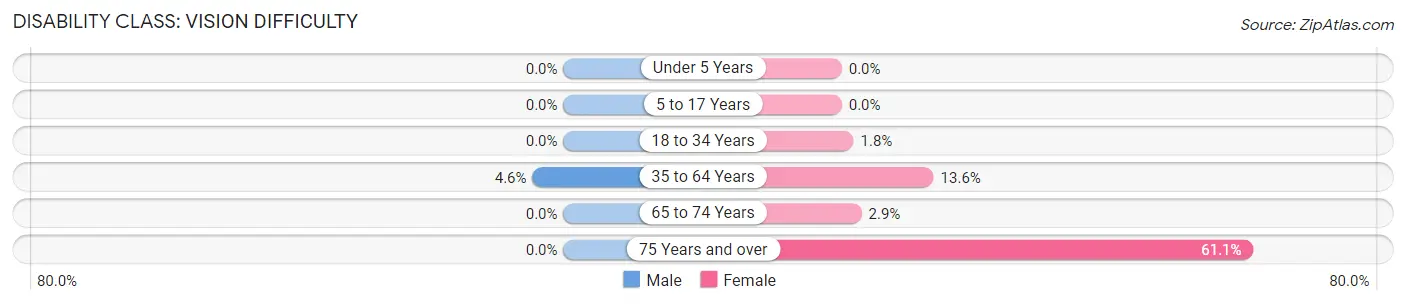
| Age Bracket | Male | Female |
| Under 5 Years | 0 (0.0%) | 0 (0.0%) |
| 5 to 17 Years | 0 (0.0%) | 0 (0.0%) |
| 18 to 34 Years | 0 (0.0%) | 1 (1.8%) |
| 35 to 64 Years | 4 (4.6%) | 9 (13.6%) |
| 65 to 74 Years | 0 (0.0%) | 1 (2.9%) |
| 75 Years and over | 0 (0.0%) | 11 (61.1%) |
Disability Class: Cognitive Difficulty
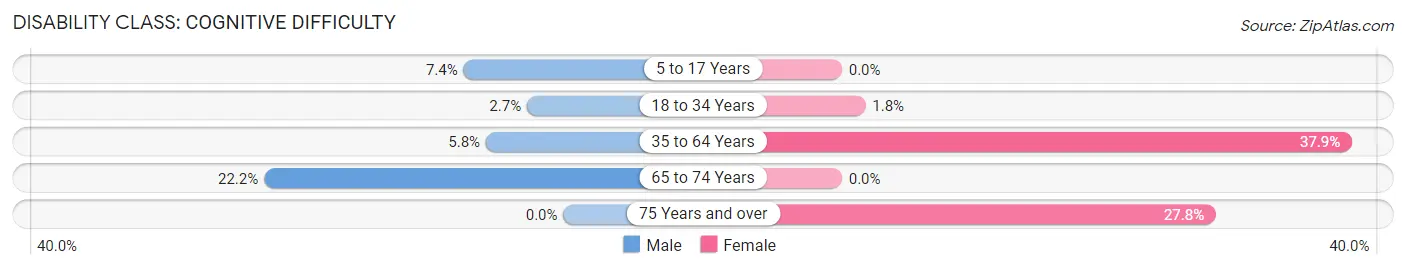
| Age Bracket | Male | Female |
| 5 to 17 Years | 2 (7.4%) | 0 (0.0%) |
| 18 to 34 Years | 2 (2.7%) | 1 (1.8%) |
| 35 to 64 Years | 5 (5.8%) | 25 (37.9%) |
| 65 to 74 Years | 4 (22.2%) | 0 (0.0%) |
| 75 Years and over | 0 (0.0%) | 5 (27.8%) |
Disability Class: Ambulatory Difficulty
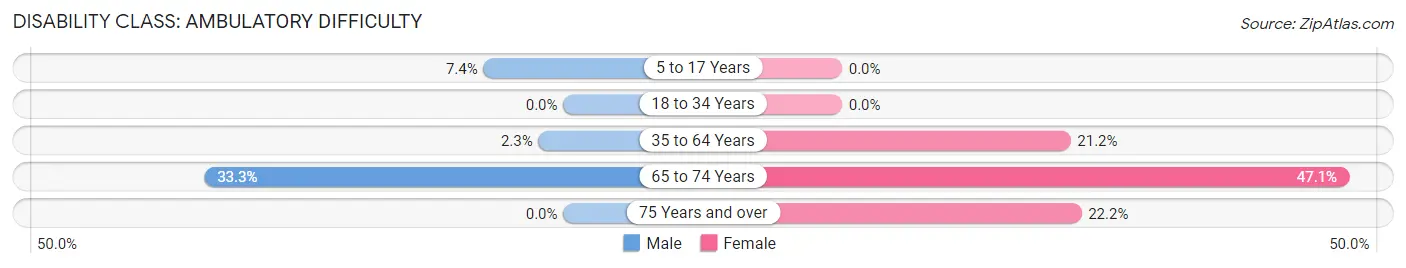
| Age Bracket | Male | Female |
| 5 to 17 Years | 2 (7.4%) | 0 (0.0%) |
| 18 to 34 Years | 0 (0.0%) | 0 (0.0%) |
| 35 to 64 Years | 2 (2.3%) | 14 (21.2%) |
| 65 to 74 Years | 6 (33.3%) | 16 (47.1%) |
| 75 Years and over | 0 (0.0%) | 4 (22.2%) |
Disability Class: Self-Care Difficulty
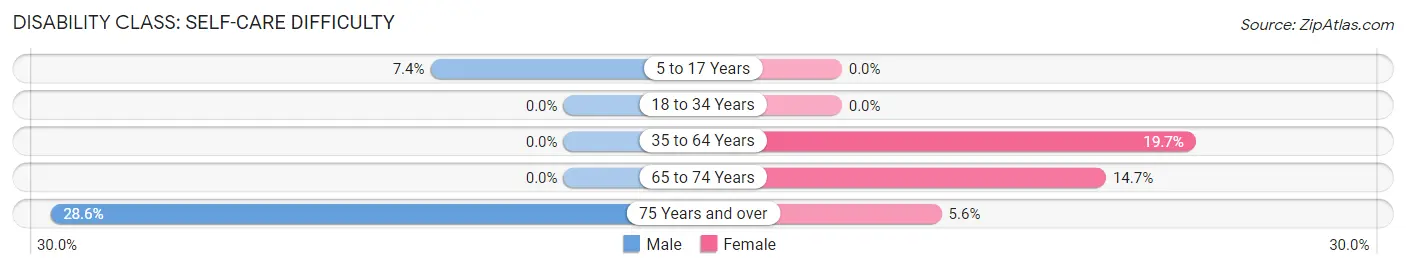
| Age Bracket | Male | Female |
| 5 to 17 Years | 2 (7.4%) | 0 (0.0%) |
| 18 to 34 Years | 0 (0.0%) | 0 (0.0%) |
| 35 to 64 Years | 0 (0.0%) | 13 (19.7%) |
| 65 to 74 Years | 0 (0.0%) | 5 (14.7%) |
| 75 Years and over | 2 (28.6%) | 1 (5.6%) |
Technology Access in Ellsinore
Computing Device Access in Ellsinore
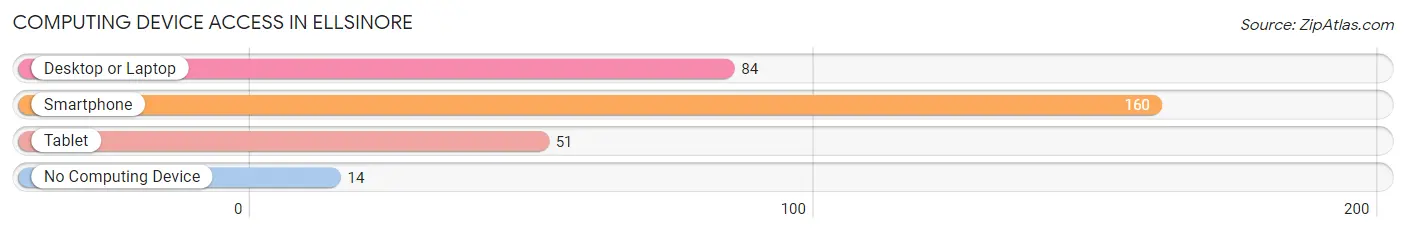
| Device Type | # Households | % Households |
| Desktop or Laptop | 84 | 44.7% |
| Smartphone | 160 | 85.1% |
| Tablet | 51 | 27.1% |
| No Computing Device | 14 | 7.4% |
| Total | 188 | 100.0% |
Internet Access in Ellsinore
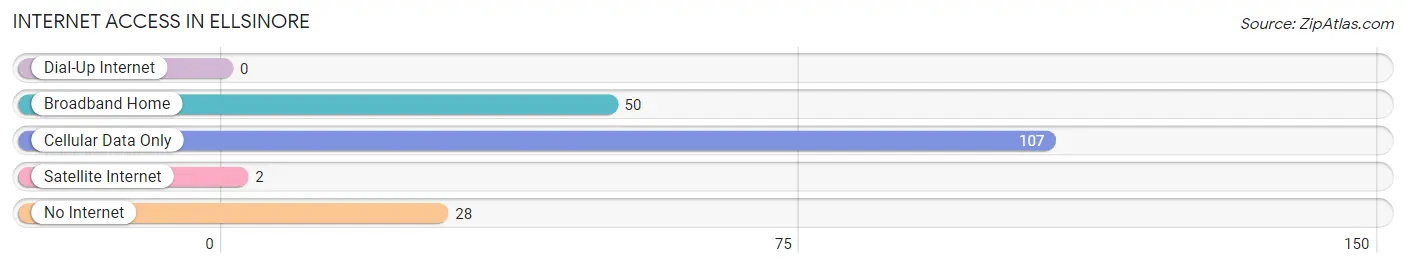
| Internet Type | # Households | % Households |
| Dial-Up Internet | 0 | 0.0% |
| Broadband Home | 50 | 26.6% |
| Cellular Data Only | 107 | 56.9% |
| Satellite Internet | 2 | 1.1% |
| No Internet | 28 | 14.9% |
| Total | 188 | 100.0% |
Ellsinore Summary
Ellsinore, MO is a small town located in Carter County, Missouri. It is situated in the Ozark Mountains, and is home to a population of just over 500 people. The town was founded in 1883, and has a rich history of farming, logging, and coal mining.
Geography
Ellsinore is located in the Ozark Mountains, and is surrounded by rolling hills and forests. The town is situated on the banks of the Black River, and is located about 30 miles south of Poplar Bluff, Missouri. The town is located at an elevation of 890 feet, and has a total area of 0.7 square miles.
Economy
The economy of Ellsinore is largely based on agriculture and forestry. The town is home to several farms, and the surrounding area is known for its timber production. The town also has a small coal mining industry, and there are several small businesses in the area.
Demographics
As of the 2010 census, Ellsinore had a population of 514 people. The racial makeup of the town was 97.3% White, 0.6% African American, 0.2% Native American, 0.2% Asian, 0.2% from other races, and 1.5% from two or more races. Hispanic or Latino of any race were 0.6% of the population.
The median income for a household in Ellsinore was $25,000, and the median income for a family was $30,000. The per capita income for the town was $14,000. About 17.2% of families and 19.2% of the population were below the poverty line, including 25.0% of those under age 18 and 10.3% of those age 65 or over.
History
Ellsinore was founded in 1883 by a group of settlers from Tennessee. The town was named after a local creek, and was originally a farming community. The town was also home to several coal mines, and the surrounding area was known for its timber production.
In the early 1900s, Ellsinore was a thriving community, with a population of over 1,000 people. The town had several stores, a bank, a hotel, and a post office. The town also had a school, and several churches.
In the late 1950s, the coal mines began to close, and the population of Ellsinore began to decline. By the 1970s, the population had dropped to just over 500 people. The town has remained relatively unchanged since then, and is still a small farming community.
Common Questions
What is Per Capita Income in Ellsinore?
Per Capita income in Ellsinore is $22,492.
What is the Median Family Income in Ellsinore?
Median Family Income in Ellsinore is $61,250.
What is the Median Household income in Ellsinore?
Median Household Income in Ellsinore is $45,938.
What is Income or Wage Gap in Ellsinore?
Income or Wage Gap in Ellsinore is 27.2%.
Women in Ellsinore earn 72.8 cents for every dollar earned by a man.
What is Inequality or Gini Index in Ellsinore?
Inequality or Gini Index in Ellsinore is 0.35.
What is the Total Population of Ellsinore?
Total Population of Ellsinore is 442.
What is the Total Male Population of Ellsinore?
Total Male Population of Ellsinore is 234.
What is the Total Female Population of Ellsinore?
Total Female Population of Ellsinore is 208.
What is the Ratio of Males per 100 Females in Ellsinore?
There are 112.50 Males per 100 Females in Ellsinore.
What is the Ratio of Females per 100 Males in Ellsinore?
There are 88.89 Females per 100 Males in Ellsinore.
What is the Median Population Age in Ellsinore?
Median Population Age in Ellsinore is 36.6 Years.
What is the Average Family Size in Ellsinore
Average Family Size in Ellsinore is 4.5 People.
What is the Average Household Size in Ellsinore
Average Household Size in Ellsinore is 2.4 People.
How Large is the Labor Force in Ellsinore?
There are 211 People in the Labor Forcein in Ellsinore.
What is the Percentage of People in the Labor Force in Ellsinore?
57.2% of People are in the Labor Force in Ellsinore.
What is the Unemployment Rate in Ellsinore?
Unemployment Rate in Ellsinore is 0.9%.