Billings, MO Map & Demographics
Billings Map
Billings Overview
$22,780
PER CAPITA INCOME
$50,592
AVG FAMILY INCOME
$41,989
AVG HOUSEHOLD INCOME
30.4%
WAGE / INCOME GAP [ % ]
69.6¢/ $1
WAGE / INCOME GAP [ $ ]
$17,408
FAMILY INCOME DEFICIT
0.41
INEQUALITY / GINI INDEX
854
TOTAL POPULATION
396
MALE POPULATION
458
FEMALE POPULATION
86.46
MALES / 100 FEMALES
115.66
FEMALES / 100 MALES
49.6
MEDIAN AGE
2.5
AVG FAMILY SIZE
2.0
AVG HOUSEHOLD SIZE
353
LABOR FORCE [ PEOPLE ]
50.9%
PERCENT IN LABOR FORCE
3.1%
UNEMPLOYMENT RATE
Billings Zip Codes
Billings Area Codes
Income in Billings
Income Overview in Billings
Per Capita Income in Billings is $22,780, while median incomes of families and households are $50,592 and $41,989 respectively.
| Characteristic | Number | Measure |
| Per Capita Income | 854 | $22,780 |
| Median Family Income | 267 | $50,592 |
| Mean Family Income | 267 | $52,203 |
| Median Household Income | 421 | $41,989 |
| Mean Household Income | 421 | $46,534 |
| Income Deficit | 267 | $17,408 |
| Wage / Income Gap (%) | 854 | 30.39% |
| Wage / Income Gap ($) | 854 | 69.61¢ per $1 |
| Gini / Inequality Index | 854 | 0.41 |
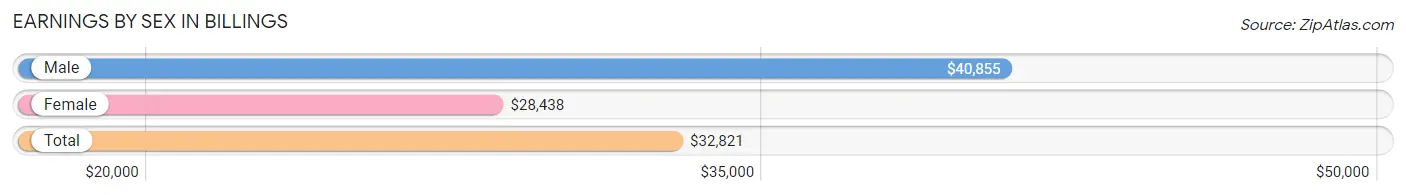
Earnings by Sex in Billings
Average Earnings in Billings are $32,821, $40,855 for men and $28,438 for women, a difference of 30.4%.
| Sex | Number | Average Earnings |
| Male | 162 (45.4%) | $40,855 |
| Female | 195 (54.6%) | $28,438 |
| Total | 357 (100.0%) | $32,821 |
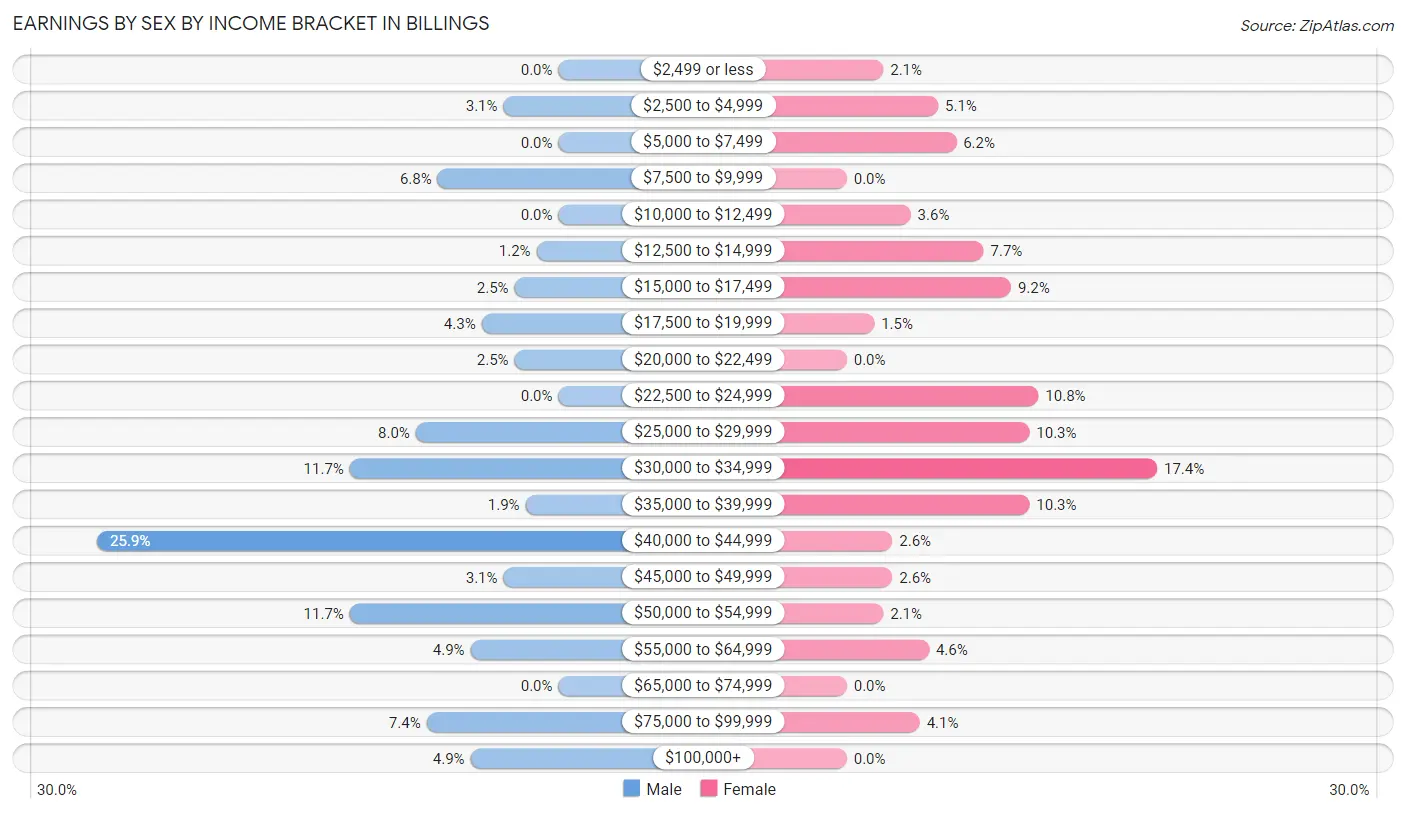
Earnings by Sex by Income Bracket in Billings
The most common earnings brackets in Billings are $40,000 to $44,999 for men (42 | 25.9%) and $30,000 to $34,999 for women (34 | 17.4%).
| Income | Male | Female |
| $2,499 or less | 0 (0.0%) | 4 (2.1%) |
| $2,500 to $4,999 | 5 (3.1%) | 10 (5.1%) |
| $5,000 to $7,499 | 0 (0.0%) | 12 (6.1%) |
| $7,500 to $9,999 | 11 (6.8%) | 0 (0.0%) |
| $10,000 to $12,499 | 0 (0.0%) | 7 (3.6%) |
| $12,500 to $14,999 | 2 (1.2%) | 15 (7.7%) |
| $15,000 to $17,499 | 4 (2.5%) | 18 (9.2%) |
| $17,500 to $19,999 | 7 (4.3%) | 3 (1.5%) |
| $20,000 to $22,499 | 4 (2.5%) | 0 (0.0%) |
| $22,500 to $24,999 | 0 (0.0%) | 21 (10.8%) |
| $25,000 to $29,999 | 13 (8.0%) | 20 (10.3%) |
| $30,000 to $34,999 | 19 (11.7%) | 34 (17.4%) |
| $35,000 to $39,999 | 3 (1.8%) | 20 (10.3%) |
| $40,000 to $44,999 | 42 (25.9%) | 5 (2.6%) |
| $45,000 to $49,999 | 5 (3.1%) | 5 (2.6%) |
| $50,000 to $54,999 | 19 (11.7%) | 4 (2.1%) |
| $55,000 to $64,999 | 8 (4.9%) | 9 (4.6%) |
| $65,000 to $74,999 | 0 (0.0%) | 0 (0.0%) |
| $75,000 to $99,999 | 12 (7.4%) | 8 (4.1%) |
| $100,000+ | 8 (4.9%) | 0 (0.0%) |
| Total | 162 (100.0%) | 195 (100.0%) |
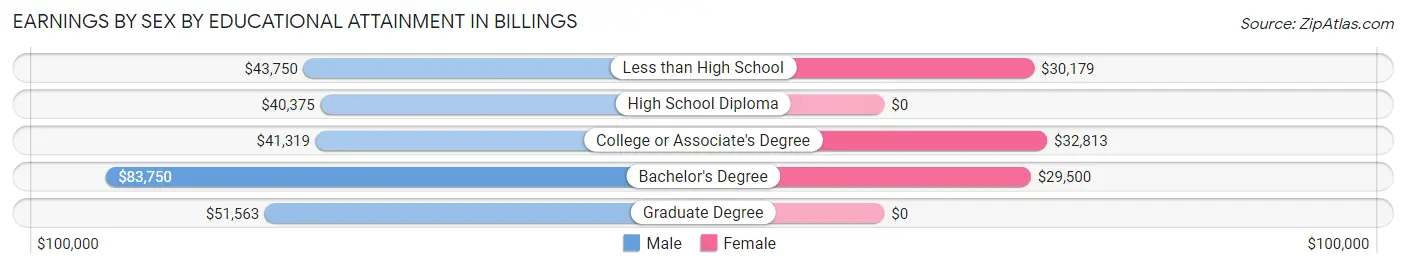
Earnings by Sex by Educational Attainment in Billings
Average earnings in Billings are $41,612 for men and $28,438 for women, a difference of 31.7%. Men with an educational attainment of bachelor's degree enjoy the highest average annual earnings of $83,750, while those with high school diploma education earn the least with $40,375. Women with an educational attainment of college or associate's degree earn the most with the average annual earnings of $32,813, while those with bachelor's degree education have the smallest earnings of $29,500.
| Educational Attainment | Male Income | Female Income |
| Less than High School | $43,750 | $30,179 |
| High School Diploma | $40,375 | $0 |
| College or Associate's Degree | $41,319 | $32,813 |
| Bachelor's Degree | $83,750 | $29,500 |
| Graduate Degree | $51,563 | $0 |
| Total | $41,612 | $28,438 |
Family Income in Billings
Family Income Brackets in Billings
According to the Billings family income data, there are 89 families falling into the $50,000 to $74,999 income range, which is the most common income bracket and makes up 33.3% of all families.
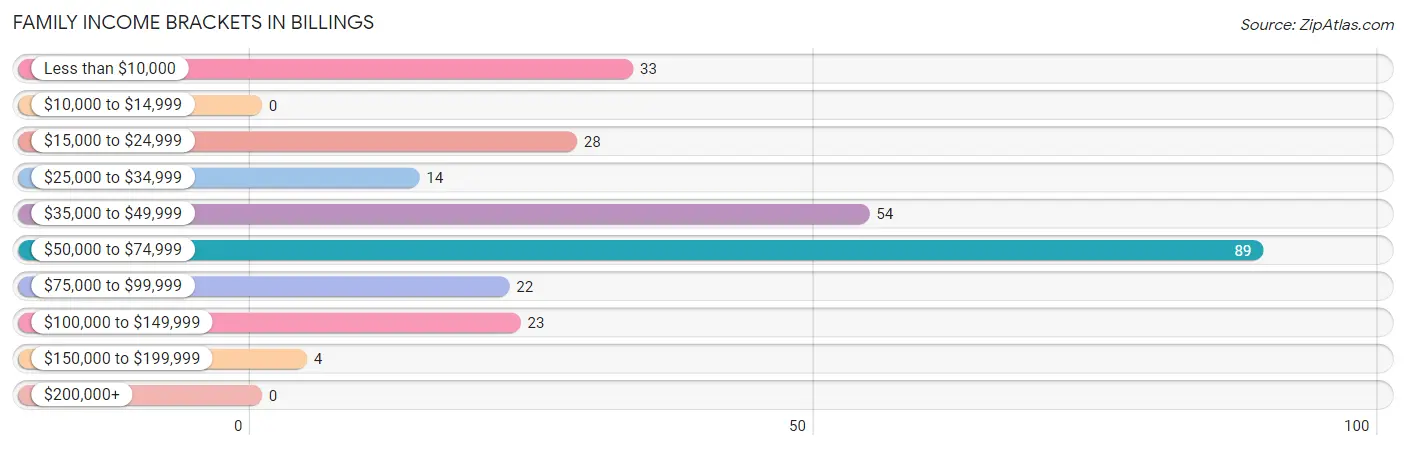
| Income Bracket | # Families | % Families |
| Less than $10,000 | 33 | 12.4% |
| $10,000 to $14,999 | 0 | 0.0% |
| $15,000 to $24,999 | 28 | 10.5% |
| $25,000 to $34,999 | 14 | 5.2% |
| $35,000 to $49,999 | 54 | 20.2% |
| $50,000 to $74,999 | 89 | 33.3% |
| $75,000 to $99,999 | 22 | 8.2% |
| $100,000 to $149,999 | 23 | 8.6% |
| $150,000 to $199,999 | 4 | 1.5% |
| $200,000+ | 0 | 0.0% |
Family Income by Famaliy Size in Billings
2-person families (170 | 63.7%) account for the highest median family income in Billings with $52,188 per family, while 2-person families (170 | 63.7%) have the highest median income of $26,094 per family member.
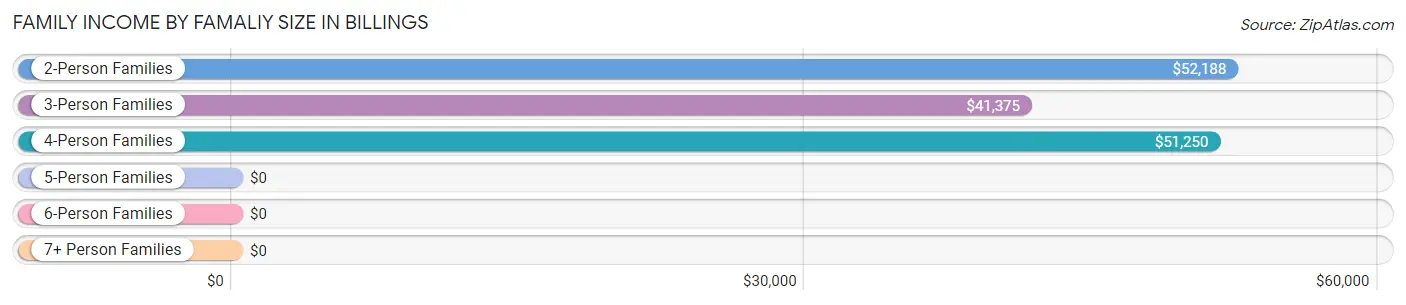
| Income Bracket | # Families | Median Income |
| 2-Person Families | 170 (63.7%) | $52,188 |
| 3-Person Families | 61 (22.9%) | $41,375 |
| 4-Person Families | 32 (12.0%) | $51,250 |
| 5-Person Families | 4 (1.5%) | $0 |
| 6-Person Families | 0 (0.0%) | $0 |
| 7+ Person Families | 0 (0.0%) | $0 |
| Total | 267 (100.0%) | $50,592 |
Family Income by Number of Earners in Billings
The median family income in Billings is $50,592, with families comprising 3+ earners (8) having the highest median family income of $96,500, while families with no earners (94) have the lowest median family income of $24,479, accounting for 3.0% and 35.2% of families, respectively.
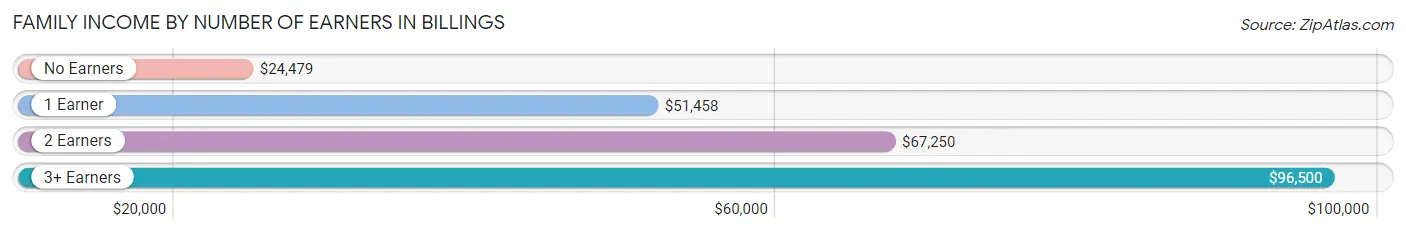
| Number of Earners | # Families | Median Income |
| No Earners | 94 (35.2%) | $24,479 |
| 1 Earner | 92 (34.5%) | $51,458 |
| 2 Earners | 73 (27.3%) | $67,250 |
| 3+ Earners | 8 (3.0%) | $96,500 |
| Total | 267 (100.0%) | $50,592 |
Household Income in Billings
Household Income Brackets in Billings
With 110 households falling in the category, the $50,000 to $74,999 income range is the most frequent in Billings, accounting for 26.1% of all households.
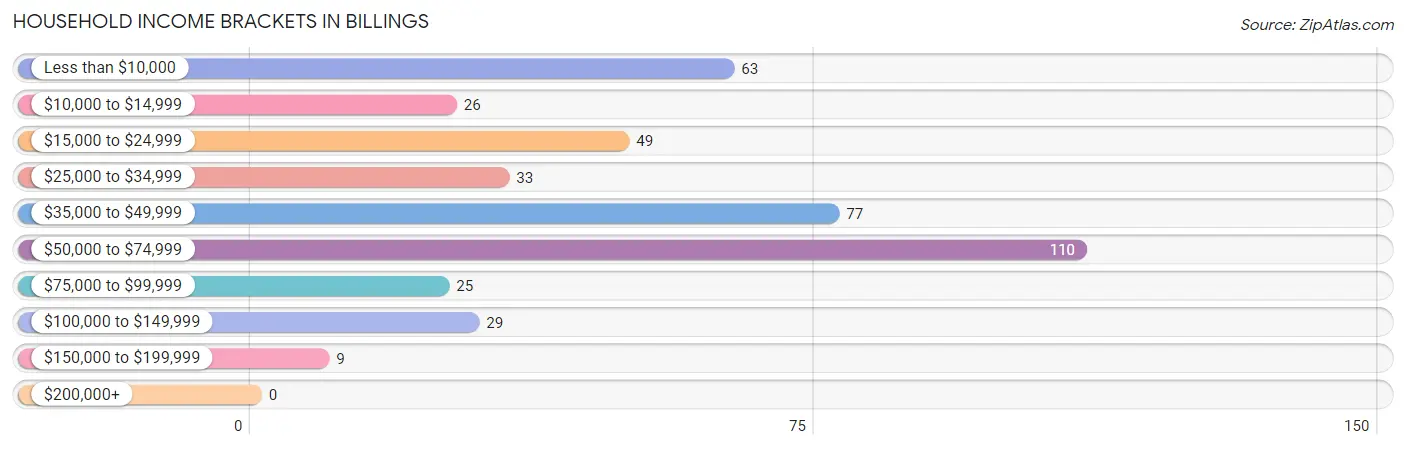
| Income Bracket | # Households | % Households |
| Less than $10,000 | 63 | 15.0% |
| $10,000 to $14,999 | 26 | 6.2% |
| $15,000 to $24,999 | 49 | 11.6% |
| $25,000 to $34,999 | 33 | 7.8% |
| $35,000 to $49,999 | 77 | 18.3% |
| $50,000 to $74,999 | 110 | 26.1% |
| $75,000 to $99,999 | 25 | 5.9% |
| $100,000 to $149,999 | 29 | 6.9% |
| $150,000 to $199,999 | 9 | 2.1% |
| $200,000+ | 0 | 0.0% |
Household Income by Householder Age in Billings
The median household income in Billings is $41,989, with the highest median household income of $46,364 found in the 25 to 44 years age bracket for the primary householder. A total of 88 households (20.9%) fall into this category. Meanwhile, the 15 to 24 years age bracket for the primary householder has the lowest median household income of $0, with 32 households (7.6%) in this group.
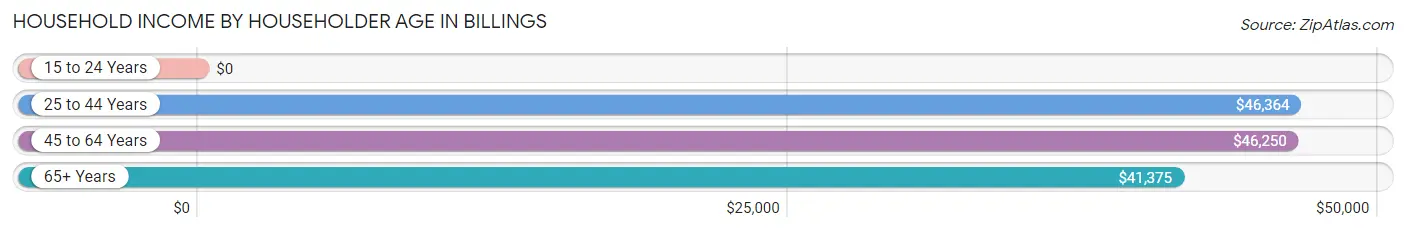
| Income Bracket | # Households | Median Income |
| 15 to 24 Years | 32 (7.6%) | $0 |
| 25 to 44 Years | 88 (20.9%) | $46,364 |
| 45 to 64 Years | 150 (35.6%) | $46,250 |
| 65+ Years | 151 (35.9%) | $41,375 |
| Total | 421 (100.0%) | $41,989 |
Poverty in Billings
Income Below Poverty by Sex and Age in Billings
With 18.2% poverty level for males and 18.8% for females among the residents of Billings, 12 to 14 year old males and 18 to 24 year old females are the most vulnerable to poverty, with 4 males (50.0%) and 25 females (71.4%) in their respective age groups living below the poverty level.
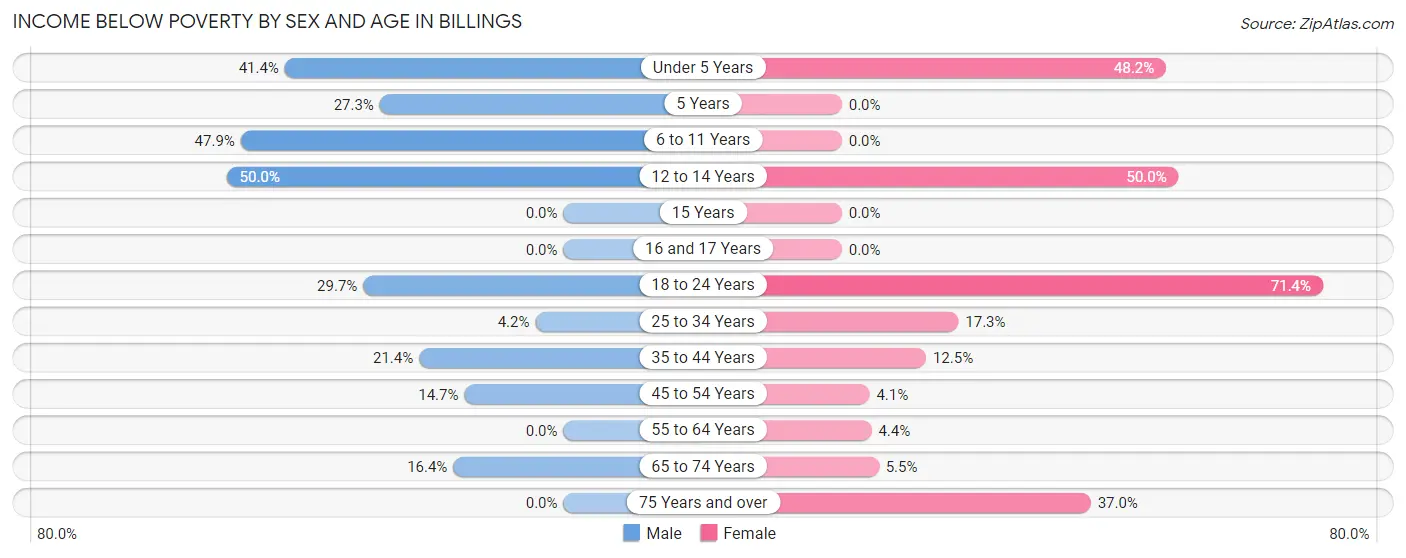
| Age Bracket | Male | Female |
| Under 5 Years | 12 (41.4%) | 13 (48.1%) |
| 5 Years | 3 (27.3%) | 0 (0.0%) |
| 6 to 11 Years | 23 (47.9%) | 0 (0.0%) |
| 12 to 14 Years | 4 (50.0%) | 8 (50.0%) |
| 15 Years | 0 (0.0%) | 0 (0.0%) |
| 16 and 17 Years | 0 (0.0%) | 0 (0.0%) |
| 18 to 24 Years | 11 (29.7%) | 25 (71.4%) |
| 25 to 34 Years | 2 (4.2%) | 9 (17.3%) |
| 35 to 44 Years | 3 (21.4%) | 3 (12.5%) |
| 45 to 54 Years | 5 (14.7%) | 3 (4.1%) |
| 55 to 64 Years | 0 (0.0%) | 4 (4.4%) |
| 65 to 74 Years | 9 (16.4%) | 4 (5.5%) |
| 75 Years and over | 0 (0.0%) | 17 (37.0%) |
| Total | 72 (18.2%) | 86 (18.8%) |
Income Above Poverty by Sex and Age in Billings
According to the poverty statistics in Billings, males aged 16 and 17 years and females aged 5 years are the age groups that are most secure financially, with 100.0% of males and 100.0% of females in these age groups living above the poverty line.
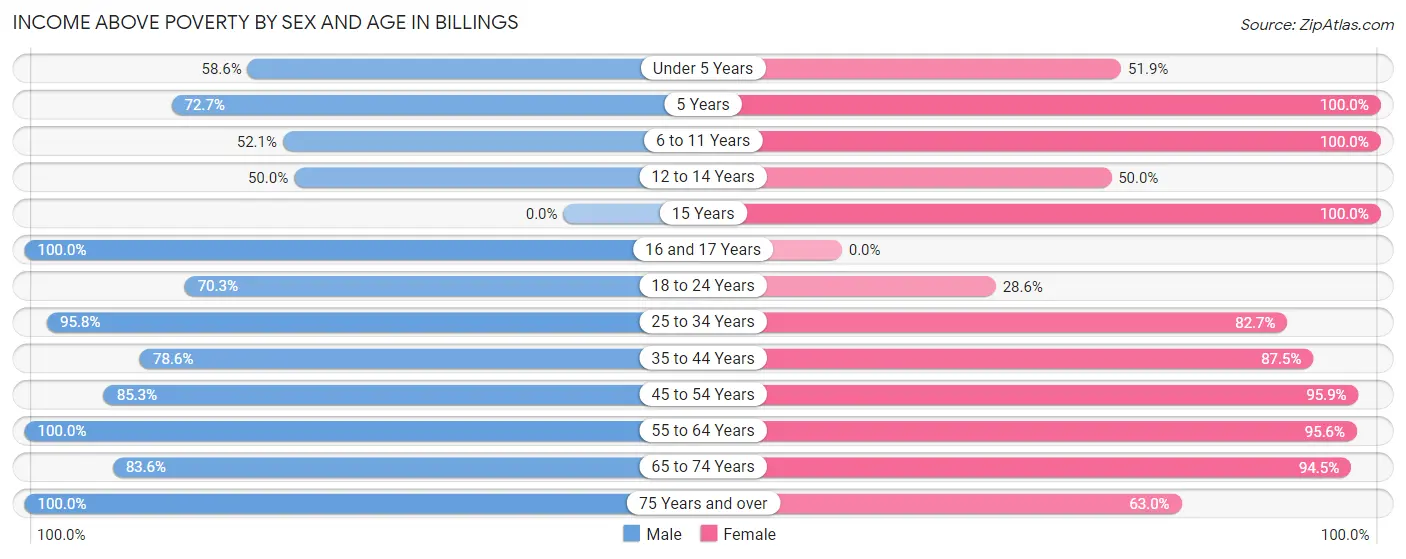
| Age Bracket | Male | Female |
| Under 5 Years | 17 (58.6%) | 14 (51.8%) |
| 5 Years | 8 (72.7%) | 5 (100.0%) |
| 6 to 11 Years | 25 (52.1%) | 15 (100.0%) |
| 12 to 14 Years | 4 (50.0%) | 8 (50.0%) |
| 15 Years | 0 (0.0%) | 1 (100.0%) |
| 16 and 17 Years | 10 (100.0%) | 0 (0.0%) |
| 18 to 24 Years | 26 (70.3%) | 10 (28.6%) |
| 25 to 34 Years | 46 (95.8%) | 43 (82.7%) |
| 35 to 44 Years | 11 (78.6%) | 21 (87.5%) |
| 45 to 54 Years | 29 (85.3%) | 70 (95.9%) |
| 55 to 64 Years | 66 (100.0%) | 87 (95.6%) |
| 65 to 74 Years | 46 (83.6%) | 69 (94.5%) |
| 75 Years and over | 36 (100.0%) | 29 (63.0%) |
| Total | 324 (81.8%) | 372 (81.2%) |
Income Below Poverty Among Married-Couple Families in Billings
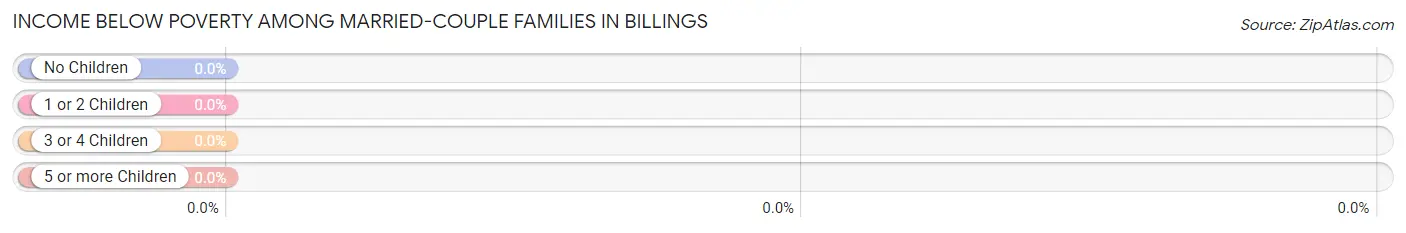
| Children | Above Poverty | Below Poverty |
| No Children | 149 (100.0%) | 0 (0.0%) |
| 1 or 2 Children | 37 (100.0%) | 0 (0.0%) |
| 3 or 4 Children | 4 (100.0%) | 0 (0.0%) |
| 5 or more Children | 0 (0.0%) | 0 (0.0%) |
| Total | 190 (100.0%) | 0 (0.0%) |
Income Below Poverty Among Single-Parent Households in Billings
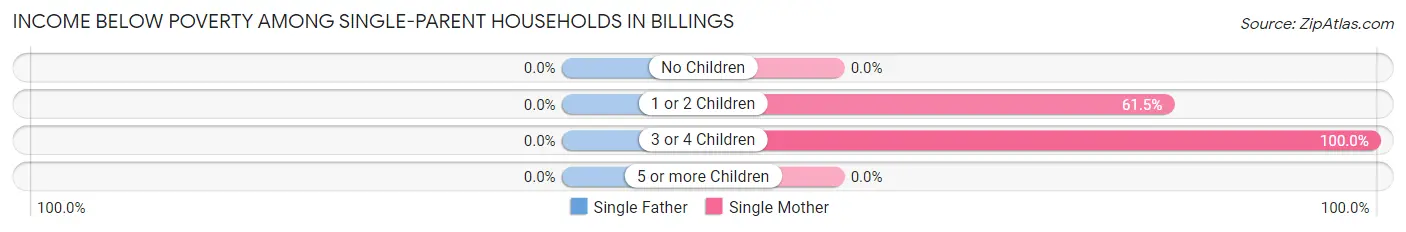
| Children | Single Father | Single Mother |
| No Children | 0 (0.0%) | 0 (0.0%) |
| 1 or 2 Children | 0 (0.0%) | 32 (61.5%) |
| 3 or 4 Children | 0 (0.0%) | 5 (100.0%) |
| 5 or more Children | 0 (0.0%) | 0 (0.0%) |
| Total | 0 (0.0%) | 37 (61.7%) |
Income Below Poverty Among Married-Couple vs Single-Parent Households in Billings
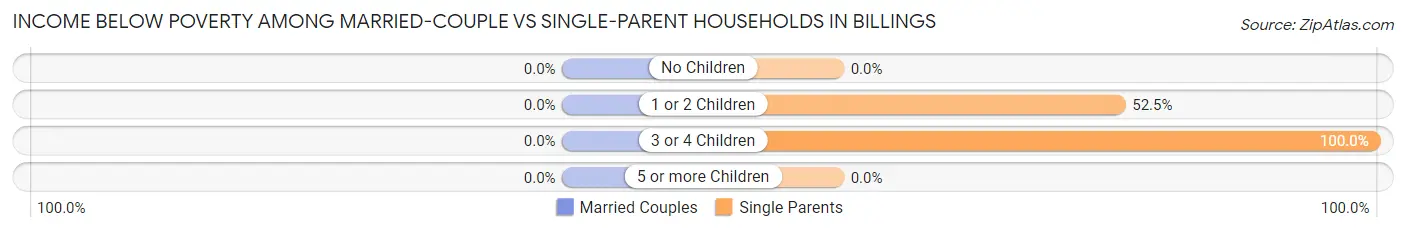
| Children | Married-Couple Families | Single-Parent Households |
| No Children | 0 (0.0%) | 0 (0.0%) |
| 1 or 2 Children | 0 (0.0%) | 32 (52.5%) |
| 3 or 4 Children | 0 (0.0%) | 5 (100.0%) |
| 5 or more Children | 0 (0.0%) | 0 (0.0%) |
| Total | 0 (0.0%) | 37 (48.0%) |
Race in Billings
The most populous races in Billings are White / Caucasian (737 | 86.3%), Two or more Races (106 | 12.4%), and Hispanic or Latino (55 | 6.4%).
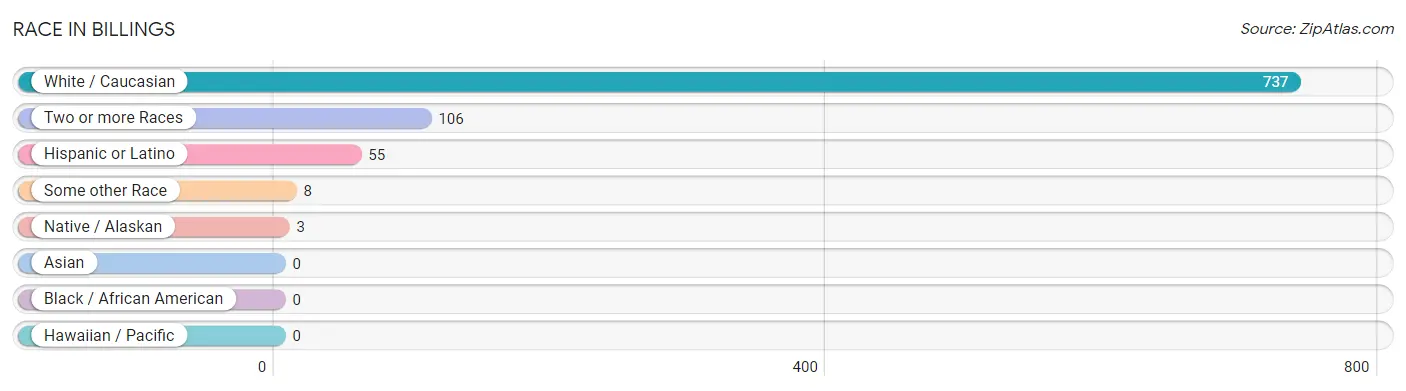
| Race | # Population | % Population |
| Asian | 0 | 0.0% |
| Black / African American | 0 | 0.0% |
| Hawaiian / Pacific | 0 | 0.0% |
| Hispanic or Latino | 55 | 6.4% |
| Native / Alaskan | 3 | 0.4% |
| White / Caucasian | 737 | 86.3% |
| Two or more Races | 106 | 12.4% |
| Some other Race | 8 | 0.9% |
| Total | 854 | 100.0% |
Ancestry in Billings
The most populous ancestries reported in Billings are German (242 | 28.3%), English (114 | 13.4%), Irish (108 | 12.7%), Scottish (51 | 6.0%), and American (50 | 5.9%), together accounting for 66.2% of all Billings residents.
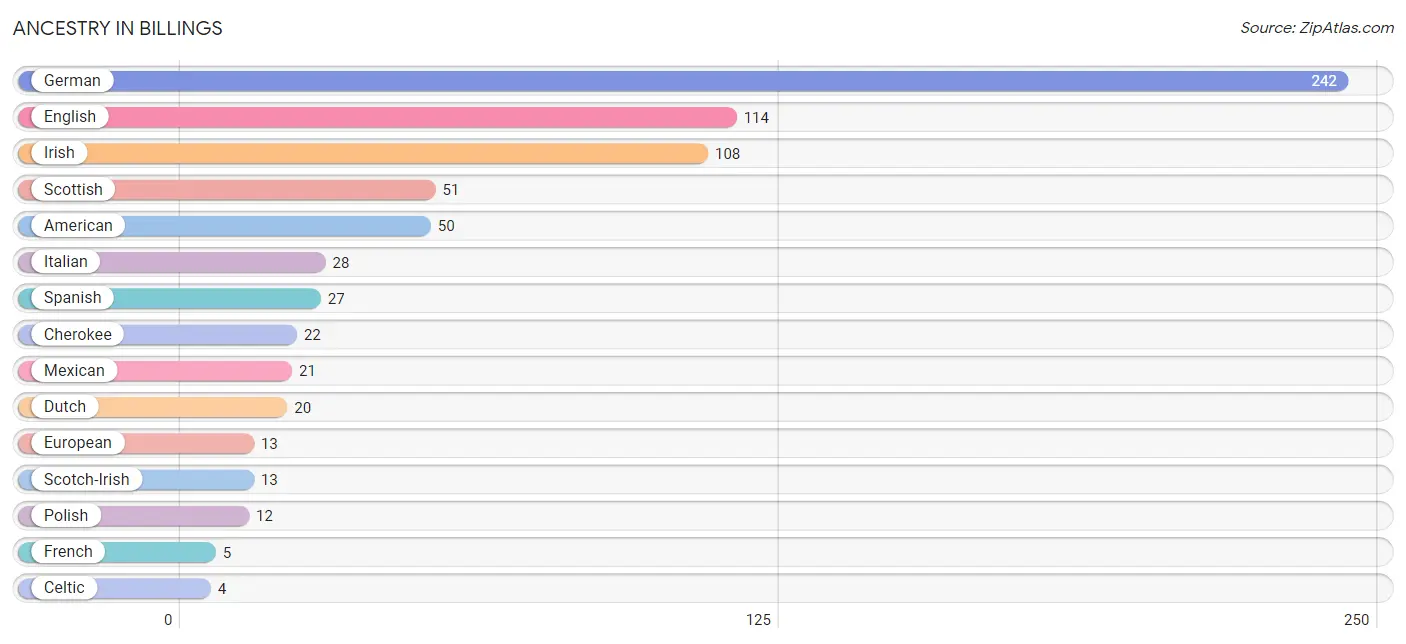
| Ancestry | # Population | % Population |
| American | 50 | 5.9% |
| Austrian | 3 | 0.4% |
| Brazilian | 3 | 0.4% |
| Celtic | 4 | 0.5% |
| Cherokee | 22 | 2.6% |
| Czech | 3 | 0.4% |
| Dutch | 20 | 2.3% |
| Eastern European | 2 | 0.2% |
| English | 114 | 13.4% |
| European | 13 | 1.5% |
| Finnish | 3 | 0.4% |
| French | 5 | 0.6% |
| German | 242 | 28.3% |
| Irish | 108 | 12.7% |
| Italian | 28 | 3.3% |
| Mexican | 21 | 2.5% |
| Mexican American Indian | 2 | 0.2% |
| Northern European | 3 | 0.4% |
| Norwegian | 3 | 0.4% |
| Polish | 12 | 1.4% |
| Puerto Rican | 4 | 0.5% |
| Scotch-Irish | 13 | 1.5% |
| Scottish | 51 | 6.0% |
| Sioux | 3 | 0.4% |
| Spanish | 27 | 3.2% | View All 25 Rows |
Immigrants in Billings
The most numerous immigrant groups reported in Billings came from Brazil (3 | 0.4%), Latin America (3 | 0.4%), and South America (3 | 0.4%), together accounting for 1.1% of all Billings residents.
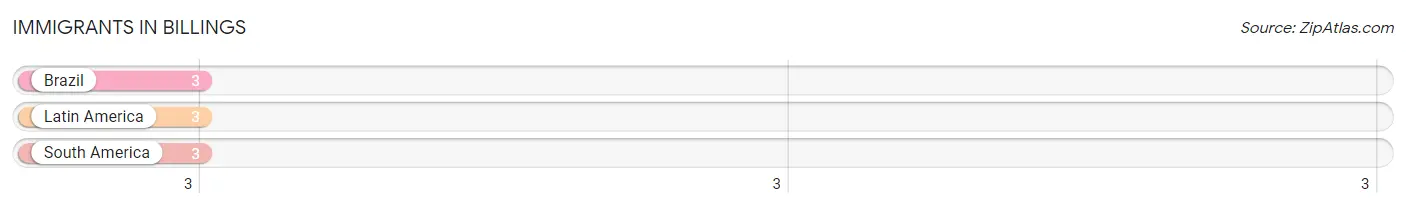
| Immigration Origin | # Population | % Population |
| Brazil | 3 | 0.4% |
| Latin America | 3 | 0.4% |
| South America | 3 | 0.4% | View All 3 Rows |
Sex and Age in Billings
Sex and Age in Billings
The most populous age groups in Billings are 5 to 9 Years (59 | 14.9%) for men and 60 to 64 Years (48 | 10.5%) for women.
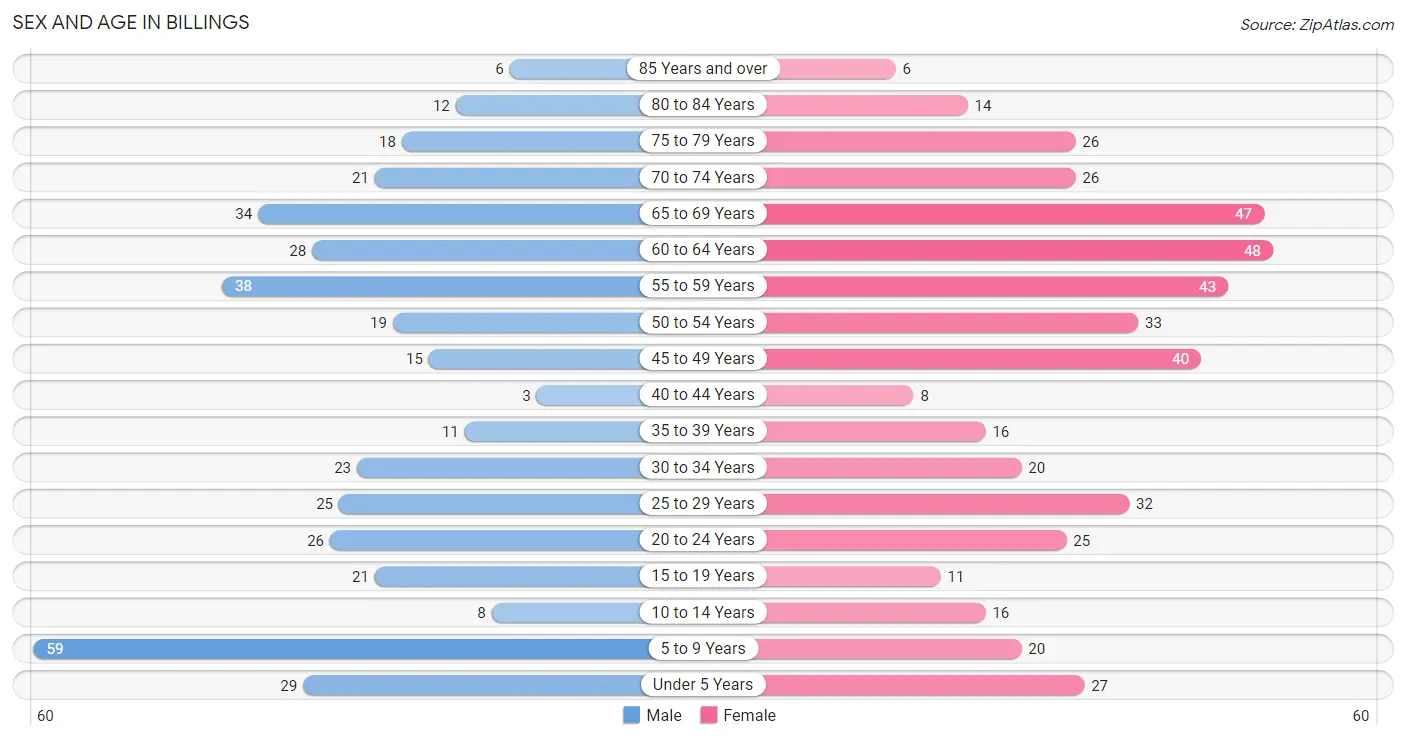
| Age Bracket | Male | Female |
| Under 5 Years | 29 (7.3%) | 27 (5.9%) |
| 5 to 9 Years | 59 (14.9%) | 20 (4.4%) |
| 10 to 14 Years | 8 (2.0%) | 16 (3.5%) |
| 15 to 19 Years | 21 (5.3%) | 11 (2.4%) |
| 20 to 24 Years | 26 (6.6%) | 25 (5.5%) |
| 25 to 29 Years | 25 (6.3%) | 32 (7.0%) |
| 30 to 34 Years | 23 (5.8%) | 20 (4.4%) |
| 35 to 39 Years | 11 (2.8%) | 16 (3.5%) |
| 40 to 44 Years | 3 (0.8%) | 8 (1.8%) |
| 45 to 49 Years | 15 (3.8%) | 40 (8.7%) |
| 50 to 54 Years | 19 (4.8%) | 33 (7.2%) |
| 55 to 59 Years | 38 (9.6%) | 43 (9.4%) |
| 60 to 64 Years | 28 (7.1%) | 48 (10.5%) |
| 65 to 69 Years | 34 (8.6%) | 47 (10.3%) |
| 70 to 74 Years | 21 (5.3%) | 26 (5.7%) |
| 75 to 79 Years | 18 (4.5%) | 26 (5.7%) |
| 80 to 84 Years | 12 (3.0%) | 14 (3.1%) |
| 85 Years and over | 6 (1.5%) | 6 (1.3%) |
| Total | 396 (100.0%) | 458 (100.0%) |
Families and Households in Billings
Median Family Size in Billings
The median family size in Billings is 2.50 persons per family, with single female/mother families (60 | 22.5%) accounting for the largest median family size of 2.77 persons per family. On the other hand, married-couple families (190 | 71.2%) represent the smallest median family size with 2.39 persons per family.
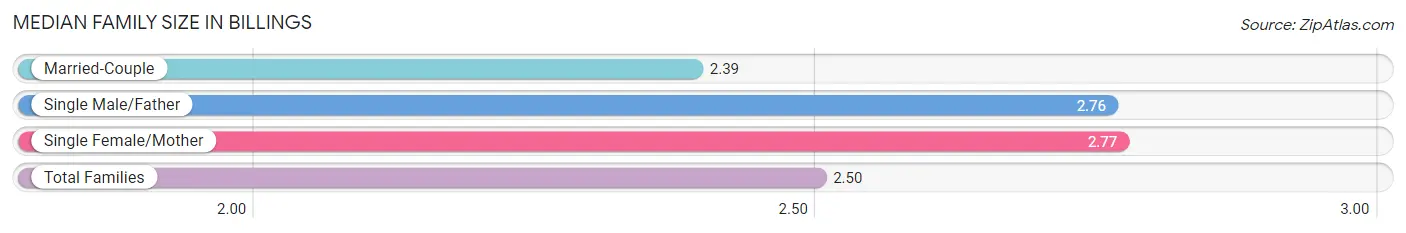
| Family Type | # Families | Family Size |
| Married-Couple | 190 (71.2%) | 2.39 |
| Single Male/Father | 17 (6.4%) | 2.76 |
| Single Female/Mother | 60 (22.5%) | 2.77 |
| Total Families | 267 (100.0%) | 2.50 |
Median Household Size in Billings
The median household size in Billings is 2.03 persons per household, with single female/mother households (60 | 14.2%) accounting for the largest median household size of 3.02 persons per household. non-family households (154 | 36.6%) represent the smallest median household size with 1.12 persons per household.
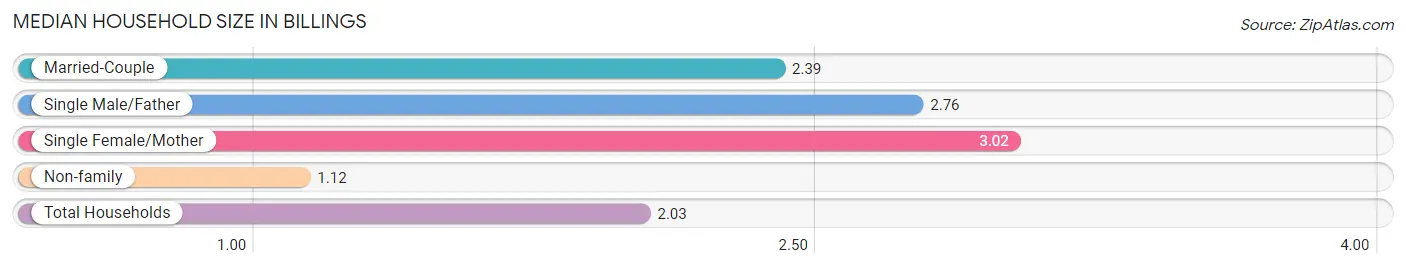
| Household Type | # Households | Household Size |
| Married-Couple | 190 (45.1%) | 2.39 |
| Single Male/Father | 17 (4.0%) | 2.76 |
| Single Female/Mother | 60 (14.2%) | 3.02 |
| Non-family | 154 (36.6%) | 1.12 |
| Total Households | 421 (100.0%) | 2.03 |
Household Size by Marriage Status in Billings
Out of a total of 421 households in Billings, 267 (63.4%) are family households, while 154 (36.6%) are nonfamily households. The most numerous type of family households are 2-person households, comprising 170, and the most common type of nonfamily households are 1-person households, comprising 136.
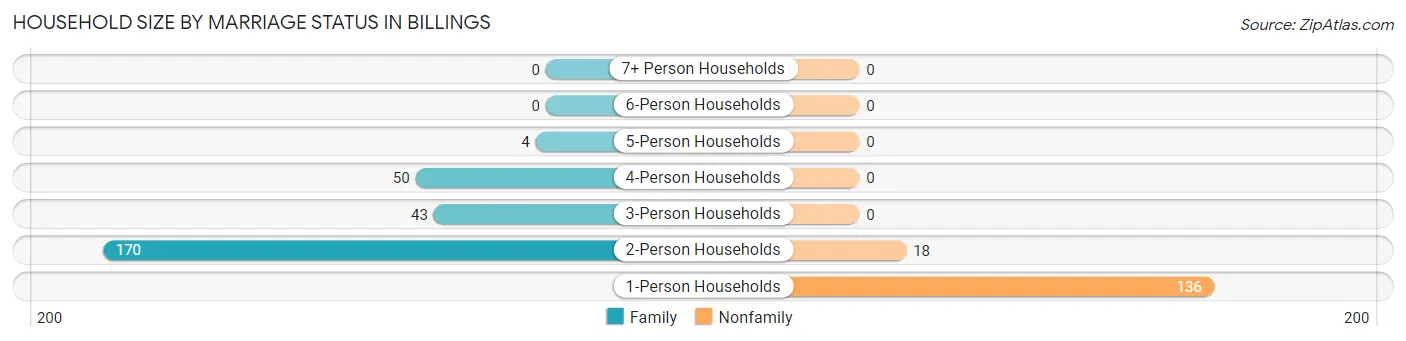
| Household Size | Family Households | Nonfamily Households |
| 1-Person Households | - | 136 (32.3%) |
| 2-Person Households | 170 (40.4%) | 18 (4.3%) |
| 3-Person Households | 43 (10.2%) | 0 (0.0%) |
| 4-Person Households | 50 (11.9%) | 0 (0.0%) |
| 5-Person Households | 4 (0.9%) | 0 (0.0%) |
| 6-Person Households | 0 (0.0%) | 0 (0.0%) |
| 7+ Person Households | 0 (0.0%) | 0 (0.0%) |
| Total | 267 (63.4%) | 154 (36.6%) |
Female Fertility in Billings
Fertility by Age in Billings
Average fertility rate in Billings is 91.0 births per 1,000 women. Women in the age bracket of 20 to 34 years have the highest fertility rate with 182.0 births per 1,000 women. Women in the age bracket of 20 to 34 years acount for 100.0% of all women with births.
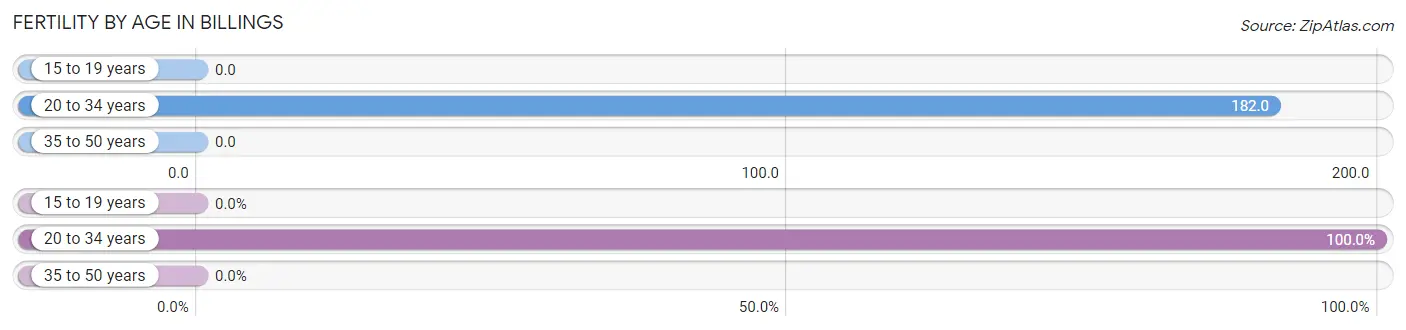
| Age Bracket | Women with Births | Births / 1,000 Women |
| 15 to 19 years | 0 (0.0%) | 0.0 |
| 20 to 34 years | 14 (100.0%) | 182.0 |
| 35 to 50 years | 0 (0.0%) | 0.0 |
| Total | 14 (100.0%) | 91.0 |
Fertility by Age by Marriage Status in Billings
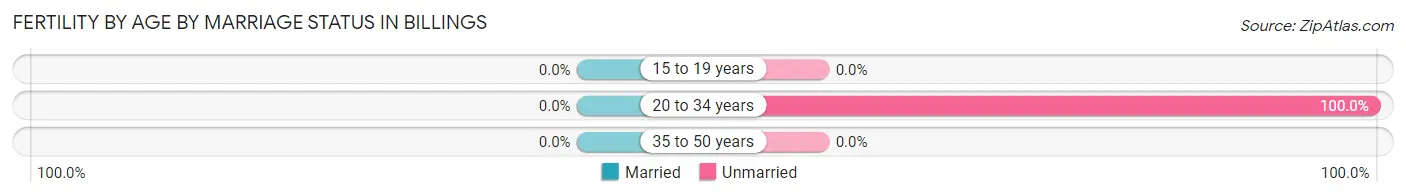
| Age Bracket | Married | Unmarried |
| 15 to 19 years | 0 (0.0%) | 0 (0.0%) |
| 20 to 34 years | 0 (0.0%) | 14 (100.0%) |
| 35 to 50 years | 0 (0.0%) | 0 (0.0%) |
| Total | 0 (0.0%) | 14 (100.0%) |
Fertility by Education in Billings
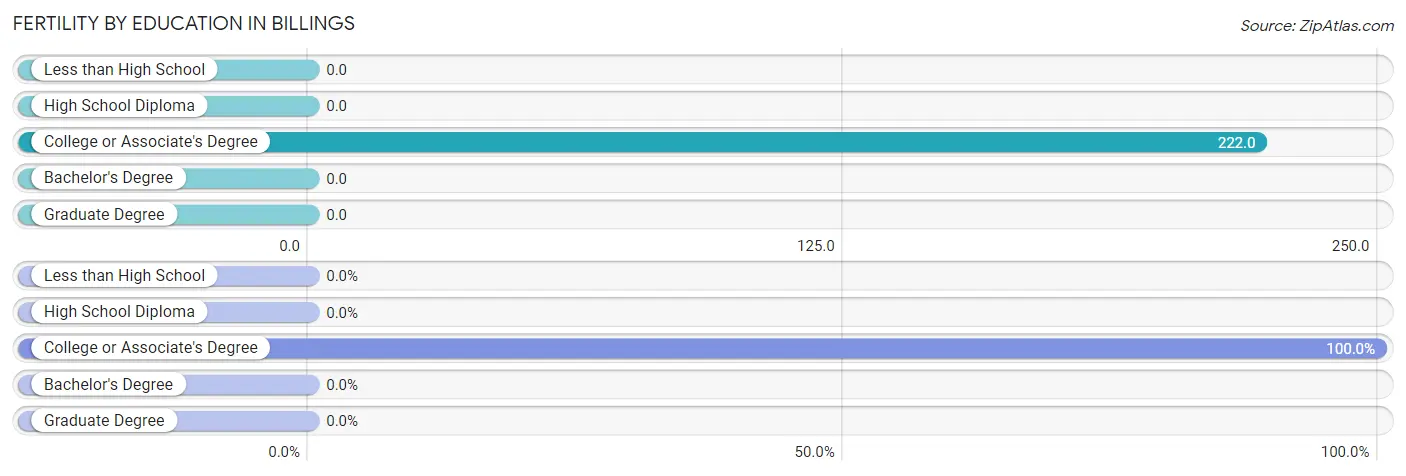
| Educational Attainment | Women with Births | Births / 1,000 Women |
| Less than High School | 0 (0.0%) | 0.0 |
| High School Diploma | 0 (0.0%) | 0.0 |
| College or Associate's Degree | 14 (100.0%) | 222.0 |
| Bachelor's Degree | 0 (0.0%) | 0.0 |
| Graduate Degree | 0 (0.0%) | 0.0 |
| Total | 14 (100.0%) | 91.0 |
Fertility by Education by Marriage Status in Billings
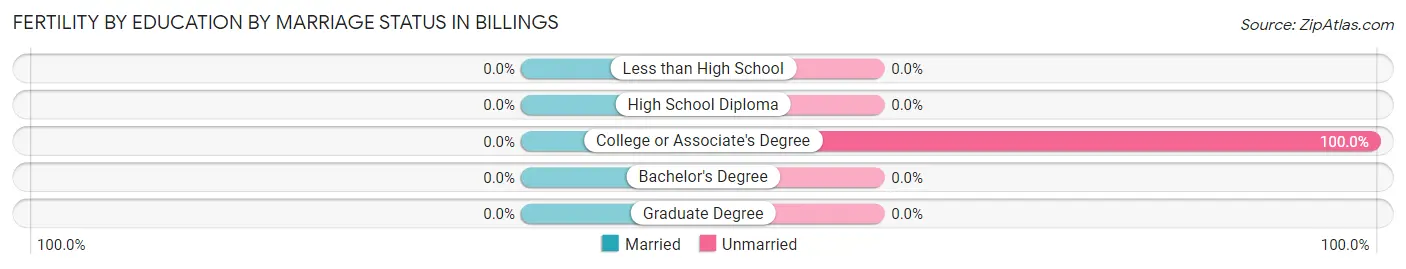
| Educational Attainment | Married | Unmarried |
| Less than High School | 0 (0.0%) | 0 (0.0%) |
| High School Diploma | 0 (0.0%) | 0 (0.0%) |
| College or Associate's Degree | 0 (0.0%) | 14 (100.0%) |
| Bachelor's Degree | 0 (0.0%) | 0 (0.0%) |
| Graduate Degree | 0 (0.0%) | 0 (0.0%) |
| Total | 0 (0.0%) | 14 (100.0%) |
Employment Characteristics in Billings
Employment by Class of Employer in Billings
Among the 338 employed individuals in Billings, private company employees (229 | 67.7%), not-for-profit organizations (45 | 13.3%), and local government employees (33 | 9.8%) make up the most common classes of employment.
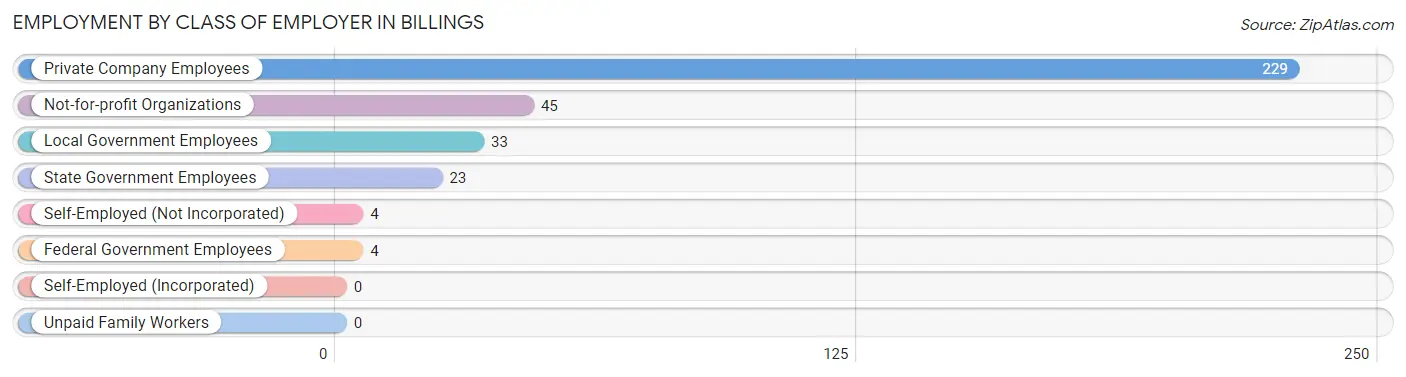
| Employer Class | # Employees | % Employees |
| Private Company Employees | 229 | 67.7% |
| Self-Employed (Incorporated) | 0 | 0.0% |
| Self-Employed (Not Incorporated) | 4 | 1.2% |
| Not-for-profit Organizations | 45 | 13.3% |
| Local Government Employees | 33 | 9.8% |
| State Government Employees | 23 | 6.8% |
| Federal Government Employees | 4 | 1.2% |
| Unpaid Family Workers | 0 | 0.0% |
| Total | 338 | 100.0% |
Employment Status by Age in Billings
According to the labor force statistics for Billings, out of the total population over 16 years of age (694), 50.9% or 353 individuals are in the labor force, with 3.1% or 11 of them unemployed. The age group with the highest labor force participation rate is 30 to 34 years, with 100.0% or 43 individuals in the labor force. Within the labor force, the 16 to 19 years age range has the highest percentage of unemployed individuals, with 20.0% or 3 of them being unemployed.

| Age Bracket | In Labor Force | Unemployed |
| 16 to 19 Years | 15 (48.4%) | 3 (20.0%) |
| 20 to 24 Years | 18 (35.3%) | 0 (0.0%) |
| 25 to 29 Years | 46 (80.7%) | 3 (6.5%) |
| 30 to 34 Years | 43 (100.0%) | 5 (11.6%) |
| 35 to 44 Years | 28 (73.7%) | 0 (0.0%) |
| 45 to 54 Years | 87 (81.3%) | 0 (0.0%) |
| 55 to 59 Years | 62 (76.5%) | 0 (0.0%) |
| 60 to 64 Years | 21 (27.6%) | 0 (0.0%) |
| 65 to 74 Years | 32 (25.0%) | 0 (0.0%) |
| 75 Years and over | 1 (1.2%) | 0 (0.0%) |
| Total | 353 (50.9%) | 11 (3.1%) |
Employment Status by Educational Attainment in Billings
According to labor force statistics for Billings, 71.4% of individuals (287) out of the total population between 25 and 64 years of age (402) are in the labor force, with 2.8% or 8 of them being unemployed. The group with the highest labor force participation rate are those with the educational attainment of college / associate degree, with 88.6% or 124 individuals in the labor force. Within the labor force, individuals with high school diploma education have the highest percentage of unemployment, with 8.8% or 8 of them being unemployed.
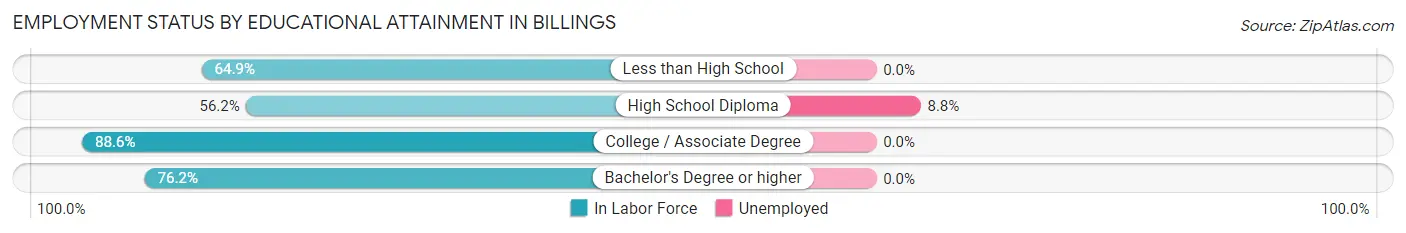
| Educational Attainment | In Labor Force | Unemployed |
| Less than High School | 24 (64.9%) | 0 (0.0%) |
| High School Diploma | 91 (56.2%) | 14 (8.8%) |
| College / Associate Degree | 124 (88.6%) | 0 (0.0%) |
| Bachelor's Degree or higher | 48 (76.2%) | 0 (0.0%) |
| Total | 287 (71.4%) | 11 (2.8%) |
Employment Occupations by Sex in Billings
Management, Business, Science and Arts Occupations
The most common Management, Business, Science and Arts occupations in Billings are Management (25 | 7.3%), Health Diagnosing & Treating (25 | 7.3%), Community & Social Service (15 | 4.4%), Business & Financial (13 | 3.8%), and Education Instruction & Library (12 | 3.5%).
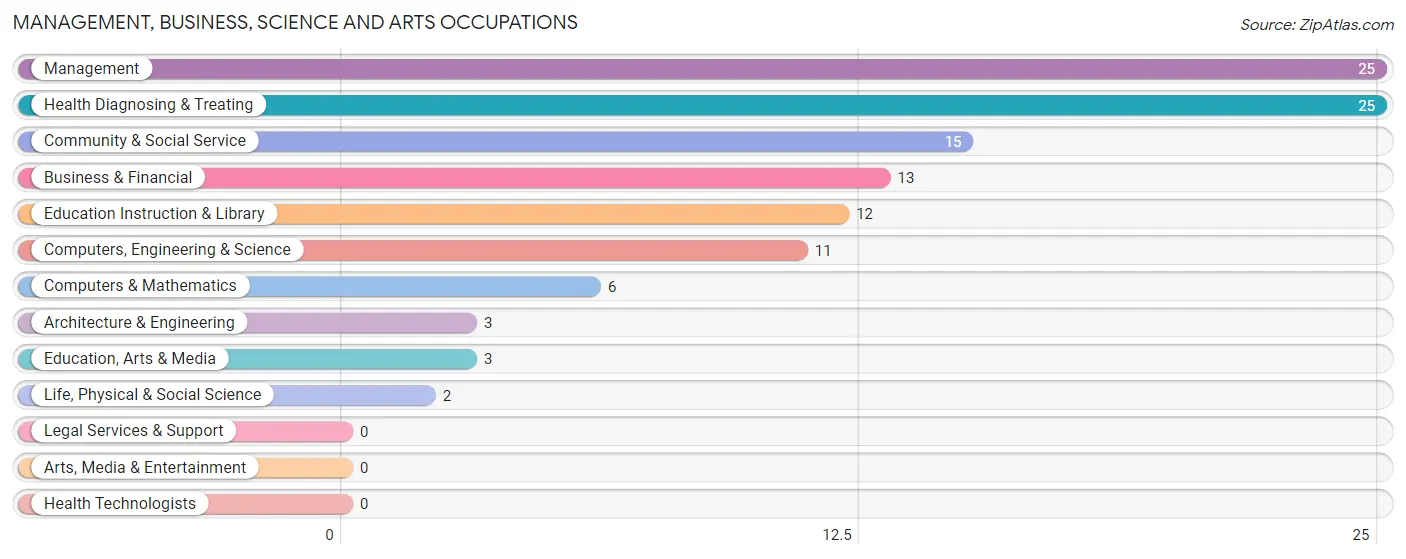
Management, Business, Science and Arts Occupations by Sex
Within the Management, Business, Science and Arts occupations in Billings, the most male-oriented occupations are Architecture & Engineering (100.0%), Education, Arts & Media (100.0%), and Management (72.0%), while the most female-oriented occupations are Life, Physical & Social Science (100.0%), Education Instruction & Library (100.0%), and Health Diagnosing & Treating (92.0%).
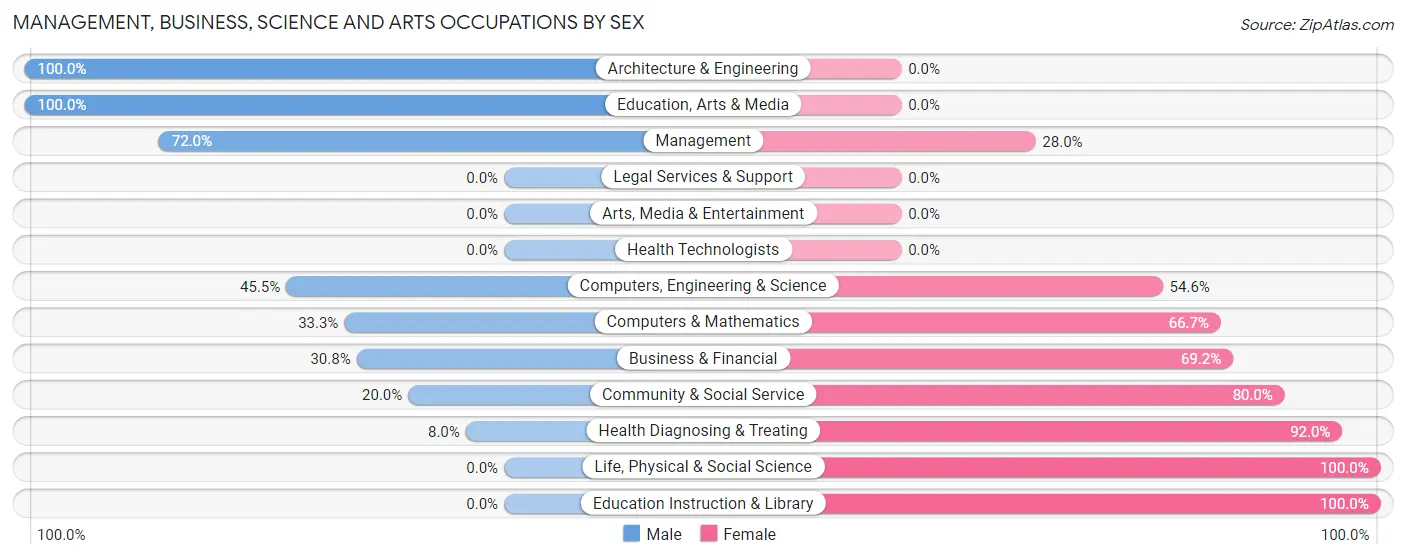
| Occupation | Male | Female |
| Management | 18 (72.0%) | 7 (28.0%) |
| Business & Financial | 4 (30.8%) | 9 (69.2%) |
| Computers, Engineering & Science | 5 (45.5%) | 6 (54.5%) |
| Computers & Mathematics | 2 (33.3%) | 4 (66.7%) |
| Architecture & Engineering | 3 (100.0%) | 0 (0.0%) |
| Life, Physical & Social Science | 0 (0.0%) | 2 (100.0%) |
| Community & Social Service | 3 (20.0%) | 12 (80.0%) |
| Education, Arts & Media | 3 (100.0%) | 0 (0.0%) |
| Legal Services & Support | 0 (0.0%) | 0 (0.0%) |
| Education Instruction & Library | 0 (0.0%) | 12 (100.0%) |
| Arts, Media & Entertainment | 0 (0.0%) | 0 (0.0%) |
| Health Diagnosing & Treating | 2 (8.0%) | 23 (92.0%) |
| Health Technologists | 0 (0.0%) | 0 (0.0%) |
| Total (Category) | 32 (36.0%) | 57 (64.0%) |
| Total (Overall) | 159 (46.5%) | 183 (53.5%) |
Services Occupations
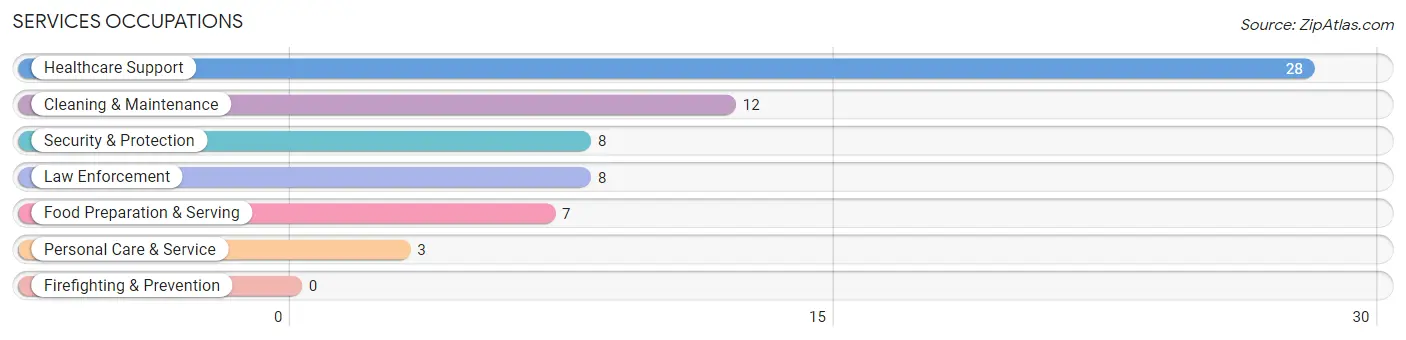
The most common Services occupations in Billings are Healthcare Support (28 | 8.2%), Cleaning & Maintenance (12 | 3.5%), Security & Protection (8 | 2.3%), Law Enforcement (8 | 2.3%), and Food Preparation & Serving (7 | 2.1%).
Services Occupations by Sex
Within the Services occupations in Billings, the most male-oriented occupations are Security & Protection (100.0%), Law Enforcement (100.0%), and Personal Care & Service (100.0%), while the most female-oriented occupations are Healthcare Support (60.7%), Cleaning & Maintenance (50.0%), and Food Preparation & Serving (28.6%).
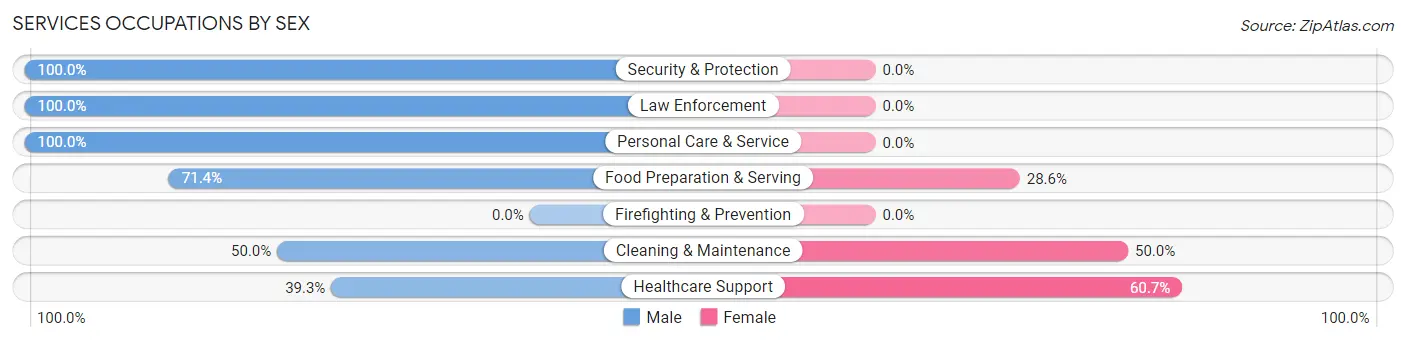
| Occupation | Male | Female |
| Healthcare Support | 11 (39.3%) | 17 (60.7%) |
| Security & Protection | 8 (100.0%) | 0 (0.0%) |
| Firefighting & Prevention | 0 (0.0%) | 0 (0.0%) |
| Law Enforcement | 8 (100.0%) | 0 (0.0%) |
| Food Preparation & Serving | 5 (71.4%) | 2 (28.6%) |
| Cleaning & Maintenance | 6 (50.0%) | 6 (50.0%) |
| Personal Care & Service | 3 (100.0%) | 0 (0.0%) |
| Total (Category) | 33 (56.9%) | 25 (43.1%) |
| Total (Overall) | 159 (46.5%) | 183 (53.5%) |
Sales and Office Occupations
The most common Sales and Office occupations in Billings are Office & Administration (64 | 18.7%), and Sales & Related (30 | 8.8%).
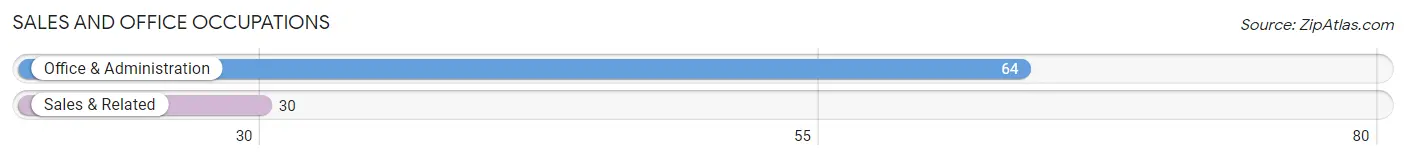
Sales and Office Occupations by Sex
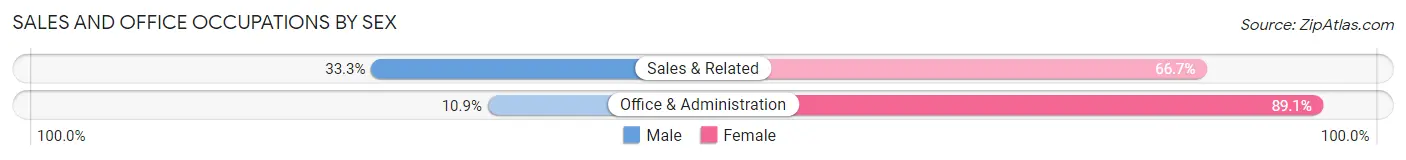
| Occupation | Male | Female |
| Sales & Related | 10 (33.3%) | 20 (66.7%) |
| Office & Administration | 7 (10.9%) | 57 (89.1%) |
| Total (Category) | 17 (18.1%) | 77 (81.9%) |
| Total (Overall) | 159 (46.5%) | 183 (53.5%) |
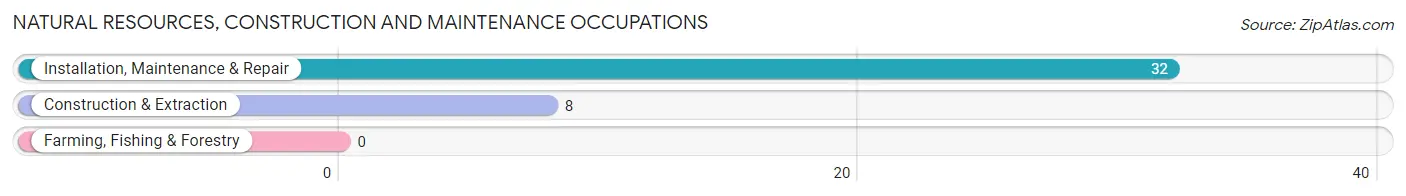
Natural Resources, Construction and Maintenance Occupations
The most common Natural Resources, Construction and Maintenance occupations in Billings are Installation, Maintenance & Repair (32 | 9.4%), and Construction & Extraction (8 | 2.3%).
Natural Resources, Construction and Maintenance Occupations by Sex
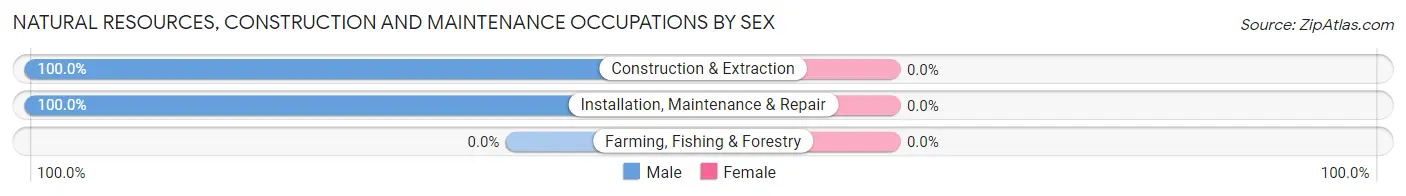
| Occupation | Male | Female |
| Farming, Fishing & Forestry | 0 (0.0%) | 0 (0.0%) |
| Construction & Extraction | 8 (100.0%) | 0 (0.0%) |
| Installation, Maintenance & Repair | 32 (100.0%) | 0 (0.0%) |
| Total (Category) | 40 (100.0%) | 0 (0.0%) |
| Total (Overall) | 159 (46.5%) | 183 (53.5%) |
Production, Transportation and Moving Occupations
The most common Production, Transportation and Moving occupations in Billings are Production (32 | 9.4%), Material Moving (24 | 7.0%), and Transportation (5 | 1.5%).
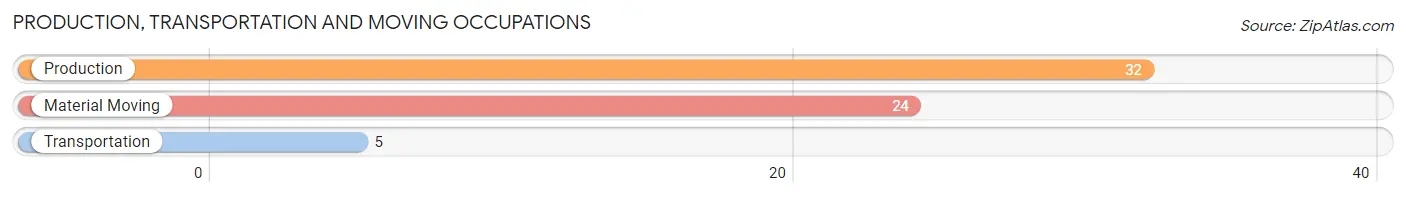
Production, Transportation and Moving Occupations by Sex
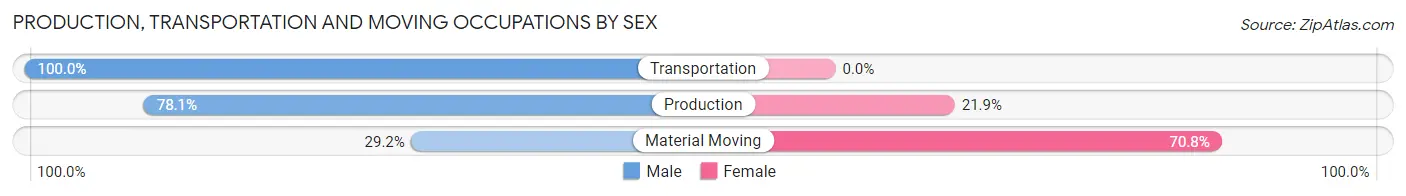
| Occupation | Male | Female |
| Production | 25 (78.1%) | 7 (21.9%) |
| Transportation | 5 (100.0%) | 0 (0.0%) |
| Material Moving | 7 (29.2%) | 17 (70.8%) |
| Total (Category) | 37 (60.7%) | 24 (39.3%) |
| Total (Overall) | 159 (46.5%) | 183 (53.5%) |
Employment Industries by Sex in Billings
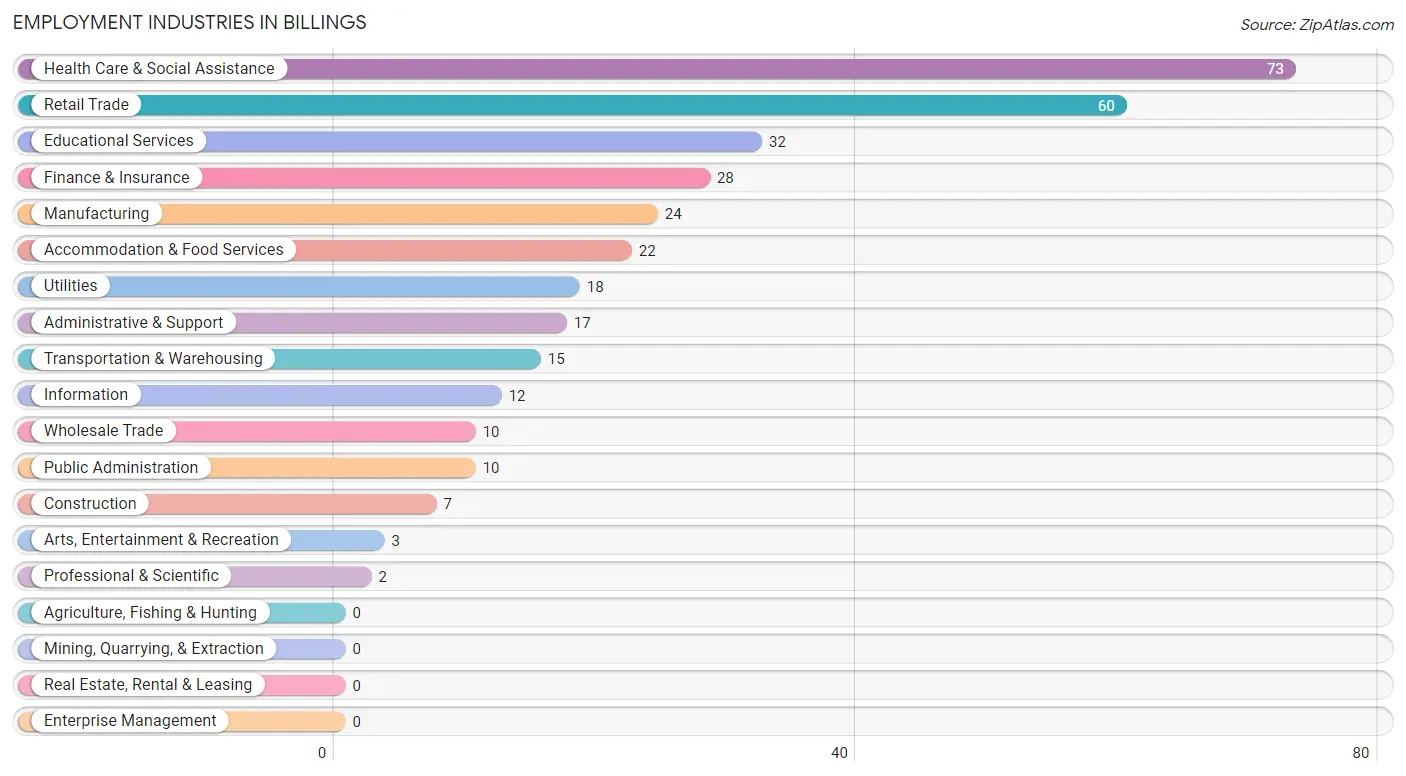
Employment Industries in Billings
The major employment industries in Billings include Health Care & Social Assistance (73 | 21.3%), Retail Trade (60 | 17.5%), Educational Services (32 | 9.4%), Finance & Insurance (28 | 8.2%), and Manufacturing (24 | 7.0%).
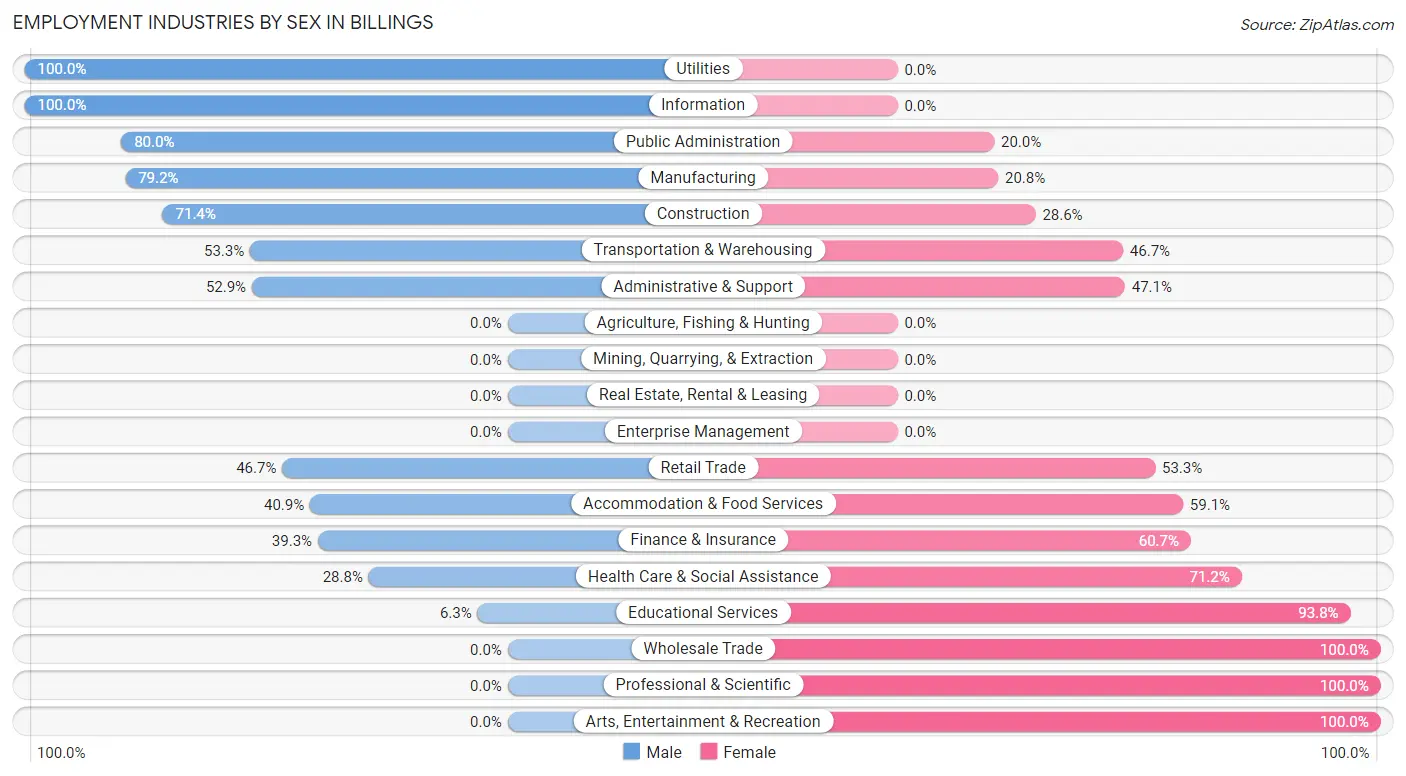
Employment Industries by Sex in Billings
The Billings industries that see more men than women are Utilities (100.0%), Information (100.0%), and Public Administration (80.0%), whereas the industries that tend to have a higher number of women are Wholesale Trade (100.0%), Professional & Scientific (100.0%), and Arts, Entertainment & Recreation (100.0%).
| Industry | Male | Female |
| Agriculture, Fishing & Hunting | 0 (0.0%) | 0 (0.0%) |
| Mining, Quarrying, & Extraction | 0 (0.0%) | 0 (0.0%) |
| Construction | 5 (71.4%) | 2 (28.6%) |
| Manufacturing | 19 (79.2%) | 5 (20.8%) |
| Wholesale Trade | 0 (0.0%) | 10 (100.0%) |
| Retail Trade | 28 (46.7%) | 32 (53.3%) |
| Transportation & Warehousing | 8 (53.3%) | 7 (46.7%) |
| Utilities | 18 (100.0%) | 0 (0.0%) |
| Information | 12 (100.0%) | 0 (0.0%) |
| Finance & Insurance | 11 (39.3%) | 17 (60.7%) |
| Real Estate, Rental & Leasing | 0 (0.0%) | 0 (0.0%) |
| Professional & Scientific | 0 (0.0%) | 2 (100.0%) |
| Enterprise Management | 0 (0.0%) | 0 (0.0%) |
| Administrative & Support | 9 (52.9%) | 8 (47.1%) |
| Educational Services | 2 (6.2%) | 30 (93.8%) |
| Health Care & Social Assistance | 21 (28.8%) | 52 (71.2%) |
| Arts, Entertainment & Recreation | 0 (0.0%) | 3 (100.0%) |
| Accommodation & Food Services | 9 (40.9%) | 13 (59.1%) |
| Public Administration | 8 (80.0%) | 2 (20.0%) |
| Total | 159 (46.5%) | 183 (53.5%) |
Education in Billings
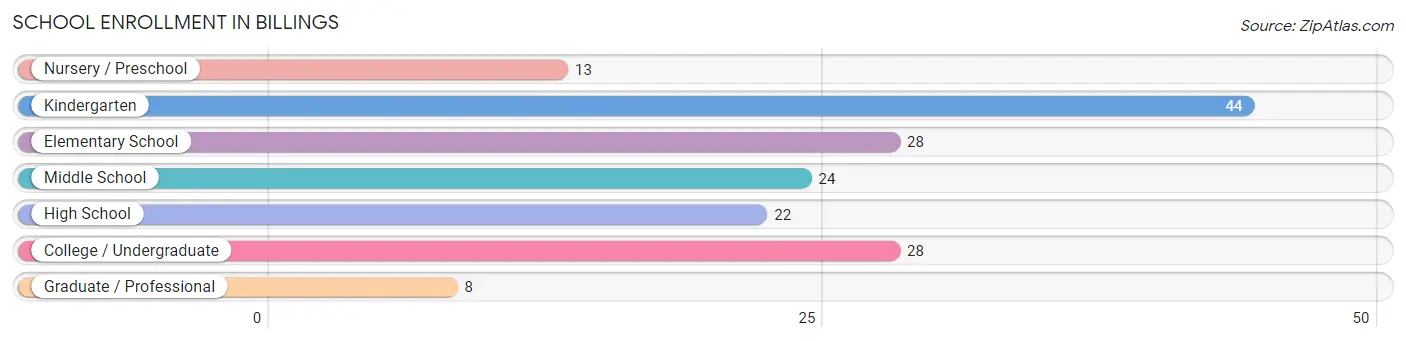
School Enrollment in Billings
The most common levels of schooling among the 167 students in Billings are kindergarten (44 | 26.4%), elementary school (28 | 16.8%), and college / undergraduate (28 | 16.8%).
| School Level | # Students | % Students |
| Nursery / Preschool | 13 | 7.8% |
| Kindergarten | 44 | 26.4% |
| Elementary School | 28 | 16.8% |
| Middle School | 24 | 14.4% |
| High School | 22 | 13.2% |
| College / Undergraduate | 28 | 16.8% |
| Graduate / Professional | 8 | 4.8% |
| Total | 167 | 100.0% |
School Enrollment by Age by Funding Source in Billings
Out of a total of 167 students who are enrolled in schools in Billings, 29 (17.4%) attend a private institution, while the remaining 138 (82.6%) are enrolled in public schools. The age group of 25 to 34 year olds has the highest likelihood of being enrolled in private schools, with 11 (100.0% in the age bracket) enrolled. Conversely, the age group of 3 to 4 year olds has the lowest likelihood of being enrolled in a private school, with 6 (100.0% in the age bracket) attending a public institution.
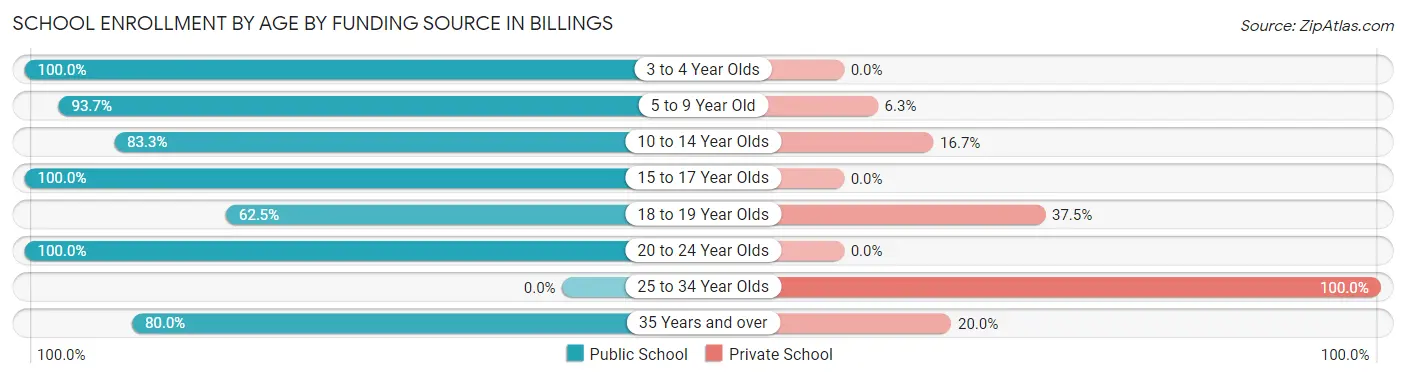
| Age Bracket | Public School | Private School |
| 3 to 4 Year Olds | 6 (100.0%) | 0 (0.0%) |
| 5 to 9 Year Old | 74 (93.7%) | 5 (6.3%) |
| 10 to 14 Year Olds | 20 (83.3%) | 4 (16.7%) |
| 15 to 17 Year Olds | 11 (100.0%) | 0 (0.0%) |
| 18 to 19 Year Olds | 10 (62.5%) | 6 (37.5%) |
| 20 to 24 Year Olds | 5 (100.0%) | 0 (0.0%) |
| 25 to 34 Year Olds | 0 (0.0%) | 11 (100.0%) |
| 35 Years and over | 12 (80.0%) | 3 (20.0%) |
| Total | 138 (82.6%) | 29 (17.4%) |
Educational Attainment by Field of Study in Billings
Education (21 | 23.3%), business (17 | 18.9%), liberal arts & history (13 | 14.4%), psychology (12 | 13.3%), and arts & humanities (9 | 10.0%) are the most common fields of study among 90 individuals in Billings who have obtained a bachelor's degree or higher.
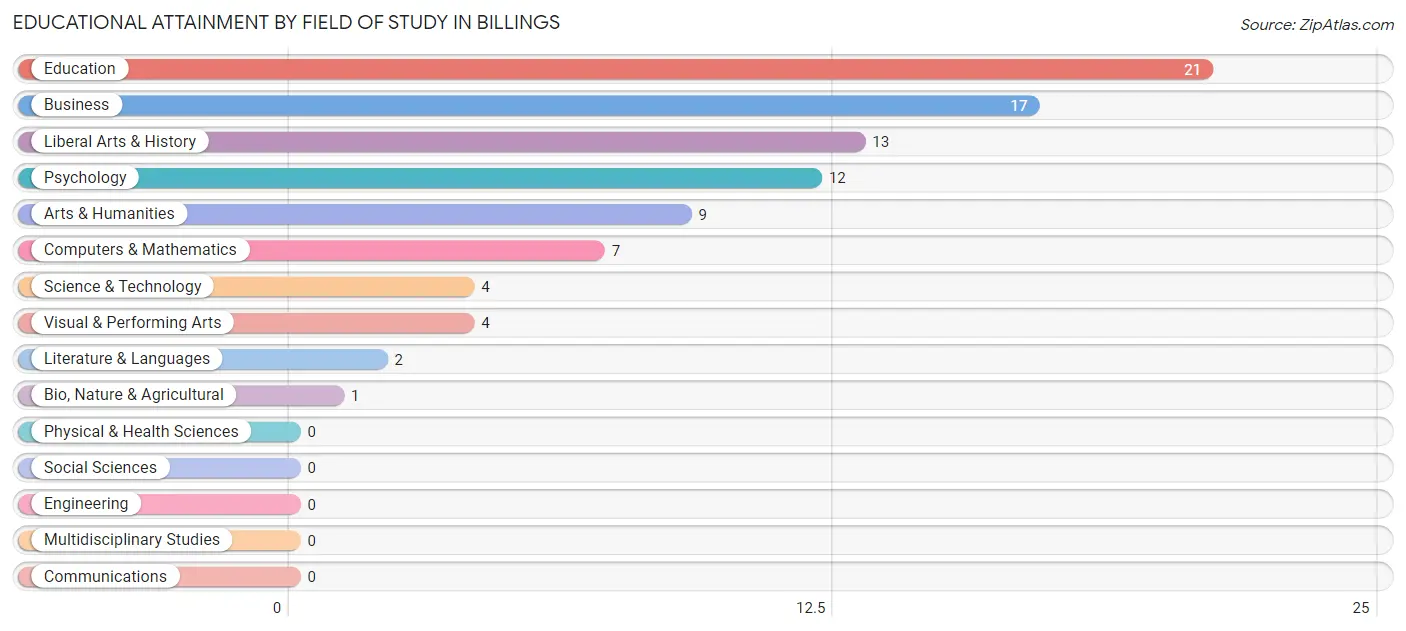
| Field of Study | # Graduates | % Graduates |
| Computers & Mathematics | 7 | 7.8% |
| Bio, Nature & Agricultural | 1 | 1.1% |
| Physical & Health Sciences | 0 | 0.0% |
| Psychology | 12 | 13.3% |
| Social Sciences | 0 | 0.0% |
| Engineering | 0 | 0.0% |
| Multidisciplinary Studies | 0 | 0.0% |
| Science & Technology | 4 | 4.4% |
| Business | 17 | 18.9% |
| Education | 21 | 23.3% |
| Literature & Languages | 2 | 2.2% |
| Liberal Arts & History | 13 | 14.4% |
| Visual & Performing Arts | 4 | 4.4% |
| Communications | 0 | 0.0% |
| Arts & Humanities | 9 | 10.0% |
| Total | 90 | 100.0% |
Transportation & Commute in Billings
Vehicle Availability by Sex in Billings
The most prevalent vehicle ownership categories in Billings are males with 2 vehicles (89, accounting for 56.0%) and females with 2 vehicles (79, making up 49.7%).
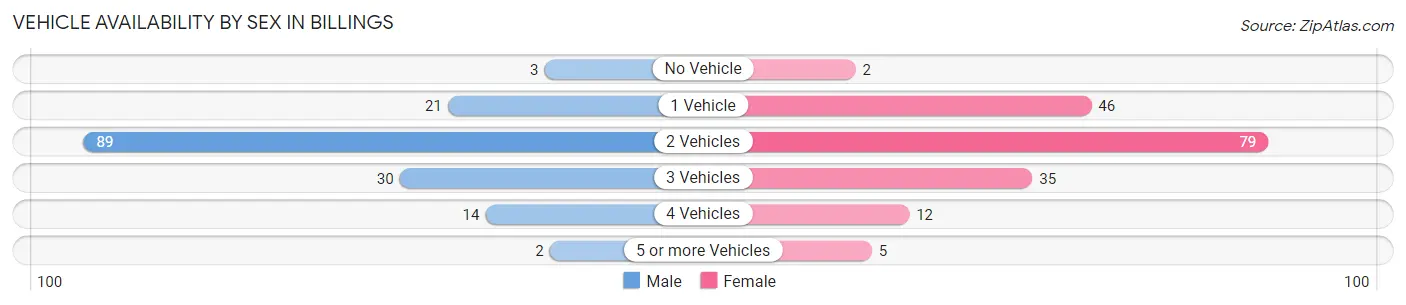
| Vehicles Available | Male | Female |
| No Vehicle | 3 (1.9%) | 2 (1.1%) |
| 1 Vehicle | 21 (13.2%) | 46 (25.7%) |
| 2 Vehicles | 89 (56.0%) | 79 (44.1%) |
| 3 Vehicles | 30 (18.9%) | 35 (19.6%) |
| 4 Vehicles | 14 (8.8%) | 12 (6.7%) |
| 5 or more Vehicles | 2 (1.3%) | 5 (2.8%) |
| Total | 159 (100.0%) | 179 (100.0%) |
Commute Time in Billings
The most frequently occuring commute durations in Billings are 30 to 34 minutes (67 commuters, 21.4%), 35 to 39 minutes (39 commuters, 12.5%), and 20 to 24 minutes (36 commuters, 11.5%).
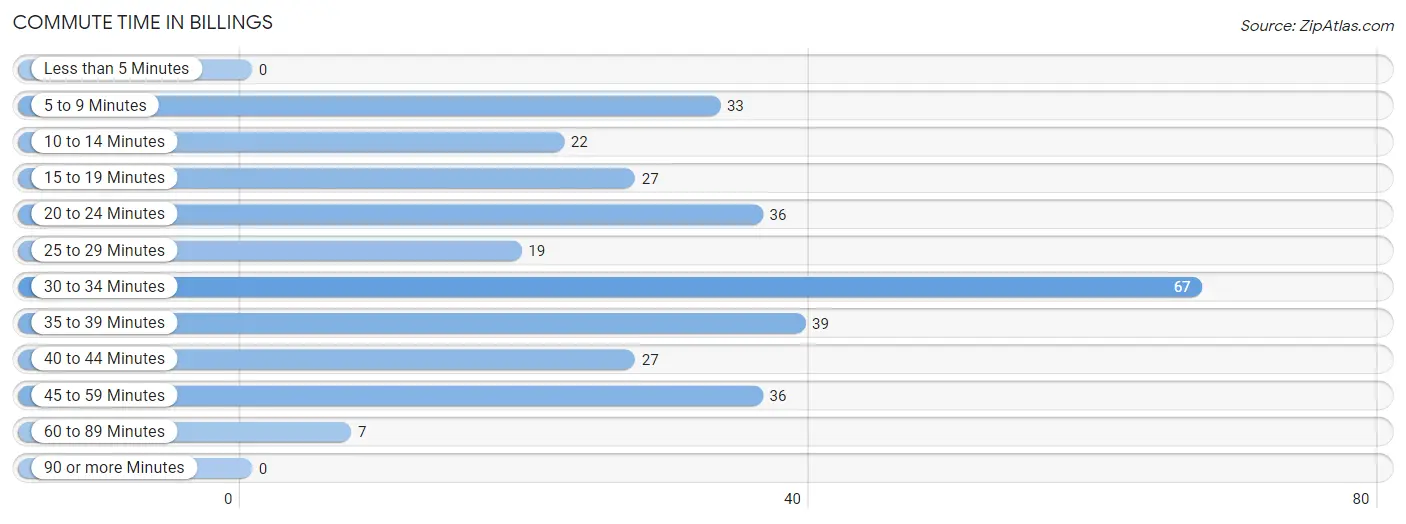
| Commute Time | # Commuters | % Commuters |
| Less than 5 Minutes | 0 | 0.0% |
| 5 to 9 Minutes | 33 | 10.5% |
| 10 to 14 Minutes | 22 | 7.0% |
| 15 to 19 Minutes | 27 | 8.6% |
| 20 to 24 Minutes | 36 | 11.5% |
| 25 to 29 Minutes | 19 | 6.1% |
| 30 to 34 Minutes | 67 | 21.4% |
| 35 to 39 Minutes | 39 | 12.5% |
| 40 to 44 Minutes | 27 | 8.6% |
| 45 to 59 Minutes | 36 | 11.5% |
| 60 to 89 Minutes | 7 | 2.2% |
| 90 or more Minutes | 0 | 0.0% |
Commute Time by Sex in Billings
The most common commute times in Billings are 30 to 34 minutes (37 commuters, 25.2%) for males and 45 to 59 minutes (33 commuters, 19.9%) for females.
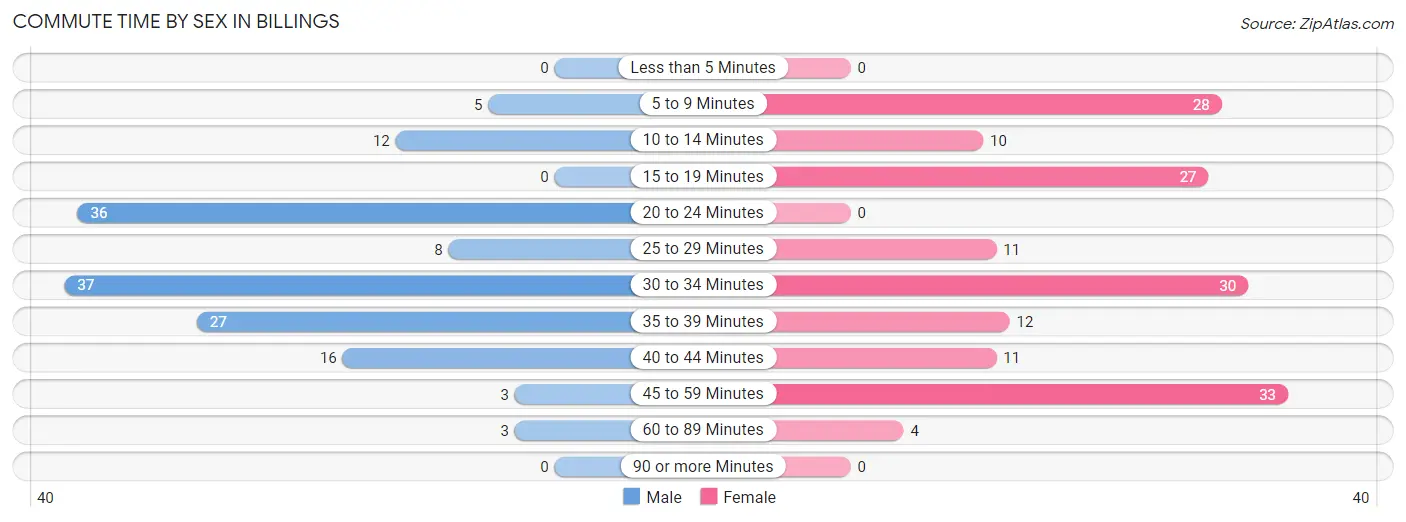
| Commute Time | Male | Female |
| Less than 5 Minutes | 0 (0.0%) | 0 (0.0%) |
| 5 to 9 Minutes | 5 (3.4%) | 28 (16.9%) |
| 10 to 14 Minutes | 12 (8.2%) | 10 (6.0%) |
| 15 to 19 Minutes | 0 (0.0%) | 27 (16.3%) |
| 20 to 24 Minutes | 36 (24.5%) | 0 (0.0%) |
| 25 to 29 Minutes | 8 (5.4%) | 11 (6.6%) |
| 30 to 34 Minutes | 37 (25.2%) | 30 (18.1%) |
| 35 to 39 Minutes | 27 (18.4%) | 12 (7.2%) |
| 40 to 44 Minutes | 16 (10.9%) | 11 (6.6%) |
| 45 to 59 Minutes | 3 (2.0%) | 33 (19.9%) |
| 60 to 89 Minutes | 3 (2.0%) | 4 (2.4%) |
| 90 or more Minutes | 0 (0.0%) | 0 (0.0%) |
Time of Departure to Work by Sex in Billings
The most frequent times of departure to work in Billings are 6:00 AM to 6:29 AM (36, 24.5%) for males and 7:00 AM to 7:29 AM (66, 39.8%) for females.
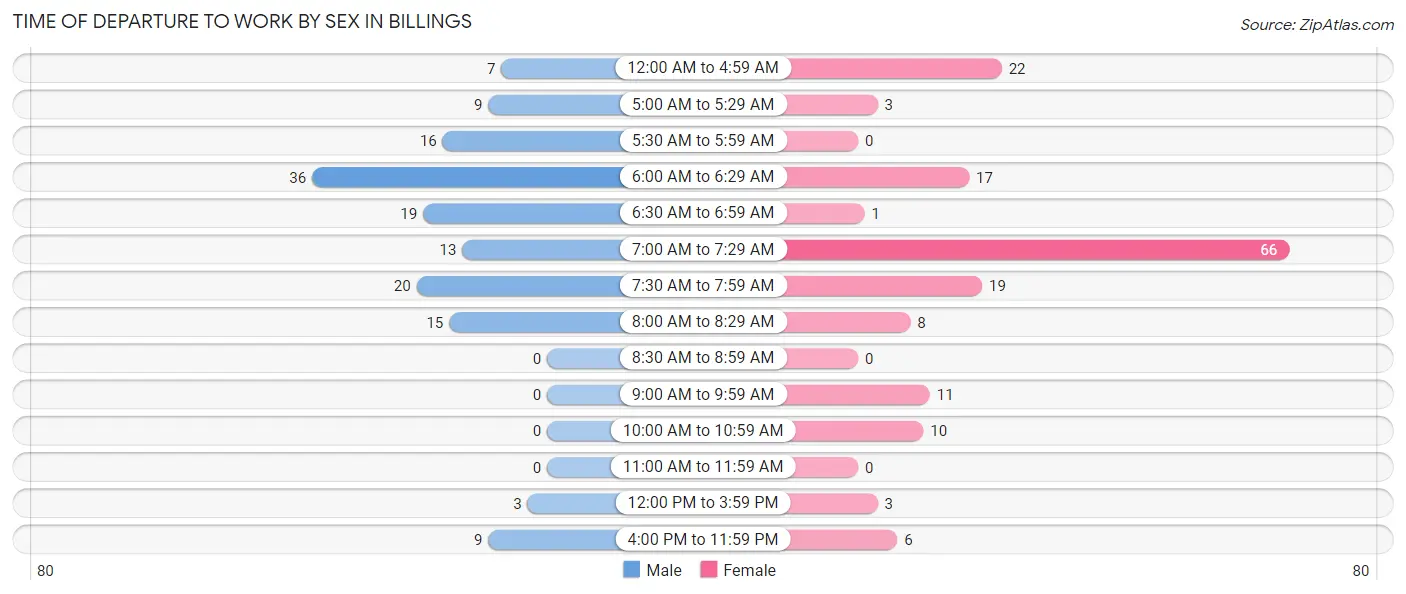
| Time of Departure | Male | Female |
| 12:00 AM to 4:59 AM | 7 (4.8%) | 22 (13.3%) |
| 5:00 AM to 5:29 AM | 9 (6.1%) | 3 (1.8%) |
| 5:30 AM to 5:59 AM | 16 (10.9%) | 0 (0.0%) |
| 6:00 AM to 6:29 AM | 36 (24.5%) | 17 (10.2%) |
| 6:30 AM to 6:59 AM | 19 (12.9%) | 1 (0.6%) |
| 7:00 AM to 7:29 AM | 13 (8.8%) | 66 (39.8%) |
| 7:30 AM to 7:59 AM | 20 (13.6%) | 19 (11.5%) |
| 8:00 AM to 8:29 AM | 15 (10.2%) | 8 (4.8%) |
| 8:30 AM to 8:59 AM | 0 (0.0%) | 0 (0.0%) |
| 9:00 AM to 9:59 AM | 0 (0.0%) | 11 (6.6%) |
| 10:00 AM to 10:59 AM | 0 (0.0%) | 10 (6.0%) |
| 11:00 AM to 11:59 AM | 0 (0.0%) | 0 (0.0%) |
| 12:00 PM to 3:59 PM | 3 (2.0%) | 3 (1.8%) |
| 4:00 PM to 11:59 PM | 9 (6.1%) | 6 (3.6%) |
| Total | 147 (100.0%) | 166 (100.0%) |
Housing Occupancy in Billings
Occupancy by Ownership in Billings
Of the total 421 dwellings in Billings, owner-occupied units account for 286 (67.9%), while renter-occupied units make up 135 (32.1%).
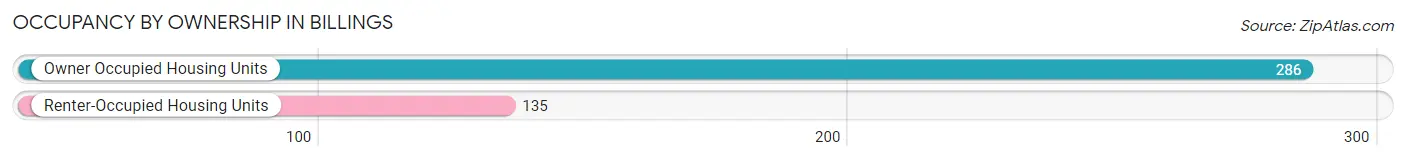
| Occupancy | # Housing Units | % Housing Units |
| Owner Occupied Housing Units | 286 | 67.9% |
| Renter-Occupied Housing Units | 135 | 32.1% |
| Total Occupied Housing Units | 421 | 100.0% |
Occupancy by Household Size in Billings
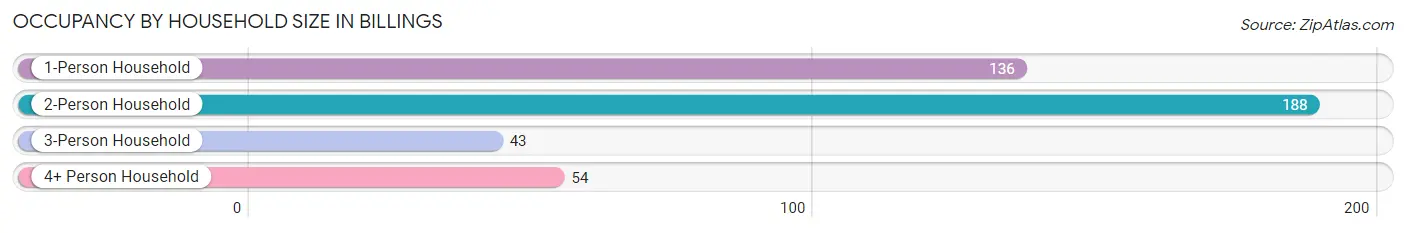
| Household Size | # Housing Units | % Housing Units |
| 1-Person Household | 136 | 32.3% |
| 2-Person Household | 188 | 44.7% |
| 3-Person Household | 43 | 10.2% |
| 4+ Person Household | 54 | 12.8% |
| Total Housing Units | 421 | 100.0% |
Occupancy by Ownership by Household Size in Billings
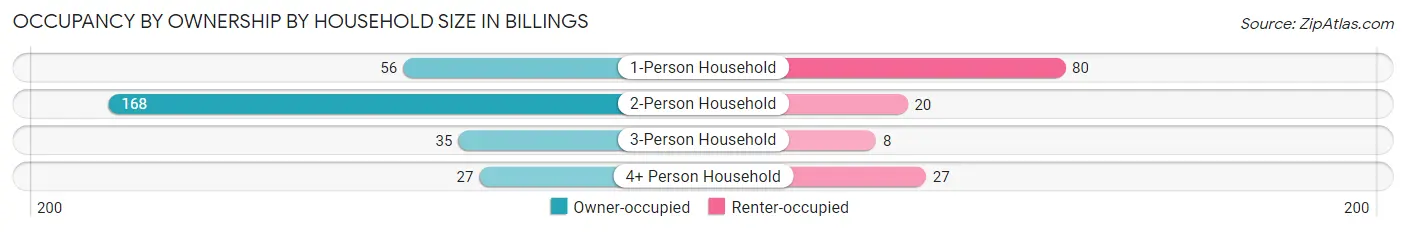
| Household Size | Owner-occupied | Renter-occupied |
| 1-Person Household | 56 (41.2%) | 80 (58.8%) |
| 2-Person Household | 168 (89.4%) | 20 (10.6%) |
| 3-Person Household | 35 (81.4%) | 8 (18.6%) |
| 4+ Person Household | 27 (50.0%) | 27 (50.0%) |
| Total Housing Units | 286 (67.9%) | 135 (32.1%) |
Occupancy by Educational Attainment in Billings
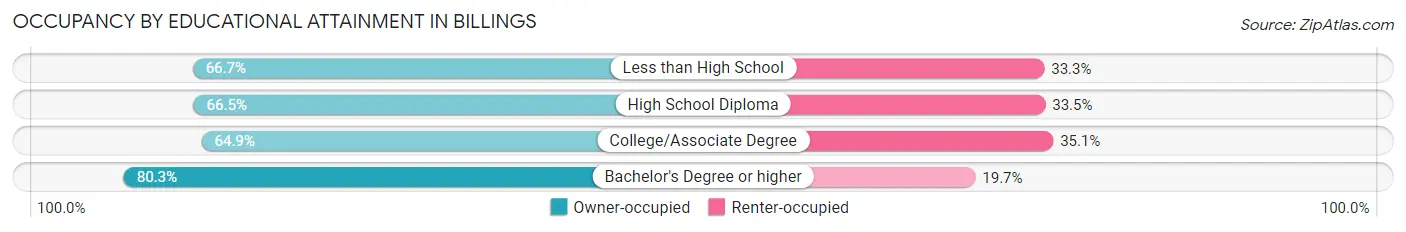
| Household Size | Owner-occupied | Renter-occupied |
| Less than High School | 26 (66.7%) | 13 (33.3%) |
| High School Diploma | 113 (66.5%) | 57 (33.5%) |
| College/Associate Degree | 98 (64.9%) | 53 (35.1%) |
| Bachelor's Degree or higher | 49 (80.3%) | 12 (19.7%) |
Occupancy by Age of Householder in Billings
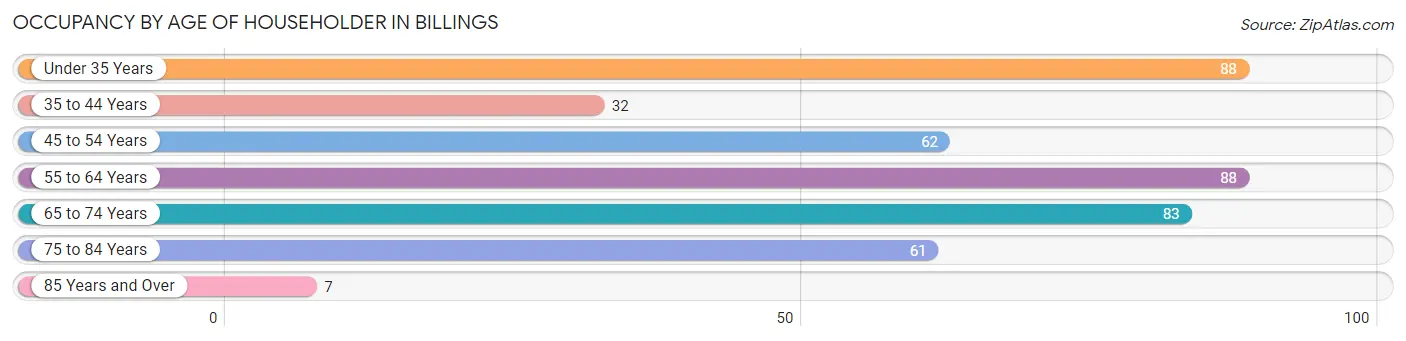
| Age Bracket | # Households | % Households |
| Under 35 Years | 88 | 20.9% |
| 35 to 44 Years | 32 | 7.6% |
| 45 to 54 Years | 62 | 14.7% |
| 55 to 64 Years | 88 | 20.9% |
| 65 to 74 Years | 83 | 19.7% |
| 75 to 84 Years | 61 | 14.5% |
| 85 Years and Over | 7 | 1.7% |
| Total | 421 | 100.0% |
Housing Finances in Billings
Median Income by Occupancy in Billings
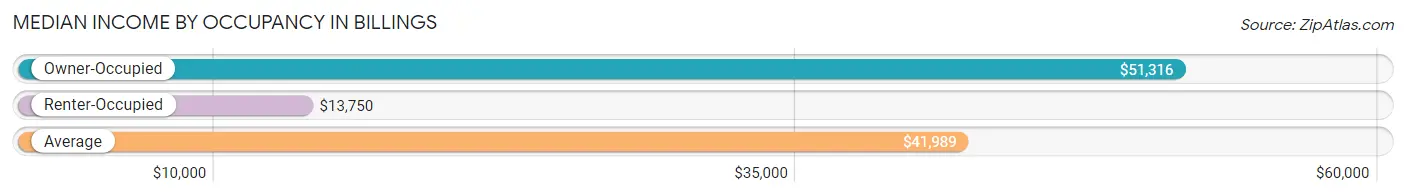
| Occupancy Type | # Households | Median Income |
| Owner-Occupied | 286 (67.9%) | $51,316 |
| Renter-Occupied | 135 (32.1%) | $13,750 |
| Average | 421 (100.0%) | $41,989 |
Occupancy by Householder Income Bracket in Billings
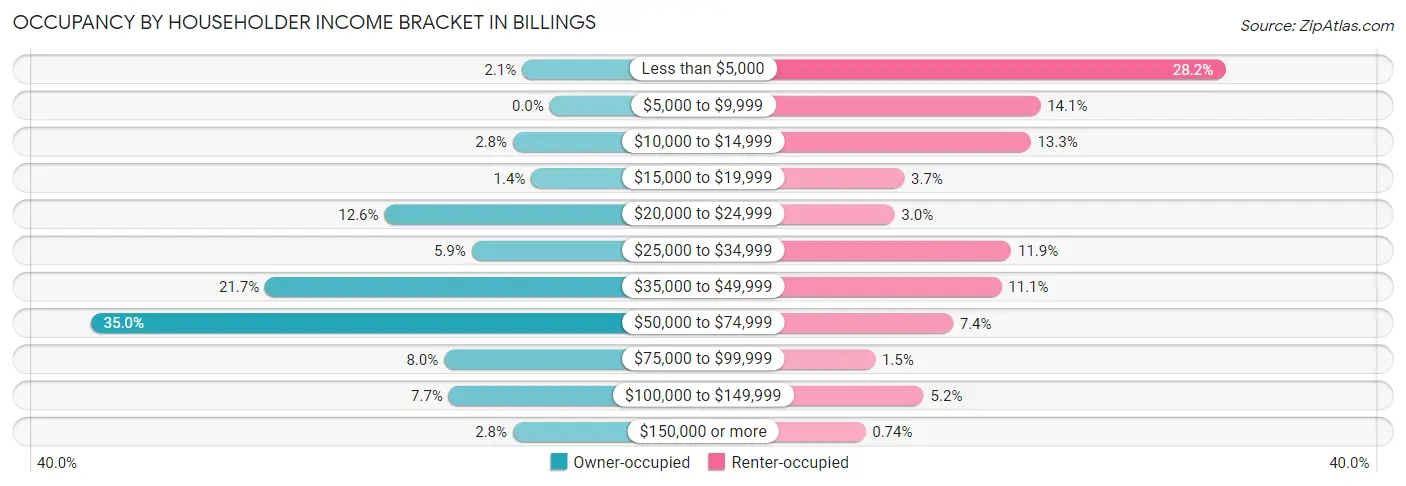
| Income Bracket | Owner-occupied | Renter-occupied |
| Less than $5,000 | 6 (2.1%) | 38 (28.1%) |
| $5,000 to $9,999 | 0 (0.0%) | 19 (14.1%) |
| $10,000 to $14,999 | 8 (2.8%) | 18 (13.3%) |
| $15,000 to $19,999 | 4 (1.4%) | 5 (3.7%) |
| $20,000 to $24,999 | 36 (12.6%) | 4 (3.0%) |
| $25,000 to $34,999 | 17 (5.9%) | 16 (11.8%) |
| $35,000 to $49,999 | 62 (21.7%) | 15 (11.1%) |
| $50,000 to $74,999 | 100 (35.0%) | 10 (7.4%) |
| $75,000 to $99,999 | 23 (8.0%) | 2 (1.5%) |
| $100,000 to $149,999 | 22 (7.7%) | 7 (5.2%) |
| $150,000 or more | 8 (2.8%) | 1 (0.7%) |
| Total | 286 (100.0%) | 135 (100.0%) |
Monthly Housing Cost Tiers in Billings
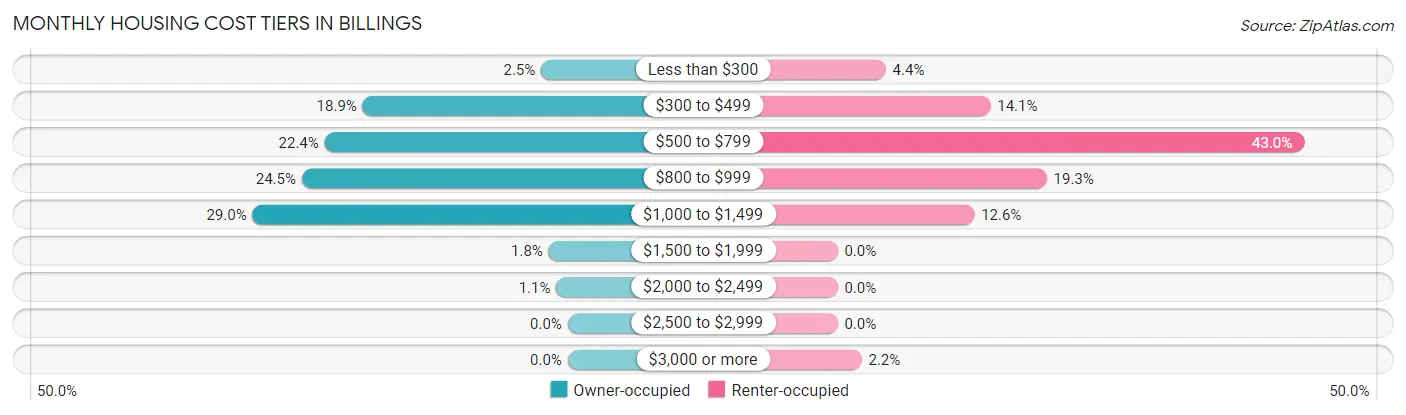
| Monthly Cost | Owner-occupied | Renter-occupied |
| Less than $300 | 7 (2.5%) | 6 (4.4%) |
| $300 to $499 | 54 (18.9%) | 19 (14.1%) |
| $500 to $799 | 64 (22.4%) | 58 (43.0%) |
| $800 to $999 | 70 (24.5%) | 26 (19.3%) |
| $1,000 to $1,499 | 83 (29.0%) | 17 (12.6%) |
| $1,500 to $1,999 | 5 (1.8%) | 0 (0.0%) |
| $2,000 to $2,499 | 3 (1.1%) | 0 (0.0%) |
| $2,500 to $2,999 | 0 (0.0%) | 0 (0.0%) |
| $3,000 or more | 0 (0.0%) | 3 (2.2%) |
| Total | 286 (100.0%) | 135 (100.0%) |
Physical Housing Characteristics in Billings
Housing Structures in Billings
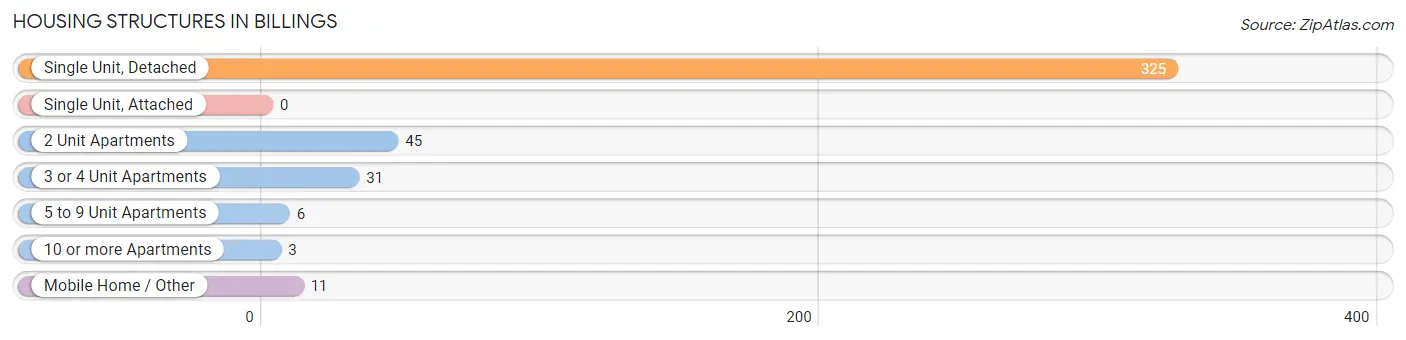
| Structure Type | # Housing Units | % Housing Units |
| Single Unit, Detached | 325 | 77.2% |
| Single Unit, Attached | 0 | 0.0% |
| 2 Unit Apartments | 45 | 10.7% |
| 3 or 4 Unit Apartments | 31 | 7.4% |
| 5 to 9 Unit Apartments | 6 | 1.4% |
| 10 or more Apartments | 3 | 0.7% |
| Mobile Home / Other | 11 | 2.6% |
| Total | 421 | 100.0% |
Housing Structures by Occupancy in Billings
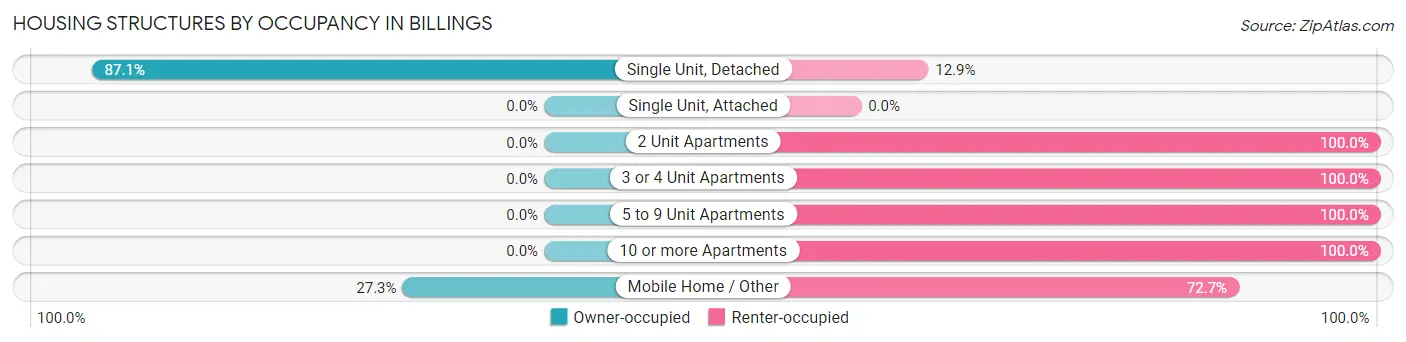
| Structure Type | Owner-occupied | Renter-occupied |
| Single Unit, Detached | 283 (87.1%) | 42 (12.9%) |
| Single Unit, Attached | 0 (0.0%) | 0 (0.0%) |
| 2 Unit Apartments | 0 (0.0%) | 45 (100.0%) |
| 3 or 4 Unit Apartments | 0 (0.0%) | 31 (100.0%) |
| 5 to 9 Unit Apartments | 0 (0.0%) | 6 (100.0%) |
| 10 or more Apartments | 0 (0.0%) | 3 (100.0%) |
| Mobile Home / Other | 3 (27.3%) | 8 (72.7%) |
| Total | 286 (67.9%) | 135 (32.1%) |
Housing Structures by Number of Rooms in Billings
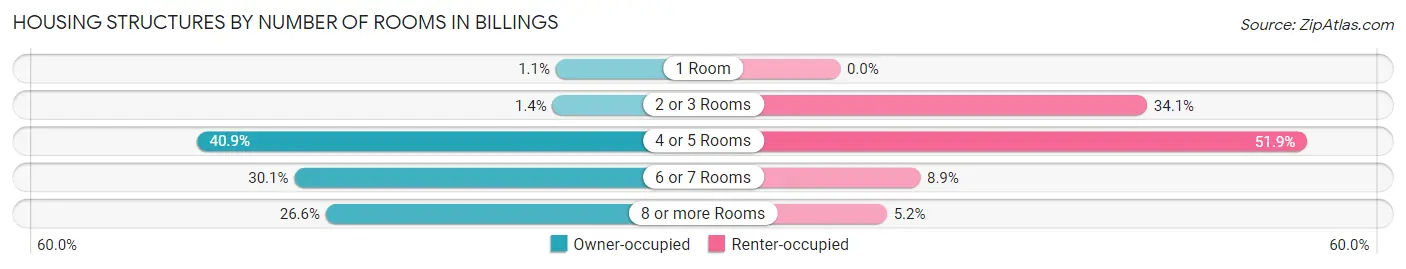
| Number of Rooms | Owner-occupied | Renter-occupied |
| 1 Room | 3 (1.1%) | 0 (0.0%) |
| 2 or 3 Rooms | 4 (1.4%) | 46 (34.1%) |
| 4 or 5 Rooms | 117 (40.9%) | 70 (51.8%) |
| 6 or 7 Rooms | 86 (30.1%) | 12 (8.9%) |
| 8 or more Rooms | 76 (26.6%) | 7 (5.2%) |
| Total | 286 (100.0%) | 135 (100.0%) |
Housing Structure by Heating Type in Billings
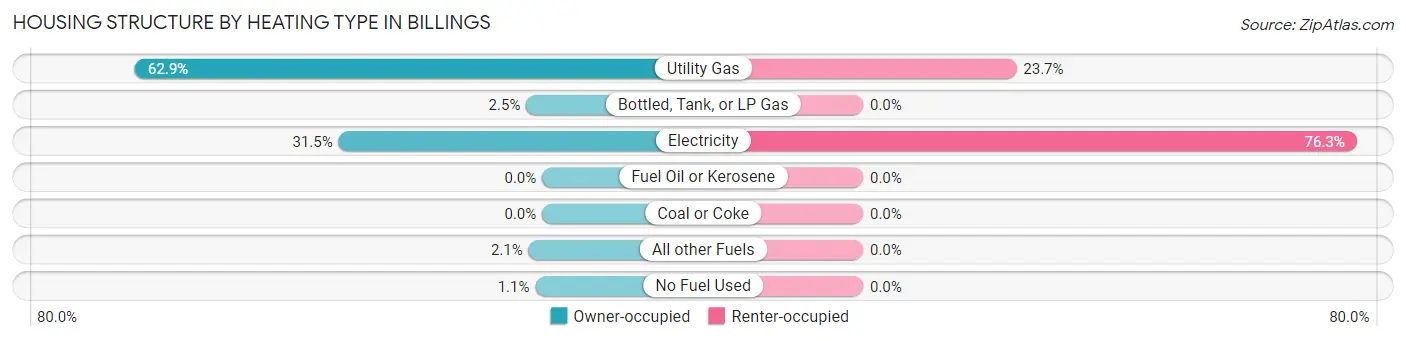
| Heating Type | Owner-occupied | Renter-occupied |
| Utility Gas | 180 (62.9%) | 32 (23.7%) |
| Bottled, Tank, or LP Gas | 7 (2.5%) | 0 (0.0%) |
| Electricity | 90 (31.5%) | 103 (76.3%) |
| Fuel Oil or Kerosene | 0 (0.0%) | 0 (0.0%) |
| Coal or Coke | 0 (0.0%) | 0 (0.0%) |
| All other Fuels | 6 (2.1%) | 0 (0.0%) |
| No Fuel Used | 3 (1.1%) | 0 (0.0%) |
| Total | 286 (100.0%) | 135 (100.0%) |
Household Vehicle Usage in Billings
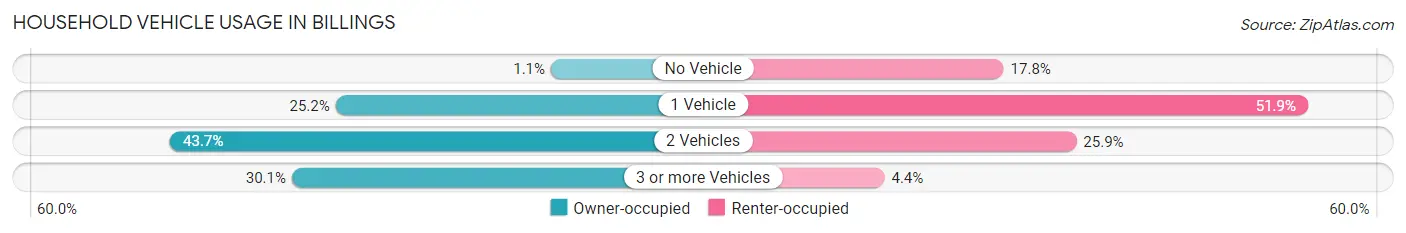
| Vehicles per Household | Owner-occupied | Renter-occupied |
| No Vehicle | 3 (1.1%) | 24 (17.8%) |
| 1 Vehicle | 72 (25.2%) | 70 (51.8%) |
| 2 Vehicles | 125 (43.7%) | 35 (25.9%) |
| 3 or more Vehicles | 86 (30.1%) | 6 (4.4%) |
| Total | 286 (100.0%) | 135 (100.0%) |
Real Estate & Mortgages in Billings
Real Estate and Mortgage Overview in Billings
| Characteristic | Without Mortgage | With Mortgage |
| Housing Units | 91 | 195 |
| Median Property Value | $116,300 | $145,200 |
| Median Household Income | $59,375 | $0 |
| Monthly Housing Costs | $460 | $0 |
| Real Estate Taxes | $974 | $0 |
Property Value by Mortgage Status in Billings
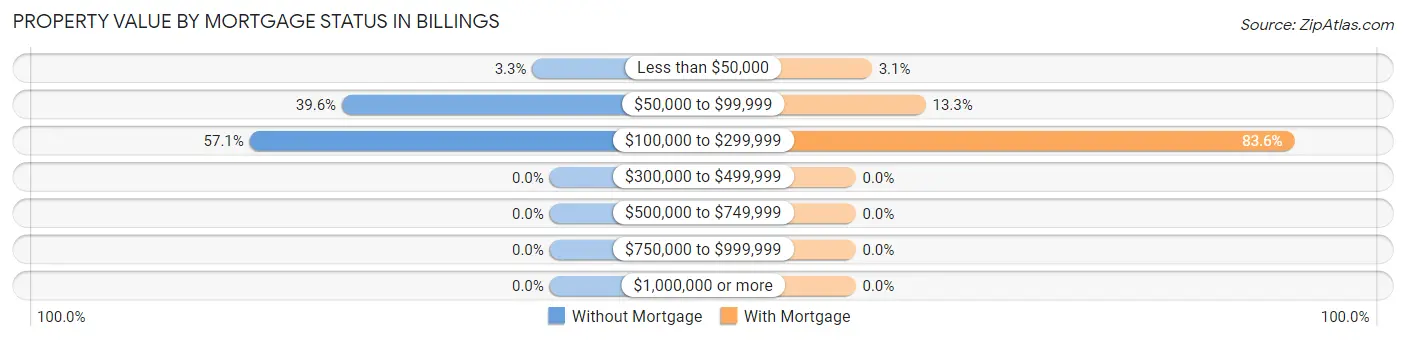
| Property Value | Without Mortgage | With Mortgage |
| Less than $50,000 | 3 (3.3%) | 6 (3.1%) |
| $50,000 to $99,999 | 36 (39.6%) | 26 (13.3%) |
| $100,000 to $299,999 | 52 (57.1%) | 163 (83.6%) |
| $300,000 to $499,999 | 0 (0.0%) | 0 (0.0%) |
| $500,000 to $749,999 | 0 (0.0%) | 0 (0.0%) |
| $750,000 to $999,999 | 0 (0.0%) | 0 (0.0%) |
| $1,000,000 or more | 0 (0.0%) | 0 (0.0%) |
| Total | 91 (100.0%) | 195 (100.0%) |
Household Income by Mortgage Status in Billings
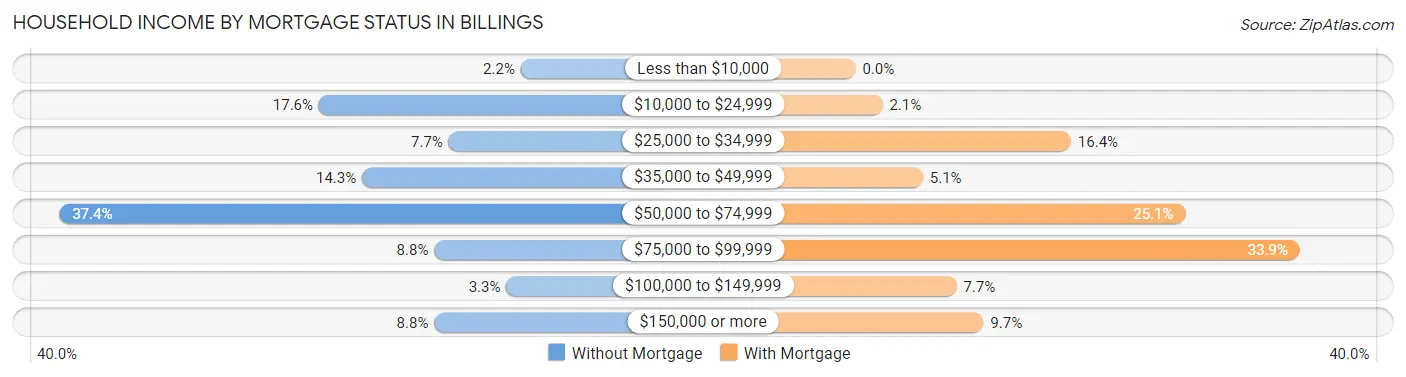
| Household Income | Without Mortgage | With Mortgage |
| Less than $10,000 | 2 (2.2%) | 0 (0.0%) |
| $10,000 to $24,999 | 16 (17.6%) | 4 (2.1%) |
| $25,000 to $34,999 | 7 (7.7%) | 32 (16.4%) |
| $35,000 to $49,999 | 13 (14.3%) | 10 (5.1%) |
| $50,000 to $74,999 | 34 (37.4%) | 49 (25.1%) |
| $75,000 to $99,999 | 8 (8.8%) | 66 (33.9%) |
| $100,000 to $149,999 | 3 (3.3%) | 15 (7.7%) |
| $150,000 or more | 8 (8.8%) | 19 (9.7%) |
| Total | 91 (100.0%) | 195 (100.0%) |
Property Value to Household Income Ratio in Billings
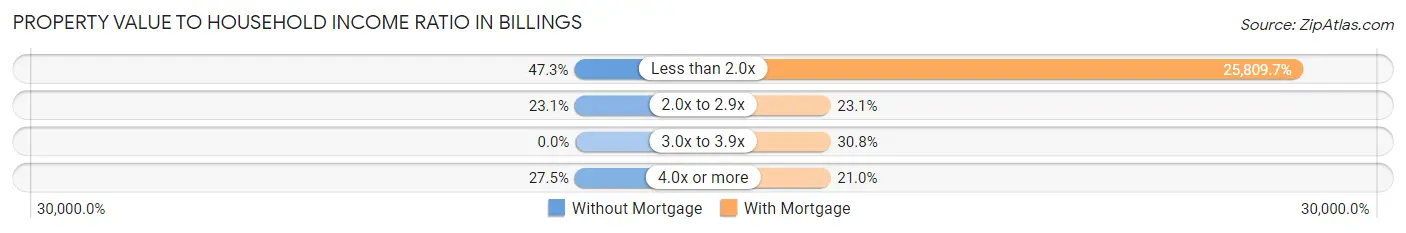
| Value-to-Income Ratio | Without Mortgage | With Mortgage |
| Less than 2.0x | 43 (47.2%) | 50,329 (25,809.7%) |
| 2.0x to 2.9x | 21 (23.1%) | 45 (23.1%) |
| 3.0x to 3.9x | 0 (0.0%) | 60 (30.8%) |
| 4.0x or more | 25 (27.5%) | 41 (21.0%) |
| Total | 91 (100.0%) | 195 (100.0%) |
Real Estate Taxes by Mortgage Status in Billings
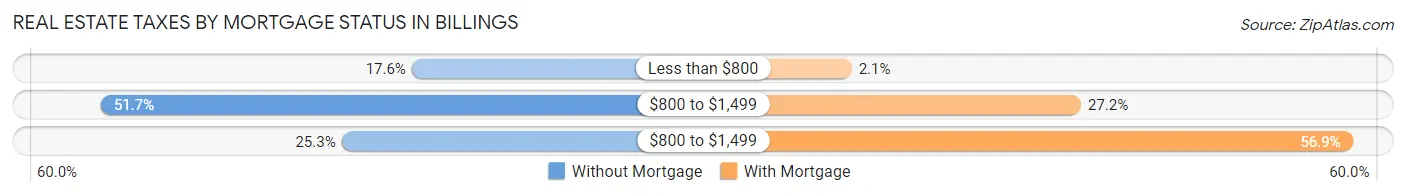
| Property Taxes | Without Mortgage | With Mortgage |
| Less than $800 | 16 (17.6%) | 4 (2.1%) |
| $800 to $1,499 | 47 (51.6%) | 53 (27.2%) |
| $800 to $1,499 | 23 (25.3%) | 111 (56.9%) |
| Total | 91 (100.0%) | 195 (100.0%) |
Health & Disability in Billings
Health Insurance Coverage by Age in Billings
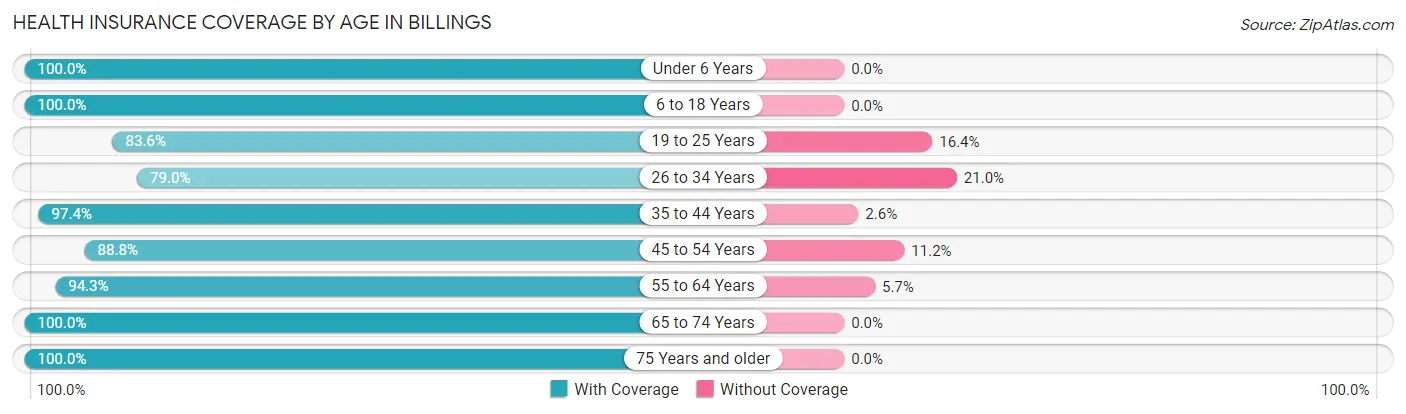
| Age Bracket | With Coverage | Without Coverage |
| Under 6 Years | 72 (100.0%) | 0 (0.0%) |
| 6 to 18 Years | 103 (100.0%) | 0 (0.0%) |
| 19 to 25 Years | 56 (83.6%) | 11 (16.4%) |
| 26 to 34 Years | 79 (79.0%) | 21 (21.0%) |
| 35 to 44 Years | 37 (97.4%) | 1 (2.6%) |
| 45 to 54 Years | 95 (88.8%) | 12 (11.2%) |
| 55 to 64 Years | 148 (94.3%) | 9 (5.7%) |
| 65 to 74 Years | 128 (100.0%) | 0 (0.0%) |
| 75 Years and older | 82 (100.0%) | 0 (0.0%) |
| Total | 800 (93.7%) | 54 (6.3%) |
Health Insurance Coverage by Citizenship Status in Billings
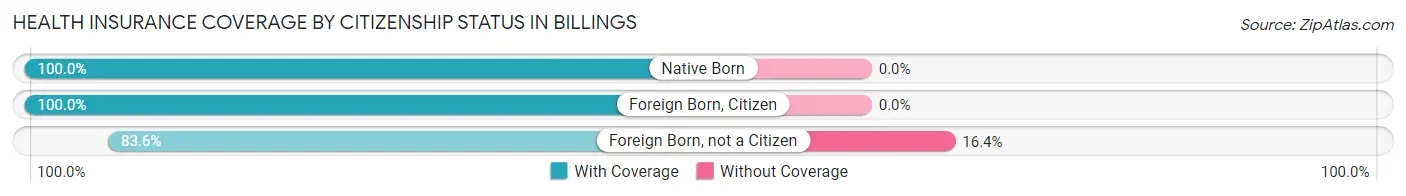
| Citizenship Status | With Coverage | Without Coverage |
| Native Born | 72 (100.0%) | 0 (0.0%) |
| Foreign Born, Citizen | 103 (100.0%) | 0 (0.0%) |
| Foreign Born, not a Citizen | 56 (83.6%) | 11 (16.4%) |
Health Insurance Coverage by Household Income in Billings
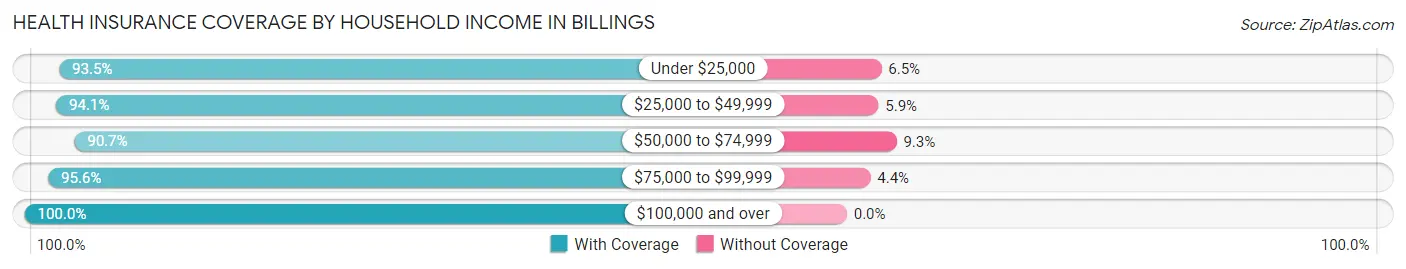
| Household Income | With Coverage | Without Coverage |
| Under $25,000 | 202 (93.5%) | 14 (6.5%) |
| $25,000 to $49,999 | 223 (94.1%) | 14 (5.9%) |
| $50,000 to $74,999 | 224 (90.7%) | 23 (9.3%) |
| $75,000 to $99,999 | 65 (95.6%) | 3 (4.4%) |
| $100,000 and over | 86 (100.0%) | 0 (0.0%) |
Public vs Private Health Insurance Coverage by Age in Billings
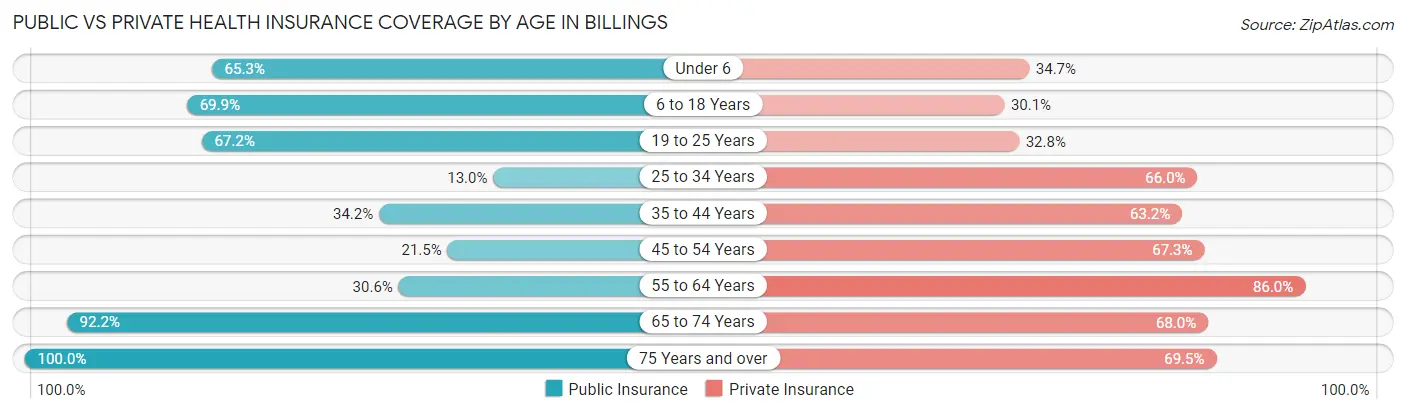
| Age Bracket | Public Insurance | Private Insurance |
| Under 6 | 47 (65.3%) | 25 (34.7%) |
| 6 to 18 Years | 72 (69.9%) | 31 (30.1%) |
| 19 to 25 Years | 45 (67.2%) | 22 (32.8%) |
| 25 to 34 Years | 13 (13.0%) | 66 (66.0%) |
| 35 to 44 Years | 13 (34.2%) | 24 (63.2%) |
| 45 to 54 Years | 23 (21.5%) | 72 (67.3%) |
| 55 to 64 Years | 48 (30.6%) | 135 (86.0%) |
| 65 to 74 Years | 118 (92.2%) | 87 (68.0%) |
| 75 Years and over | 82 (100.0%) | 57 (69.5%) |
| Total | 461 (54.0%) | 519 (60.8%) |
Disability Status by Sex by Age in Billings
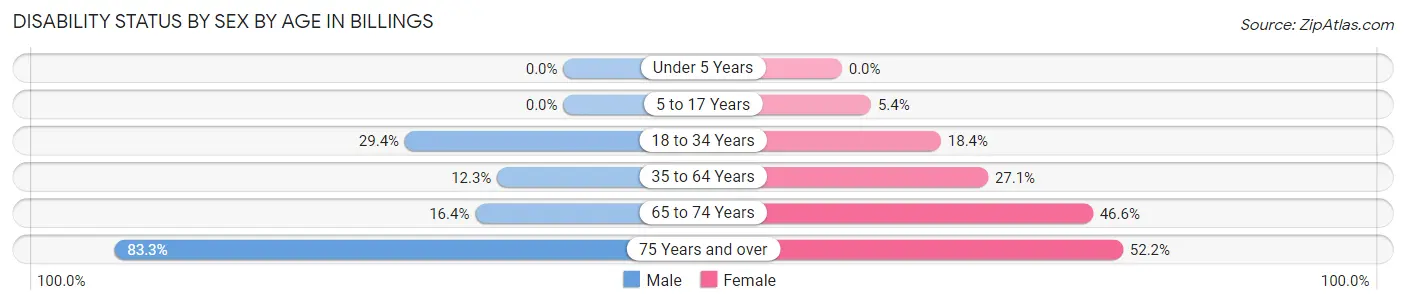
| Age Bracket | Male | Female |
| Under 5 Years | 0 (0.0%) | 0 (0.0%) |
| 5 to 17 Years | 0 (0.0%) | 2 (5.4%) |
| 18 to 34 Years | 25 (29.4%) | 16 (18.4%) |
| 35 to 64 Years | 14 (12.3%) | 51 (27.1%) |
| 65 to 74 Years | 9 (16.4%) | 34 (46.6%) |
| 75 Years and over | 30 (83.3%) | 24 (52.2%) |
Disability Class by Sex by Age in Billings
Disability Class: Hearing Difficulty
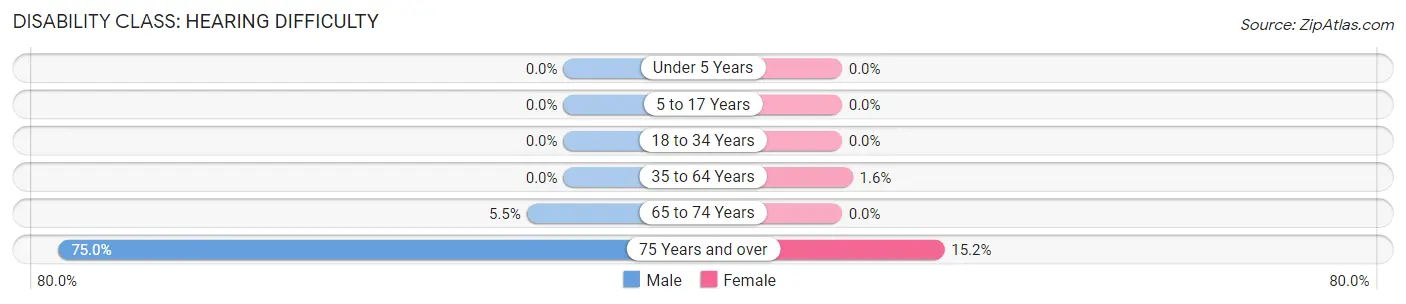
| Age Bracket | Male | Female |
| Under 5 Years | 0 (0.0%) | 0 (0.0%) |
| 5 to 17 Years | 0 (0.0%) | 0 (0.0%) |
| 18 to 34 Years | 0 (0.0%) | 0 (0.0%) |
| 35 to 64 Years | 0 (0.0%) | 3 (1.6%) |
| 65 to 74 Years | 3 (5.4%) | 0 (0.0%) |
| 75 Years and over | 27 (75.0%) | 7 (15.2%) |
Disability Class: Vision Difficulty
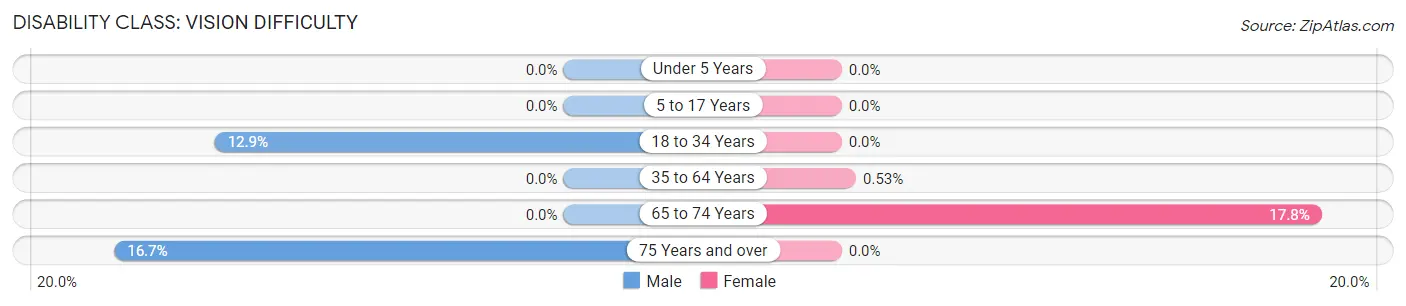
| Age Bracket | Male | Female |
| Under 5 Years | 0 (0.0%) | 0 (0.0%) |
| 5 to 17 Years | 0 (0.0%) | 0 (0.0%) |
| 18 to 34 Years | 11 (12.9%) | 0 (0.0%) |
| 35 to 64 Years | 0 (0.0%) | 1 (0.5%) |
| 65 to 74 Years | 0 (0.0%) | 13 (17.8%) |
| 75 Years and over | 6 (16.7%) | 0 (0.0%) |
Disability Class: Cognitive Difficulty
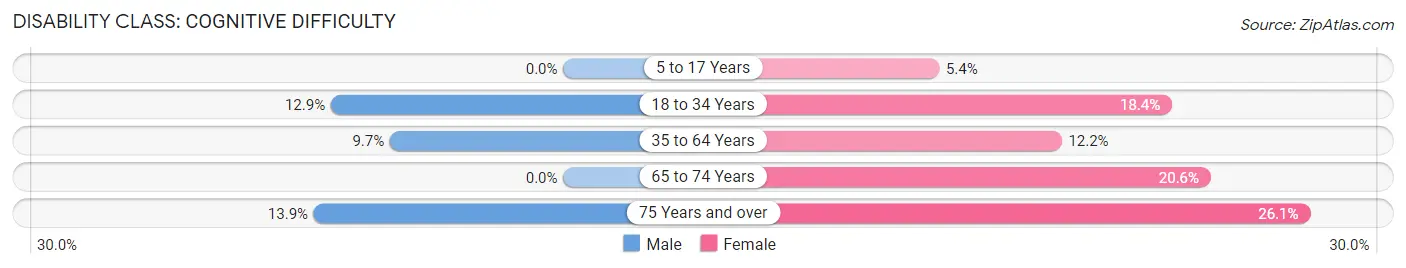
| Age Bracket | Male | Female |
| 5 to 17 Years | 0 (0.0%) | 2 (5.4%) |
| 18 to 34 Years | 11 (12.9%) | 16 (18.4%) |
| 35 to 64 Years | 11 (9.7%) | 23 (12.2%) |
| 65 to 74 Years | 0 (0.0%) | 15 (20.5%) |
| 75 Years and over | 5 (13.9%) | 12 (26.1%) |
Disability Class: Ambulatory Difficulty
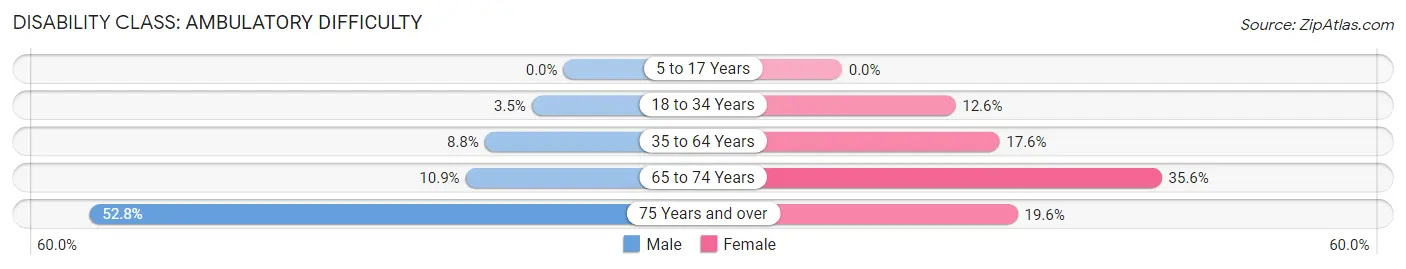
| Age Bracket | Male | Female |
| 5 to 17 Years | 0 (0.0%) | 0 (0.0%) |
| 18 to 34 Years | 3 (3.5%) | 11 (12.6%) |
| 35 to 64 Years | 10 (8.8%) | 33 (17.5%) |
| 65 to 74 Years | 6 (10.9%) | 26 (35.6%) |
| 75 Years and over | 19 (52.8%) | 9 (19.6%) |
Disability Class: Self-Care Difficulty
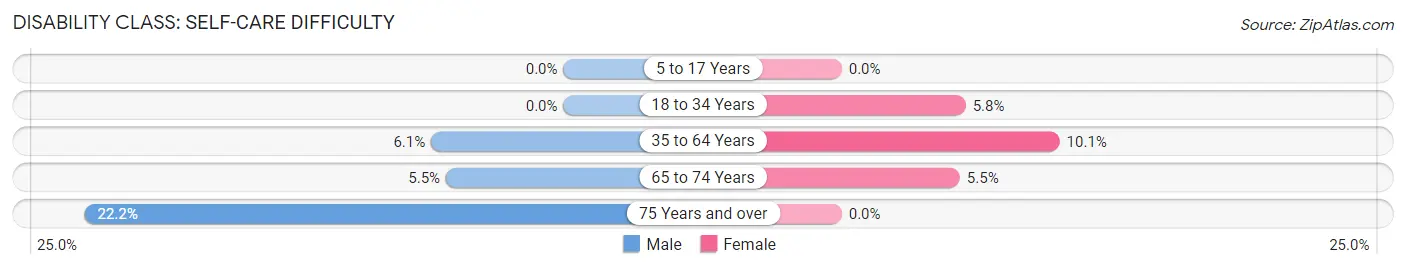
| Age Bracket | Male | Female |
| 5 to 17 Years | 0 (0.0%) | 0 (0.0%) |
| 18 to 34 Years | 0 (0.0%) | 5 (5.8%) |
| 35 to 64 Years | 7 (6.1%) | 19 (10.1%) |
| 65 to 74 Years | 3 (5.4%) | 4 (5.5%) |
| 75 Years and over | 8 (22.2%) | 0 (0.0%) |
Technology Access in Billings
Computing Device Access in Billings
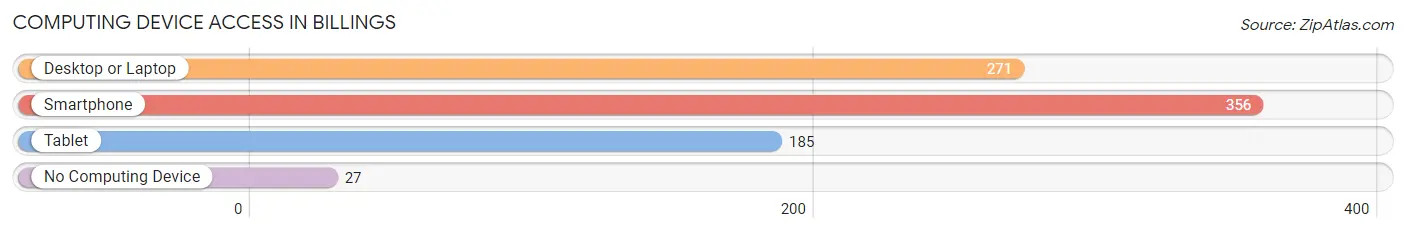
| Device Type | # Households | % Households |
| Desktop or Laptop | 271 | 64.4% |
| Smartphone | 356 | 84.6% |
| Tablet | 185 | 43.9% |
| No Computing Device | 27 | 6.4% |
| Total | 421 | 100.0% |
Internet Access in Billings
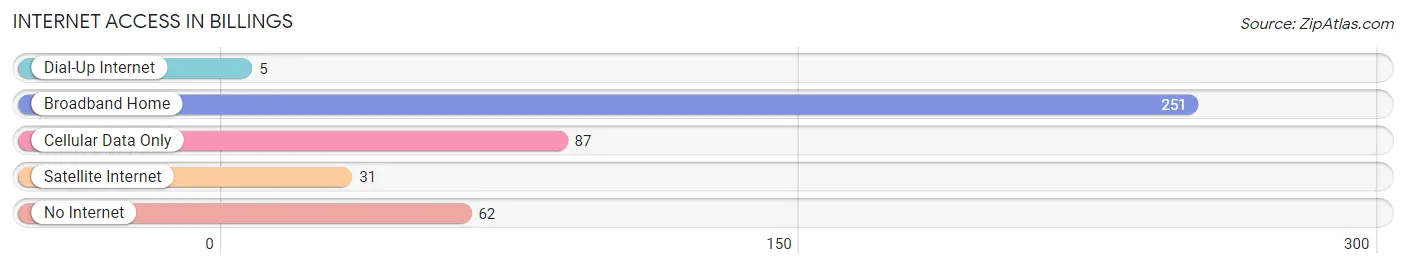
| Internet Type | # Households | % Households |
| Dial-Up Internet | 5 | 1.2% |
| Broadband Home | 251 | 59.6% |
| Cellular Data Only | 87 | 20.7% |
| Satellite Internet | 31 | 7.4% |
| No Internet | 62 | 14.7% |
| Total | 421 | 100.0% |
Billings Summary
Billings, Missouri is a small town located in the southeastern corner of the state. It is situated in the Ozark Mountains and is the county seat of Taney County. The town was founded in 1871 and has a population of approximately 1,000 people.
History
The area that is now Billings was first settled in the early 1800s by settlers from the nearby town of Forsyth. The town was originally known as “Forsyth Station” and was a stop on the stagecoach line that ran between Springfield and Forsyth. In 1871, the town was officially incorporated as Billings, named after the first postmaster, William Billings.
The town grew slowly over the years, but it was not until the late 1800s that it began to experience significant growth. This was due to the arrival of the railroad, which connected Billings to the larger cities of Springfield and Branson. The railroad also brought with it a number of businesses, including a sawmill, a gristmill, and a general store.
Geography
Billings is located in the Ozark Mountains of southern Missouri. The town is situated in a valley surrounded by hills and mountains. The town is located at the intersection of two major highways, US Route 65 and Missouri Route 76.
The town is located in a temperate climate, with hot summers and mild winters. The average annual temperature is around 60 degrees Fahrenheit. The town receives an average of 40 inches of precipitation each year, with most of it falling in the form of rain.
Economy
The economy of Billings is largely based on tourism and agriculture. The town is home to several tourist attractions, including the Ozark Mountain Music Festival, the Billings Country Club, and the Billings Historical Museum. The town also has a number of small businesses, including restaurants, shops, and a few small manufacturing plants.
Agriculture is also an important part of the local economy. The town is home to several farms, which produce a variety of crops, including corn, soybeans, wheat, and hay.
Demographics
As of the 2010 census, the population of Billings was 1,000 people. The town is predominantly white, with a small African American population. The median household income is around $35,000, and the median age is around 40 years old.
Conclusion
Billings, Missouri is a small town located in the Ozark Mountains of southern Missouri. The town was founded in 1871 and has a population of approximately 1,000 people. The economy of Billings is largely based on tourism and agriculture, and the town is home to several tourist attractions and small businesses. The town is predominantly white, with a small African American population.
Common Questions
What is Per Capita Income in Billings?
Per Capita income in Billings is $22,780.
What is the Median Family Income in Billings?
Median Family Income in Billings is $50,592.
What is the Median Household income in Billings?
Median Household Income in Billings is $41,989.
What is Income or Wage Gap in Billings?
Income or Wage Gap in Billings is 30.4%.
Women in Billings earn 69.6 cents for every dollar earned by a man.
What is Family Income Deficit in Billings?
Family Income Deficit in Billings is $17,408.
Families that are below poverty line in Billings earn $17,408 less on average than the poverty threshold level.
What is Inequality or Gini Index in Billings?
Inequality or Gini Index in Billings is 0.41.
What is the Total Population of Billings?
Total Population of Billings is 854.
What is the Total Male Population of Billings?
Total Male Population of Billings is 396.
What is the Total Female Population of Billings?
Total Female Population of Billings is 458.
What is the Ratio of Males per 100 Females in Billings?
There are 86.46 Males per 100 Females in Billings.
What is the Ratio of Females per 100 Males in Billings?
There are 115.66 Females per 100 Males in Billings.
What is the Median Population Age in Billings?
Median Population Age in Billings is 49.6 Years.
What is the Average Family Size in Billings
Average Family Size in Billings is 2.5 People.
What is the Average Household Size in Billings
Average Household Size in Billings is 2.0 People.
How Large is the Labor Force in Billings?
There are 353 People in the Labor Forcein in Billings.
What is the Percentage of People in the Labor Force in Billings?
50.9% of People are in the Labor Force in Billings.
What is the Unemployment Rate in Billings?
Unemployment Rate in Billings is 3.1%.