Farmington, MO Map & Demographics
Farmington Map
Farmington Overview
$24,281
PER CAPITA INCOME
$56,087
AVG FAMILY INCOME
$49,317
AVG HOUSEHOLD INCOME
24.4%
WAGE / INCOME GAP [ % ]
75.6¢/ $1
WAGE / INCOME GAP [ $ ]
0.45
INEQUALITY / GINI INDEX
17,859
TOTAL POPULATION
9,822
MALE POPULATION
8,037
FEMALE POPULATION
122.21
MALES / 100 FEMALES
81.83
FEMALES / 100 MALES
38.0
MEDIAN AGE
3.0
AVG FAMILY SIZE
2.4
AVG HOUSEHOLD SIZE
6,669
LABOR FORCE [ PEOPLE ]
45.1%
PERCENT IN LABOR FORCE
4.3%
UNEMPLOYMENT RATE
Farmington Zip Codes
Farmington Area Codes
Income in Farmington
Income Overview in Farmington
Per Capita Income in Farmington is $24,281, while median incomes of families and households are $56,087 and $49,317 respectively.
| Characteristic | Number | Measure |
| Per Capita Income | 17,859 | $24,281 |
| Median Family Income | 3,789 | $56,087 |
| Mean Family Income | 3,789 | $76,302 |
| Median Household Income | 6,205 | $49,317 |
| Mean Household Income | 6,205 | $66,741 |
| Income Deficit | 3,789 | $0 |
| Wage / Income Gap (%) | 17,859 | 24.38% |
| Wage / Income Gap ($) | 17,859 | 75.62¢ per $1 |
| Gini / Inequality Index | 17,859 | 0.45 |
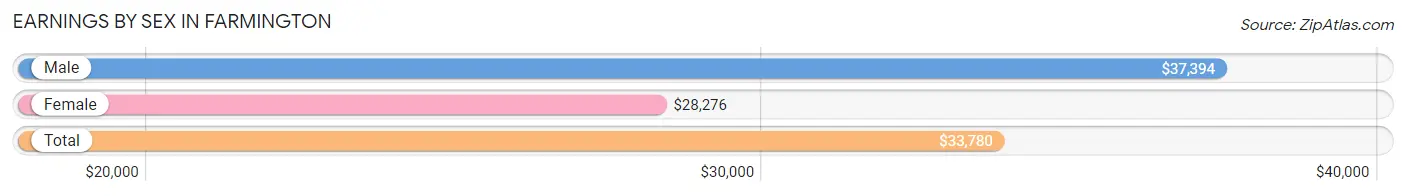
Earnings by Sex in Farmington
Average Earnings in Farmington are $33,780, $37,394 for men and $28,276 for women, a difference of 24.4%.
| Sex | Number | Average Earnings |
| Male | 4,123 (56.1%) | $37,394 |
| Female | 3,223 (43.9%) | $28,276 |
| Total | 7,346 (100.0%) | $33,780 |
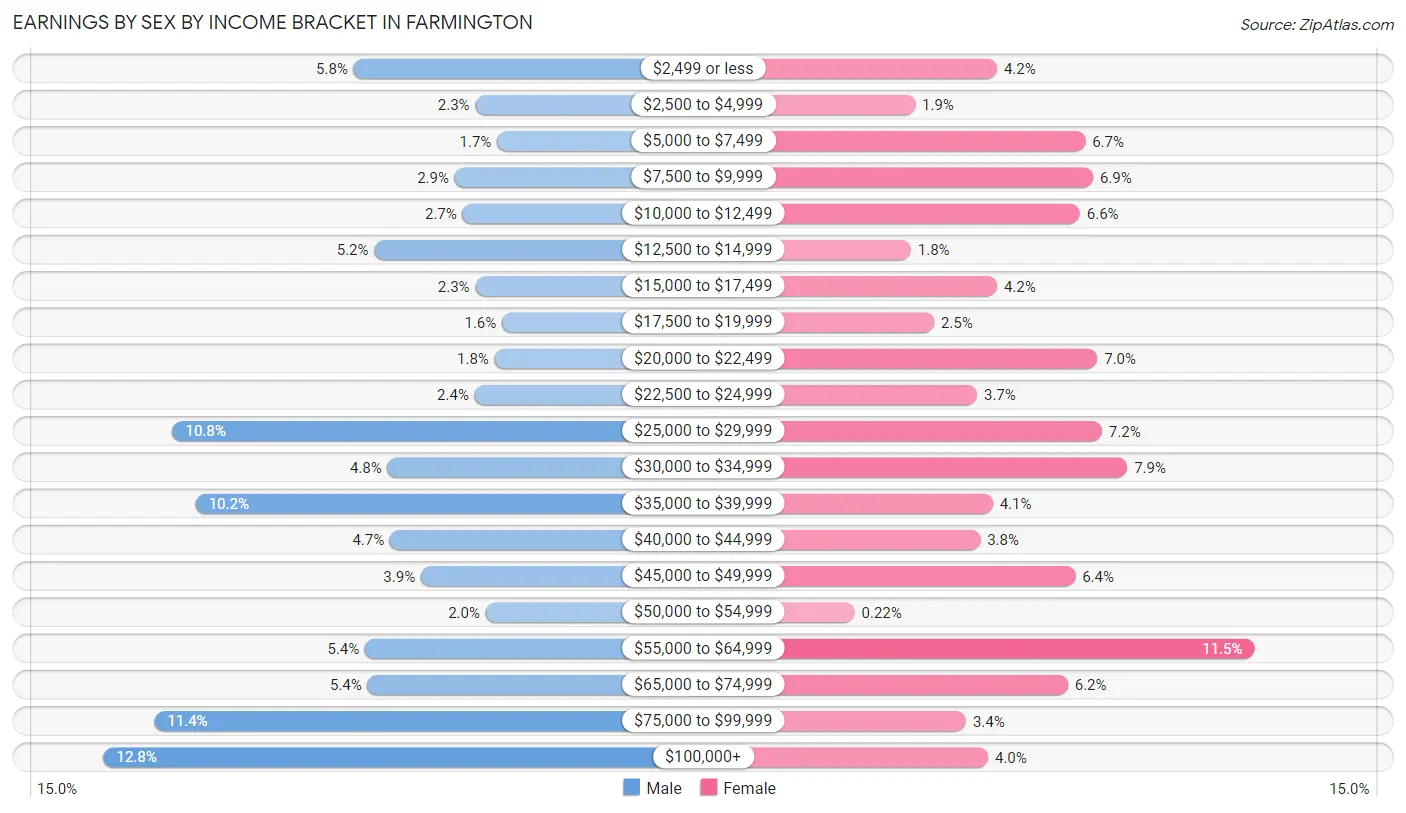
Earnings by Sex by Income Bracket in Farmington
The most common earnings brackets in Farmington are $100,000+ for men (527 | 12.8%) and $55,000 to $64,999 for women (369 | 11.5%).
| Income | Male | Female |
| $2,499 or less | 237 (5.8%) | 136 (4.2%) |
| $2,500 to $4,999 | 96 (2.3%) | 62 (1.9%) |
| $5,000 to $7,499 | 71 (1.7%) | 216 (6.7%) |
| $7,500 to $9,999 | 120 (2.9%) | 223 (6.9%) |
| $10,000 to $12,499 | 111 (2.7%) | 211 (6.6%) |
| $12,500 to $14,999 | 213 (5.2%) | 58 (1.8%) |
| $15,000 to $17,499 | 96 (2.3%) | 136 (4.2%) |
| $17,500 to $19,999 | 65 (1.6%) | 79 (2.5%) |
| $20,000 to $22,499 | 74 (1.8%) | 227 (7.0%) |
| $22,500 to $24,999 | 97 (2.4%) | 118 (3.7%) |
| $25,000 to $29,999 | 447 (10.8%) | 231 (7.2%) |
| $30,000 to $34,999 | 198 (4.8%) | 254 (7.9%) |
| $35,000 to $39,999 | 420 (10.2%) | 132 (4.1%) |
| $40,000 to $44,999 | 195 (4.7%) | 121 (3.7%) |
| $45,000 to $49,999 | 159 (3.9%) | 207 (6.4%) |
| $50,000 to $54,999 | 84 (2.0%) | 7 (0.2%) |
| $55,000 to $64,999 | 224 (5.4%) | 369 (11.5%) |
| $65,000 to $74,999 | 221 (5.4%) | 200 (6.2%) |
| $75,000 to $99,999 | 468 (11.4%) | 108 (3.4%) |
| $100,000+ | 527 (12.8%) | 128 (4.0%) |
| Total | 4,123 (100.0%) | 3,223 (100.0%) |
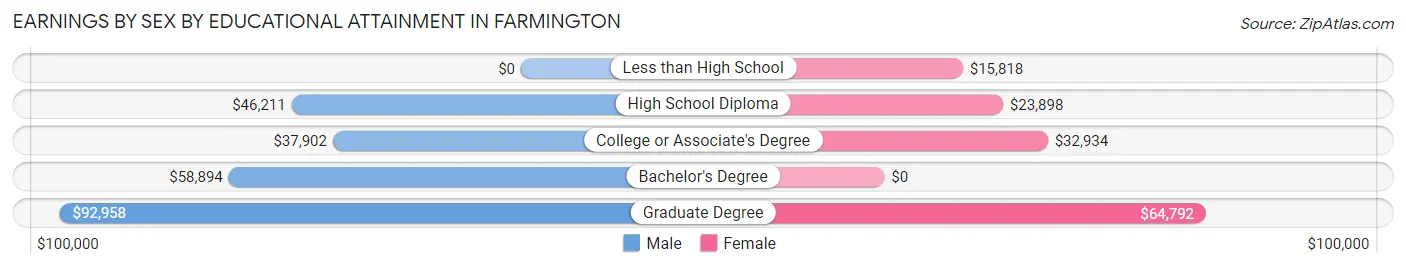
Earnings by Sex by Educational Attainment in Farmington
Average earnings in Farmington are $41,270 for men and $31,419 for women, a difference of 23.9%. Men with an educational attainment of graduate degree enjoy the highest average annual earnings of $92,958, while those with college or associate's degree education earn the least with $37,902. Women with an educational attainment of graduate degree earn the most with the average annual earnings of $64,792, while those with less than high school education have the smallest earnings of $15,818.
| Educational Attainment | Male Income | Female Income |
| Less than High School | - | - |
| High School Diploma | $46,211 | $23,898 |
| College or Associate's Degree | $37,902 | $32,934 |
| Bachelor's Degree | $58,894 | $0 |
| Graduate Degree | $92,958 | $64,792 |
| Total | $41,270 | $31,419 |
Family Income in Farmington
Family Income Brackets in Farmington
According to the Farmington family income data, there are 743 families falling into the $50,000 to $74,999 income range, which is the most common income bracket and makes up 19.6% of all families. Conversely, the $200,000+ income bracket is the least frequent group with only 148 families (3.9%) belonging to this category.
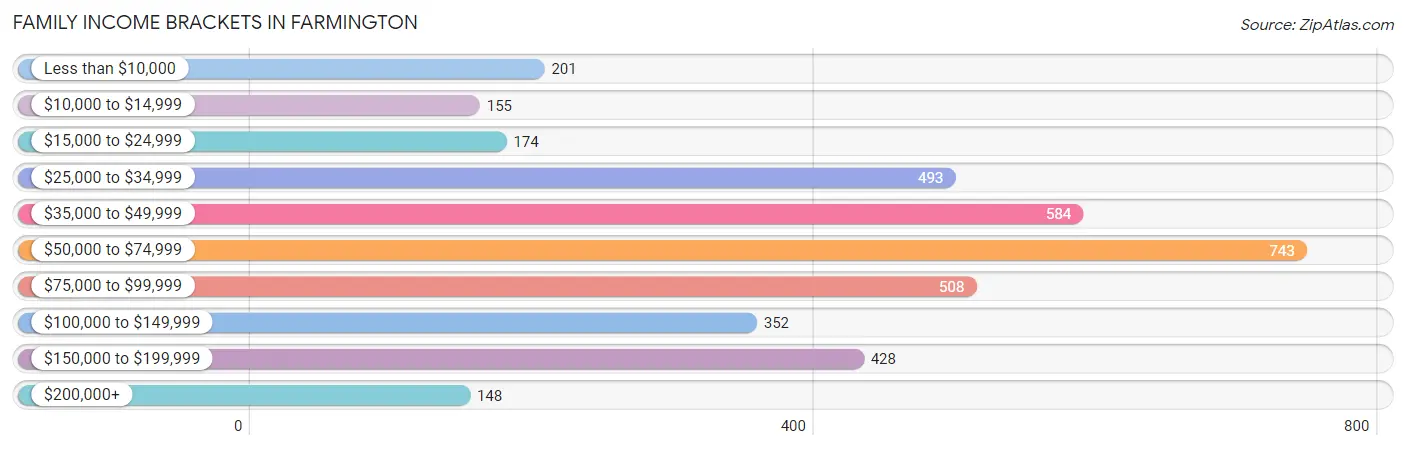
| Income Bracket | # Families | % Families |
| Less than $10,000 | 201 | 5.3% |
| $10,000 to $14,999 | 155 | 4.1% |
| $15,000 to $24,999 | 174 | 4.6% |
| $25,000 to $34,999 | 493 | 13.0% |
| $35,000 to $49,999 | 584 | 15.4% |
| $50,000 to $74,999 | 743 | 19.6% |
| $75,000 to $99,999 | 508 | 13.4% |
| $100,000 to $149,999 | 352 | 9.3% |
| $150,000 to $199,999 | 428 | 11.3% |
| $200,000+ | 148 | 3.9% |
Family Income by Famaliy Size in Farmington
6-person families (27 | 0.7%) account for the highest median family income in Farmington with $110,114 per family, while 2-person families (1,938 | 51.1%) have the highest median income of $29,107 per family member.
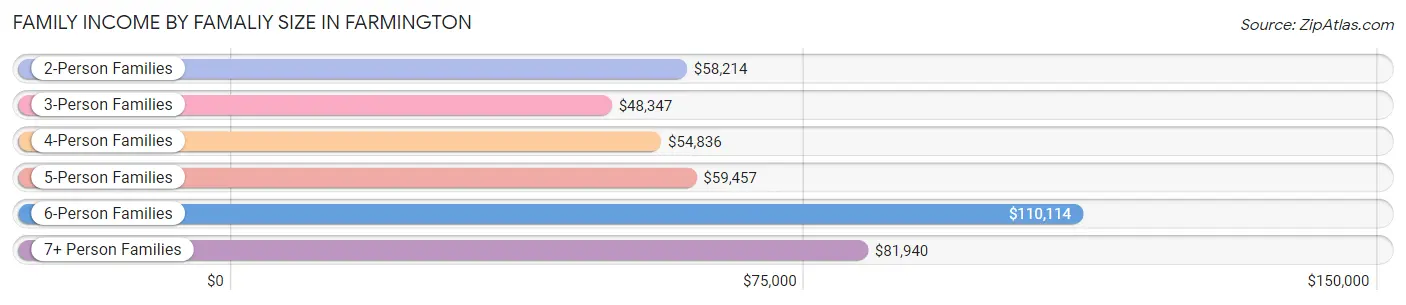
| Income Bracket | # Families | Median Income |
| 2-Person Families | 1,938 (51.1%) | $58,214 |
| 3-Person Families | 913 (24.1%) | $48,347 |
| 4-Person Families | 620 (16.4%) | $54,836 |
| 5-Person Families | 246 (6.5%) | $59,457 |
| 6-Person Families | 27 (0.7%) | $110,114 |
| 7+ Person Families | 45 (1.2%) | $81,940 |
| Total | 3,789 (100.0%) | $56,087 |
Family Income by Number of Earners in Farmington
The median family income in Farmington is $56,087, with families comprising 3+ earners (342) having the highest median family income of $173,441, while families with no earners (648) have the lowest median family income of $32,429, accounting for 9.0% and 17.1% of families, respectively.
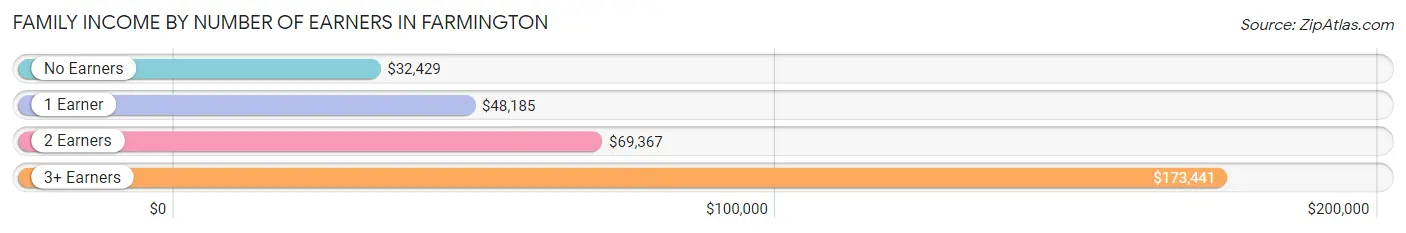
| Number of Earners | # Families | Median Income |
| No Earners | 648 (17.1%) | $32,429 |
| 1 Earner | 1,683 (44.4%) | $48,185 |
| 2 Earners | 1,116 (29.4%) | $69,367 |
| 3+ Earners | 342 (9.0%) | $173,441 |
| Total | 3,789 (100.0%) | $56,087 |
Household Income in Farmington
Household Income Brackets in Farmington
With 1,011 households falling in the category, the $50,000 to $74,999 income range is the most frequent in Farmington, accounting for 16.3% of all households. In contrast, only 180 households (2.9%) fall into the $200,000+ income bracket, making it the least populous group.
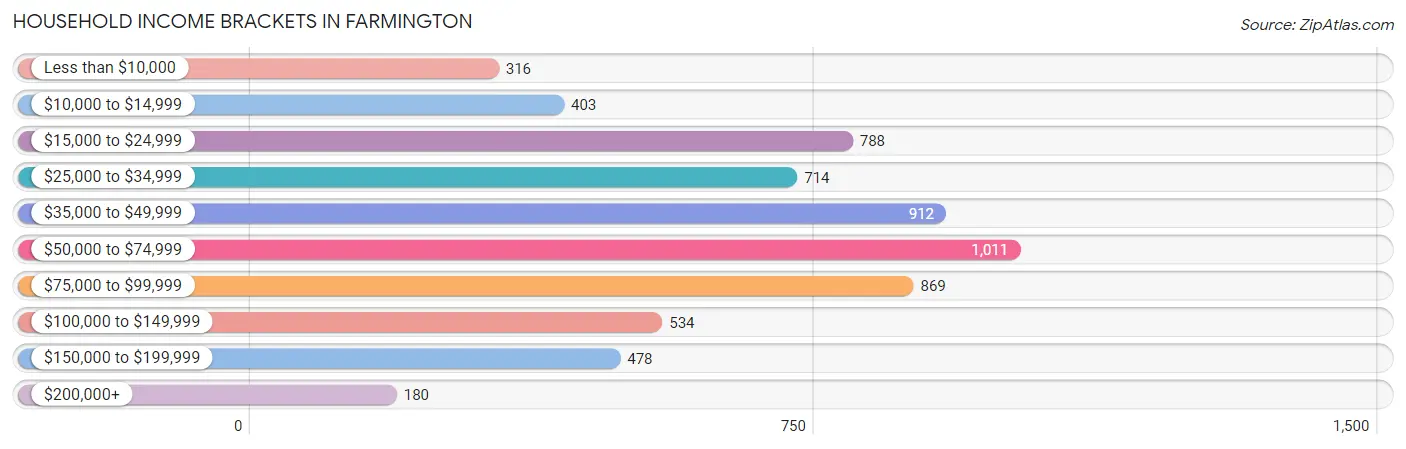
| Income Bracket | # Households | % Households |
| Less than $10,000 | 316 | 5.1% |
| $10,000 to $14,999 | 403 | 6.5% |
| $15,000 to $24,999 | 788 | 12.7% |
| $25,000 to $34,999 | 714 | 11.5% |
| $35,000 to $49,999 | 912 | 14.7% |
| $50,000 to $74,999 | 1,011 | 16.3% |
| $75,000 to $99,999 | 869 | 14.0% |
| $100,000 to $149,999 | 534 | 8.6% |
| $150,000 to $199,999 | 478 | 7.7% |
| $200,000+ | 180 | 2.9% |
Household Income by Householder Age in Farmington
The median household income in Farmington is $49,317, with the highest median household income of $59,509 found in the 25 to 44 years age bracket for the primary householder. A total of 1,995 households (32.2%) fall into this category. Meanwhile, the 65+ years age bracket for the primary householder has the lowest median household income of $33,618, with 1,940 households (31.3%) in this group.
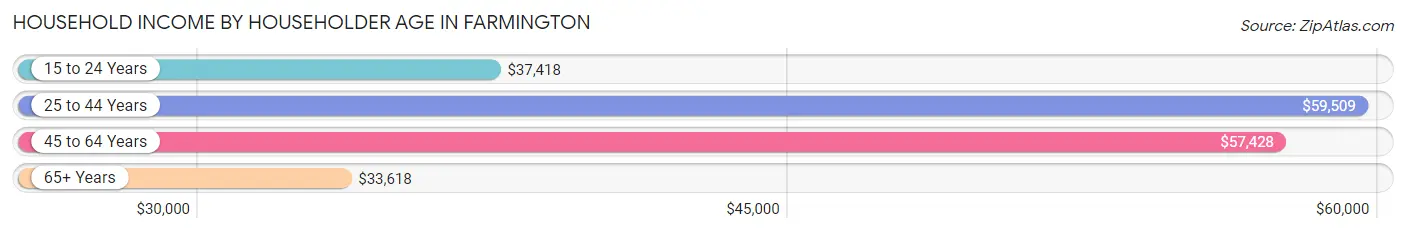
| Income Bracket | # Households | Median Income |
| 15 to 24 Years | 308 (5.0%) | $37,418 |
| 25 to 44 Years | 1,995 (32.2%) | $59,509 |
| 45 to 64 Years | 1,962 (31.6%) | $57,428 |
| 65+ Years | 1,940 (31.3%) | $33,618 |
| Total | 6,205 (100.0%) | $49,317 |
Poverty in Farmington
Income Below Poverty by Sex and Age in Farmington
With 15.9% poverty level for males and 18.2% for females among the residents of Farmington, 16 and 17 year old males and under 5 year old females are the most vulnerable to poverty, with 104 males (34.9%) and 177 females (46.1%) in their respective age groups living below the poverty level.
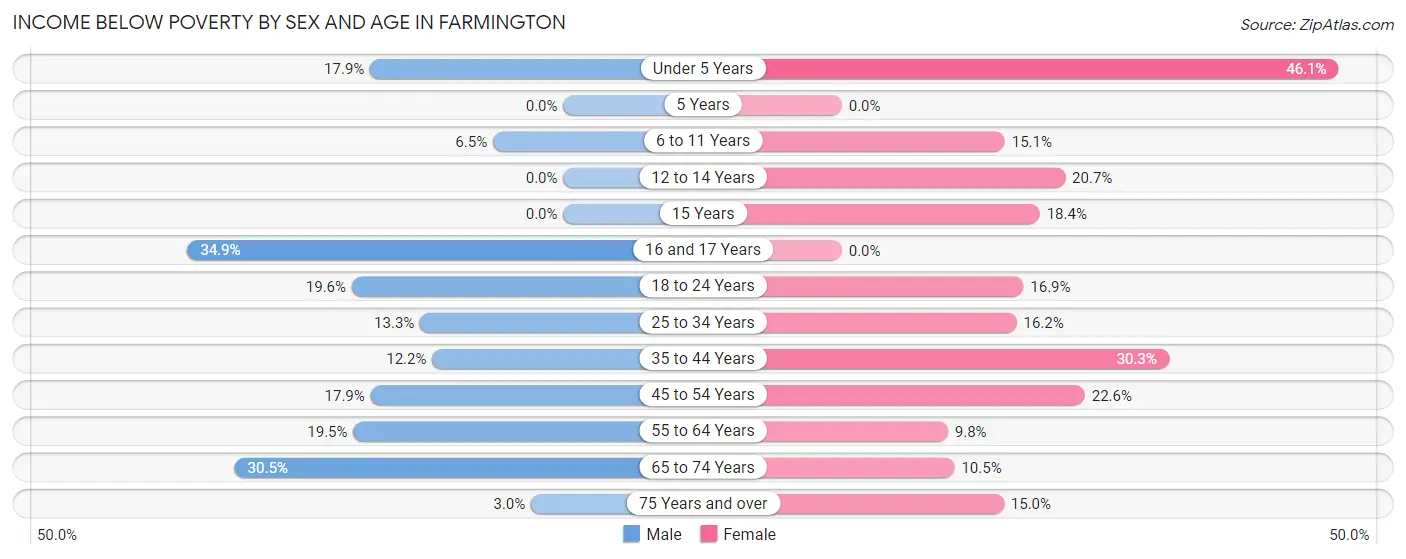
| Age Bracket | Male | Female |
| Under 5 Years | 83 (17.9%) | 177 (46.1%) |
| 5 Years | 0 (0.0%) | 0 (0.0%) |
| 6 to 11 Years | 25 (6.5%) | 108 (15.1%) |
| 12 to 14 Years | 0 (0.0%) | 80 (20.7%) |
| 15 Years | 0 (0.0%) | 9 (18.4%) |
| 16 and 17 Years | 104 (34.9%) | 0 (0.0%) |
| 18 to 24 Years | 106 (19.6%) | 78 (16.9%) |
| 25 to 34 Years | 154 (13.3%) | 176 (16.2%) |
| 35 to 44 Years | 122 (12.2%) | 291 (30.3%) |
| 45 to 54 Years | 158 (17.9%) | 184 (22.6%) |
| 55 to 64 Years | 161 (19.5%) | 75 (9.8%) |
| 65 to 74 Years | 183 (30.5%) | 98 (10.5%) |
| 75 Years and over | 12 (3.0%) | 119 (15.0%) |
| Total | 1,108 (15.9%) | 1,395 (18.2%) |
Income Above Poverty by Sex and Age in Farmington
According to the poverty statistics in Farmington, males aged 5 years and females aged 5 years are the age groups that are most secure financially, with 100.0% of males and 100.0% of females in these age groups living above the poverty line.
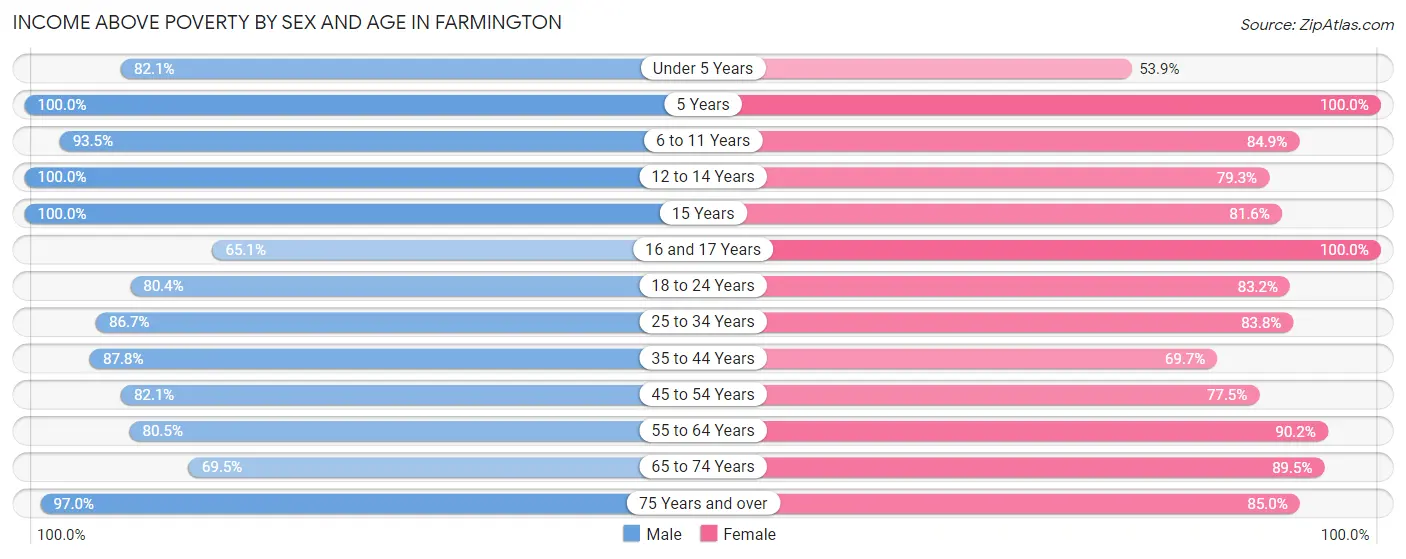
| Age Bracket | Male | Female |
| Under 5 Years | 380 (82.1%) | 207 (53.9%) |
| 5 Years | 19 (100.0%) | 93 (100.0%) |
| 6 to 11 Years | 358 (93.5%) | 606 (84.9%) |
| 12 to 14 Years | 347 (100.0%) | 306 (79.3%) |
| 15 Years | 65 (100.0%) | 40 (81.6%) |
| 16 and 17 Years | 194 (65.1%) | 209 (100.0%) |
| 18 to 24 Years | 434 (80.4%) | 385 (83.2%) |
| 25 to 34 Years | 1,005 (86.7%) | 909 (83.8%) |
| 35 to 44 Years | 881 (87.8%) | 668 (69.7%) |
| 45 to 54 Years | 725 (82.1%) | 632 (77.4%) |
| 55 to 64 Years | 665 (80.5%) | 687 (90.2%) |
| 65 to 74 Years | 417 (69.5%) | 839 (89.5%) |
| 75 Years and over | 390 (97.0%) | 672 (85.0%) |
| Total | 5,880 (84.1%) | 6,253 (81.8%) |
Income Below Poverty Among Married-Couple Families in Farmington
The poverty statistics for married-couple families in Farmington show that 11.3% or 276 of the total 2,442 families live below the poverty line. Families with no children have the highest poverty rate of 16.0%, comprising of 253 families. On the other hand, families with 1 or 2 children have the lowest poverty rate of 1.5%, which includes 10 families.
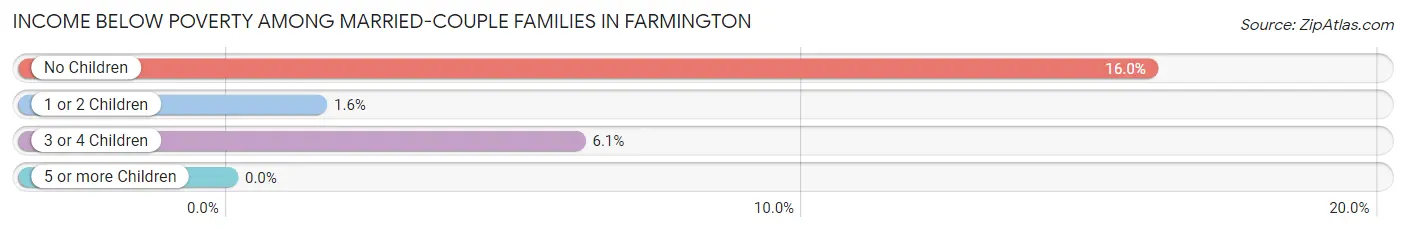
| Children | Above Poverty | Below Poverty |
| No Children | 1,327 (84.0%) | 253 (16.0%) |
| 1 or 2 Children | 637 (98.5%) | 10 (1.5%) |
| 3 or 4 Children | 202 (94.0%) | 13 (6.0%) |
| 5 or more Children | 0 (0.0%) | 0 (0.0%) |
| Total | 2,166 (88.7%) | 276 (11.3%) |
Income Below Poverty Among Single-Parent Households in Farmington
According to the poverty data in Farmington, 5.9% or 22 single-father households and 20.8% or 202 single-mother households are living below the poverty line. Among single-father households, those with 1 or 2 children have the highest poverty rate, with 22 households (10.3%) experiencing poverty. Likewise, among single-mother households, those with 3 or 4 children have the highest poverty rate, with 56 households (67.5%) falling below the poverty line.
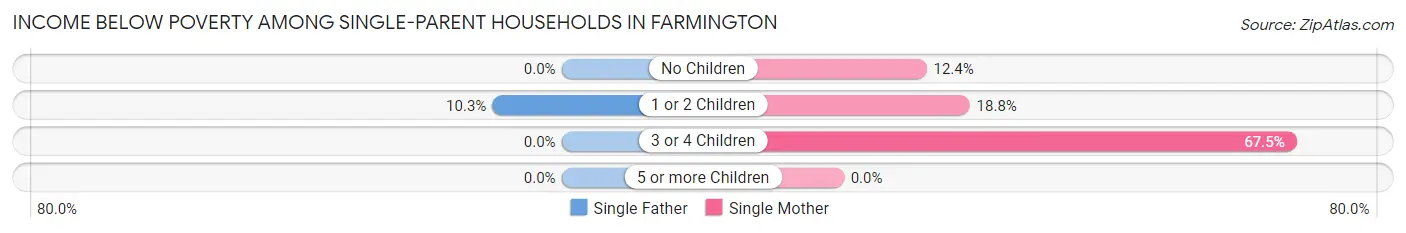
| Children | Single Father | Single Mother |
| No Children | 0 (0.0%) | 30 (12.3%) |
| 1 or 2 Children | 22 (10.3%) | 116 (18.8%) |
| 3 or 4 Children | 0 (0.0%) | 56 (67.5%) |
| 5 or more Children | 0 (0.0%) | 0 (0.0%) |
| Total | 22 (5.9%) | 202 (20.8%) |
Income Below Poverty Among Married-Couple vs Single-Parent Households in Farmington
The poverty data for Farmington shows that 276 of the married-couple family households (11.3%) and 224 of the single-parent households (16.6%) are living below the poverty level. Within the married-couple family households, those with no children have the highest poverty rate, with 253 households (16.0%) falling below the poverty line. Among the single-parent households, those with 3 or 4 children have the highest poverty rate, with 56 household (67.5%) living below poverty.
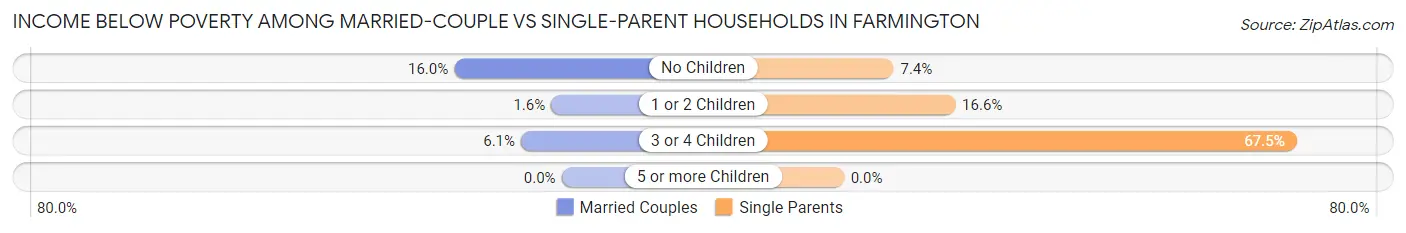
| Children | Married-Couple Families | Single-Parent Households |
| No Children | 253 (16.0%) | 30 (7.4%) |
| 1 or 2 Children | 10 (1.5%) | 138 (16.6%) |
| 3 or 4 Children | 13 (6.0%) | 56 (67.5%) |
| 5 or more Children | 0 (0.0%) | 0 (0.0%) |
| Total | 276 (11.3%) | 224 (16.6%) |
Race in Farmington
The most populous races in Farmington are White / Caucasian (15,908 | 89.1%), Black / African American (1,040 | 5.8%), and Hispanic or Latino (564 | 3.2%).
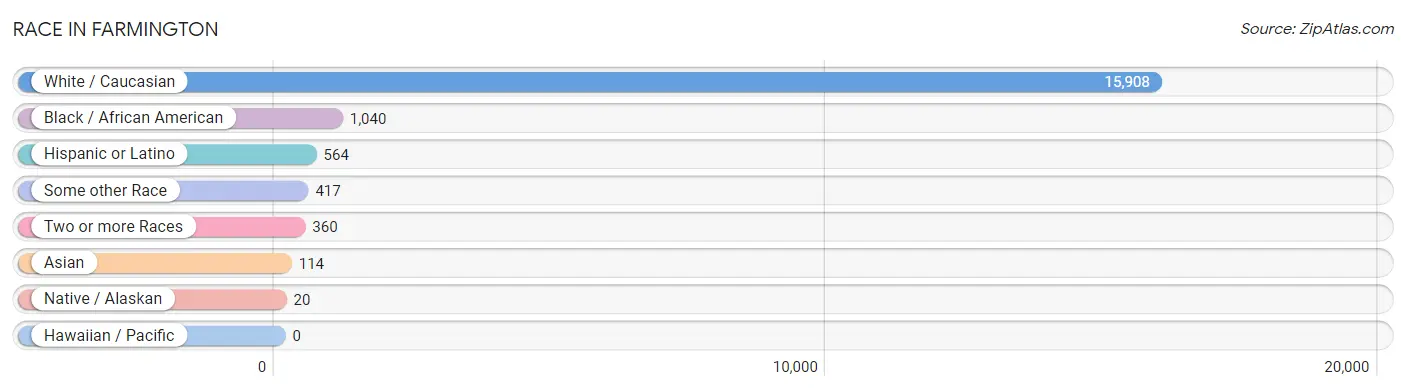
| Race | # Population | % Population |
| Asian | 114 | 0.6% |
| Black / African American | 1,040 | 5.8% |
| Hawaiian / Pacific | 0 | 0.0% |
| Hispanic or Latino | 564 | 3.2% |
| Native / Alaskan | 20 | 0.1% |
| White / Caucasian | 15,908 | 89.1% |
| Two or more Races | 360 | 2.0% |
| Some other Race | 417 | 2.3% |
| Total | 17,859 | 100.0% |
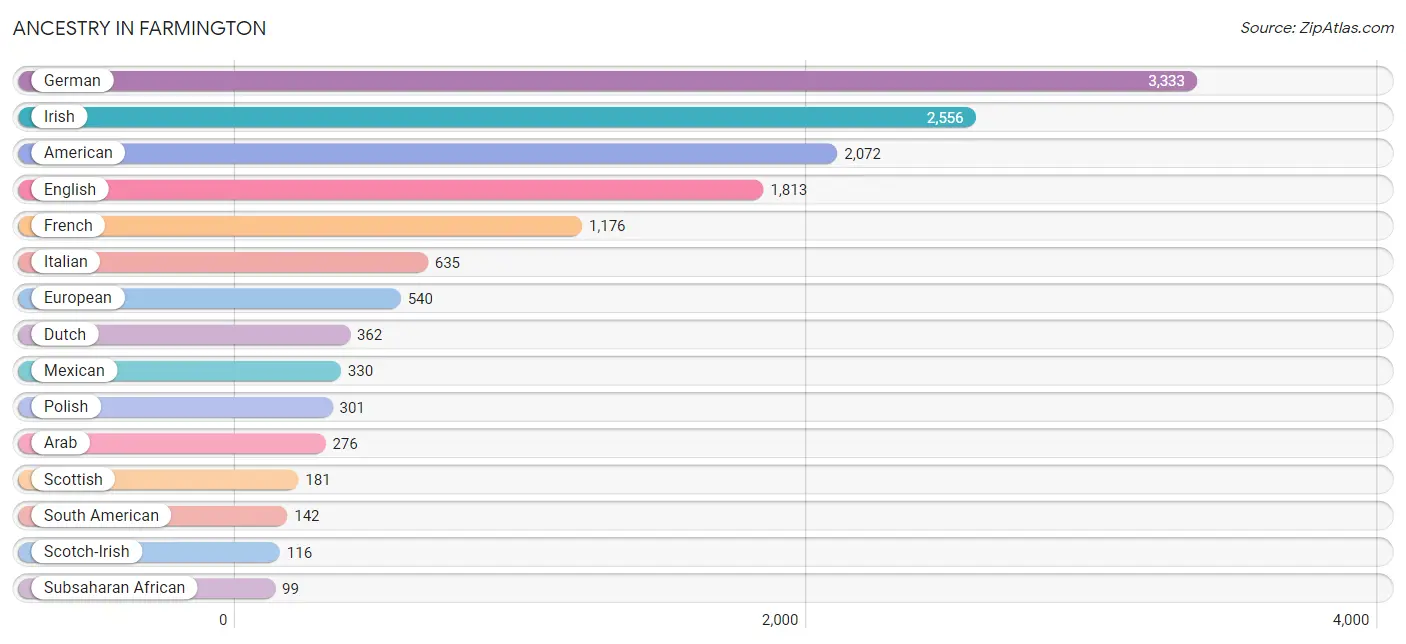
Ancestry in Farmington
The most populous ancestries reported in Farmington are German (3,333 | 18.7%), Irish (2,556 | 14.3%), American (2,072 | 11.6%), English (1,813 | 10.2%), and French (1,176 | 6.6%), together accounting for 61.3% of all Farmington residents.
| Ancestry | # Population | % Population |
| African | 95 | 0.5% |
| American | 2,072 | 11.6% |
| Apache | 11 | 0.1% |
| Arab | 276 | 1.5% |
| Argentinean | 72 | 0.4% |
| Austrian | 12 | 0.1% |
| Bhutanese | 50 | 0.3% |
| British | 17 | 0.1% |
| Burmese | 8 | 0.0% |
| Celtic | 16 | 0.1% |
| Central American | 25 | 0.1% |
| Cherokee | 57 | 0.3% |
| Choctaw | 3 | 0.0% |
| Colombian | 70 | 0.4% |
| Comanche | 4 | 0.0% |
| Creek | 3 | 0.0% |
| Czech | 44 | 0.3% |
| Czechoslovakian | 17 | 0.1% |
| Danish | 29 | 0.2% |
| Dutch | 362 | 2.0% |
| Dutch West Indian | 10 | 0.1% |
| English | 1,813 | 10.2% |
| European | 540 | 3.0% |
| Finnish | 7 | 0.0% |
| French | 1,176 | 6.6% |
| French American Indian | 22 | 0.1% |
| French Canadian | 15 | 0.1% |
| German | 3,333 | 18.7% |
| Greek | 8 | 0.0% |
| Irish | 2,556 | 14.3% |
| Iroquois | 9 | 0.1% |
| Italian | 635 | 3.6% |
| Jordanian | 20 | 0.1% |
| Korean | 36 | 0.2% |
| Mexican | 330 | 1.8% |
| Navajo | 1 | 0.0% |
| Northern European | 15 | 0.1% |
| Norwegian | 62 | 0.4% |
| Pakistani | 24 | 0.1% |
| Polish | 301 | 1.7% |
| Puerto Rican | 16 | 0.1% |
| Romanian | 7 | 0.0% |
| Russian | 54 | 0.3% |
| Salvadoran | 25 | 0.1% |
| Scandinavian | 7 | 0.0% |
| Scotch-Irish | 116 | 0.6% |
| Scottish | 181 | 1.0% |
| Sioux | 12 | 0.1% |
| Slovak | 6 | 0.0% |
| Somali | 4 | 0.0% |
| South American | 142 | 0.8% |
| Subsaharan African | 99 | 0.5% |
| Swedish | 10 | 0.1% |
| Welsh | 9 | 0.1% | View All 54 Rows |
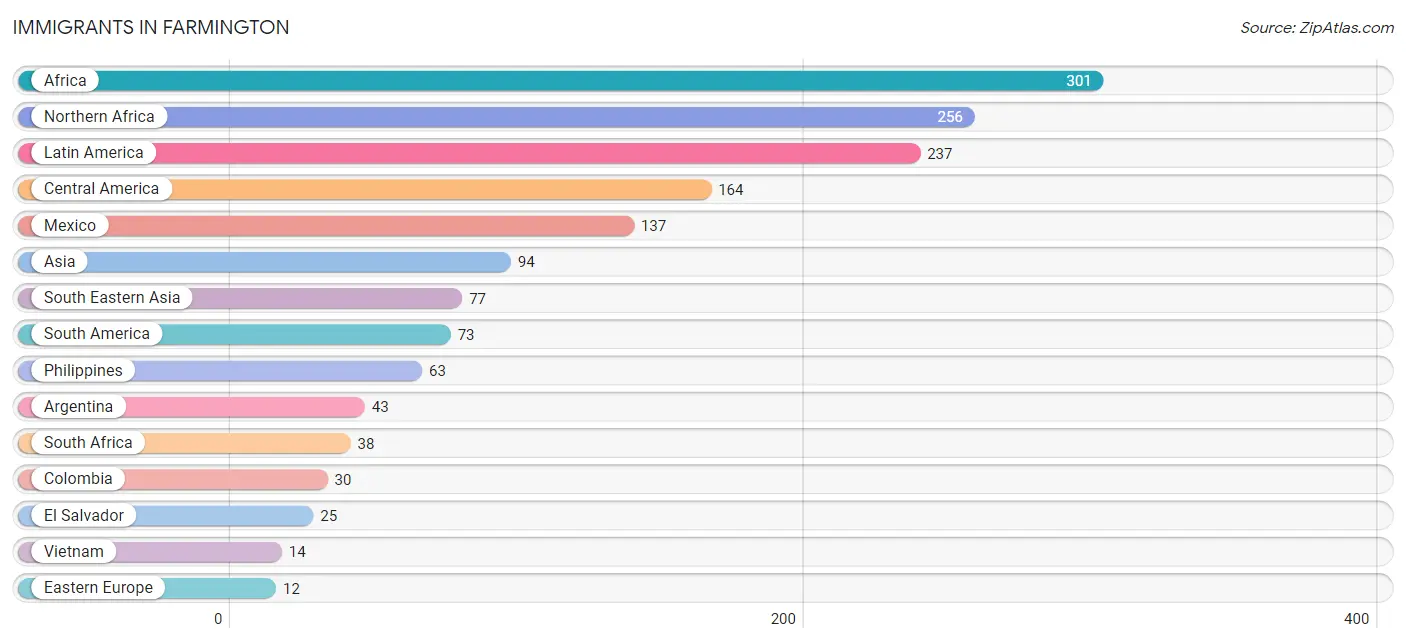
Immigrants in Farmington
The most numerous immigrant groups reported in Farmington came from Africa (301 | 1.7%), Northern Africa (256 | 1.4%), Latin America (237 | 1.3%), Central America (164 | 0.9%), and Mexico (137 | 0.8%), together accounting for 6.1% of all Farmington residents.
| Immigration Origin | # Population | % Population |
| Africa | 301 | 1.7% |
| Argentina | 43 | 0.2% |
| Asia | 94 | 0.5% |
| Central America | 164 | 0.9% |
| Colombia | 30 | 0.2% |
| Eastern Africa | 7 | 0.0% |
| Eastern Asia | 8 | 0.0% |
| Eastern Europe | 12 | 0.1% |
| El Salvador | 25 | 0.1% |
| Europe | 12 | 0.1% |
| Guatemala | 2 | 0.0% |
| Iraq | 3 | 0.0% |
| Kenya | 7 | 0.0% |
| Korea | 8 | 0.0% |
| Latin America | 237 | 1.3% |
| Mexico | 137 | 0.8% |
| Northern Africa | 256 | 1.4% |
| Pakistan | 6 | 0.0% |
| Philippines | 63 | 0.4% |
| Romania | 7 | 0.0% |
| Russia | 5 | 0.0% |
| South Africa | 38 | 0.2% |
| South America | 73 | 0.4% |
| South Central Asia | 6 | 0.0% |
| South Eastern Asia | 77 | 0.4% |
| Vietnam | 14 | 0.1% |
| Western Asia | 3 | 0.0% | View All 27 Rows |
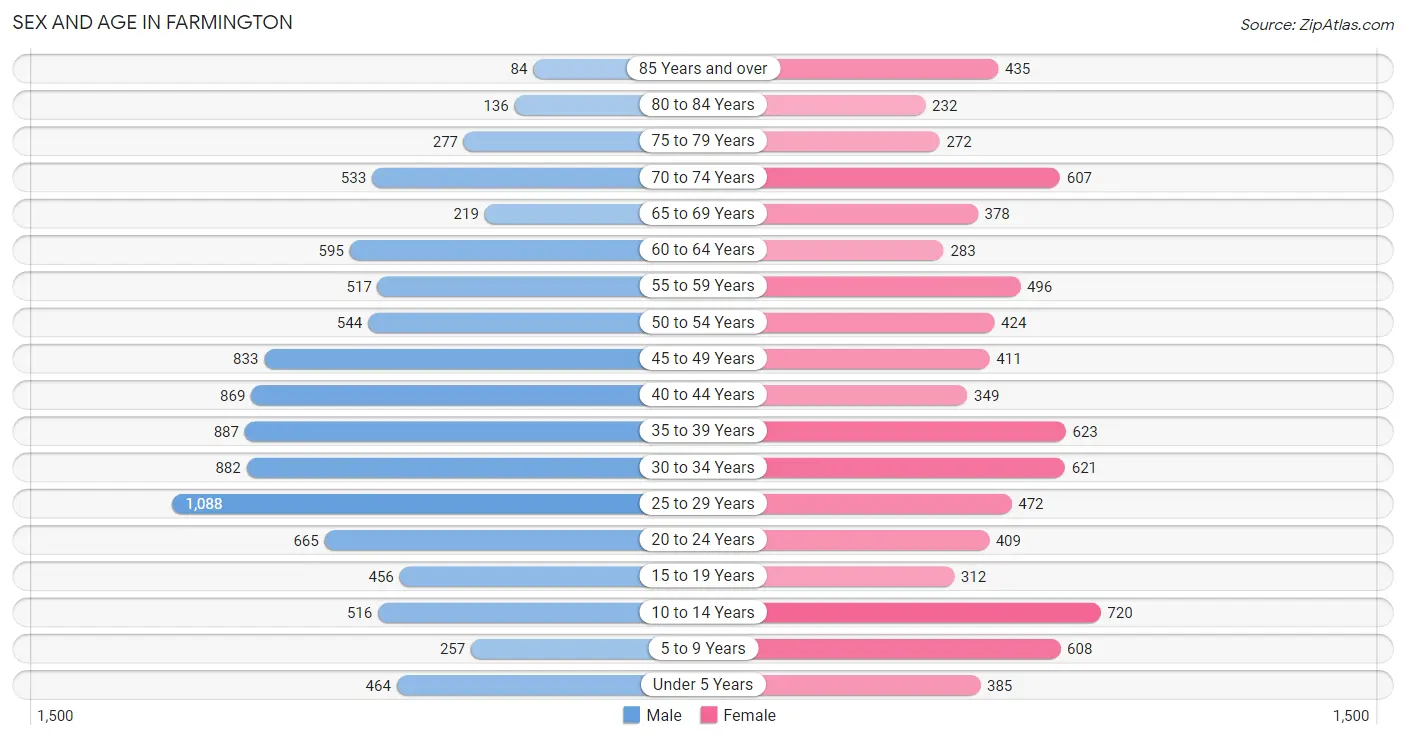
Sex and Age in Farmington
Sex and Age in Farmington
The most populous age groups in Farmington are 25 to 29 Years (1,088 | 11.1%) for men and 10 to 14 Years (720 | 9.0%) for women.
| Age Bracket | Male | Female |
| Under 5 Years | 464 (4.7%) | 385 (4.8%) |
| 5 to 9 Years | 257 (2.6%) | 608 (7.6%) |
| 10 to 14 Years | 516 (5.2%) | 720 (9.0%) |
| 15 to 19 Years | 456 (4.6%) | 312 (3.9%) |
| 20 to 24 Years | 665 (6.8%) | 409 (5.1%) |
| 25 to 29 Years | 1,088 (11.1%) | 472 (5.9%) |
| 30 to 34 Years | 882 (9.0%) | 621 (7.7%) |
| 35 to 39 Years | 887 (9.0%) | 623 (7.7%) |
| 40 to 44 Years | 869 (8.8%) | 349 (4.3%) |
| 45 to 49 Years | 833 (8.5%) | 411 (5.1%) |
| 50 to 54 Years | 544 (5.5%) | 424 (5.3%) |
| 55 to 59 Years | 517 (5.3%) | 496 (6.2%) |
| 60 to 64 Years | 595 (6.1%) | 283 (3.5%) |
| 65 to 69 Years | 219 (2.2%) | 378 (4.7%) |
| 70 to 74 Years | 533 (5.4%) | 607 (7.5%) |
| 75 to 79 Years | 277 (2.8%) | 272 (3.4%) |
| 80 to 84 Years | 136 (1.4%) | 232 (2.9%) |
| 85 Years and over | 84 (0.9%) | 435 (5.4%) |
| Total | 9,822 (100.0%) | 8,037 (100.0%) |
Families and Households in Farmington
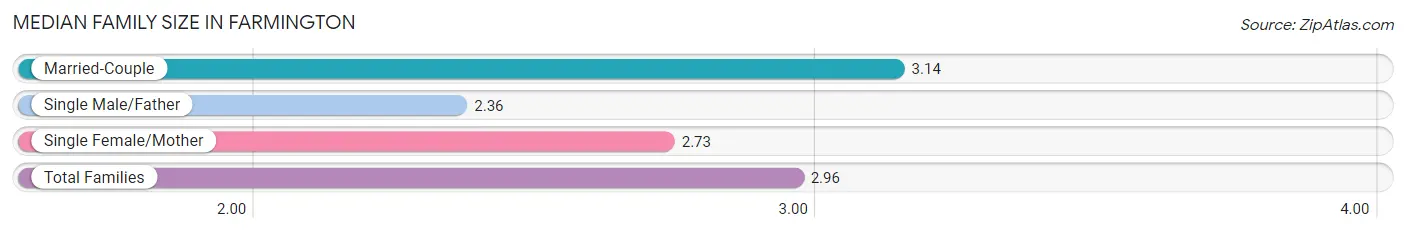
Median Family Size in Farmington
The median family size in Farmington is 2.96 persons per family, with married-couple families (2,442 | 64.4%) accounting for the largest median family size of 3.14 persons per family. On the other hand, single male/father families (374 | 9.9%) represent the smallest median family size with 2.36 persons per family.
| Family Type | # Families | Family Size |
| Married-Couple | 2,442 (64.4%) | 3.14 |
| Single Male/Father | 374 (9.9%) | 2.36 |
| Single Female/Mother | 973 (25.7%) | 2.73 |
| Total Families | 3,789 (100.0%) | 2.96 |
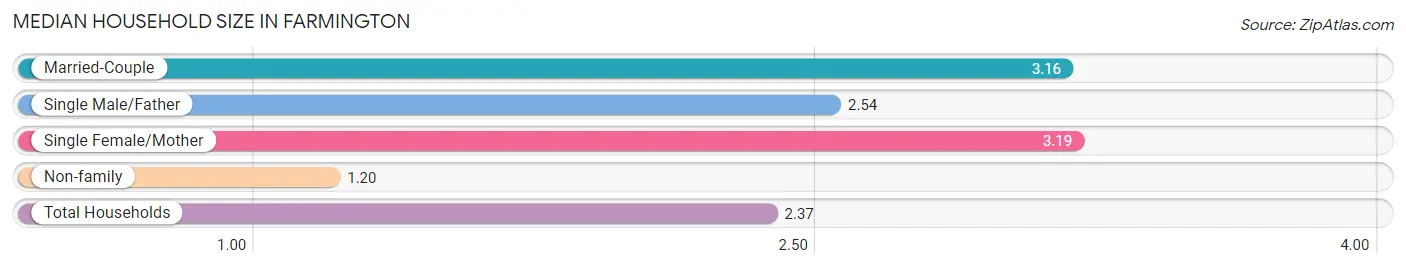
Median Household Size in Farmington
The median household size in Farmington is 2.37 persons per household, with single female/mother households (973 | 15.7%) accounting for the largest median household size of 3.19 persons per household. non-family households (2,416 | 38.9%) represent the smallest median household size with 1.20 persons per household.
| Household Type | # Households | Household Size |
| Married-Couple | 2,442 (39.4%) | 3.16 |
| Single Male/Father | 374 (6.0%) | 2.54 |
| Single Female/Mother | 973 (15.7%) | 3.19 |
| Non-family | 2,416 (38.9%) | 1.20 |
| Total Households | 6,205 (100.0%) | 2.37 |
Household Size by Marriage Status in Farmington
Out of a total of 6,205 households in Farmington, 3,789 (61.1%) are family households, while 2,416 (38.9%) are nonfamily households. The most numerous type of family households are 2-person households, comprising 1,662, and the most common type of nonfamily households are 1-person households, comprising 1,928.
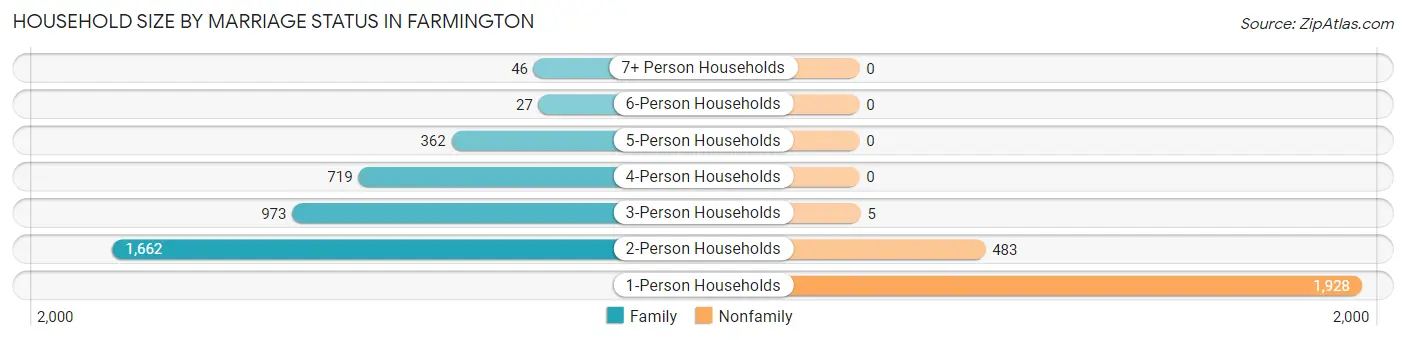
| Household Size | Family Households | Nonfamily Households |
| 1-Person Households | - | 1,928 (31.1%) |
| 2-Person Households | 1,662 (26.8%) | 483 (7.8%) |
| 3-Person Households | 973 (15.7%) | 5 (0.1%) |
| 4-Person Households | 719 (11.6%) | 0 (0.0%) |
| 5-Person Households | 362 (5.8%) | 0 (0.0%) |
| 6-Person Households | 27 (0.4%) | 0 (0.0%) |
| 7+ Person Households | 46 (0.7%) | 0 (0.0%) |
| Total | 3,789 (61.1%) | 2,416 (38.9%) |
Female Fertility in Farmington
Fertility by Age in Farmington
Average fertility rate in Farmington is 29.0 births per 1,000 women. Women in the age bracket of 20 to 34 years have the highest fertility rate with 44.0 births per 1,000 women. Women in the age bracket of 20 to 34 years acount for 67.3% of all women with births.
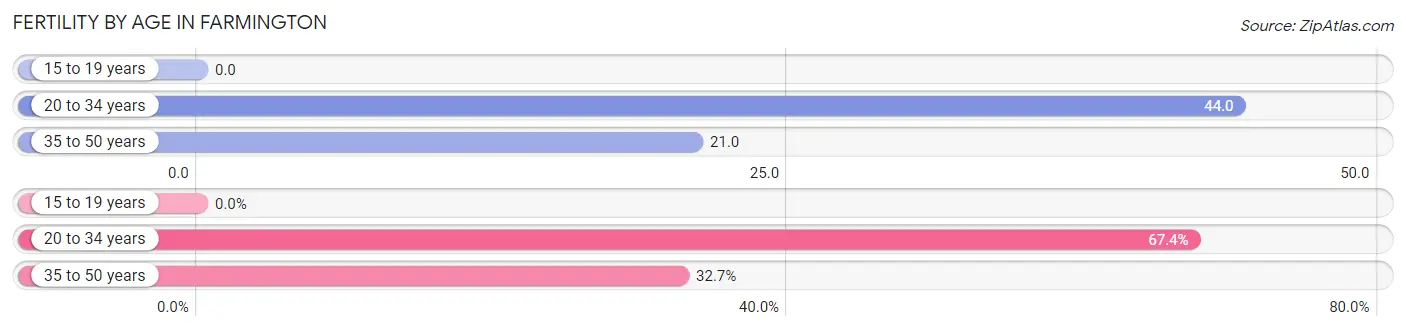
| Age Bracket | Women with Births | Births / 1,000 Women |
| 15 to 19 years | 0 (0.0%) | 0.0 |
| 20 to 34 years | 66 (67.3%) | 44.0 |
| 35 to 50 years | 32 (32.7%) | 21.0 |
| Total | 98 (100.0%) | 29.0 |
Fertility by Age by Marriage Status in Farmington
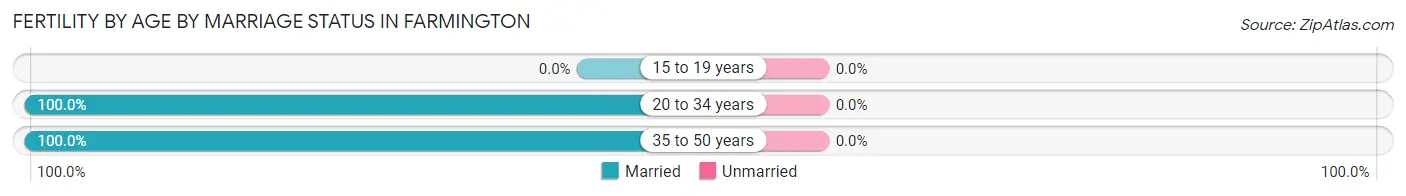
| Age Bracket | Married | Unmarried |
| 15 to 19 years | 0 (0.0%) | 0 (0.0%) |
| 20 to 34 years | 66 (100.0%) | 0 (0.0%) |
| 35 to 50 years | 32 (100.0%) | 0 (0.0%) |
| Total | 98 (100.0%) | 0 (0.0%) |
Fertility by Education in Farmington
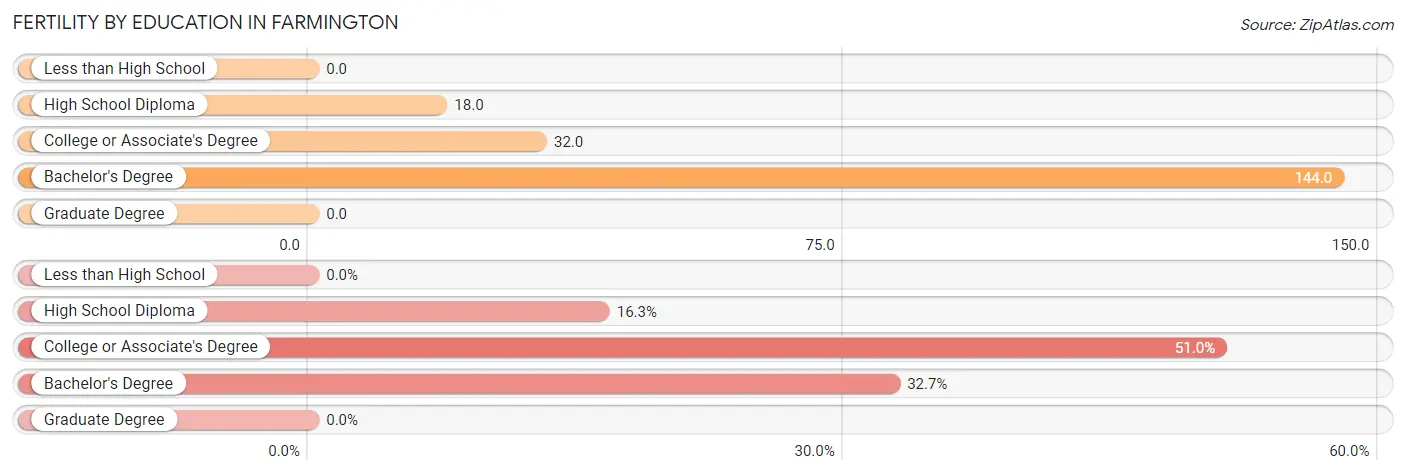
| Educational Attainment | Women with Births | Births / 1,000 Women |
| Less than High School | 0 (0.0%) | 0.0 |
| High School Diploma | 16 (16.3%) | 18.0 |
| College or Associate's Degree | 50 (51.0%) | 32.0 |
| Bachelor's Degree | 32 (32.7%) | 144.0 |
| Graduate Degree | 0 (0.0%) | 0.0 |
| Total | 98 (100.0%) | 29.0 |
Fertility by Education by Marriage Status in Farmington
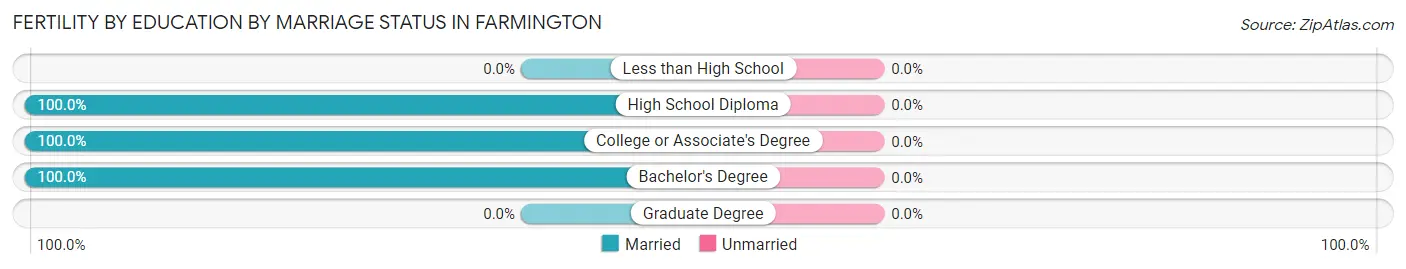
| Educational Attainment | Married | Unmarried |
| Less than High School | 0 (0.0%) | 0 (0.0%) |
| High School Diploma | 16 (100.0%) | 0 (0.0%) |
| College or Associate's Degree | 50 (100.0%) | 0 (0.0%) |
| Bachelor's Degree | 32 (100.0%) | 0 (0.0%) |
| Graduate Degree | 0 (0.0%) | 0 (0.0%) |
| Total | 98 (100.0%) | 0 (0.0%) |
Employment Characteristics in Farmington
Employment by Class of Employer in Farmington
Among the 6,219 employed individuals in Farmington, private company employees (4,016 | 64.6%), state government employees (642 | 10.3%), and local government employees (573 | 9.2%) make up the most common classes of employment.
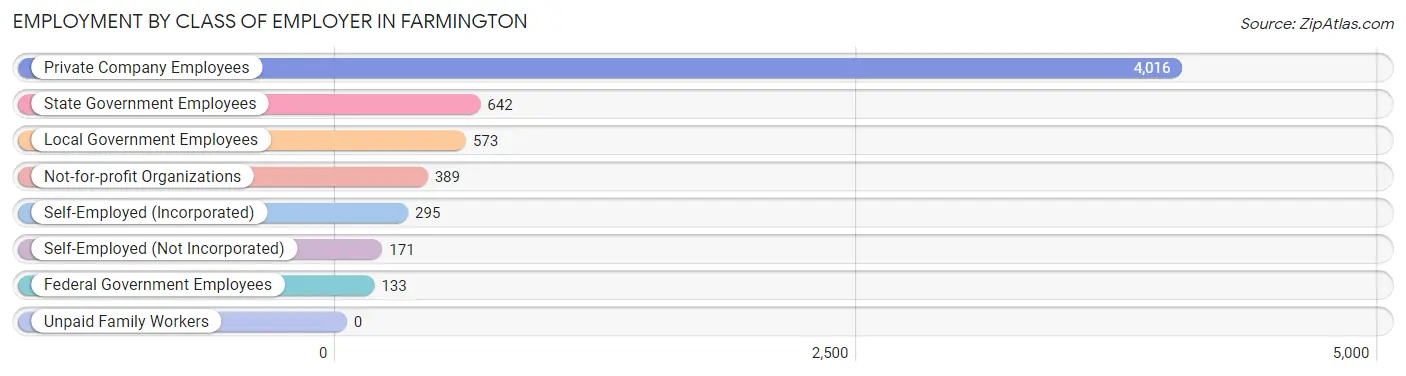
| Employer Class | # Employees | % Employees |
| Private Company Employees | 4,016 | 64.6% |
| Self-Employed (Incorporated) | 295 | 4.7% |
| Self-Employed (Not Incorporated) | 171 | 2.8% |
| Not-for-profit Organizations | 389 | 6.3% |
| Local Government Employees | 573 | 9.2% |
| State Government Employees | 642 | 10.3% |
| Federal Government Employees | 133 | 2.1% |
| Unpaid Family Workers | 0 | 0.0% |
| Total | 6,219 | 100.0% |
Employment Status by Age in Farmington
According to the labor force statistics for Farmington, out of the total population over 16 years of age (14,787), 45.1% or 6,669 individuals are in the labor force, with 4.3% or 287 of them unemployed. The age group with the highest labor force participation rate is 20 to 24 years, with 72.9% or 783 individuals in the labor force. Within the labor force, the 16 to 19 years age range has the highest percentage of unemployed individuals, with 15.6% or 33 of them being unemployed.
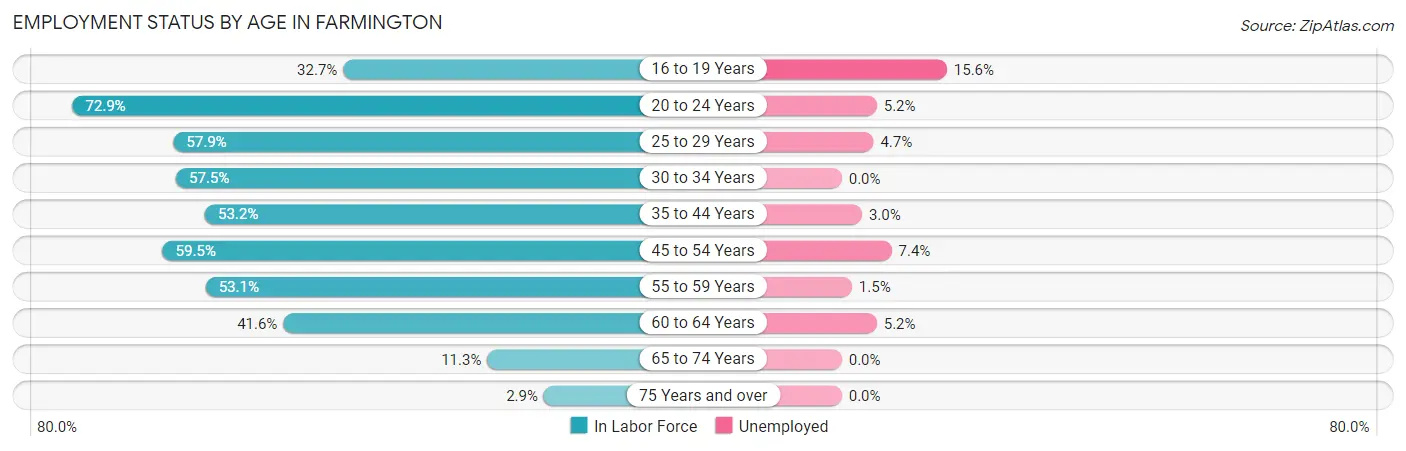
| Age Bracket | In Labor Force | Unemployed |
| 16 to 19 Years | 211 (32.7%) | 33 (15.6%) |
| 20 to 24 Years | 783 (72.9%) | 41 (5.2%) |
| 25 to 29 Years | 903 (57.9%) | 42 (4.7%) |
| 30 to 34 Years | 864 (57.5%) | 0 (0.0%) |
| 35 to 44 Years | 1,451 (53.2%) | 44 (3.0%) |
| 45 to 54 Years | 1,316 (59.5%) | 97 (7.4%) |
| 55 to 59 Years | 538 (53.1%) | 8 (1.5%) |
| 60 to 64 Years | 365 (41.6%) | 19 (5.2%) |
| 65 to 74 Years | 196 (11.3%) | 0 (0.0%) |
| 75 Years and over | 42 (2.9%) | 0 (0.0%) |
| Total | 6,669 (45.1%) | 287 (4.3%) |
Employment Status by Educational Attainment in Farmington
According to labor force statistics for Farmington, 54.9% of individuals (5,432) out of the total population between 25 and 64 years of age (9,894) are in the labor force, with 3.9% or 212 of them being unemployed. The group with the highest labor force participation rate are those with the educational attainment of bachelor's degree or higher, with 84.8% or 1,177 individuals in the labor force. Within the labor force, individuals with less than high school education have the highest percentage of unemployment, with 16.7% or 46 of them being unemployed.
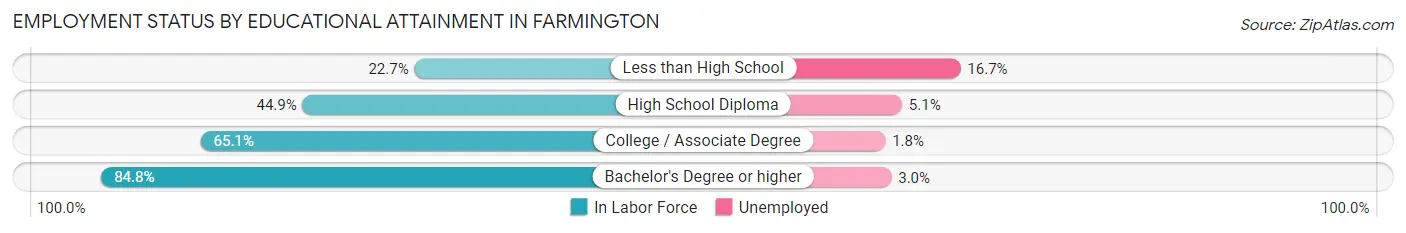
| Educational Attainment | In Labor Force | Unemployed |
| Less than High School | 276 (22.7%) | 203 (16.7%) |
| High School Diploma | 1,693 (44.9%) | 192 (5.1%) |
| College / Associate Degree | 2,290 (65.1%) | 63 (1.8%) |
| Bachelor's Degree or higher | 1,177 (84.8%) | 42 (3.0%) |
| Total | 5,432 (54.9%) | 386 (3.9%) |
Employment Occupations by Sex in Farmington
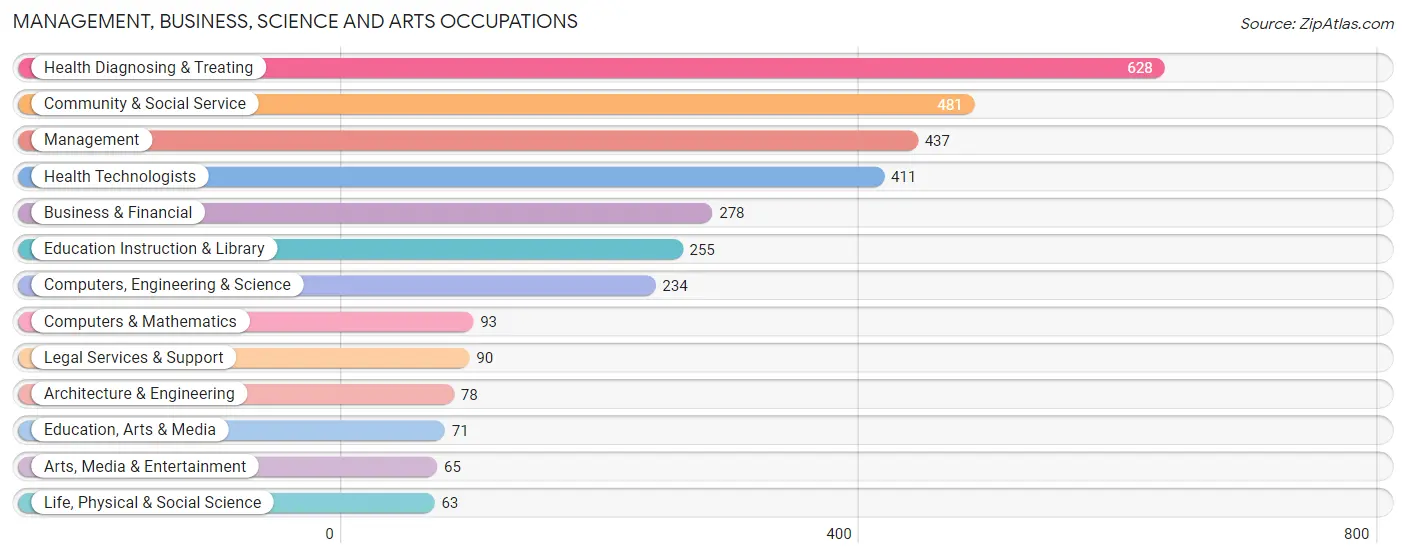
Management, Business, Science and Arts Occupations
The most common Management, Business, Science and Arts occupations in Farmington are Health Diagnosing & Treating (628 | 9.9%), Community & Social Service (481 | 7.5%), Management (437 | 6.9%), Health Technologists (411 | 6.5%), and Business & Financial (278 | 4.4%).
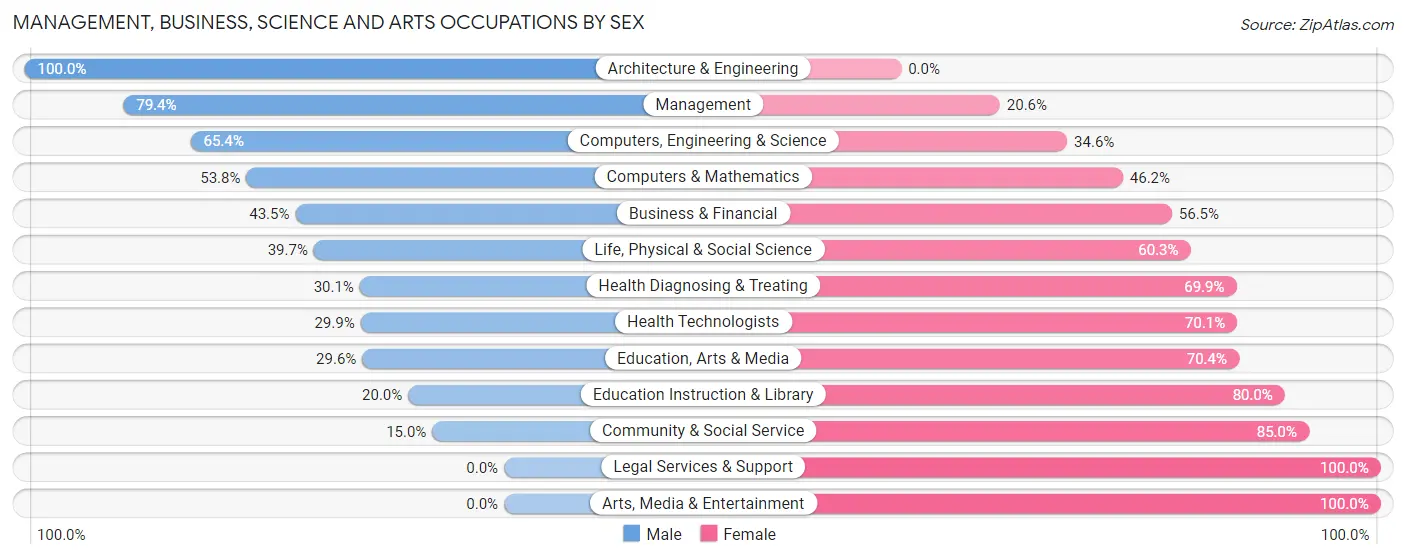
Management, Business, Science and Arts Occupations by Sex
Within the Management, Business, Science and Arts occupations in Farmington, the most male-oriented occupations are Architecture & Engineering (100.0%), Management (79.4%), and Computers, Engineering & Science (65.4%), while the most female-oriented occupations are Legal Services & Support (100.0%), Arts, Media & Entertainment (100.0%), and Community & Social Service (85.0%).
| Occupation | Male | Female |
| Management | 347 (79.4%) | 90 (20.6%) |
| Business & Financial | 121 (43.5%) | 157 (56.5%) |
| Computers, Engineering & Science | 153 (65.4%) | 81 (34.6%) |
| Computers & Mathematics | 50 (53.8%) | 43 (46.2%) |
| Architecture & Engineering | 78 (100.0%) | 0 (0.0%) |
| Life, Physical & Social Science | 25 (39.7%) | 38 (60.3%) |
| Community & Social Service | 72 (15.0%) | 409 (85.0%) |
| Education, Arts & Media | 21 (29.6%) | 50 (70.4%) |
| Legal Services & Support | 0 (0.0%) | 90 (100.0%) |
| Education Instruction & Library | 51 (20.0%) | 204 (80.0%) |
| Arts, Media & Entertainment | 0 (0.0%) | 65 (100.0%) |
| Health Diagnosing & Treating | 189 (30.1%) | 439 (69.9%) |
| Health Technologists | 123 (29.9%) | 288 (70.1%) |
| Total (Category) | 882 (42.9%) | 1,176 (57.1%) |
| Total (Overall) | 3,525 (55.3%) | 2,848 (44.7%) |
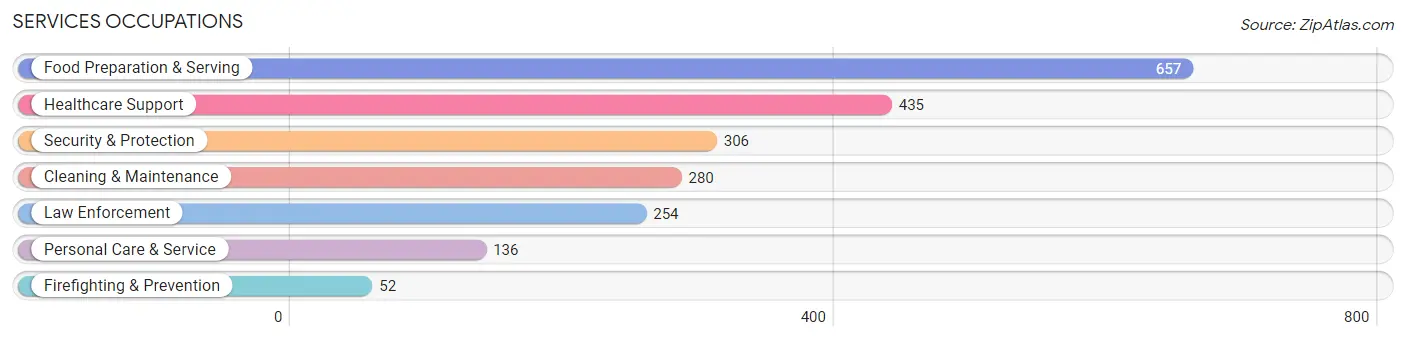
Services Occupations
The most common Services occupations in Farmington are Food Preparation & Serving (657 | 10.3%), Healthcare Support (435 | 6.8%), Security & Protection (306 | 4.8%), Cleaning & Maintenance (280 | 4.4%), and Law Enforcement (254 | 4.0%).
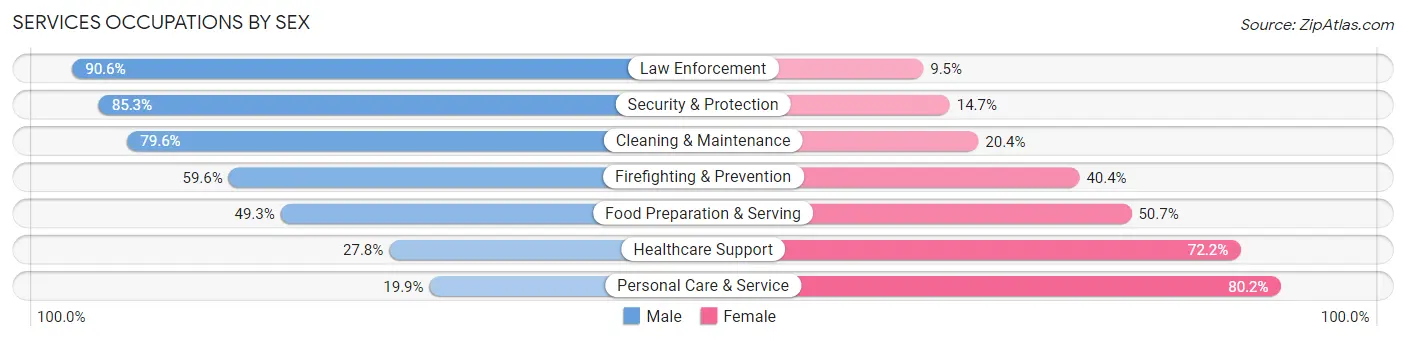
Services Occupations by Sex
Within the Services occupations in Farmington, the most male-oriented occupations are Law Enforcement (90.5%), Security & Protection (85.3%), and Cleaning & Maintenance (79.6%), while the most female-oriented occupations are Personal Care & Service (80.1%), Healthcare Support (72.2%), and Food Preparation & Serving (50.7%).
| Occupation | Male | Female |
| Healthcare Support | 121 (27.8%) | 314 (72.2%) |
| Security & Protection | 261 (85.3%) | 45 (14.7%) |
| Firefighting & Prevention | 31 (59.6%) | 21 (40.4%) |
| Law Enforcement | 230 (90.5%) | 24 (9.5%) |
| Food Preparation & Serving | 324 (49.3%) | 333 (50.7%) |
| Cleaning & Maintenance | 223 (79.6%) | 57 (20.4%) |
| Personal Care & Service | 27 (19.9%) | 109 (80.1%) |
| Total (Category) | 956 (52.7%) | 858 (47.3%) |
| Total (Overall) | 3,525 (55.3%) | 2,848 (44.7%) |
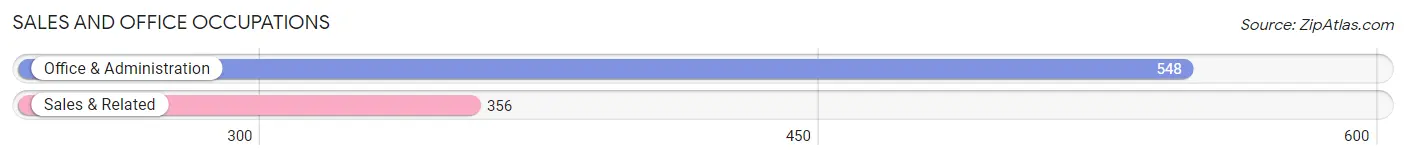
Sales and Office Occupations
The most common Sales and Office occupations in Farmington are Office & Administration (548 | 8.6%), and Sales & Related (356 | 5.6%).
Sales and Office Occupations by Sex
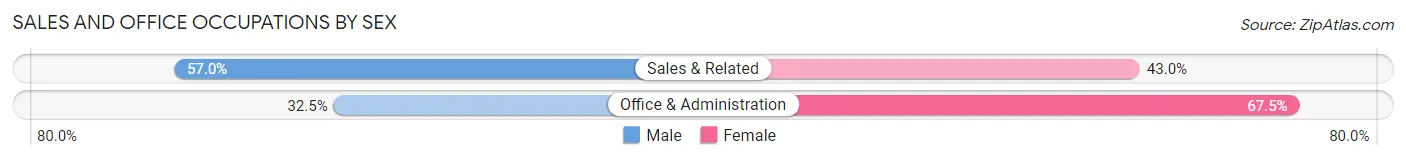
| Occupation | Male | Female |
| Sales & Related | 203 (57.0%) | 153 (43.0%) |
| Office & Administration | 178 (32.5%) | 370 (67.5%) |
| Total (Category) | 381 (42.1%) | 523 (57.9%) |
| Total (Overall) | 3,525 (55.3%) | 2,848 (44.7%) |
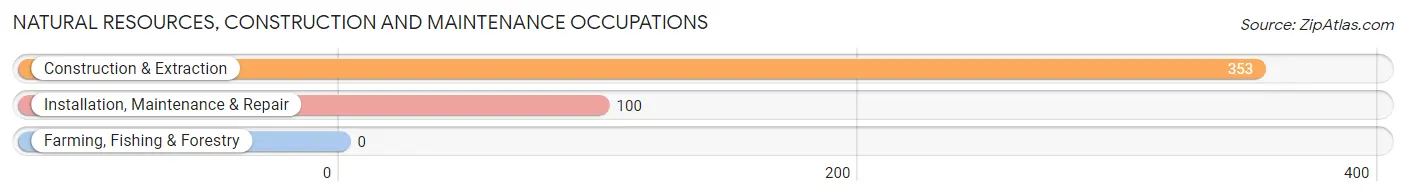
Natural Resources, Construction and Maintenance Occupations
The most common Natural Resources, Construction and Maintenance occupations in Farmington are Construction & Extraction (353 | 5.5%), and Installation, Maintenance & Repair (100 | 1.6%).
Natural Resources, Construction and Maintenance Occupations by Sex

| Occupation | Male | Female |
| Farming, Fishing & Forestry | 0 (0.0%) | 0 (0.0%) |
| Construction & Extraction | 353 (100.0%) | 0 (0.0%) |
| Installation, Maintenance & Repair | 92 (92.0%) | 8 (8.0%) |
| Total (Category) | 445 (98.2%) | 8 (1.8%) |
| Total (Overall) | 3,525 (55.3%) | 2,848 (44.7%) |
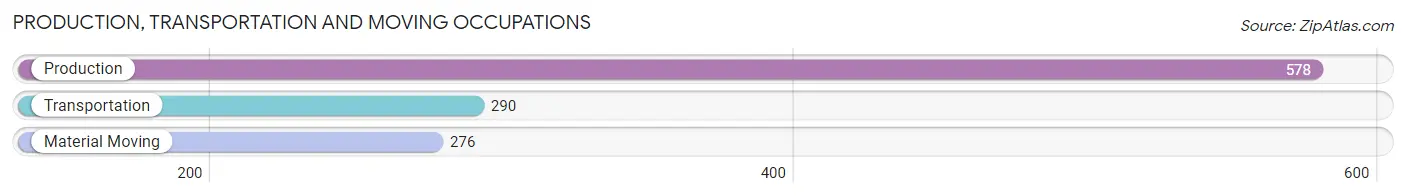
Production, Transportation and Moving Occupations
The most common Production, Transportation and Moving occupations in Farmington are Production (578 | 9.1%), Transportation (290 | 4.5%), and Material Moving (276 | 4.3%).
Production, Transportation and Moving Occupations by Sex
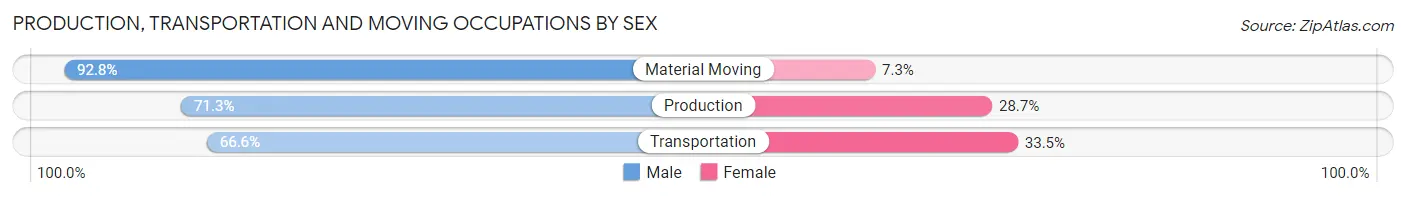
| Occupation | Male | Female |
| Production | 412 (71.3%) | 166 (28.7%) |
| Transportation | 193 (66.5%) | 97 (33.5%) |
| Material Moving | 256 (92.7%) | 20 (7.2%) |
| Total (Category) | 861 (75.3%) | 283 (24.7%) |
| Total (Overall) | 3,525 (55.3%) | 2,848 (44.7%) |
Employment Industries by Sex in Farmington
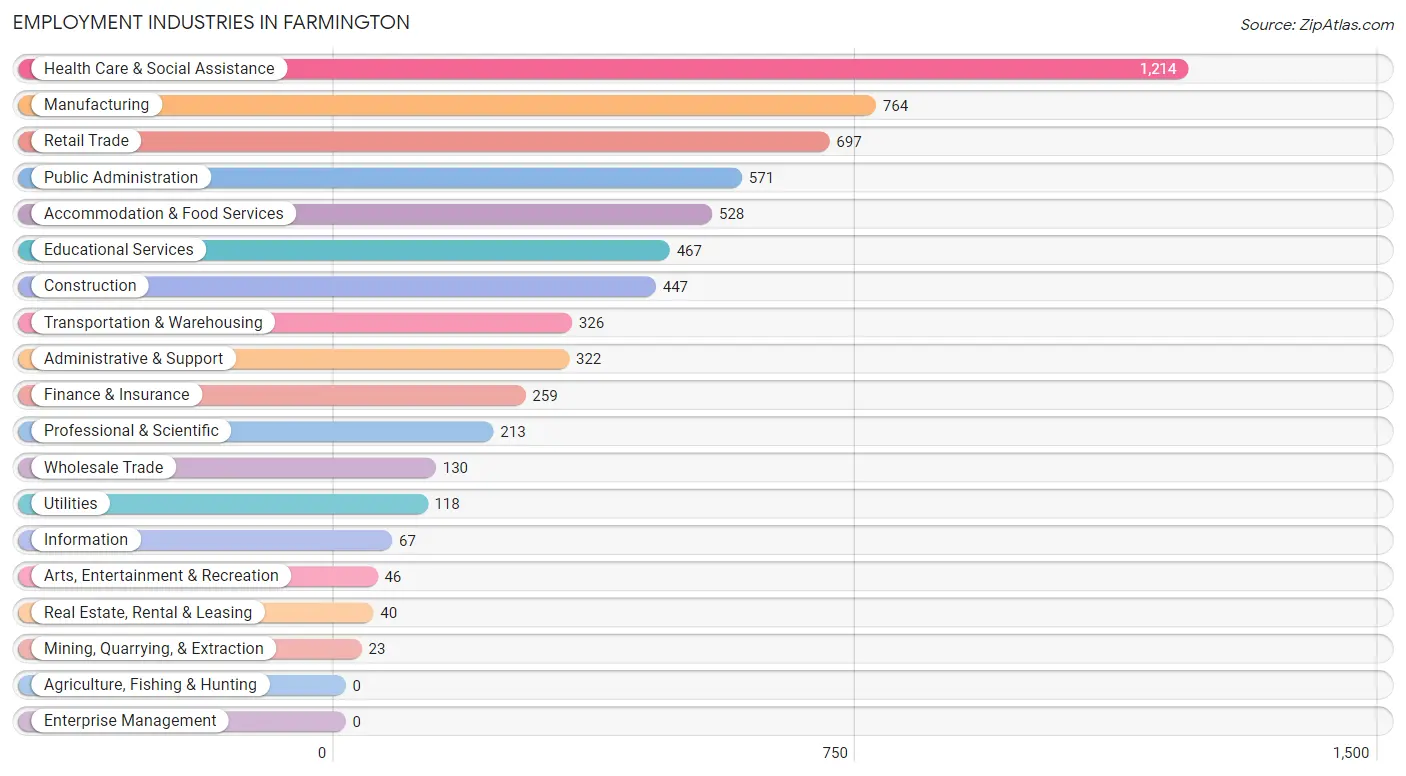
Employment Industries in Farmington
The major employment industries in Farmington include Health Care & Social Assistance (1,214 | 19.1%), Manufacturing (764 | 12.0%), Retail Trade (697 | 10.9%), Public Administration (571 | 9.0%), and Accommodation & Food Services (528 | 8.3%).
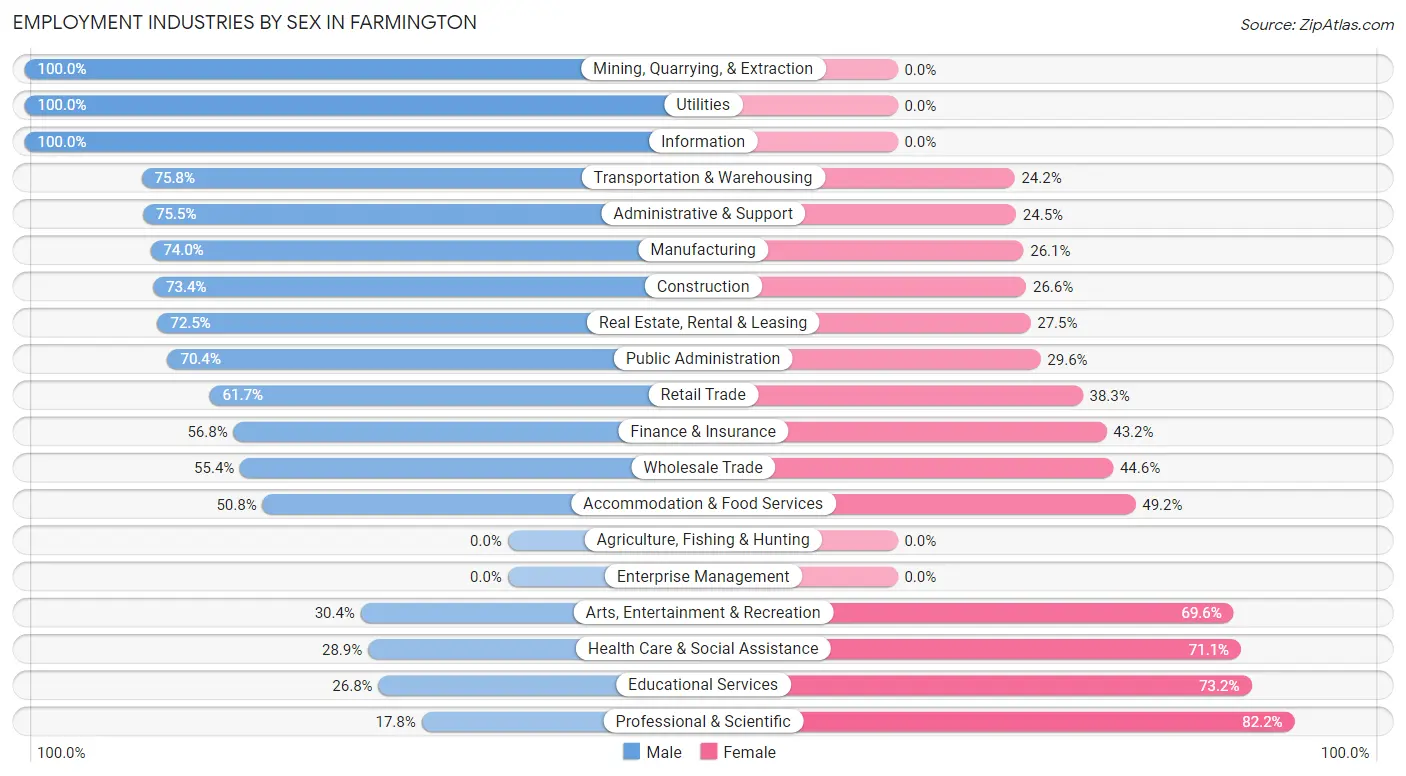
Employment Industries by Sex in Farmington
The Farmington industries that see more men than women are Mining, Quarrying, & Extraction (100.0%), Utilities (100.0%), and Information (100.0%), whereas the industries that tend to have a higher number of women are Professional & Scientific (82.2%), Educational Services (73.2%), and Health Care & Social Assistance (71.1%).
| Industry | Male | Female |
| Agriculture, Fishing & Hunting | 0 (0.0%) | 0 (0.0%) |
| Mining, Quarrying, & Extraction | 23 (100.0%) | 0 (0.0%) |
| Construction | 328 (73.4%) | 119 (26.6%) |
| Manufacturing | 565 (74.0%) | 199 (26.1%) |
| Wholesale Trade | 72 (55.4%) | 58 (44.6%) |
| Retail Trade | 430 (61.7%) | 267 (38.3%) |
| Transportation & Warehousing | 247 (75.8%) | 79 (24.2%) |
| Utilities | 118 (100.0%) | 0 (0.0%) |
| Information | 67 (100.0%) | 0 (0.0%) |
| Finance & Insurance | 147 (56.8%) | 112 (43.2%) |
| Real Estate, Rental & Leasing | 29 (72.5%) | 11 (27.5%) |
| Professional & Scientific | 38 (17.8%) | 175 (82.2%) |
| Enterprise Management | 0 (0.0%) | 0 (0.0%) |
| Administrative & Support | 243 (75.5%) | 79 (24.5%) |
| Educational Services | 125 (26.8%) | 342 (73.2%) |
| Health Care & Social Assistance | 351 (28.9%) | 863 (71.1%) |
| Arts, Entertainment & Recreation | 14 (30.4%) | 32 (69.6%) |
| Accommodation & Food Services | 268 (50.8%) | 260 (49.2%) |
| Public Administration | 402 (70.4%) | 169 (29.6%) |
| Total | 3,525 (55.3%) | 2,848 (44.7%) |
Education in Farmington
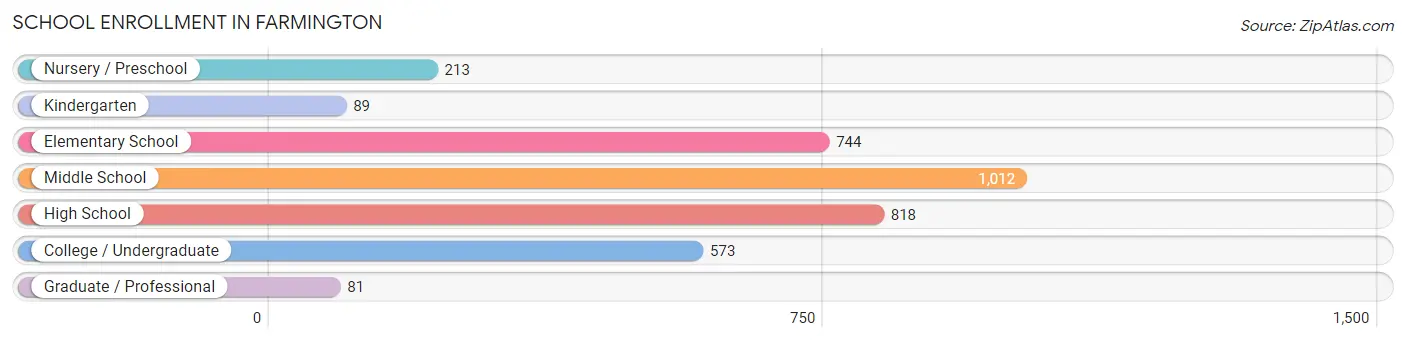
School Enrollment in Farmington
The most common levels of schooling among the 3,530 students in Farmington are middle school (1,012 | 28.7%), high school (818 | 23.2%), and elementary school (744 | 21.1%).
| School Level | # Students | % Students |
| Nursery / Preschool | 213 | 6.0% |
| Kindergarten | 89 | 2.5% |
| Elementary School | 744 | 21.1% |
| Middle School | 1,012 | 28.7% |
| High School | 818 | 23.2% |
| College / Undergraduate | 573 | 16.2% |
| Graduate / Professional | 81 | 2.3% |
| Total | 3,530 | 100.0% |
School Enrollment by Age by Funding Source in Farmington
Out of a total of 3,530 students who are enrolled in schools in Farmington, 519 (14.7%) attend a private institution, while the remaining 3,011 (85.3%) are enrolled in public schools. The age group of 35 years and over has the highest likelihood of being enrolled in private schools, with 274 (65.7% in the age bracket) enrolled. Conversely, the age group of 20 to 24 year olds has the lowest likelihood of being enrolled in a private school, with 167 (100.0% in the age bracket) attending a public institution.
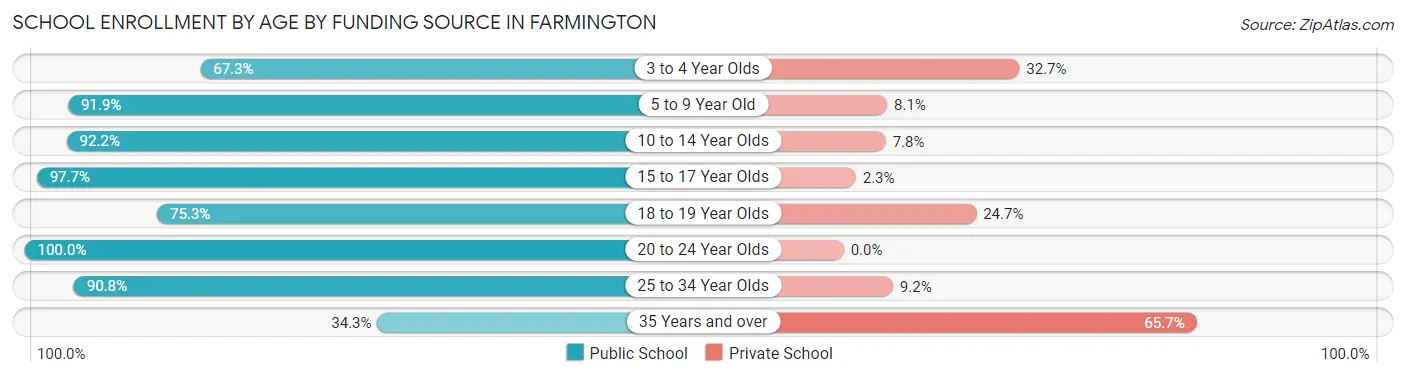
| Age Bracket | Public School | Private School |
| 3 to 4 Year Olds | 74 (67.3%) | 36 (32.7%) |
| 5 to 9 Year Old | 716 (91.9%) | 63 (8.1%) |
| 10 to 14 Year Olds | 1,071 (92.2%) | 91 (7.8%) |
| 15 to 17 Year Olds | 561 (97.7%) | 13 (2.3%) |
| 18 to 19 Year Olds | 61 (75.3%) | 20 (24.7%) |
| 20 to 24 Year Olds | 167 (100.0%) | 0 (0.0%) |
| 25 to 34 Year Olds | 218 (90.8%) | 22 (9.2%) |
| 35 Years and over | 143 (34.3%) | 274 (65.7%) |
| Total | 3,011 (85.3%) | 519 (14.7%) |
Educational Attainment by Field of Study in Farmington
Education (472 | 22.3%), business (462 | 21.8%), science & technology (310 | 14.6%), psychology (219 | 10.3%), and bio, nature & agricultural (159 | 7.5%) are the most common fields of study among 2,119 individuals in Farmington who have obtained a bachelor's degree or higher.
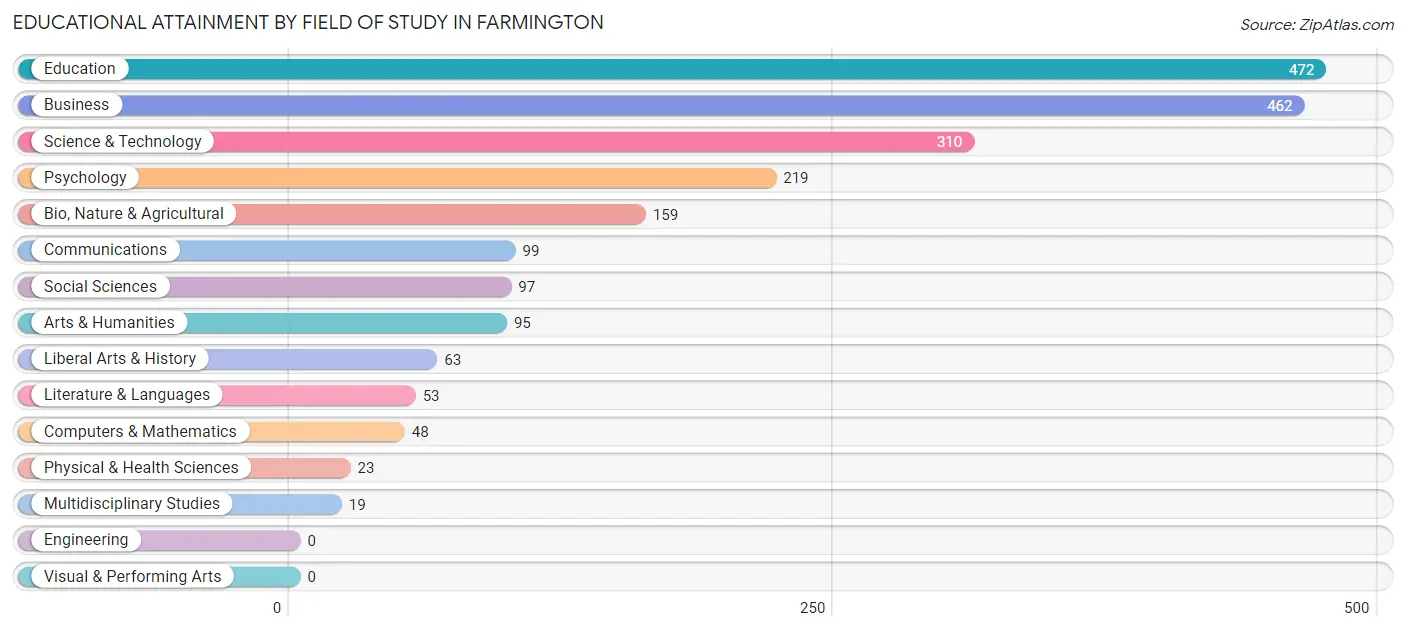
| Field of Study | # Graduates | % Graduates |
| Computers & Mathematics | 48 | 2.3% |
| Bio, Nature & Agricultural | 159 | 7.5% |
| Physical & Health Sciences | 23 | 1.1% |
| Psychology | 219 | 10.3% |
| Social Sciences | 97 | 4.6% |
| Engineering | 0 | 0.0% |
| Multidisciplinary Studies | 19 | 0.9% |
| Science & Technology | 310 | 14.6% |
| Business | 462 | 21.8% |
| Education | 472 | 22.3% |
| Literature & Languages | 53 | 2.5% |
| Liberal Arts & History | 63 | 3.0% |
| Visual & Performing Arts | 0 | 0.0% |
| Communications | 99 | 4.7% |
| Arts & Humanities | 95 | 4.5% |
| Total | 2,119 | 100.0% |
Transportation & Commute in Farmington
Vehicle Availability by Sex in Farmington
The most prevalent vehicle ownership categories in Farmington are males with 2 vehicles (1,601, accounting for 46.0%) and females with 2 vehicles (1,162, making up 58.5%).
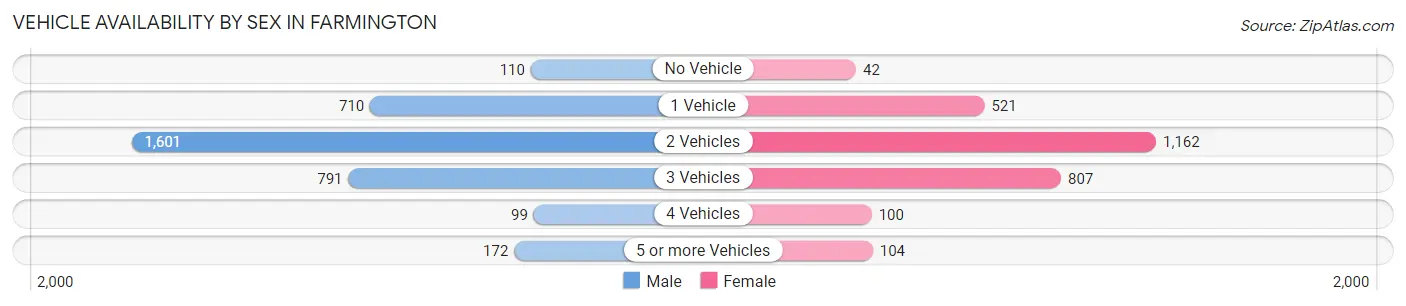
| Vehicles Available | Male | Female |
| No Vehicle | 110 (3.2%) | 42 (1.5%) |
| 1 Vehicle | 710 (20.4%) | 521 (19.0%) |
| 2 Vehicles | 1,601 (46.0%) | 1,162 (42.5%) |
| 3 Vehicles | 791 (22.7%) | 807 (29.5%) |
| 4 Vehicles | 99 (2.8%) | 100 (3.6%) |
| 5 or more Vehicles | 172 (4.9%) | 104 (3.8%) |
| Total | 3,483 (100.0%) | 2,736 (100.0%) |
Commute Time in Farmington
The most frequently occuring commute durations in Farmington are 5 to 9 minutes (1,420 commuters, 24.5%), 10 to 14 minutes (1,017 commuters, 17.6%), and 15 to 19 minutes (827 commuters, 14.3%).
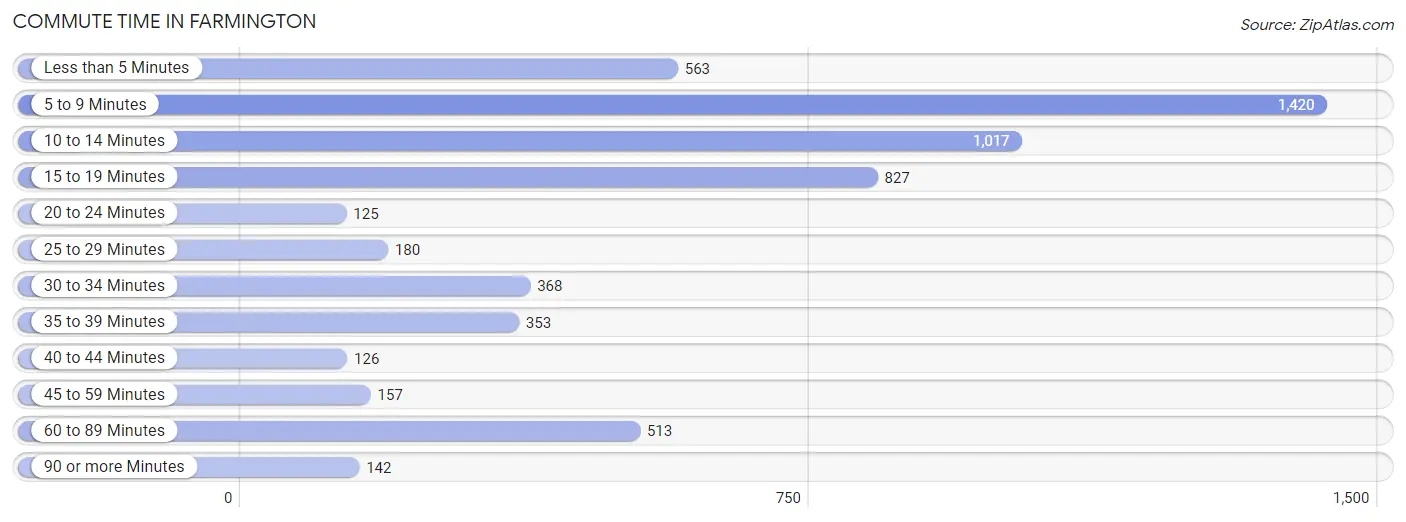
| Commute Time | # Commuters | % Commuters |
| Less than 5 Minutes | 563 | 9.7% |
| 5 to 9 Minutes | 1,420 | 24.5% |
| 10 to 14 Minutes | 1,017 | 17.6% |
| 15 to 19 Minutes | 827 | 14.3% |
| 20 to 24 Minutes | 125 | 2.2% |
| 25 to 29 Minutes | 180 | 3.1% |
| 30 to 34 Minutes | 368 | 6.4% |
| 35 to 39 Minutes | 353 | 6.1% |
| 40 to 44 Minutes | 126 | 2.2% |
| 45 to 59 Minutes | 157 | 2.7% |
| 60 to 89 Minutes | 513 | 8.9% |
| 90 or more Minutes | 142 | 2.5% |
Commute Time by Sex in Farmington
The most common commute times in Farmington are 5 to 9 minutes (693 commuters, 20.9%) for males and 5 to 9 minutes (727 commuters, 29.3%) for females.
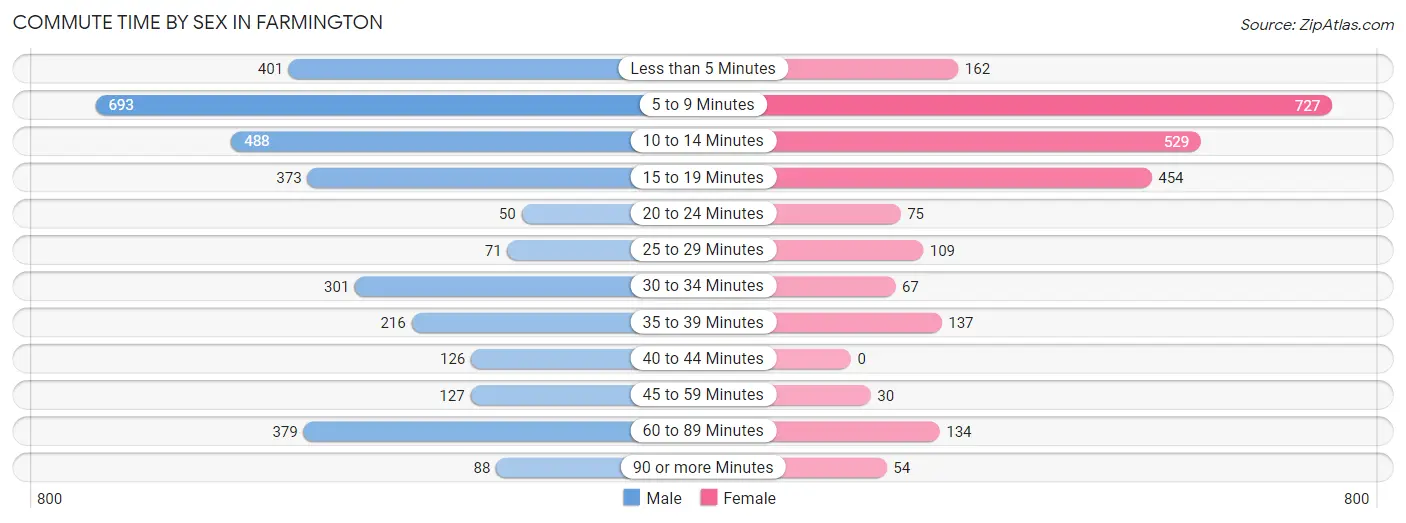
| Commute Time | Male | Female |
| Less than 5 Minutes | 401 (12.1%) | 162 (6.5%) |
| 5 to 9 Minutes | 693 (20.9%) | 727 (29.3%) |
| 10 to 14 Minutes | 488 (14.7%) | 529 (21.3%) |
| 15 to 19 Minutes | 373 (11.3%) | 454 (18.3%) |
| 20 to 24 Minutes | 50 (1.5%) | 75 (3.0%) |
| 25 to 29 Minutes | 71 (2.1%) | 109 (4.4%) |
| 30 to 34 Minutes | 301 (9.1%) | 67 (2.7%) |
| 35 to 39 Minutes | 216 (6.5%) | 137 (5.5%) |
| 40 to 44 Minutes | 126 (3.8%) | 0 (0.0%) |
| 45 to 59 Minutes | 127 (3.8%) | 30 (1.2%) |
| 60 to 89 Minutes | 379 (11.4%) | 134 (5.4%) |
| 90 or more Minutes | 88 (2.7%) | 54 (2.2%) |
Time of Departure to Work by Sex in Farmington
The most frequent times of departure to work in Farmington are 12:00 AM to 4:59 AM (443, 13.4%) for males and 7:30 AM to 7:59 AM (455, 18.4%) for females.
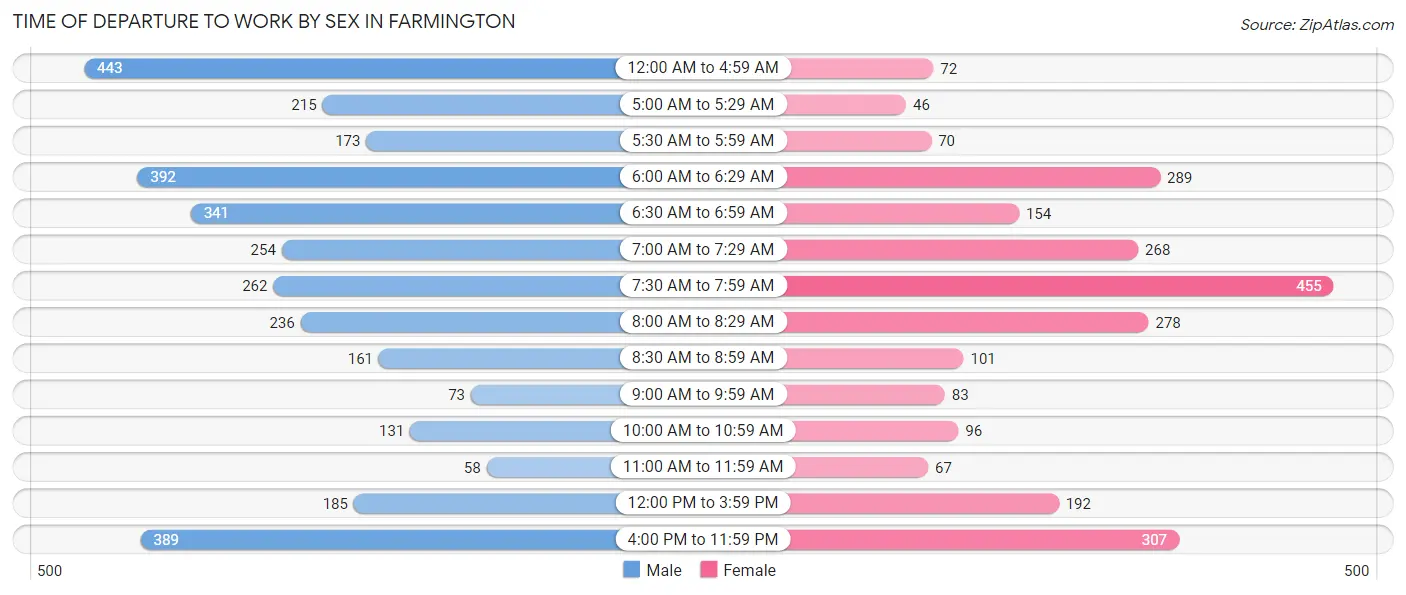
| Time of Departure | Male | Female |
| 12:00 AM to 4:59 AM | 443 (13.4%) | 72 (2.9%) |
| 5:00 AM to 5:29 AM | 215 (6.5%) | 46 (1.9%) |
| 5:30 AM to 5:59 AM | 173 (5.2%) | 70 (2.8%) |
| 6:00 AM to 6:29 AM | 392 (11.8%) | 289 (11.7%) |
| 6:30 AM to 6:59 AM | 341 (10.3%) | 154 (6.2%) |
| 7:00 AM to 7:29 AM | 254 (7.7%) | 268 (10.8%) |
| 7:30 AM to 7:59 AM | 262 (7.9%) | 455 (18.4%) |
| 8:00 AM to 8:29 AM | 236 (7.1%) | 278 (11.2%) |
| 8:30 AM to 8:59 AM | 161 (4.9%) | 101 (4.1%) |
| 9:00 AM to 9:59 AM | 73 (2.2%) | 83 (3.4%) |
| 10:00 AM to 10:59 AM | 131 (4.0%) | 96 (3.9%) |
| 11:00 AM to 11:59 AM | 58 (1.8%) | 67 (2.7%) |
| 12:00 PM to 3:59 PM | 185 (5.6%) | 192 (7.7%) |
| 4:00 PM to 11:59 PM | 389 (11.7%) | 307 (12.4%) |
| Total | 3,313 (100.0%) | 2,478 (100.0%) |
Housing Occupancy in Farmington
Occupancy by Ownership in Farmington
Of the total 6,205 dwellings in Farmington, owner-occupied units account for 3,313 (53.4%), while renter-occupied units make up 2,892 (46.6%).
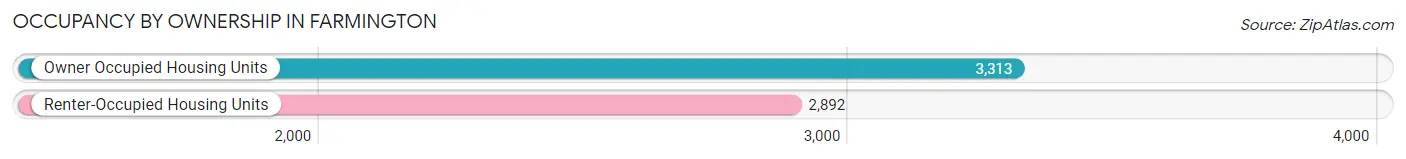
| Occupancy | # Housing Units | % Housing Units |
| Owner Occupied Housing Units | 3,313 | 53.4% |
| Renter-Occupied Housing Units | 2,892 | 46.6% |
| Total Occupied Housing Units | 6,205 | 100.0% |
Occupancy by Household Size in Farmington
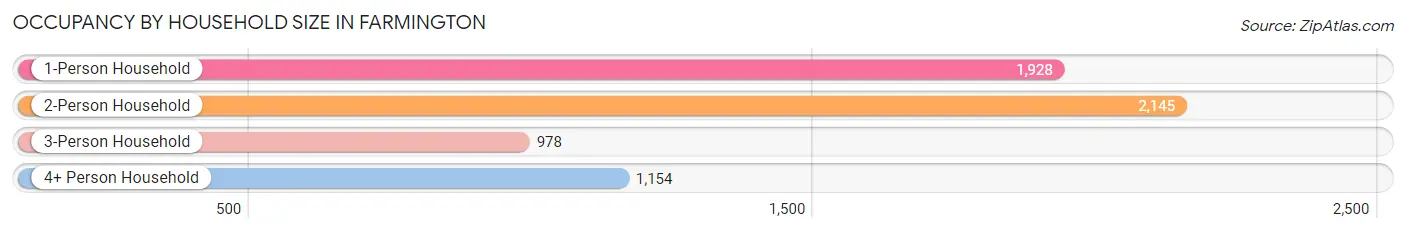
| Household Size | # Housing Units | % Housing Units |
| 1-Person Household | 1,928 | 31.1% |
| 2-Person Household | 2,145 | 34.6% |
| 3-Person Household | 978 | 15.8% |
| 4+ Person Household | 1,154 | 18.6% |
| Total Housing Units | 6,205 | 100.0% |
Occupancy by Ownership by Household Size in Farmington
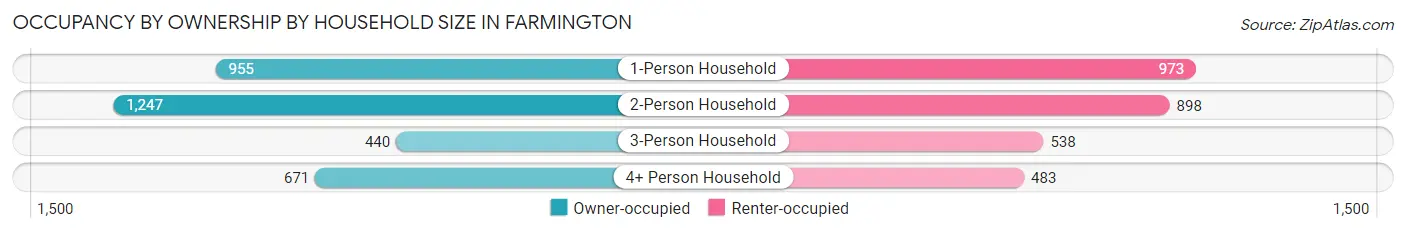
| Household Size | Owner-occupied | Renter-occupied |
| 1-Person Household | 955 (49.5%) | 973 (50.5%) |
| 2-Person Household | 1,247 (58.1%) | 898 (41.9%) |
| 3-Person Household | 440 (45.0%) | 538 (55.0%) |
| 4+ Person Household | 671 (58.2%) | 483 (41.8%) |
| Total Housing Units | 3,313 (53.4%) | 2,892 (46.6%) |
Occupancy by Educational Attainment in Farmington
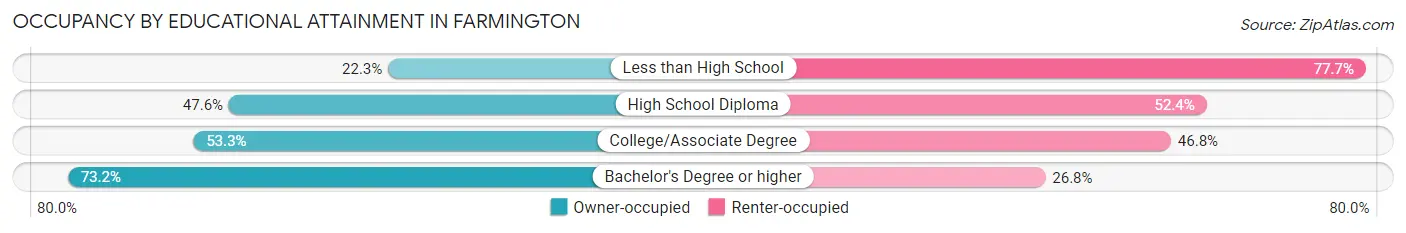
| Household Size | Owner-occupied | Renter-occupied |
| Less than High School | 103 (22.3%) | 358 (77.7%) |
| High School Diploma | 996 (47.6%) | 1,097 (52.4%) |
| College/Associate Degree | 1,222 (53.2%) | 1,073 (46.8%) |
| Bachelor's Degree or higher | 992 (73.2%) | 364 (26.8%) |
Occupancy by Age of Householder in Farmington
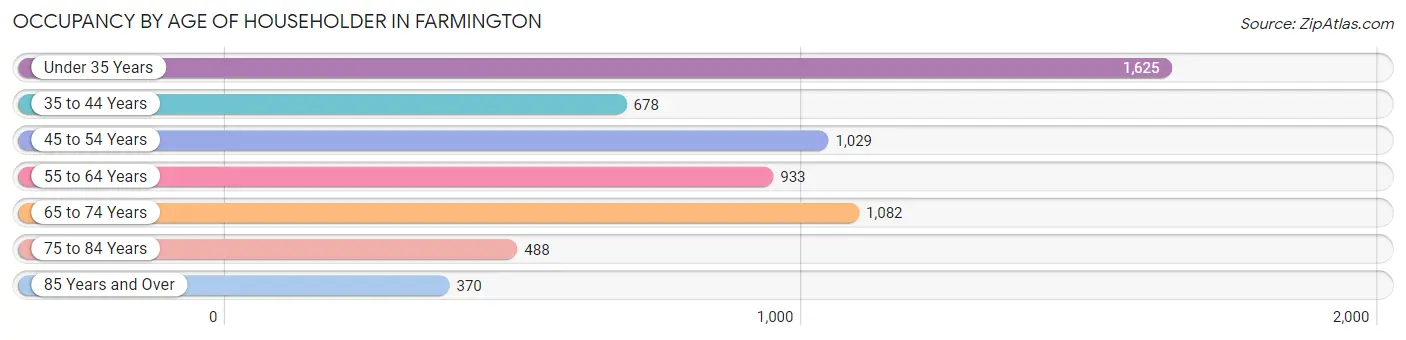
| Age Bracket | # Households | % Households |
| Under 35 Years | 1,625 | 26.2% |
| 35 to 44 Years | 678 | 10.9% |
| 45 to 54 Years | 1,029 | 16.6% |
| 55 to 64 Years | 933 | 15.0% |
| 65 to 74 Years | 1,082 | 17.4% |
| 75 to 84 Years | 488 | 7.9% |
| 85 Years and Over | 370 | 6.0% |
| Total | 6,205 | 100.0% |
Housing Finances in Farmington
Median Income by Occupancy in Farmington
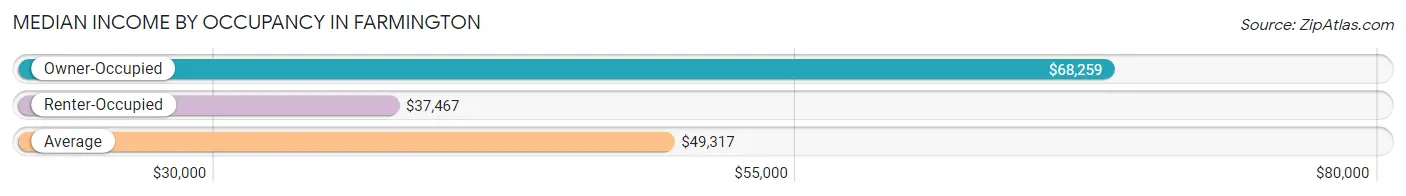
| Occupancy Type | # Households | Median Income |
| Owner-Occupied | 3,313 (53.4%) | $68,259 |
| Renter-Occupied | 2,892 (46.6%) | $37,467 |
| Average | 6,205 (100.0%) | $49,317 |
Occupancy by Householder Income Bracket in Farmington
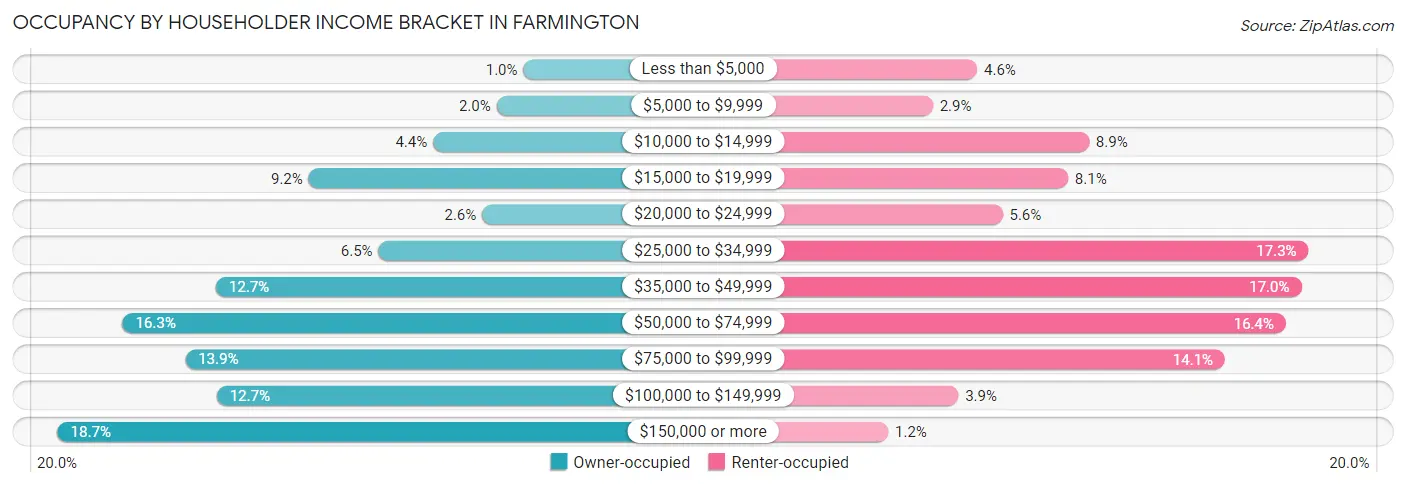
| Income Bracket | Owner-occupied | Renter-occupied |
| Less than $5,000 | 33 (1.0%) | 134 (4.6%) |
| $5,000 to $9,999 | 67 (2.0%) | 85 (2.9%) |
| $10,000 to $14,999 | 147 (4.4%) | 257 (8.9%) |
| $15,000 to $19,999 | 304 (9.2%) | 234 (8.1%) |
| $20,000 to $24,999 | 85 (2.6%) | 162 (5.6%) |
| $25,000 to $34,999 | 216 (6.5%) | 499 (17.2%) |
| $35,000 to $49,999 | 421 (12.7%) | 491 (17.0%) |
| $50,000 to $74,999 | 539 (16.3%) | 474 (16.4%) |
| $75,000 to $99,999 | 460 (13.9%) | 407 (14.1%) |
| $100,000 to $149,999 | 420 (12.7%) | 113 (3.9%) |
| $150,000 or more | 621 (18.7%) | 36 (1.2%) |
| Total | 3,313 (100.0%) | 2,892 (100.0%) |
Monthly Housing Cost Tiers in Farmington
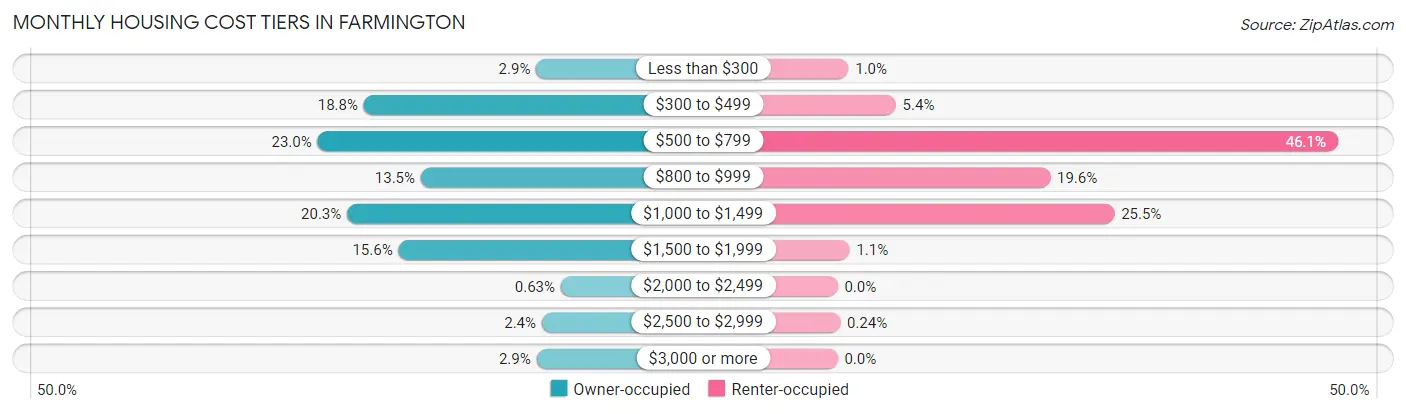
| Monthly Cost | Owner-occupied | Renter-occupied |
| Less than $300 | 96 (2.9%) | 29 (1.0%) |
| $300 to $499 | 622 (18.8%) | 155 (5.4%) |
| $500 to $799 | 763 (23.0%) | 1,332 (46.1%) |
| $800 to $999 | 448 (13.5%) | 566 (19.6%) |
| $1,000 to $1,499 | 673 (20.3%) | 737 (25.5%) |
| $1,500 to $1,999 | 516 (15.6%) | 32 (1.1%) |
| $2,000 to $2,499 | 21 (0.6%) | 0 (0.0%) |
| $2,500 to $2,999 | 79 (2.4%) | 7 (0.2%) |
| $3,000 or more | 95 (2.9%) | 0 (0.0%) |
| Total | 3,313 (100.0%) | 2,892 (100.0%) |
Physical Housing Characteristics in Farmington
Housing Structures in Farmington
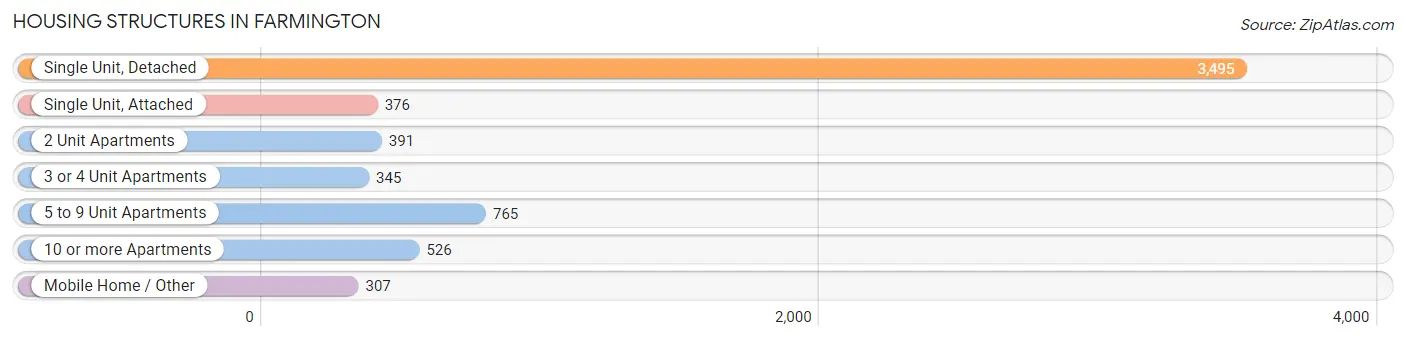
| Structure Type | # Housing Units | % Housing Units |
| Single Unit, Detached | 3,495 | 56.3% |
| Single Unit, Attached | 376 | 6.1% |
| 2 Unit Apartments | 391 | 6.3% |
| 3 or 4 Unit Apartments | 345 | 5.6% |
| 5 to 9 Unit Apartments | 765 | 12.3% |
| 10 or more Apartments | 526 | 8.5% |
| Mobile Home / Other | 307 | 5.0% |
| Total | 6,205 | 100.0% |
Housing Structures by Occupancy in Farmington
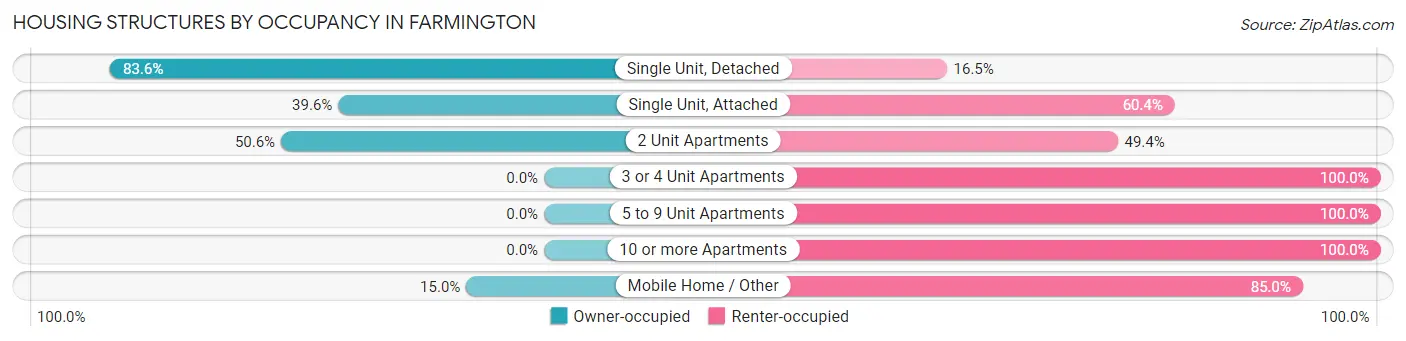
| Structure Type | Owner-occupied | Renter-occupied |
| Single Unit, Detached | 2,920 (83.6%) | 575 (16.5%) |
| Single Unit, Attached | 149 (39.6%) | 227 (60.4%) |
| 2 Unit Apartments | 198 (50.6%) | 193 (49.4%) |
| 3 or 4 Unit Apartments | 0 (0.0%) | 345 (100.0%) |
| 5 to 9 Unit Apartments | 0 (0.0%) | 765 (100.0%) |
| 10 or more Apartments | 0 (0.0%) | 526 (100.0%) |
| Mobile Home / Other | 46 (15.0%) | 261 (85.0%) |
| Total | 3,313 (53.4%) | 2,892 (46.6%) |
Housing Structures by Number of Rooms in Farmington
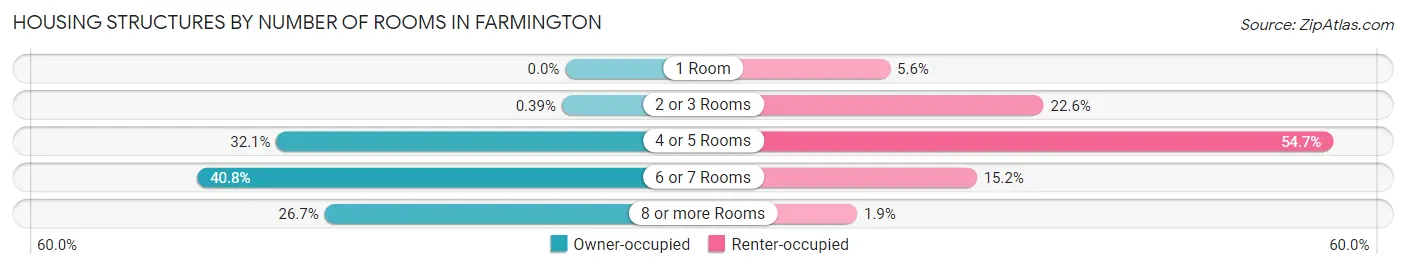
| Number of Rooms | Owner-occupied | Renter-occupied |
| 1 Room | 0 (0.0%) | 161 (5.6%) |
| 2 or 3 Rooms | 13 (0.4%) | 654 (22.6%) |
| 4 or 5 Rooms | 1,062 (32.1%) | 1,583 (54.7%) |
| 6 or 7 Rooms | 1,353 (40.8%) | 439 (15.2%) |
| 8 or more Rooms | 885 (26.7%) | 55 (1.9%) |
| Total | 3,313 (100.0%) | 2,892 (100.0%) |
Housing Structure by Heating Type in Farmington
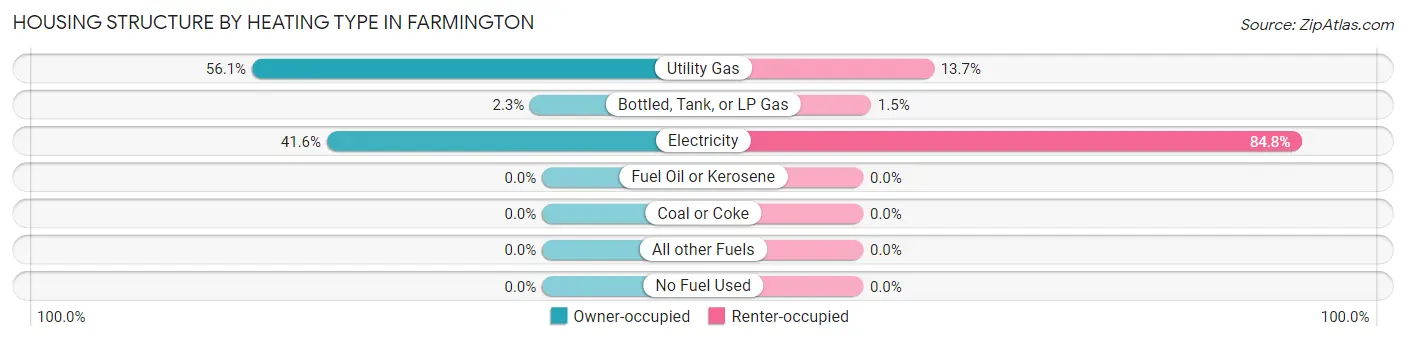
| Heating Type | Owner-occupied | Renter-occupied |
| Utility Gas | 1,858 (56.1%) | 395 (13.7%) |
| Bottled, Tank, or LP Gas | 77 (2.3%) | 44 (1.5%) |
| Electricity | 1,378 (41.6%) | 2,453 (84.8%) |
| Fuel Oil or Kerosene | 0 (0.0%) | 0 (0.0%) |
| Coal or Coke | 0 (0.0%) | 0 (0.0%) |
| All other Fuels | 0 (0.0%) | 0 (0.0%) |
| No Fuel Used | 0 (0.0%) | 0 (0.0%) |
| Total | 3,313 (100.0%) | 2,892 (100.0%) |
Household Vehicle Usage in Farmington
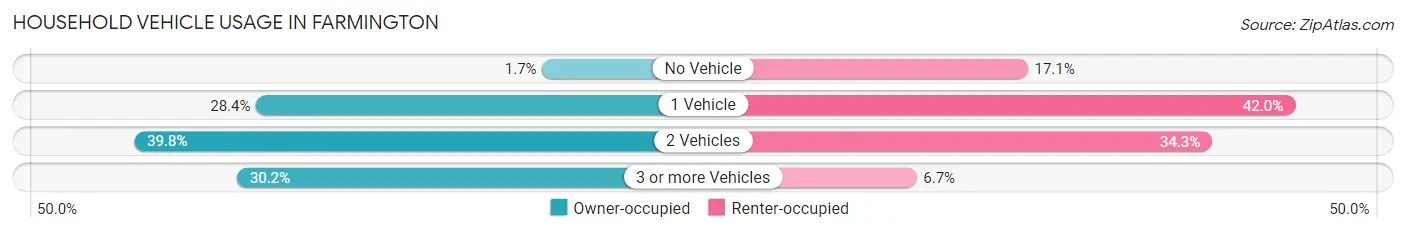
| Vehicles per Household | Owner-occupied | Renter-occupied |
| No Vehicle | 55 (1.7%) | 493 (17.1%) |
| 1 Vehicle | 940 (28.4%) | 1,215 (42.0%) |
| 2 Vehicles | 1,318 (39.8%) | 991 (34.3%) |
| 3 or more Vehicles | 1,000 (30.2%) | 193 (6.7%) |
| Total | 3,313 (100.0%) | 2,892 (100.0%) |
Real Estate & Mortgages in Farmington
Real Estate and Mortgage Overview in Farmington
| Characteristic | Without Mortgage | With Mortgage |
| Housing Units | 1,111 | 2,202 |
| Median Property Value | $173,000 | $165,800 |
| Median Household Income | $46,823 | $469 |
| Monthly Housing Costs | $442 | $72 |
| Real Estate Taxes | $1,231 | $16 |
Property Value by Mortgage Status in Farmington
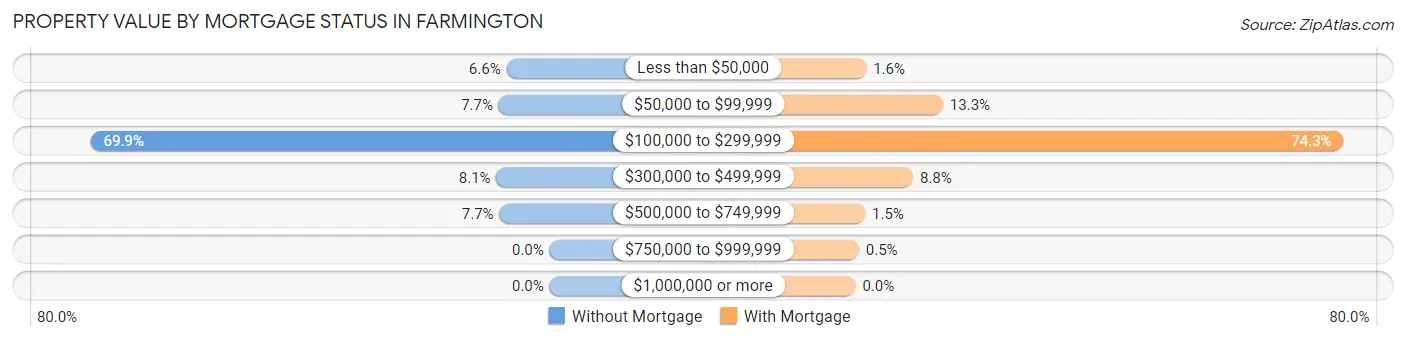
| Property Value | Without Mortgage | With Mortgage |
| Less than $50,000 | 73 (6.6%) | 36 (1.6%) |
| $50,000 to $99,999 | 86 (7.7%) | 293 (13.3%) |
| $100,000 to $299,999 | 777 (69.9%) | 1,637 (74.3%) |
| $300,000 to $499,999 | 90 (8.1%) | 193 (8.8%) |
| $500,000 to $749,999 | 85 (7.6%) | 32 (1.5%) |
| $750,000 to $999,999 | 0 (0.0%) | 11 (0.5%) |
| $1,000,000 or more | 0 (0.0%) | 0 (0.0%) |
| Total | 1,111 (100.0%) | 2,202 (100.0%) |
Household Income by Mortgage Status in Farmington
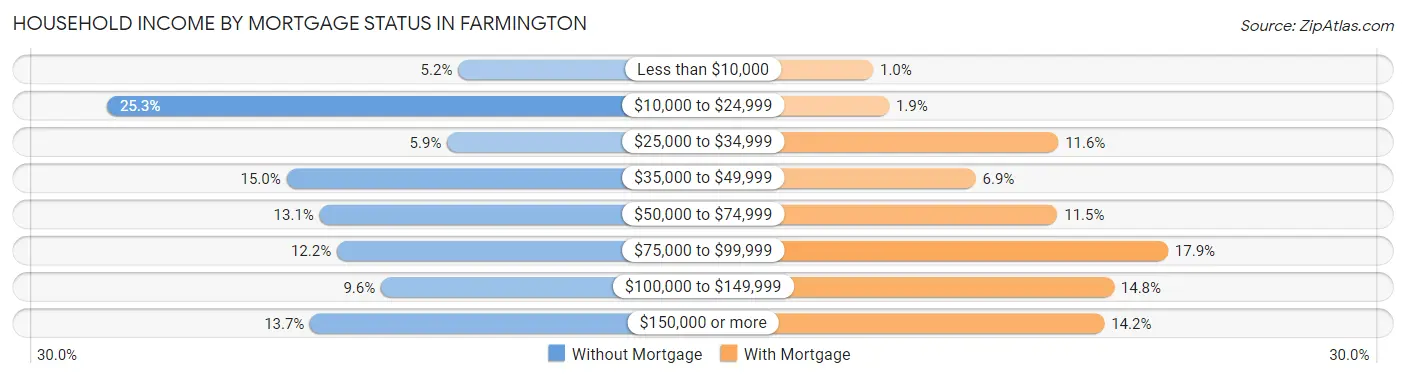
| Household Income | Without Mortgage | With Mortgage |
| Less than $10,000 | 58 (5.2%) | 22 (1.0%) |
| $10,000 to $24,999 | 281 (25.3%) | 42 (1.9%) |
| $25,000 to $34,999 | 65 (5.9%) | 255 (11.6%) |
| $35,000 to $49,999 | 167 (15.0%) | 151 (6.9%) |
| $50,000 to $74,999 | 146 (13.1%) | 254 (11.5%) |
| $75,000 to $99,999 | 135 (12.1%) | 393 (17.8%) |
| $100,000 to $149,999 | 107 (9.6%) | 325 (14.8%) |
| $150,000 or more | 152 (13.7%) | 313 (14.2%) |
| Total | 1,111 (100.0%) | 2,202 (100.0%) |
Property Value to Household Income Ratio in Farmington
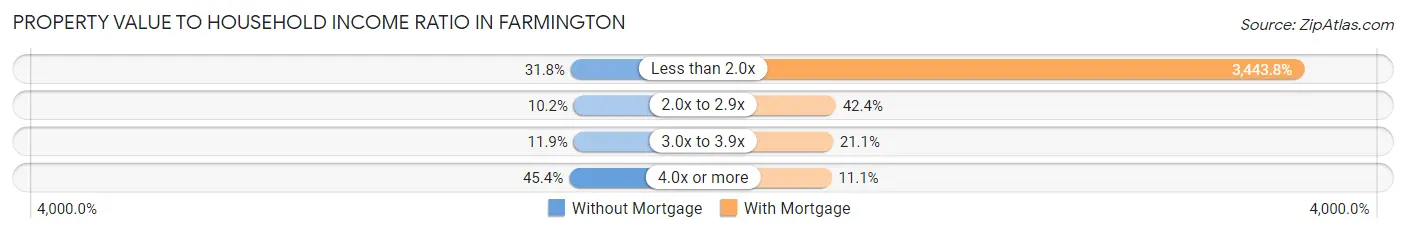
| Value-to-Income Ratio | Without Mortgage | With Mortgage |
| Less than 2.0x | 353 (31.8%) | 75,833 (3,443.8%) |
| 2.0x to 2.9x | 113 (10.2%) | 933 (42.4%) |
| 3.0x to 3.9x | 132 (11.9%) | 465 (21.1%) |
| 4.0x or more | 504 (45.4%) | 245 (11.1%) |
| Total | 1,111 (100.0%) | 2,202 (100.0%) |
Real Estate Taxes by Mortgage Status in Farmington
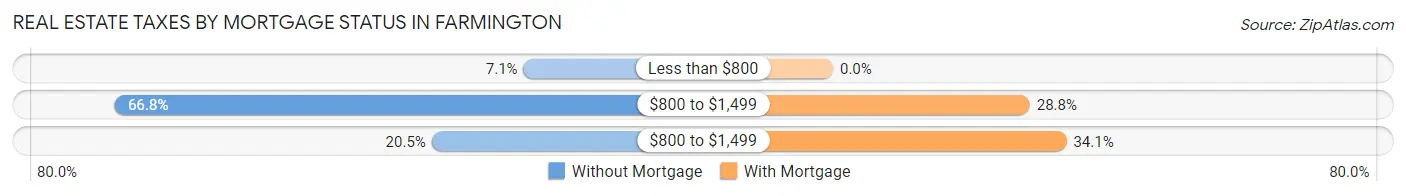
| Property Taxes | Without Mortgage | With Mortgage |
| Less than $800 | 79 (7.1%) | 0 (0.0%) |
| $800 to $1,499 | 742 (66.8%) | 633 (28.7%) |
| $800 to $1,499 | 228 (20.5%) | 751 (34.1%) |
| Total | 1,111 (100.0%) | 2,202 (100.0%) |
Health & Disability in Farmington
Health Insurance Coverage by Age in Farmington
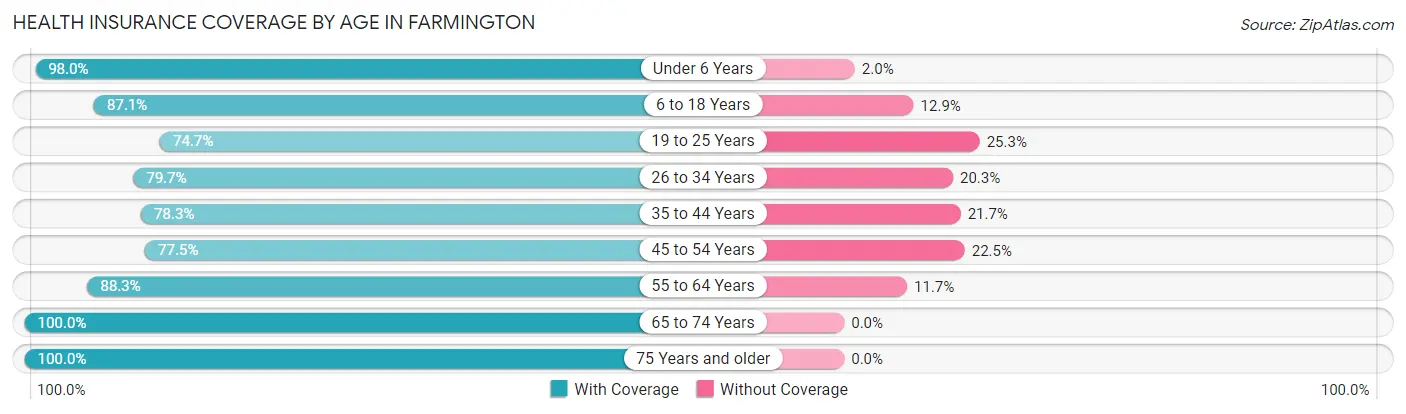
| Age Bracket | With Coverage | Without Coverage |
| Under 6 Years | 943 (98.0%) | 19 (2.0%) |
| 6 to 18 Years | 2,329 (87.1%) | 346 (12.9%) |
| 19 to 25 Years | 849 (74.7%) | 287 (25.3%) |
| 26 to 34 Years | 1,620 (79.7%) | 412 (20.3%) |
| 35 to 44 Years | 1,536 (78.3%) | 426 (21.7%) |
| 45 to 54 Years | 1,308 (77.5%) | 379 (22.5%) |
| 55 to 64 Years | 1,402 (88.3%) | 186 (11.7%) |
| 65 to 74 Years | 1,537 (100.0%) | 0 (0.0%) |
| 75 Years and older | 1,193 (100.0%) | 0 (0.0%) |
| Total | 12,717 (86.1%) | 2,055 (13.9%) |
Health Insurance Coverage by Citizenship Status in Farmington
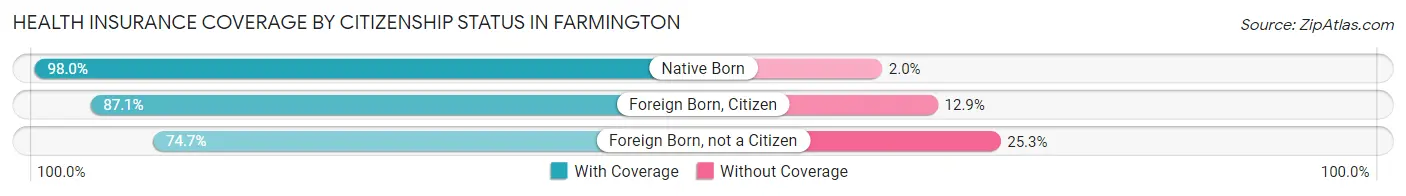
| Citizenship Status | With Coverage | Without Coverage |
| Native Born | 943 (98.0%) | 19 (2.0%) |
| Foreign Born, Citizen | 2,329 (87.1%) | 346 (12.9%) |
| Foreign Born, not a Citizen | 849 (74.7%) | 287 (25.3%) |
Health Insurance Coverage by Household Income in Farmington
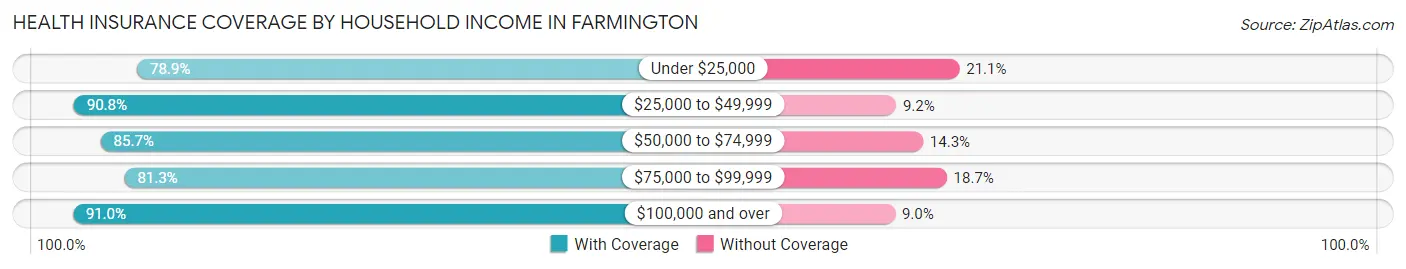
| Household Income | With Coverage | Without Coverage |
| Under $25,000 | 2,158 (78.9%) | 576 (21.1%) |
| $25,000 to $49,999 | 3,022 (90.8%) | 307 (9.2%) |
| $50,000 to $74,999 | 2,314 (85.7%) | 385 (14.3%) |
| $75,000 to $99,999 | 1,929 (81.3%) | 444 (18.7%) |
| $100,000 and over | 3,213 (91.0%) | 319 (9.0%) |
Public vs Private Health Insurance Coverage by Age in Farmington
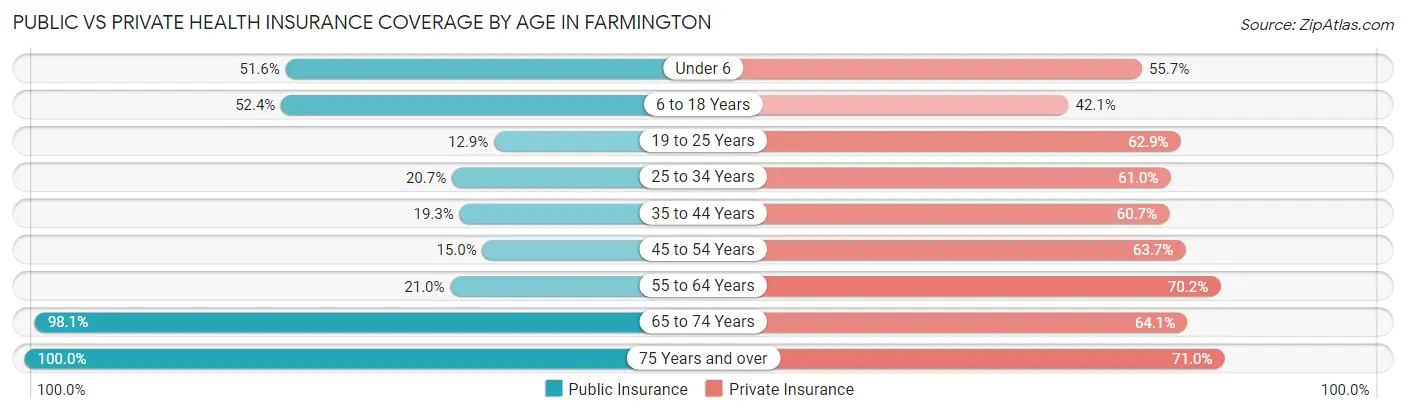
| Age Bracket | Public Insurance | Private Insurance |
| Under 6 | 496 (51.6%) | 536 (55.7%) |
| 6 to 18 Years | 1,401 (52.4%) | 1,126 (42.1%) |
| 19 to 25 Years | 146 (12.9%) | 714 (62.8%) |
| 25 to 34 Years | 420 (20.7%) | 1,239 (61.0%) |
| 35 to 44 Years | 378 (19.3%) | 1,191 (60.7%) |
| 45 to 54 Years | 253 (15.0%) | 1,075 (63.7%) |
| 55 to 64 Years | 333 (21.0%) | 1,115 (70.2%) |
| 65 to 74 Years | 1,508 (98.1%) | 985 (64.1%) |
| 75 Years and over | 1,193 (100.0%) | 847 (71.0%) |
| Total | 6,128 (41.5%) | 8,828 (59.8%) |
Disability Status by Sex by Age in Farmington
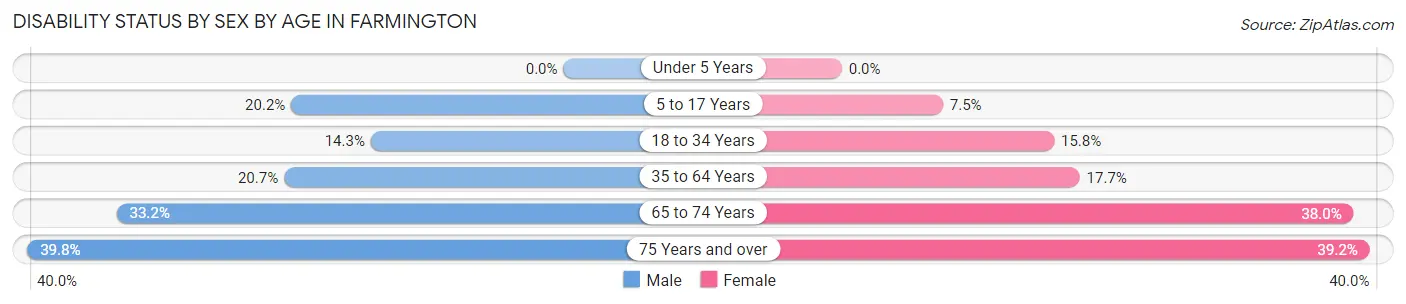
| Age Bracket | Male | Female |
| Under 5 Years | 0 (0.0%) | 0 (0.0%) |
| 5 to 17 Years | 227 (20.2%) | 119 (7.5%) |
| 18 to 34 Years | 243 (14.3%) | 244 (15.8%) |
| 35 to 64 Years | 560 (20.7%) | 448 (17.7%) |
| 65 to 74 Years | 199 (33.2%) | 356 (38.0%) |
| 75 Years and over | 160 (39.8%) | 310 (39.2%) |
Disability Class by Sex by Age in Farmington
Disability Class: Hearing Difficulty
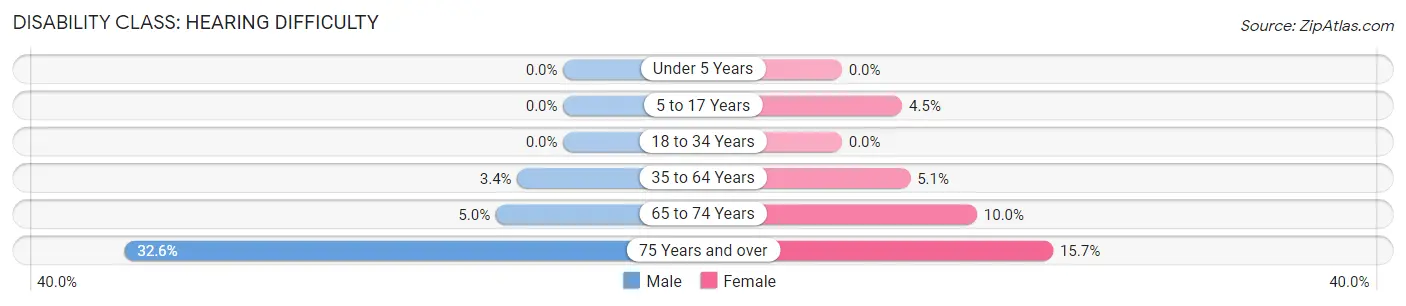
| Age Bracket | Male | Female |
| Under 5 Years | 0 (0.0%) | 0 (0.0%) |
| 5 to 17 Years | 0 (0.0%) | 71 (4.5%) |
| 18 to 34 Years | 0 (0.0%) | 0 (0.0%) |
| 35 to 64 Years | 92 (3.4%) | 129 (5.1%) |
| 65 to 74 Years | 30 (5.0%) | 94 (10.0%) |
| 75 Years and over | 131 (32.6%) | 124 (15.7%) |
Disability Class: Vision Difficulty
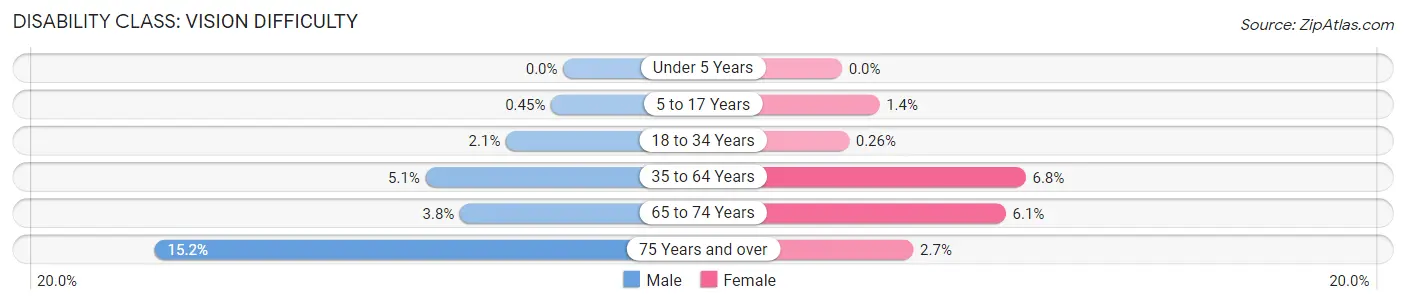
| Age Bracket | Male | Female |
| Under 5 Years | 0 (0.0%) | 0 (0.0%) |
| 5 to 17 Years | 5 (0.4%) | 22 (1.4%) |
| 18 to 34 Years | 36 (2.1%) | 4 (0.3%) |
| 35 to 64 Years | 138 (5.1%) | 173 (6.8%) |
| 65 to 74 Years | 23 (3.8%) | 57 (6.1%) |
| 75 Years and over | 61 (15.2%) | 21 (2.6%) |
Disability Class: Cognitive Difficulty
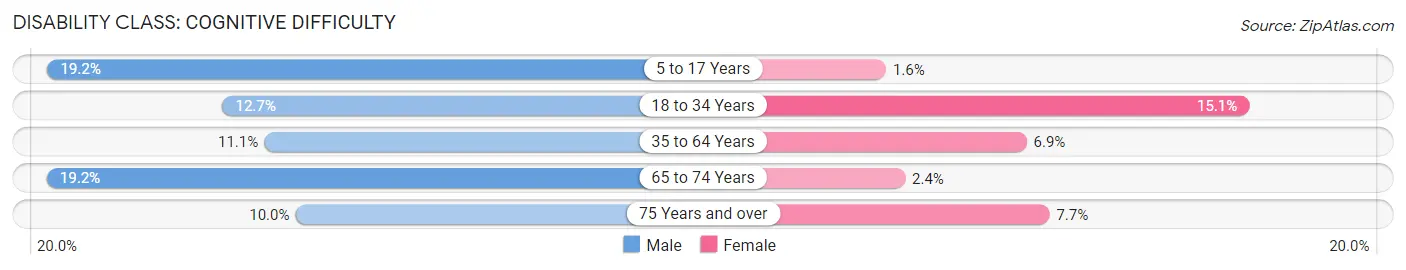
| Age Bracket | Male | Female |
| 5 to 17 Years | 215 (19.2%) | 26 (1.6%) |
| 18 to 34 Years | 215 (12.7%) | 234 (15.1%) |
| 35 to 64 Years | 300 (11.1%) | 174 (6.9%) |
| 65 to 74 Years | 115 (19.2%) | 22 (2.4%) |
| 75 Years and over | 40 (10.0%) | 61 (7.7%) |
Disability Class: Ambulatory Difficulty
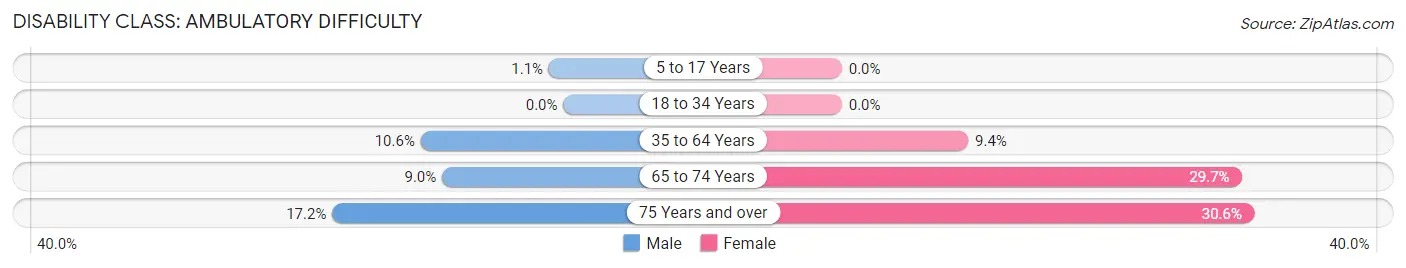
| Age Bracket | Male | Female |
| 5 to 17 Years | 12 (1.1%) | 0 (0.0%) |
| 18 to 34 Years | 0 (0.0%) | 0 (0.0%) |
| 35 to 64 Years | 286 (10.6%) | 238 (9.4%) |
| 65 to 74 Years | 54 (9.0%) | 278 (29.7%) |
| 75 Years and over | 69 (17.2%) | 242 (30.6%) |
Disability Class: Self-Care Difficulty
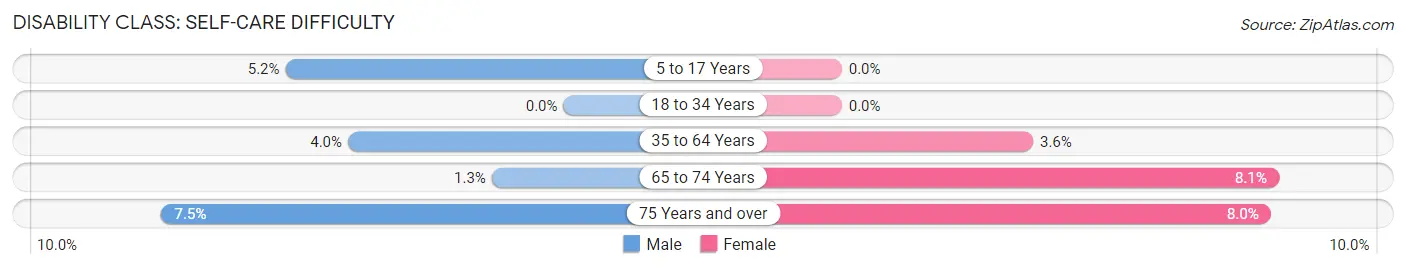
| Age Bracket | Male | Female |
| 5 to 17 Years | 58 (5.2%) | 0 (0.0%) |
| 18 to 34 Years | 0 (0.0%) | 0 (0.0%) |
| 35 to 64 Years | 108 (4.0%) | 90 (3.5%) |
| 65 to 74 Years | 8 (1.3%) | 76 (8.1%) |
| 75 Years and over | 30 (7.5%) | 63 (8.0%) |
Technology Access in Farmington
Computing Device Access in Farmington
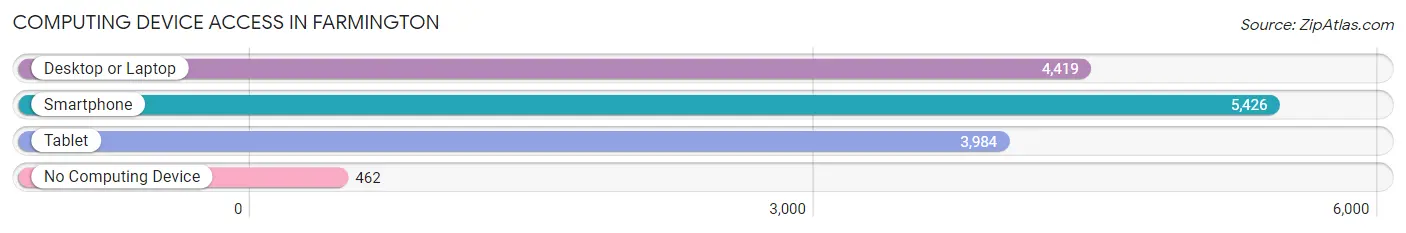
| Device Type | # Households | % Households |
| Desktop or Laptop | 4,419 | 71.2% |
| Smartphone | 5,426 | 87.5% |
| Tablet | 3,984 | 64.2% |
| No Computing Device | 462 | 7.4% |
| Total | 6,205 | 100.0% |
Internet Access in Farmington
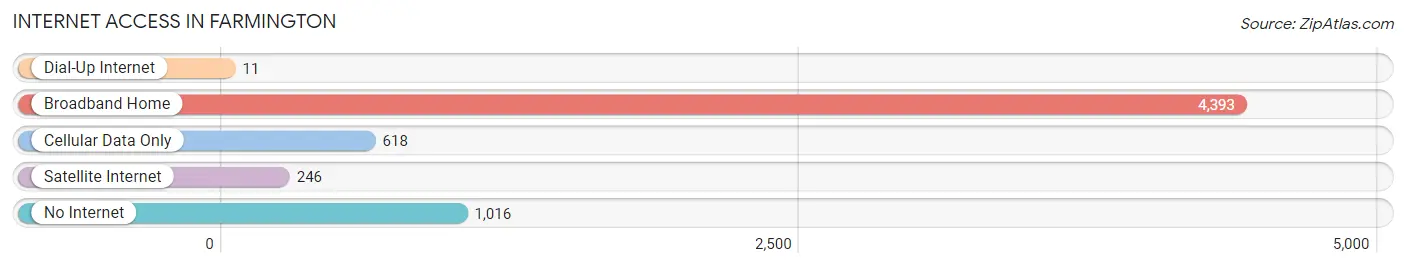
| Internet Type | # Households | % Households |
| Dial-Up Internet | 11 | 0.2% |
| Broadband Home | 4,393 | 70.8% |
| Cellular Data Only | 618 | 10.0% |
| Satellite Internet | 246 | 4.0% |
| No Internet | 1,016 | 16.4% |
| Total | 6,205 | 100.0% |
Farmington Summary
History
The city of Farmington, Missouri is located in St. Francois County in the southeastern part of the state. It is situated on the banks of the St. Francis River and is the county seat. The city was founded in 1822 and was originally known as Murphy’s Settlement. The name was changed to Farmington in 1827.
The city was an important stop on the St. Louis-San Francisco Railway, which was built in the late 19th century. This railway connected the city to St. Louis and other major cities in the Midwest. The city was also an important stop on the Missouri Pacific Railroad, which was built in the early 20th century.
The city was home to several industries, including a brickyard, a flour mill, a sawmill, and a furniture factory. The city also had a large number of farms, which provided the city with a steady supply of food and other goods.
The city was also home to a number of educational institutions, including the Farmington Normal School, which was established in 1873. The school was later renamed the Farmington State Teachers College and then the Southeast Missouri State University.
Geography
Farmington is located in the southeastern part of Missouri, in St. Francois County. The city is situated on the banks of the St. Francis River and is surrounded by rolling hills and forests. The city is located about 60 miles south of St. Louis and about 40 miles north of Cape Girardeau.
The city has a total area of 8.3 square miles, of which 8.2 square miles is land and 0.1 square miles is water. The city has a humid subtropical climate, with hot, humid summers and mild winters.
Economy
The economy of Farmington is largely based on agriculture and manufacturing. The city is home to several large farms, which produce a variety of crops, including corn, soybeans, wheat, and hay. The city is also home to several manufacturing companies, including a furniture factory, a brickyard, and a flour mill.
The city is also home to several retail stores, restaurants, and other businesses. The city is also home to Southeast Missouri State University, which provides a variety of educational and cultural opportunities for the city’s residents.
Demographics
As of the 2010 census, the city of Farmington had a population of 16,240. The racial makeup of the city was 87.3% White, 8.2% African American, 0.4% Native American, 0.7% Asian, 0.1% Pacific Islander, 1.2% from other races, and 2.1% from two or more races. Hispanic or Latino of any race were 3.2% of the population.
The median income for a household in the city was $37,917, and the median income for a family was $45,945. The per capita income for the city was $19,845. About 11.2% of families and 14.2% of the population were below the poverty line, including 19.2% of those under age 18 and 8.2% of those age 65 or over.
Common Questions
What is Per Capita Income in Farmington?
Per Capita income in Farmington is $24,281.
What is the Median Family Income in Farmington?
Median Family Income in Farmington is $56,087.
What is the Median Household income in Farmington?
Median Household Income in Farmington is $49,317.
What is Income or Wage Gap in Farmington?
Income or Wage Gap in Farmington is 24.4%.
Women in Farmington earn 75.6 cents for every dollar earned by a man.
What is Inequality or Gini Index in Farmington?
Inequality or Gini Index in Farmington is 0.45.
What is the Total Population of Farmington?
Total Population of Farmington is 17,859.
What is the Total Male Population of Farmington?
Total Male Population of Farmington is 9,822.
What is the Total Female Population of Farmington?
Total Female Population of Farmington is 8,037.
What is the Ratio of Males per 100 Females in Farmington?
There are 122.21 Males per 100 Females in Farmington.
What is the Ratio of Females per 100 Males in Farmington?
There are 81.83 Females per 100 Males in Farmington.
What is the Median Population Age in Farmington?
Median Population Age in Farmington is 38.0 Years.
What is the Average Family Size in Farmington
Average Family Size in Farmington is 3.0 People.
What is the Average Household Size in Farmington
Average Household Size in Farmington is 2.4 People.
How Large is the Labor Force in Farmington?
There are 6,669 People in the Labor Forcein in Farmington.
What is the Percentage of People in the Labor Force in Farmington?
45.1% of People are in the Labor Force in Farmington.
What is the Unemployment Rate in Farmington?
Unemployment Rate in Farmington is 4.3%.