Bonne Terre, MO Map & Demographics
Bonne Terre Map
Bonne Terre Overview
$15,744
PER CAPITA INCOME
$47,893
AVG FAMILY INCOME
$34,409
AVG HOUSEHOLD INCOME
21.0%
WAGE / INCOME GAP [ % ]
79.0¢/ $1
WAGE / INCOME GAP [ $ ]
0.47
INEQUALITY / GINI INDEX
6,863
TOTAL POPULATION
4,577
MALE POPULATION
2,286
FEMALE POPULATION
200.22
MALES / 100 FEMALES
49.95
FEMALES / 100 MALES
39.0
MEDIAN AGE
3.5
AVG FAMILY SIZE
2.6
AVG HOUSEHOLD SIZE
2,128
LABOR FORCE [ PEOPLE ]
34.9%
PERCENT IN LABOR FORCE
3.7%
UNEMPLOYMENT RATE
Bonne Terre Zip Codes
Bonne Terre Area Codes
Income in Bonne Terre
Income Overview in Bonne Terre
Per Capita Income in Bonne Terre is $15,744, while median incomes of families and households are $47,893 and $34,409 respectively.
| Characteristic | Number | Measure |
| Per Capita Income | 6,863 | $15,744 |
| Median Family Income | 1,116 | $47,893 |
| Mean Family Income | 1,116 | $70,163 |
| Median Household Income | 1,820 | $34,409 |
| Mean Household Income | 1,820 | $54,601 |
| Income Deficit | 1,116 | $0 |
| Wage / Income Gap (%) | 6,863 | 21.01% |
| Wage / Income Gap ($) | 6,863 | 78.99¢ per $1 |
| Gini / Inequality Index | 6,863 | 0.47 |
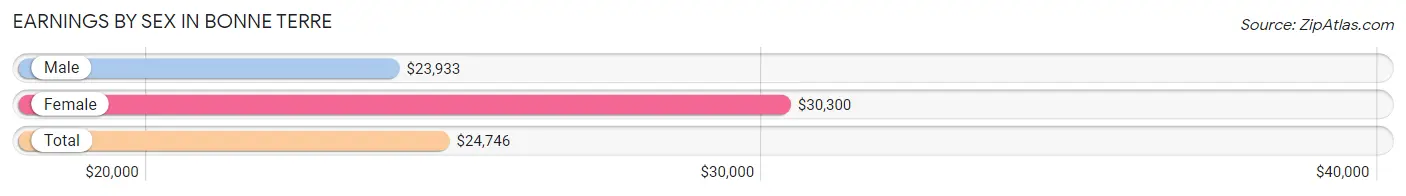
Earnings by Sex in Bonne Terre
Average Earnings in Bonne Terre are $24,746, $23,933 for men and $30,300 for women, a difference of 21.0%.
| Sex | Number | Average Earnings |
| Male | 1,738 (68.0%) | $23,933 |
| Female | 816 (32.0%) | $30,300 |
| Total | 2,554 (100.0%) | $24,746 |
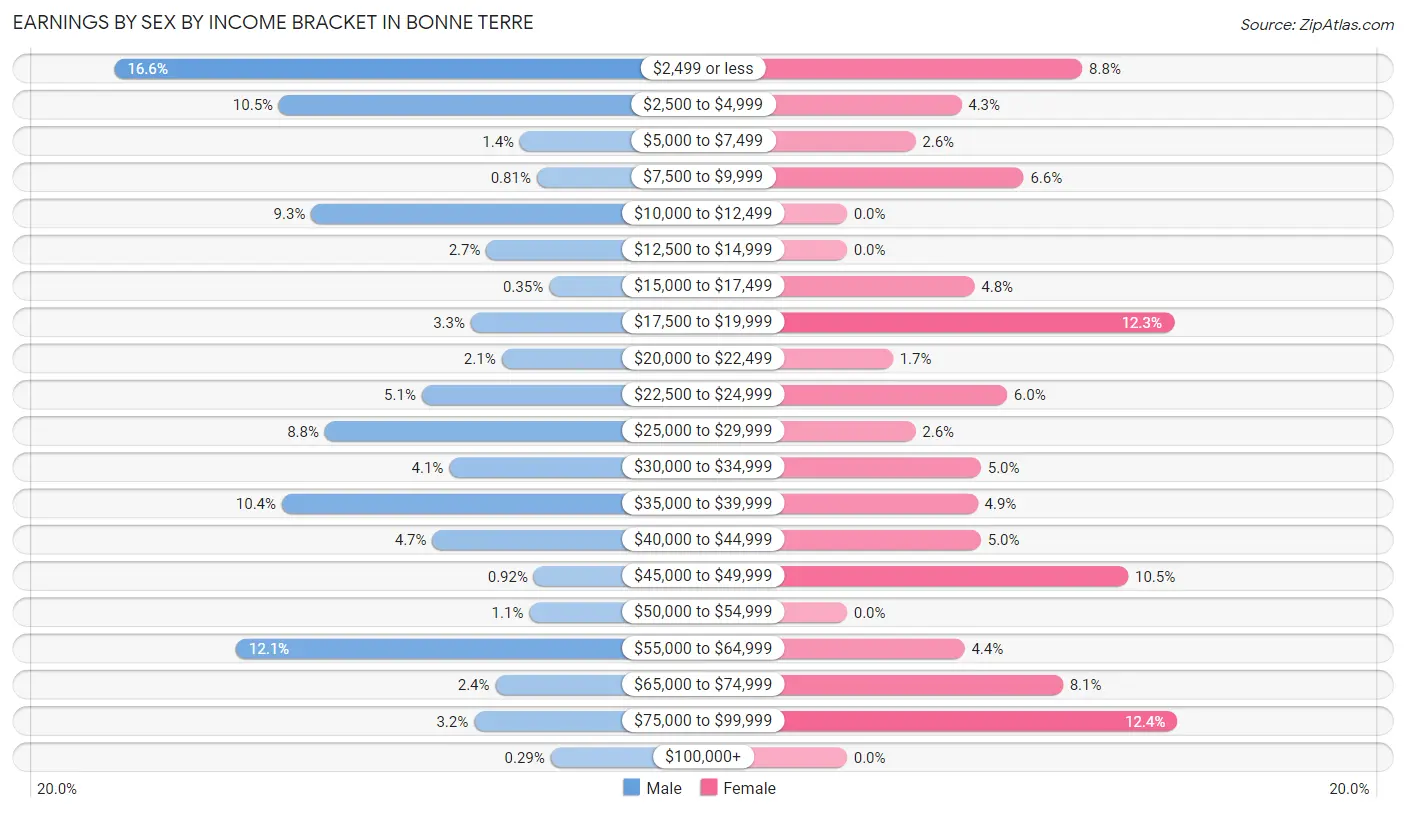
Earnings by Sex by Income Bracket in Bonne Terre
The most common earnings brackets in Bonne Terre are $2,499 or less for men (289 | 16.6%) and $75,000 to $99,999 for women (101 | 12.4%).
| Income | Male | Female |
| $2,499 or less | 289 (16.6%) | 72 (8.8%) |
| $2,500 to $4,999 | 182 (10.5%) | 35 (4.3%) |
| $5,000 to $7,499 | 25 (1.4%) | 21 (2.6%) |
| $7,500 to $9,999 | 14 (0.8%) | 54 (6.6%) |
| $10,000 to $12,499 | 161 (9.3%) | 0 (0.0%) |
| $12,500 to $14,999 | 47 (2.7%) | 0 (0.0%) |
| $15,000 to $17,499 | 6 (0.4%) | 39 (4.8%) |
| $17,500 to $19,999 | 57 (3.3%) | 100 (12.2%) |
| $20,000 to $22,499 | 37 (2.1%) | 14 (1.7%) |
| $22,500 to $24,999 | 89 (5.1%) | 49 (6.0%) |
| $25,000 to $29,999 | 152 (8.7%) | 21 (2.6%) |
| $30,000 to $34,999 | 71 (4.1%) | 41 (5.0%) |
| $35,000 to $39,999 | 180 (10.4%) | 40 (4.9%) |
| $40,000 to $44,999 | 82 (4.7%) | 41 (5.0%) |
| $45,000 to $49,999 | 16 (0.9%) | 86 (10.5%) |
| $50,000 to $54,999 | 19 (1.1%) | 0 (0.0%) |
| $55,000 to $64,999 | 210 (12.1%) | 36 (4.4%) |
| $65,000 to $74,999 | 41 (2.4%) | 66 (8.1%) |
| $75,000 to $99,999 | 55 (3.2%) | 101 (12.4%) |
| $100,000+ | 5 (0.3%) | 0 (0.0%) |
| Total | 1,738 (100.0%) | 816 (100.0%) |
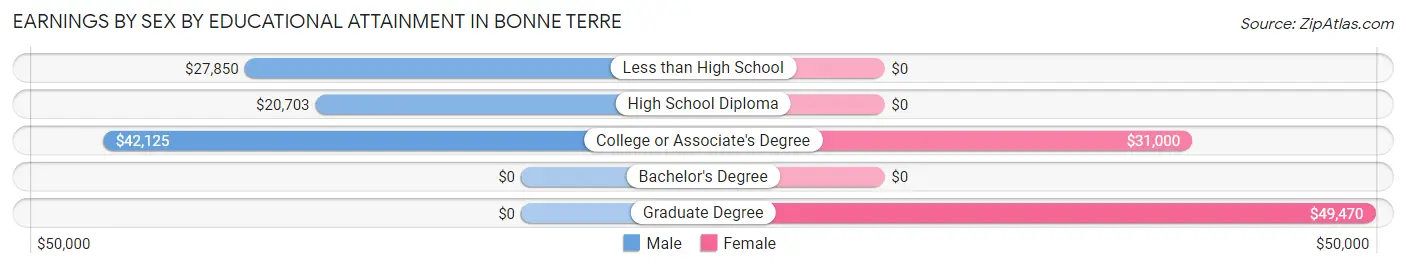
Earnings by Sex by Educational Attainment in Bonne Terre
Average earnings in Bonne Terre are $27,410 for men and $38,882 for women, a difference of 29.5%. Men with an educational attainment of college or associate's degree enjoy the highest average annual earnings of $42,125, while those with high school diploma education earn the least with $20,703. Women with an educational attainment of graduate degree earn the most with the average annual earnings of $49,470, while those with college or associate's degree education have the smallest earnings of $31,000.
| Educational Attainment | Male Income | Female Income |
| Less than High School | $27,850 | $0 |
| High School Diploma | $20,703 | $0 |
| College or Associate's Degree | $42,125 | $31,000 |
| Bachelor's Degree | - | - |
| Graduate Degree | - | - |
| Total | $27,410 | $38,882 |
Family Income in Bonne Terre
Family Income Brackets in Bonne Terre
According to the Bonne Terre family income data, there are 252 families falling into the $35,000 to $49,999 income range, which is the most common income bracket and makes up 22.6% of all families.
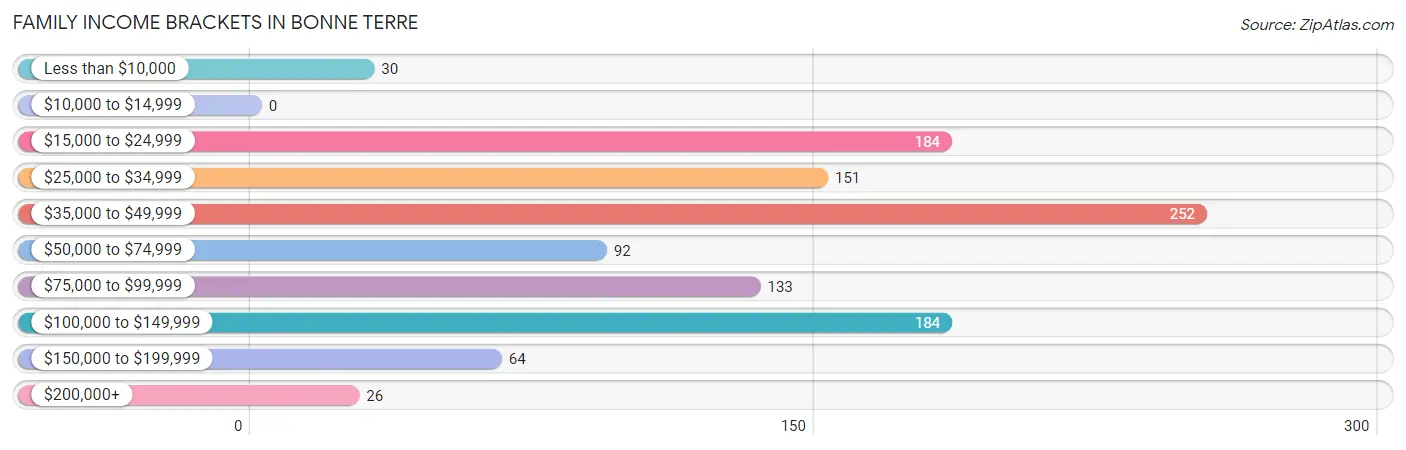
| Income Bracket | # Families | % Families |
| Less than $10,000 | 30 | 2.7% |
| $10,000 to $14,999 | 0 | 0.0% |
| $15,000 to $24,999 | 184 | 16.5% |
| $25,000 to $34,999 | 151 | 13.5% |
| $35,000 to $49,999 | 252 | 22.6% |
| $50,000 to $74,999 | 92 | 8.2% |
| $75,000 to $99,999 | 133 | 11.9% |
| $100,000 to $149,999 | 184 | 16.5% |
| $150,000 to $199,999 | 64 | 5.7% |
| $200,000+ | 26 | 2.3% |
Family Income by Famaliy Size in Bonne Terre
4-person families (134 | 12.0%) account for the highest median family income in Bonne Terre with $143,771 per family, while 4-person families (134 | 12.0%) have the highest median income of $35,943 per family member.
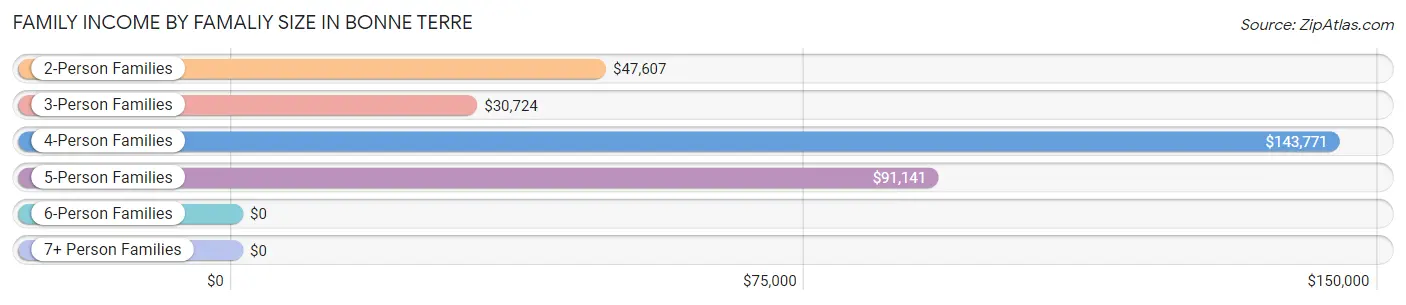
| Income Bracket | # Families | Median Income |
| 2-Person Families | 362 (32.4%) | $47,607 |
| 3-Person Families | 342 (30.6%) | $30,724 |
| 4-Person Families | 134 (12.0%) | $143,771 |
| 5-Person Families | 196 (17.6%) | $91,141 |
| 6-Person Families | 82 (7.3%) | $0 |
| 7+ Person Families | 0 (0.0%) | $0 |
| Total | 1,116 (100.0%) | $47,893 |
Family Income by Number of Earners in Bonne Terre
The median family income in Bonne Terre is $47,893, with families comprising 3+ earners (251) having the highest median family income of $101,063, while families with 1 earner (371) have the lowest median family income of $28,856, accounting for 22.5% and 33.2% of families, respectively.
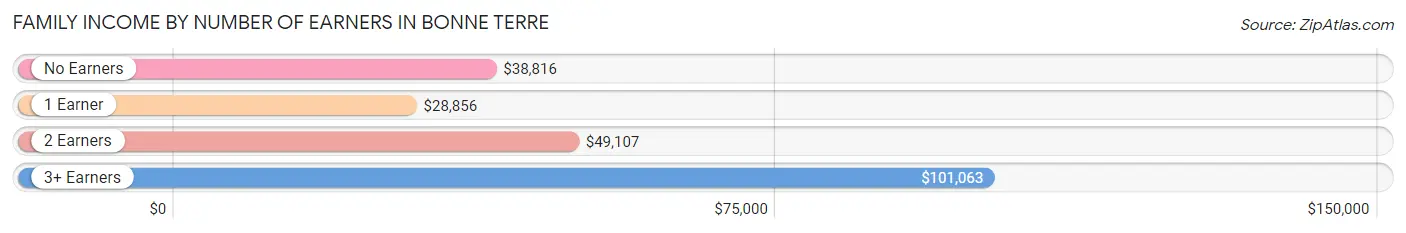
| Number of Earners | # Families | Median Income |
| No Earners | 136 (12.2%) | $38,816 |
| 1 Earner | 371 (33.2%) | $28,856 |
| 2 Earners | 358 (32.1%) | $49,107 |
| 3+ Earners | 251 (22.5%) | $101,063 |
| Total | 1,116 (100.0%) | $47,893 |
Household Income in Bonne Terre
Household Income Brackets in Bonne Terre
With 406 households falling in the category, the $15,000 to $24,999 income range is the most frequent in Bonne Terre, accounting for 22.3% of all households. In contrast, only 25 households (1.4%) fall into the $200,000+ income bracket, making it the least populous group.
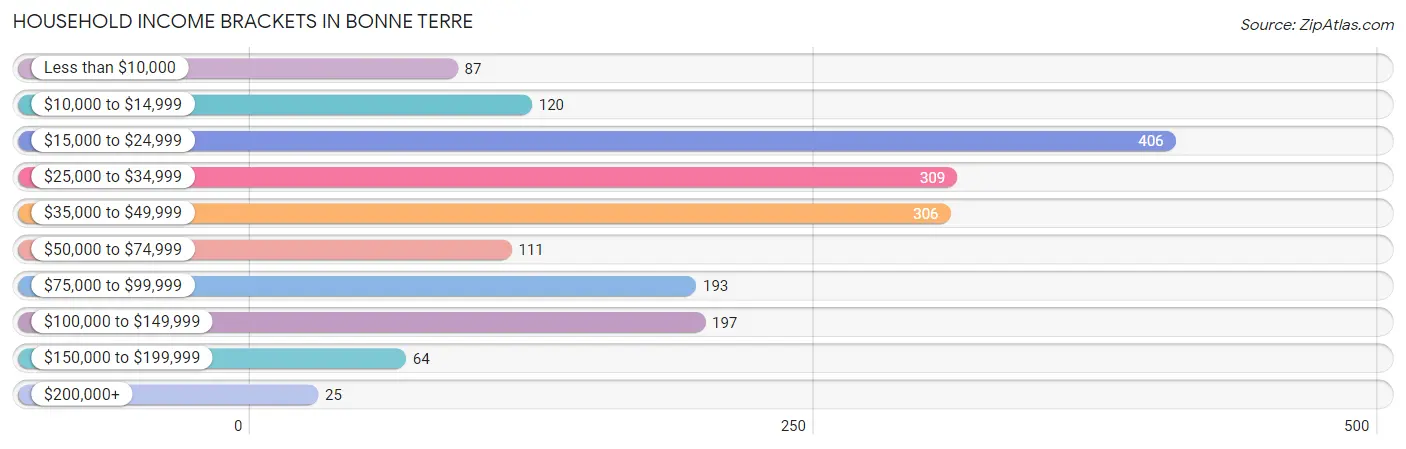
| Income Bracket | # Households | % Households |
| Less than $10,000 | 87 | 4.8% |
| $10,000 to $14,999 | 120 | 6.6% |
| $15,000 to $24,999 | 406 | 22.3% |
| $25,000 to $34,999 | 309 | 17.0% |
| $35,000 to $49,999 | 306 | 16.8% |
| $50,000 to $74,999 | 111 | 6.1% |
| $75,000 to $99,999 | 193 | 10.6% |
| $100,000 to $149,999 | 197 | 10.8% |
| $150,000 to $199,999 | 64 | 3.5% |
| $200,000+ | 25 | 1.4% |
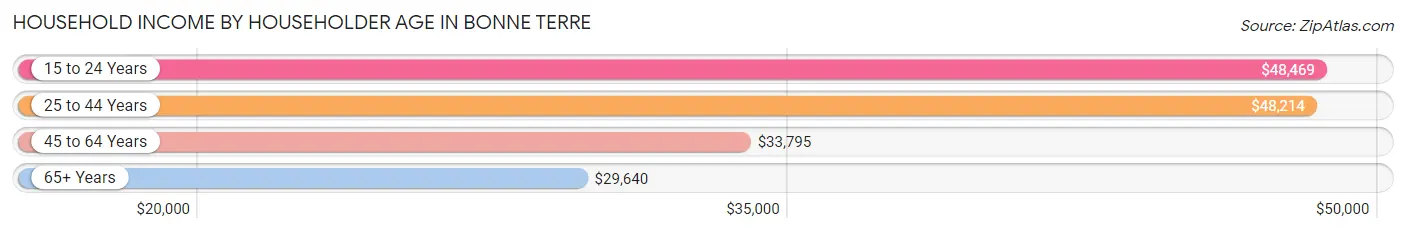
Household Income by Householder Age in Bonne Terre
The median household income in Bonne Terre is $34,409, with the highest median household income of $48,469 found in the 15 to 24 years age bracket for the primary householder. A total of 114 households (6.3%) fall into this category. Meanwhile, the 65+ years age bracket for the primary householder has the lowest median household income of $29,640, with 385 households (21.1%) in this group.
| Income Bracket | # Households | Median Income |
| 15 to 24 Years | 114 (6.3%) | $48,469 |
| 25 to 44 Years | 456 (25.1%) | $48,214 |
| 45 to 64 Years | 865 (47.5%) | $33,795 |
| 65+ Years | 385 (21.1%) | $29,640 |
| Total | 1,820 (100.0%) | $34,409 |
Poverty in Bonne Terre
Income Below Poverty by Sex and Age in Bonne Terre
With 35.1% poverty level for males and 34.5% for females among the residents of Bonne Terre, under 5 year old males and 5 year old females are the most vulnerable to poverty, with 72 males (100.0%) and 46 females (100.0%) in their respective age groups living below the poverty level.
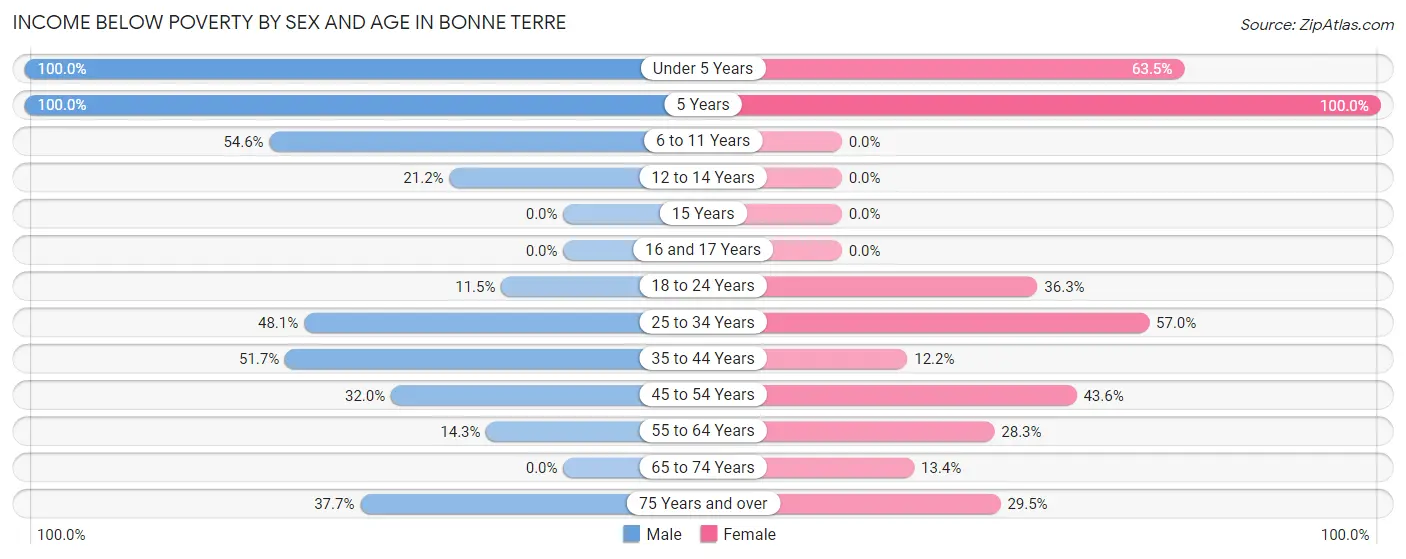
| Age Bracket | Male | Female |
| Under 5 Years | 72 (100.0%) | 108 (63.5%) |
| 5 Years | 38 (100.0%) | 46 (100.0%) |
| 6 to 11 Years | 120 (54.5%) | 0 (0.0%) |
| 12 to 14 Years | 11 (21.1%) | 0 (0.0%) |
| 15 Years | 0 (0.0%) | 0 (0.0%) |
| 16 and 17 Years | 0 (0.0%) | 0 (0.0%) |
| 18 to 24 Years | 60 (11.5%) | 57 (36.3%) |
| 25 to 34 Years | 206 (48.1%) | 235 (57.0%) |
| 35 to 44 Years | 172 (51.6%) | 31 (12.2%) |
| 45 to 54 Years | 157 (32.0%) | 98 (43.6%) |
| 55 to 64 Years | 38 (14.3%) | 79 (28.3%) |
| 65 to 74 Years | 0 (0.0%) | 20 (13.4%) |
| 75 Years and over | 23 (37.7%) | 86 (29.4%) |
| Total | 897 (35.1%) | 760 (34.5%) |
Income Above Poverty by Sex and Age in Bonne Terre
According to the poverty statistics in Bonne Terre, males aged 16 and 17 years and females aged 6 to 11 years are the age groups that are most secure financially, with 100.0% of males and 100.0% of females in these age groups living above the poverty line.
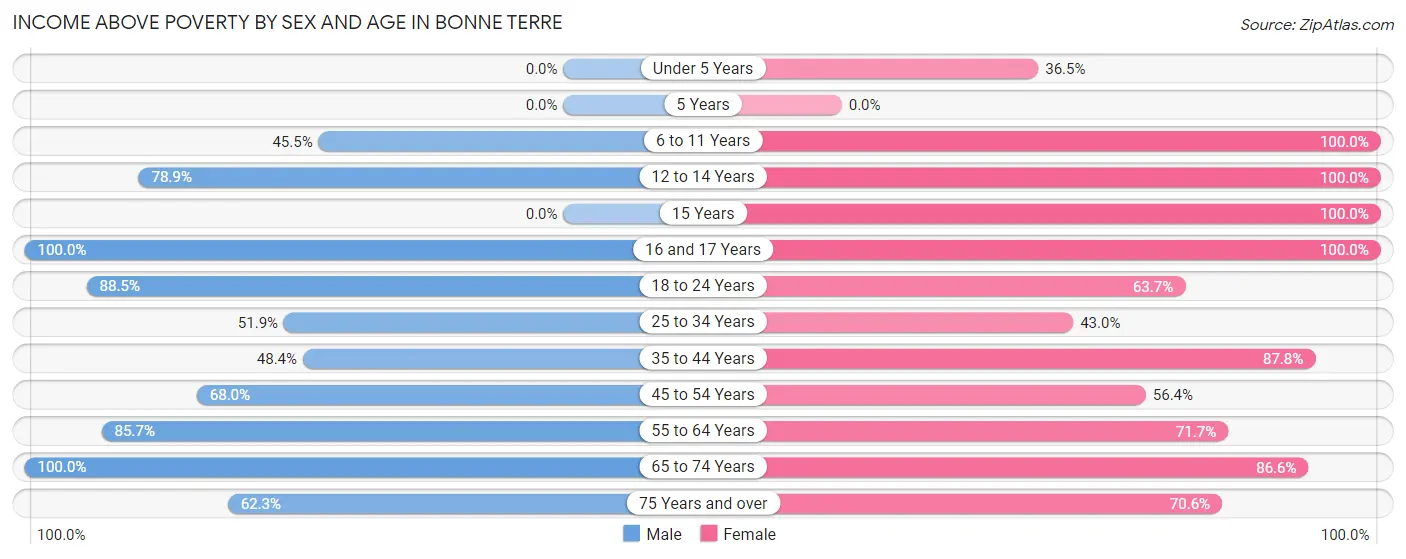
| Age Bracket | Male | Female |
| Under 5 Years | 0 (0.0%) | 62 (36.5%) |
| 5 Years | 0 (0.0%) | 0 (0.0%) |
| 6 to 11 Years | 100 (45.5%) | 73 (100.0%) |
| 12 to 14 Years | 41 (78.8%) | 21 (100.0%) |
| 15 Years | 0 (0.0%) | 73 (100.0%) |
| 16 and 17 Years | 14 (100.0%) | 49 (100.0%) |
| 18 to 24 Years | 461 (88.5%) | 100 (63.7%) |
| 25 to 34 Years | 222 (51.9%) | 177 (43.0%) |
| 35 to 44 Years | 161 (48.3%) | 224 (87.8%) |
| 45 to 54 Years | 334 (68.0%) | 127 (56.4%) |
| 55 to 64 Years | 228 (85.7%) | 200 (71.7%) |
| 65 to 74 Years | 60 (100.0%) | 129 (86.6%) |
| 75 Years and over | 38 (62.3%) | 206 (70.6%) |
| Total | 1,659 (64.9%) | 1,441 (65.5%) |
Income Below Poverty Among Married-Couple Families in Bonne Terre
The poverty statistics for married-couple families in Bonne Terre show that 25.5% or 225 of the total 881 families live below the poverty line. Families with 3 or 4 children have the highest poverty rate of 65.5%, comprising of 38 families. On the other hand, families with no children have the lowest poverty rate of 22.3%, which includes 122 families.
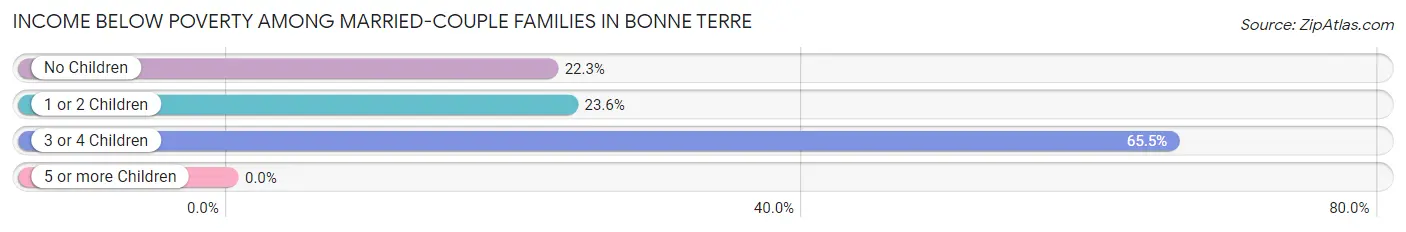
| Children | Above Poverty | Below Poverty |
| No Children | 426 (77.7%) | 122 (22.3%) |
| 1 or 2 Children | 210 (76.4%) | 65 (23.6%) |
| 3 or 4 Children | 20 (34.5%) | 38 (65.5%) |
| 5 or more Children | 0 (0.0%) | 0 (0.0%) |
| Total | 656 (74.5%) | 225 (25.5%) |
Income Below Poverty Among Single-Parent Households in Bonne Terre
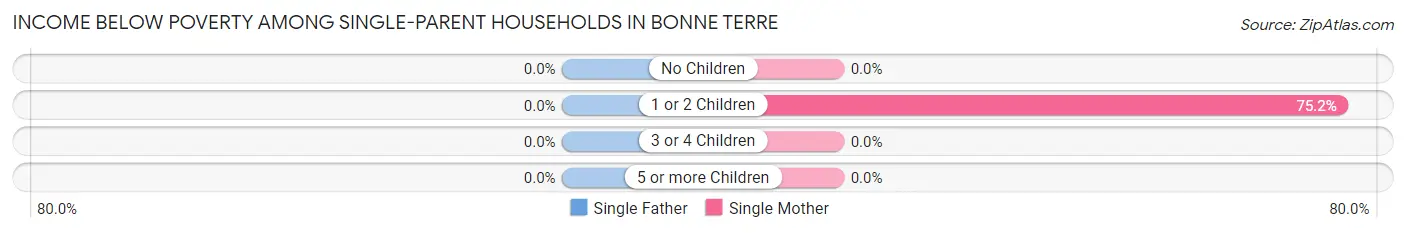
| Children | Single Father | Single Mother |
| No Children | 0 (0.0%) | 0 (0.0%) |
| 1 or 2 Children | 0 (0.0%) | 82 (75.2%) |
| 3 or 4 Children | 0 (0.0%) | 0 (0.0%) |
| 5 or more Children | 0 (0.0%) | 0 (0.0%) |
| Total | 0 (0.0%) | 82 (38.3%) |
Income Below Poverty Among Married-Couple vs Single-Parent Households in Bonne Terre
The poverty data for Bonne Terre shows that 225 of the married-couple family households (25.5%) and 82 of the single-parent households (34.9%) are living below the poverty level. Within the married-couple family households, those with 3 or 4 children have the highest poverty rate, with 38 households (65.5%) falling below the poverty line. Among the single-parent households, those with 1 or 2 children have the highest poverty rate, with 82 household (75.2%) living below poverty.
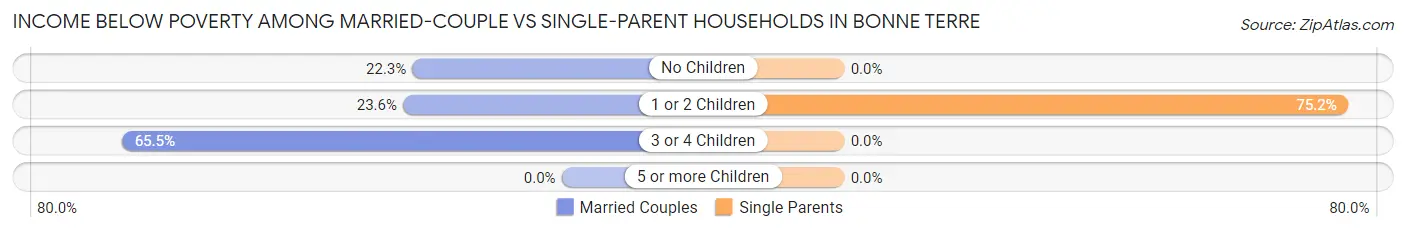
| Children | Married-Couple Families | Single-Parent Households |
| No Children | 122 (22.3%) | 0 (0.0%) |
| 1 or 2 Children | 65 (23.6%) | 82 (75.2%) |
| 3 or 4 Children | 38 (65.5%) | 0 (0.0%) |
| 5 or more Children | 0 (0.0%) | 0 (0.0%) |
| Total | 225 (25.5%) | 82 (34.9%) |
Race in Bonne Terre
The most populous races in Bonne Terre are White / Caucasian (5,411 | 78.8%), Black / African American (793 | 11.6%), and Two or more Races (443 | 6.5%).
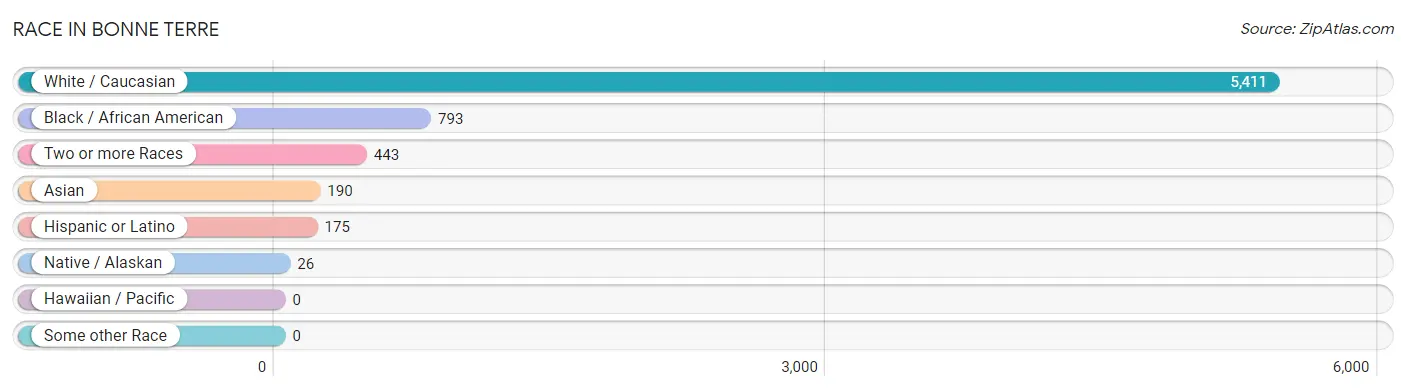
| Race | # Population | % Population |
| Asian | 190 | 2.8% |
| Black / African American | 793 | 11.6% |
| Hawaiian / Pacific | 0 | 0.0% |
| Hispanic or Latino | 175 | 2.5% |
| Native / Alaskan | 26 | 0.4% |
| White / Caucasian | 5,411 | 78.8% |
| Two or more Races | 443 | 6.5% |
| Some other Race | 0 | 0.0% |
| Total | 6,863 | 100.0% |
Ancestry in Bonne Terre
The most populous ancestries reported in Bonne Terre are German (1,292 | 18.8%), English (1,060 | 15.4%), American (878 | 12.8%), Irish (829 | 12.1%), and French (350 | 5.1%), together accounting for 64.3% of all Bonne Terre residents.
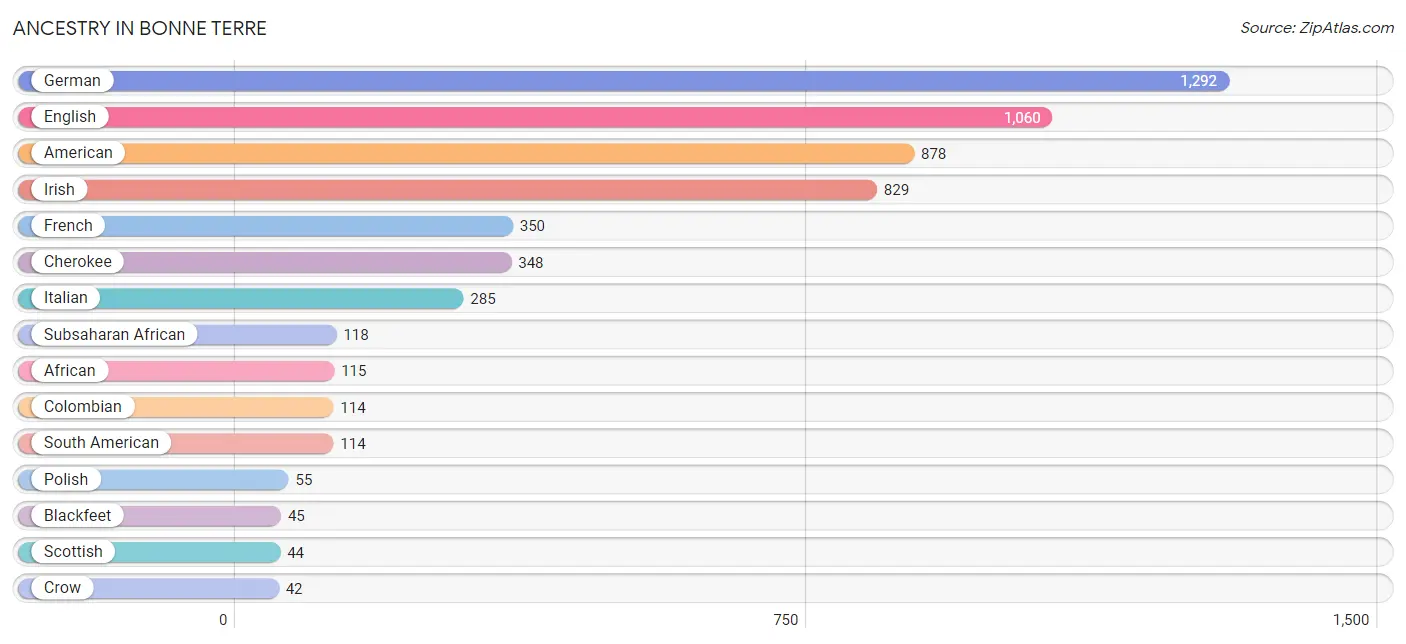
| Ancestry | # Population | % Population |
| African | 115 | 1.7% |
| American | 878 | 12.8% |
| Apache | 29 | 0.4% |
| Arab | 7 | 0.1% |
| Australian | 4 | 0.1% |
| Blackfeet | 45 | 0.7% |
| British | 3 | 0.0% |
| Cherokee | 348 | 5.1% |
| Colombian | 114 | 1.7% |
| Comanche | 5 | 0.1% |
| Creek | 3 | 0.0% |
| Crow | 42 | 0.6% |
| Dutch | 28 | 0.4% |
| English | 1,060 | 15.4% |
| European | 15 | 0.2% |
| French | 350 | 5.1% |
| German | 1,292 | 18.8% |
| Irish | 829 | 12.1% |
| Iroquois | 2 | 0.0% |
| Italian | 285 | 4.2% |
| Jamaican | 5 | 0.1% |
| Mexican | 40 | 0.6% |
| Moroccan | 7 | 0.1% |
| Norwegian | 6 | 0.1% |
| Pakistani | 5 | 0.1% |
| Polish | 55 | 0.8% |
| Russian | 25 | 0.4% |
| Scotch-Irish | 15 | 0.2% |
| Scottish | 44 | 0.6% |
| Slovak | 14 | 0.2% |
| Somali | 3 | 0.0% |
| South American | 114 | 1.7% |
| Subsaharan African | 118 | 1.7% |
| Swedish | 5 | 0.1% | View All 34 Rows |
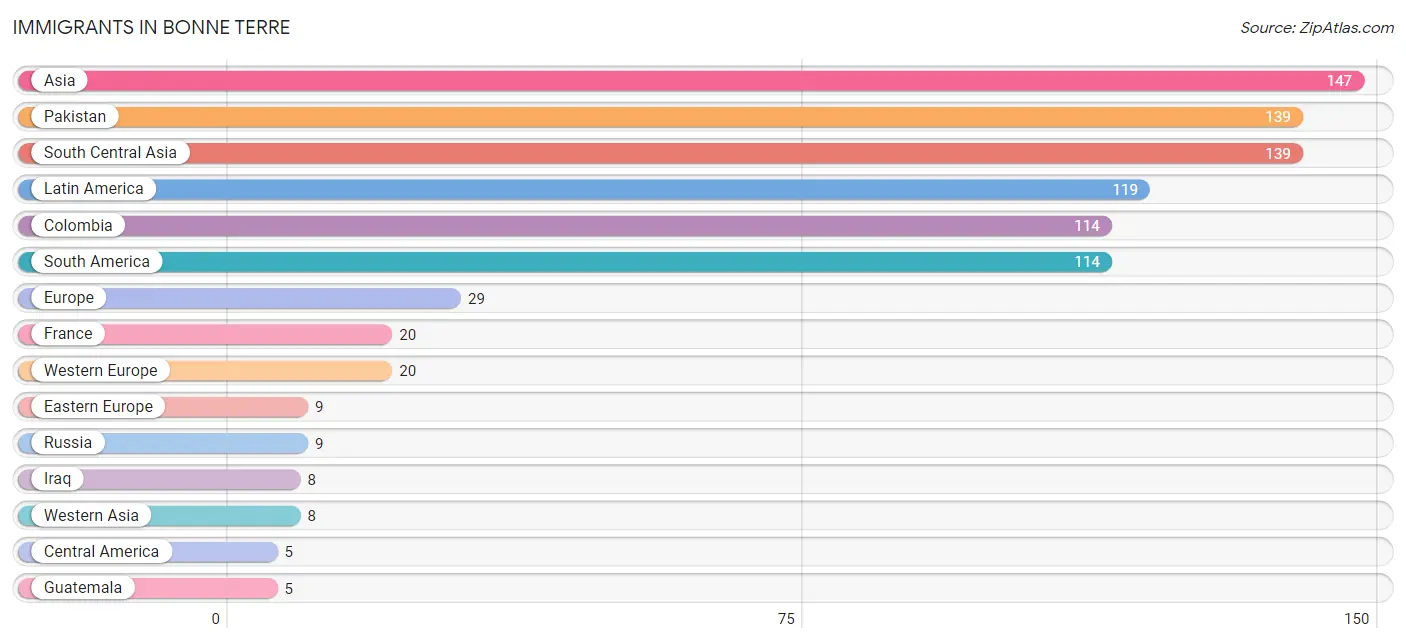
Immigrants in Bonne Terre
The most numerous immigrant groups reported in Bonne Terre came from Asia (147 | 2.1%), Pakistan (139 | 2.0%), South Central Asia (139 | 2.0%), Latin America (119 | 1.7%), and Colombia (114 | 1.7%), together accounting for 9.6% of all Bonne Terre residents.
| Immigration Origin | # Population | % Population |
| Asia | 147 | 2.1% |
| Central America | 5 | 0.1% |
| Colombia | 114 | 1.7% |
| Eastern Europe | 9 | 0.1% |
| Europe | 29 | 0.4% |
| France | 20 | 0.3% |
| Guatemala | 5 | 0.1% |
| Iraq | 8 | 0.1% |
| Latin America | 119 | 1.7% |
| Pakistan | 139 | 2.0% |
| Russia | 9 | 0.1% |
| South America | 114 | 1.7% |
| South Central Asia | 139 | 2.0% |
| Western Asia | 8 | 0.1% |
| Western Europe | 20 | 0.3% | View All 15 Rows |
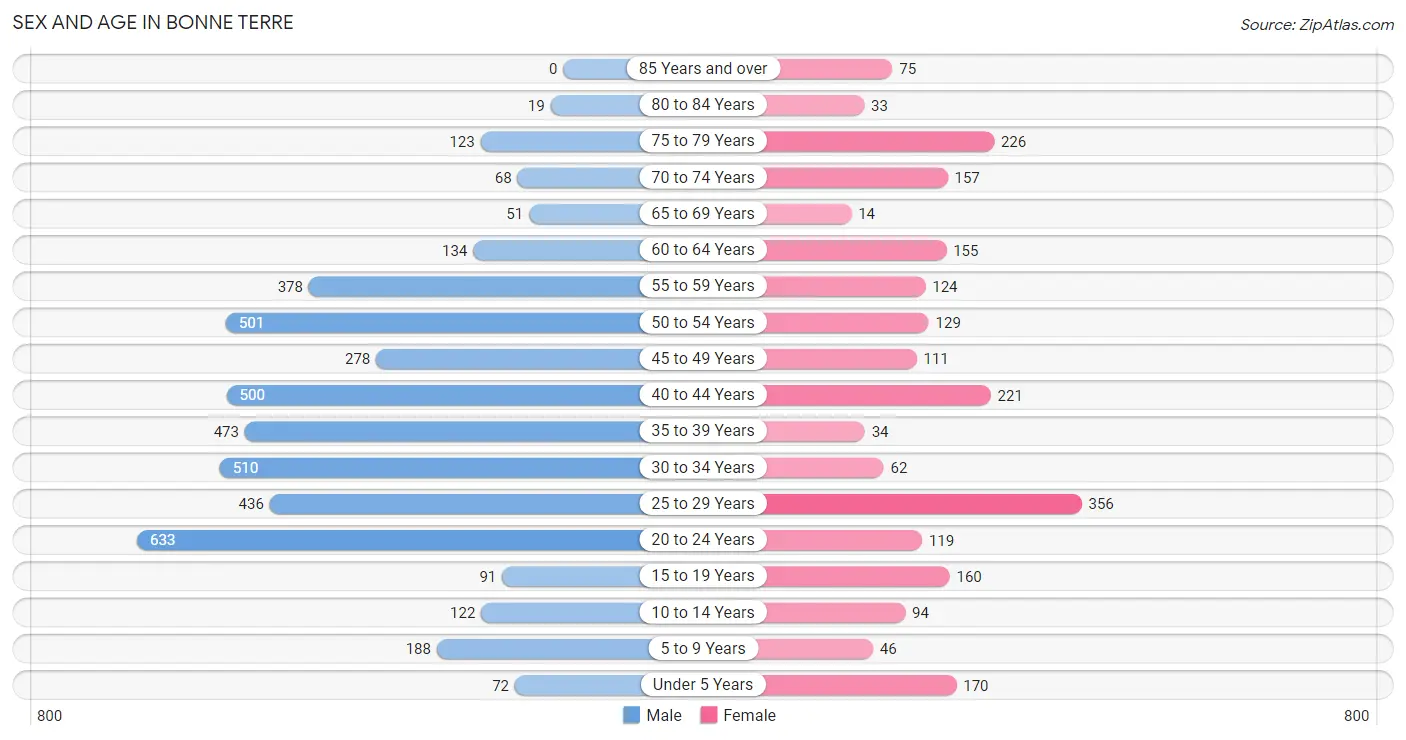
Sex and Age in Bonne Terre
Sex and Age in Bonne Terre
The most populous age groups in Bonne Terre are 20 to 24 Years (633 | 13.8%) for men and 25 to 29 Years (356 | 15.6%) for women.
| Age Bracket | Male | Female |
| Under 5 Years | 72 (1.6%) | 170 (7.4%) |
| 5 to 9 Years | 188 (4.1%) | 46 (2.0%) |
| 10 to 14 Years | 122 (2.7%) | 94 (4.1%) |
| 15 to 19 Years | 91 (2.0%) | 160 (7.0%) |
| 20 to 24 Years | 633 (13.8%) | 119 (5.2%) |
| 25 to 29 Years | 436 (9.5%) | 356 (15.6%) |
| 30 to 34 Years | 510 (11.1%) | 62 (2.7%) |
| 35 to 39 Years | 473 (10.3%) | 34 (1.5%) |
| 40 to 44 Years | 500 (10.9%) | 221 (9.7%) |
| 45 to 49 Years | 278 (6.1%) | 111 (4.9%) |
| 50 to 54 Years | 501 (11.0%) | 129 (5.6%) |
| 55 to 59 Years | 378 (8.3%) | 124 (5.4%) |
| 60 to 64 Years | 134 (2.9%) | 155 (6.8%) |
| 65 to 69 Years | 51 (1.1%) | 14 (0.6%) |
| 70 to 74 Years | 68 (1.5%) | 157 (6.9%) |
| 75 to 79 Years | 123 (2.7%) | 226 (9.9%) |
| 80 to 84 Years | 19 (0.4%) | 33 (1.4%) |
| 85 Years and over | 0 (0.0%) | 75 (3.3%) |
| Total | 4,577 (100.0%) | 2,286 (100.0%) |
Families and Households in Bonne Terre
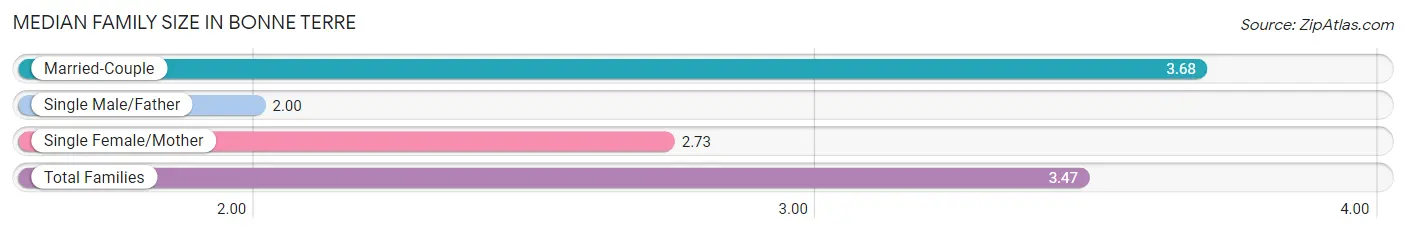
Median Family Size in Bonne Terre
The median family size in Bonne Terre is 3.47 persons per family, with married-couple families (881 | 78.9%) accounting for the largest median family size of 3.68 persons per family. On the other hand, single male/father families (21 | 1.9%) represent the smallest median family size with 2.00 persons per family.
| Family Type | # Families | Family Size |
| Married-Couple | 881 (78.9%) | 3.68 |
| Single Male/Father | 21 (1.9%) | 2.00 |
| Single Female/Mother | 214 (19.2%) | 2.73 |
| Total Families | 1,116 (100.0%) | 3.47 |
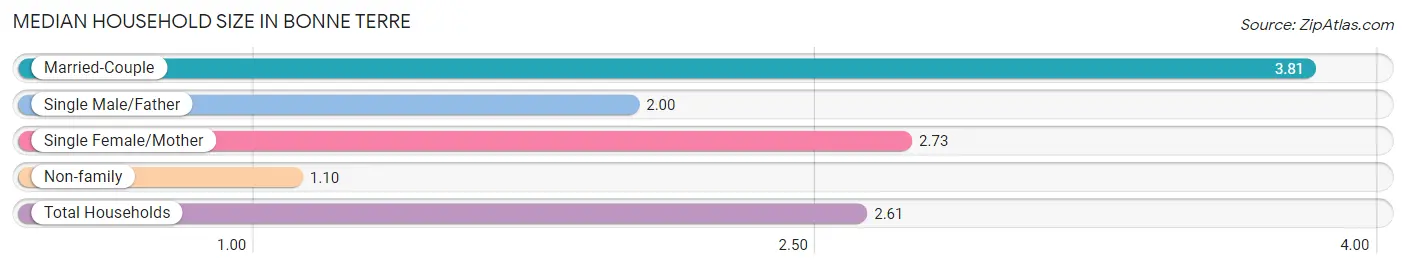
Median Household Size in Bonne Terre
The median household size in Bonne Terre is 2.61 persons per household, with married-couple households (881 | 48.4%) accounting for the largest median household size of 3.81 persons per household. non-family households (704 | 38.7%) represent the smallest median household size with 1.10 persons per household.
| Household Type | # Households | Household Size |
| Married-Couple | 881 (48.4%) | 3.81 |
| Single Male/Father | 21 (1.1%) | 2.00 |
| Single Female/Mother | 214 (11.8%) | 2.73 |
| Non-family | 704 (38.7%) | 1.10 |
| Total Households | 1,820 (100.0%) | 2.61 |
Household Size by Marriage Status in Bonne Terre
Out of a total of 1,820 households in Bonne Terre, 1,116 (61.3%) are family households, while 704 (38.7%) are nonfamily households. The most numerous type of family households are 2-person households, comprising 362, and the most common type of nonfamily households are 1-person households, comprising 662.
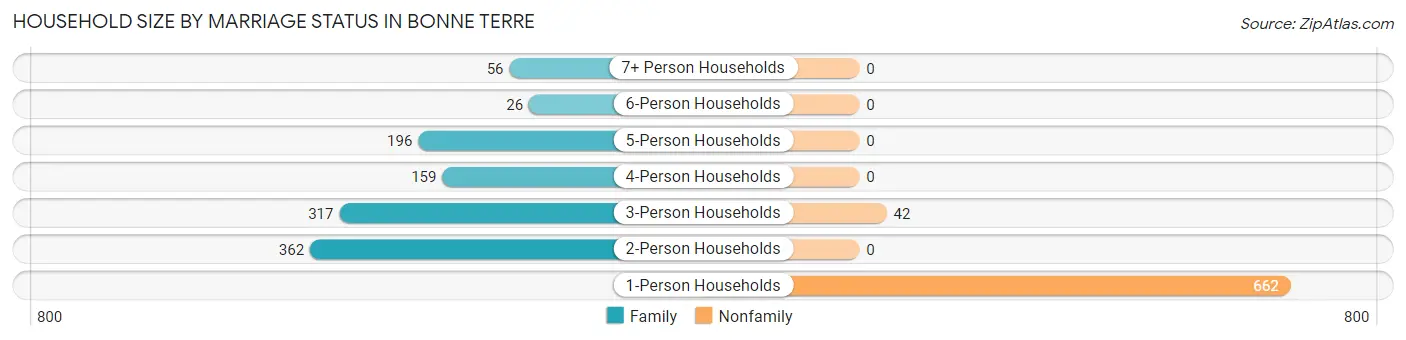
| Household Size | Family Households | Nonfamily Households |
| 1-Person Households | - | 662 (36.4%) |
| 2-Person Households | 362 (19.9%) | 0 (0.0%) |
| 3-Person Households | 317 (17.4%) | 42 (2.3%) |
| 4-Person Households | 159 (8.7%) | 0 (0.0%) |
| 5-Person Households | 196 (10.8%) | 0 (0.0%) |
| 6-Person Households | 26 (1.4%) | 0 (0.0%) |
| 7+ Person Households | 56 (3.1%) | 0 (0.0%) |
| Total | 1,116 (61.3%) | 704 (38.7%) |
Female Fertility in Bonne Terre
Fertility by Age in Bonne Terre
Average fertility rate in Bonne Terre is 155.0 births per 1,000 women. Women in the age bracket of 20 to 34 years have the highest fertility rate with 315.0 births per 1,000 women. Women in the age bracket of 20 to 34 years acount for 100.0% of all women with births.
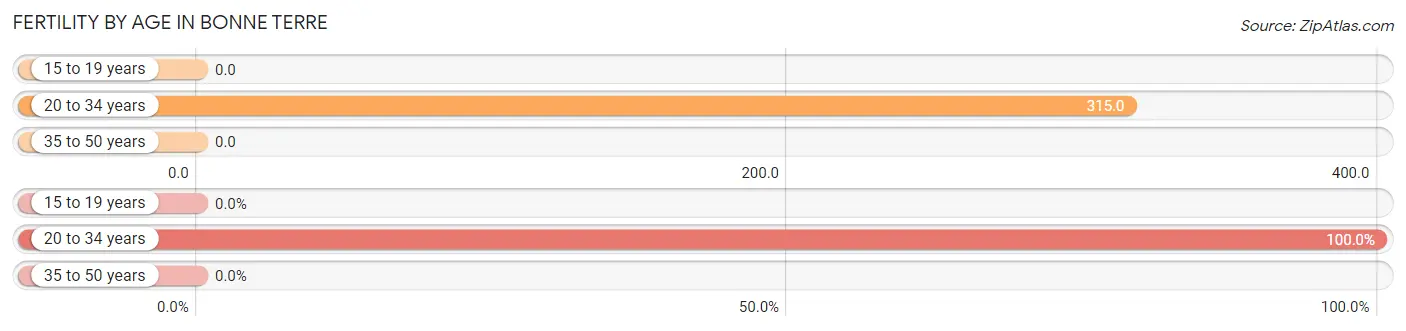
| Age Bracket | Women with Births | Births / 1,000 Women |
| 15 to 19 years | 0 (0.0%) | 0.0 |
| 20 to 34 years | 169 (100.0%) | 315.0 |
| 35 to 50 years | 0 (0.0%) | 0.0 |
| Total | 169 (100.0%) | 155.0 |
Fertility by Age by Marriage Status in Bonne Terre
15.4% of women with births (169) in Bonne Terre are married. The highest percentage of unmarried women with births falls into 20 to 34 years age bracket with 84.6% of them unmarried at the time of birth, while the lowest percentage of unmarried women with births belong to 20 to 34 years age bracket with 84.6% of them unmarried.
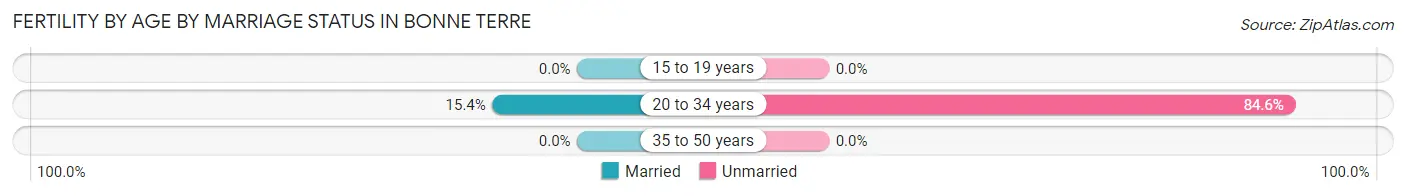
| Age Bracket | Married | Unmarried |
| 15 to 19 years | 0 (0.0%) | 0 (0.0%) |
| 20 to 34 years | 26 (15.4%) | 143 (84.6%) |
| 35 to 50 years | 0 (0.0%) | 0 (0.0%) |
| Total | 26 (15.4%) | 143 (84.6%) |
Fertility by Education in Bonne Terre
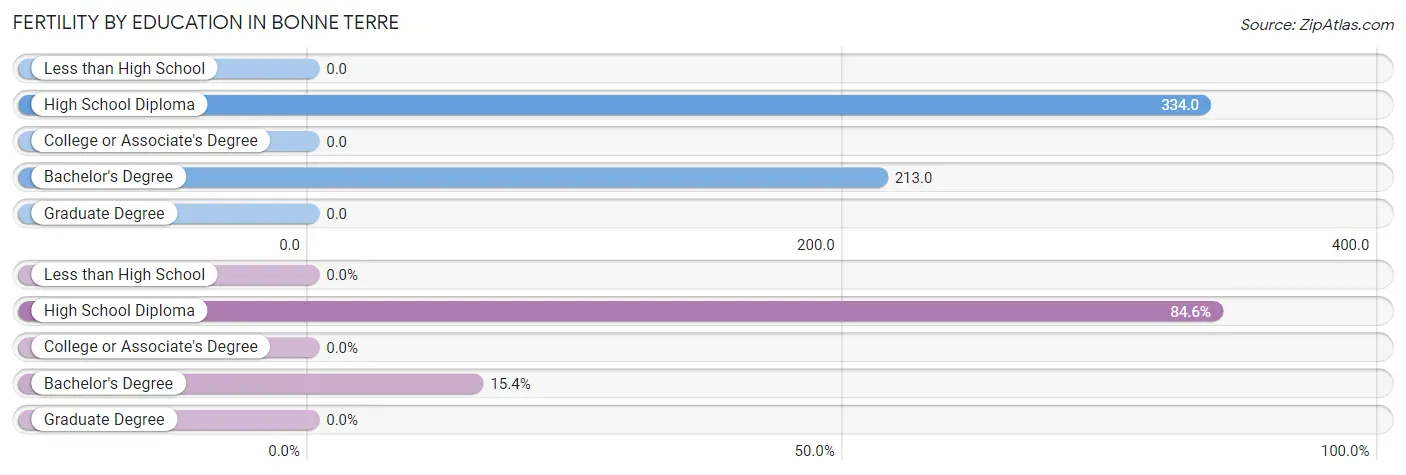
| Educational Attainment | Women with Births | Births / 1,000 Women |
| Less than High School | 0 (0.0%) | 0.0 |
| High School Diploma | 143 (84.6%) | 334.0 |
| College or Associate's Degree | 0 (0.0%) | 0.0 |
| Bachelor's Degree | 26 (15.4%) | 213.0 |
| Graduate Degree | 0 (0.0%) | 0.0 |
| Total | 169 (100.0%) | 155.0 |
Fertility by Education by Marriage Status in Bonne Terre
84.6% of women with births in Bonne Terre are unmarried. Women with the educational attainment of bachelor's degree are most likely to be married with 100.0% of them married at childbirth, while women with the educational attainment of high school diploma are least likely to be married with 100.0% of them unmarried at childbirth.
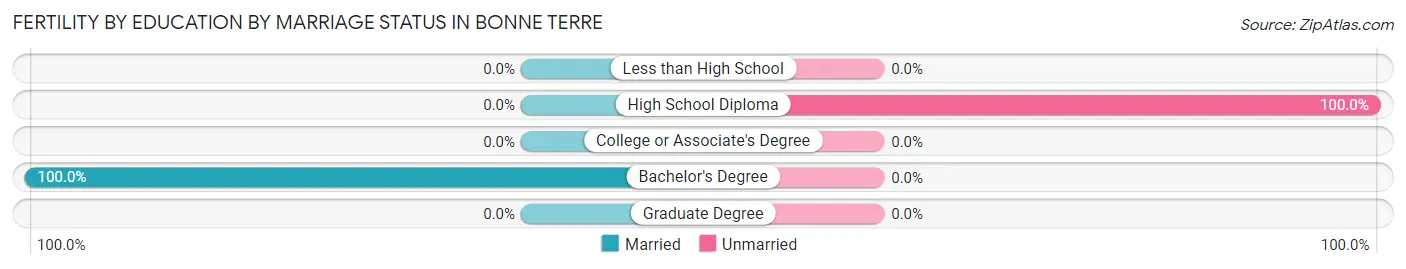
| Educational Attainment | Married | Unmarried |
| Less than High School | 0 (0.0%) | 0 (0.0%) |
| High School Diploma | 0 (0.0%) | 143 (100.0%) |
| College or Associate's Degree | 0 (0.0%) | 0 (0.0%) |
| Bachelor's Degree | 26 (100.0%) | 0 (0.0%) |
| Graduate Degree | 0 (0.0%) | 0 (0.0%) |
| Total | 26 (15.4%) | 143 (84.6%) |
Employment Characteristics in Bonne Terre
Employment by Class of Employer in Bonne Terre
Among the 2,007 employed individuals in Bonne Terre, private company employees (1,700 | 84.7%), local government employees (75 | 3.7%), and state government employees (65 | 3.2%) make up the most common classes of employment.
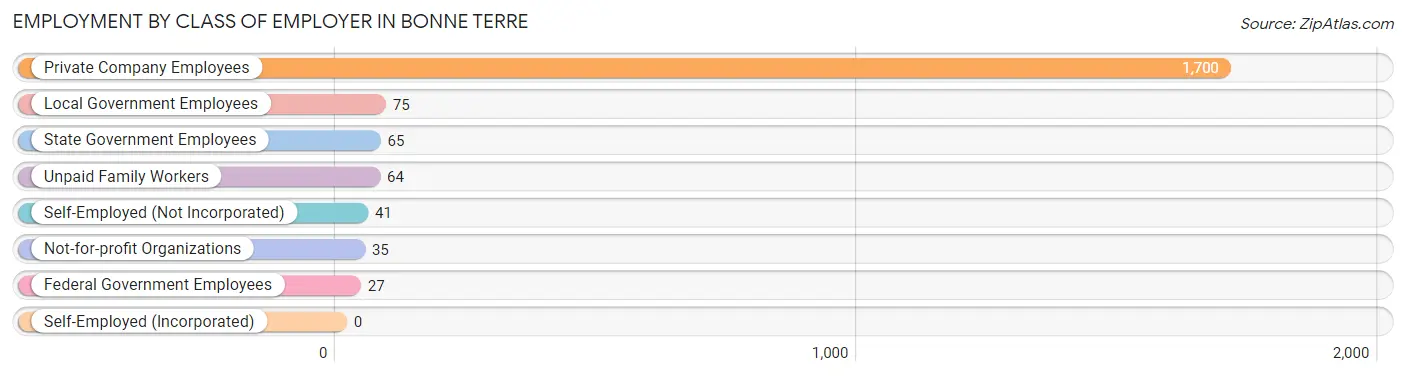
| Employer Class | # Employees | % Employees |
| Private Company Employees | 1,700 | 84.7% |
| Self-Employed (Incorporated) | 0 | 0.0% |
| Self-Employed (Not Incorporated) | 41 | 2.0% |
| Not-for-profit Organizations | 35 | 1.7% |
| Local Government Employees | 75 | 3.7% |
| State Government Employees | 65 | 3.2% |
| Federal Government Employees | 27 | 1.3% |
| Unpaid Family Workers | 64 | 3.2% |
| Total | 2,007 | 100.0% |
Employment Status by Age in Bonne Terre
According to the labor force statistics for Bonne Terre, out of the total population over 16 years of age (6,098), 34.9% or 2,128 individuals are in the labor force, with 3.7% or 79 of them unemployed. The age group with the highest labor force participation rate is 16 to 19 years, with 46.6% or 83 individuals in the labor force. Within the labor force, the 35 to 44 years age range has the highest percentage of unemployed individuals, with 13.7% or 62 of them being unemployed.
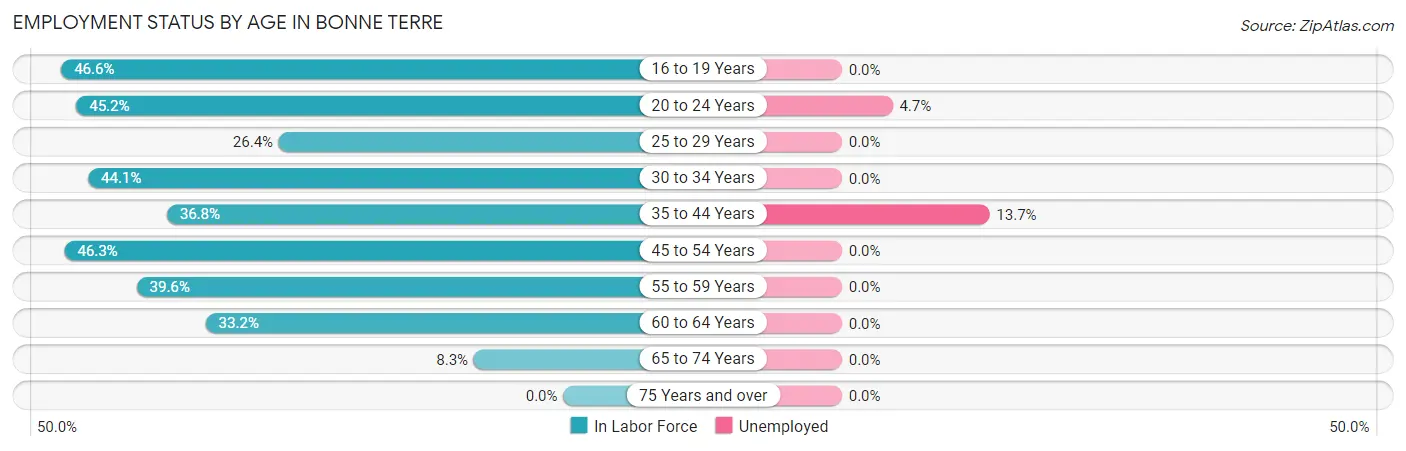
| Age Bracket | In Labor Force | Unemployed |
| 16 to 19 Years | 83 (46.6%) | 0 (0.0%) |
| 20 to 24 Years | 340 (45.2%) | 16 (4.7%) |
| 25 to 29 Years | 209 (26.4%) | 0 (0.0%) |
| 30 to 34 Years | 252 (44.1%) | 0 (0.0%) |
| 35 to 44 Years | 452 (36.8%) | 62 (13.7%) |
| 45 to 54 Years | 472 (46.3%) | 0 (0.0%) |
| 55 to 59 Years | 199 (39.6%) | 0 (0.0%) |
| 60 to 64 Years | 96 (33.2%) | 0 (0.0%) |
| 65 to 74 Years | 24 (8.3%) | 0 (0.0%) |
| 75 Years and over | 0 (0.0%) | 0 (0.0%) |
| Total | 2,128 (34.9%) | 79 (3.7%) |
Employment Status by Educational Attainment in Bonne Terre
According to labor force statistics for Bonne Terre, 38.2% of individuals (1,682) out of the total population between 25 and 64 years of age (4,402) are in the labor force, with 3.7% or 62 of them being unemployed. The group with the highest labor force participation rate are those with the educational attainment of bachelor's degree or higher, with 78.6% or 282 individuals in the labor force. Within the labor force, individuals with college / associate degree education have the highest percentage of unemployment, with 8.3% or 47 of them being unemployed.
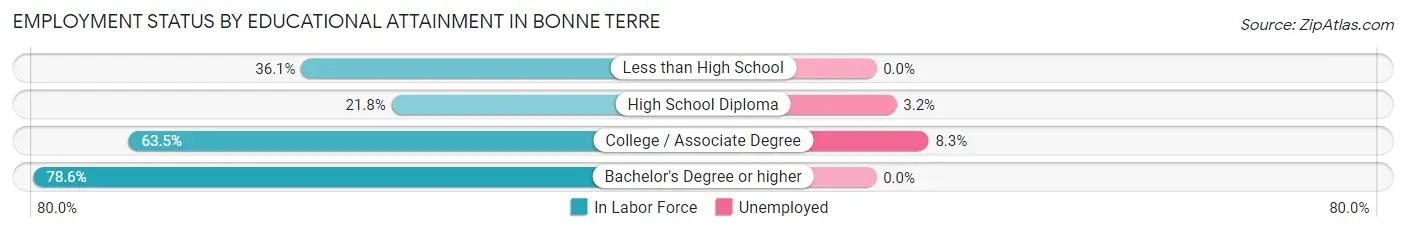
| Educational Attainment | In Labor Force | Unemployed |
| Less than High School | 364 (36.1%) | 0 (0.0%) |
| High School Diploma | 467 (21.8%) | 69 (3.2%) |
| College / Associate Degree | 567 (63.5%) | 74 (8.3%) |
| Bachelor's Degree or higher | 282 (78.6%) | 0 (0.0%) |
| Total | 1,682 (38.2%) | 163 (3.7%) |
Employment Occupations by Sex in Bonne Terre
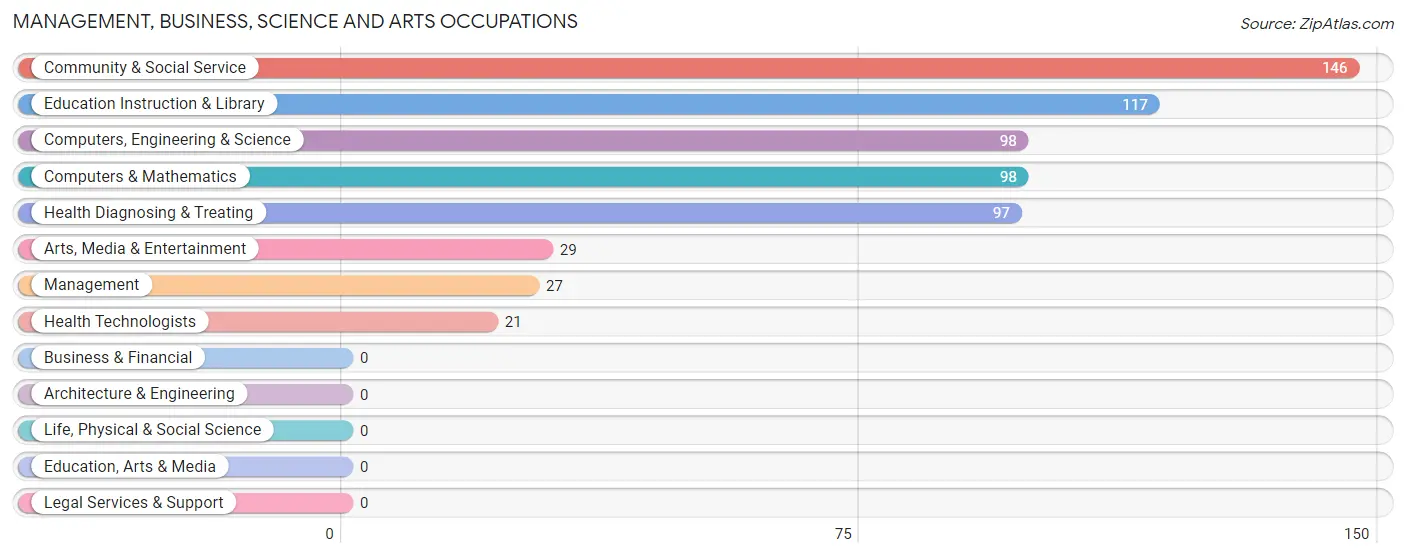
Management, Business, Science and Arts Occupations
The most common Management, Business, Science and Arts occupations in Bonne Terre are Community & Social Service (146 | 7.1%), Education Instruction & Library (117 | 5.7%), Computers, Engineering & Science (98 | 4.8%), Computers & Mathematics (98 | 4.8%), and Health Diagnosing & Treating (97 | 4.7%).
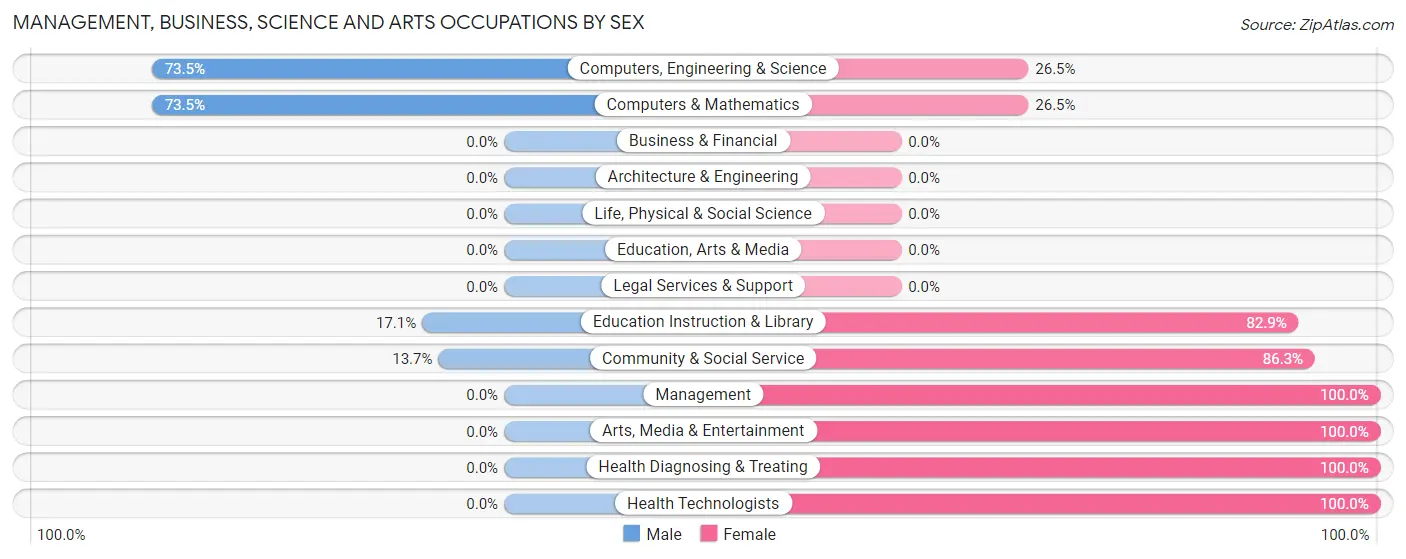
Management, Business, Science and Arts Occupations by Sex
Within the Management, Business, Science and Arts occupations in Bonne Terre, the most male-oriented occupations are Computers, Engineering & Science (73.5%), Computers & Mathematics (73.5%), and Education Instruction & Library (17.1%), while the most female-oriented occupations are Management (100.0%), Arts, Media & Entertainment (100.0%), and Health Diagnosing & Treating (100.0%).
| Occupation | Male | Female |
| Management | 0 (0.0%) | 27 (100.0%) |
| Business & Financial | 0 (0.0%) | 0 (0.0%) |
| Computers, Engineering & Science | 72 (73.5%) | 26 (26.5%) |
| Computers & Mathematics | 72 (73.5%) | 26 (26.5%) |
| Architecture & Engineering | 0 (0.0%) | 0 (0.0%) |
| Life, Physical & Social Science | 0 (0.0%) | 0 (0.0%) |
| Community & Social Service | 20 (13.7%) | 126 (86.3%) |
| Education, Arts & Media | 0 (0.0%) | 0 (0.0%) |
| Legal Services & Support | 0 (0.0%) | 0 (0.0%) |
| Education Instruction & Library | 20 (17.1%) | 97 (82.9%) |
| Arts, Media & Entertainment | 0 (0.0%) | 29 (100.0%) |
| Health Diagnosing & Treating | 0 (0.0%) | 97 (100.0%) |
| Health Technologists | 0 (0.0%) | 21 (100.0%) |
| Total (Category) | 92 (25.0%) | 276 (75.0%) |
| Total (Overall) | 1,255 (61.3%) | 794 (38.8%) |
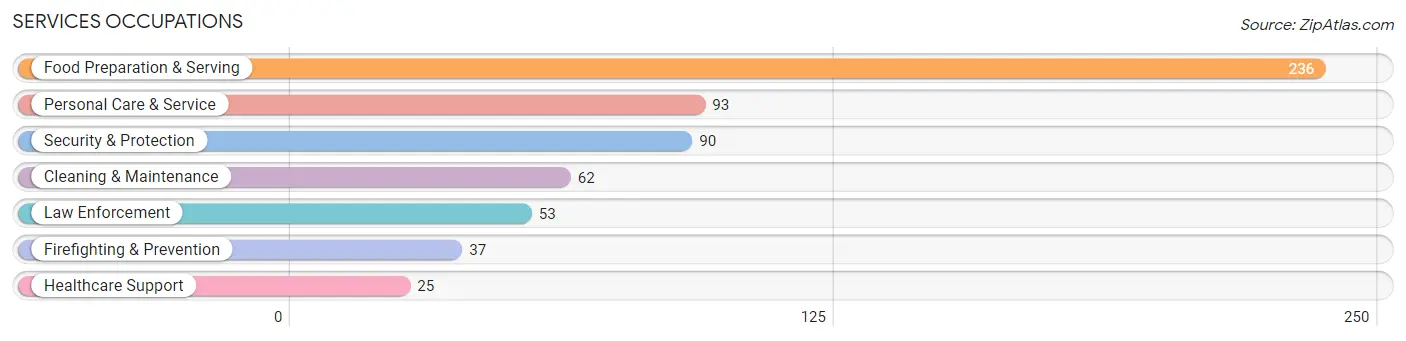
Services Occupations
The most common Services occupations in Bonne Terre are Food Preparation & Serving (236 | 11.5%), Personal Care & Service (93 | 4.5%), Security & Protection (90 | 4.4%), Cleaning & Maintenance (62 | 3.0%), and Law Enforcement (53 | 2.6%).
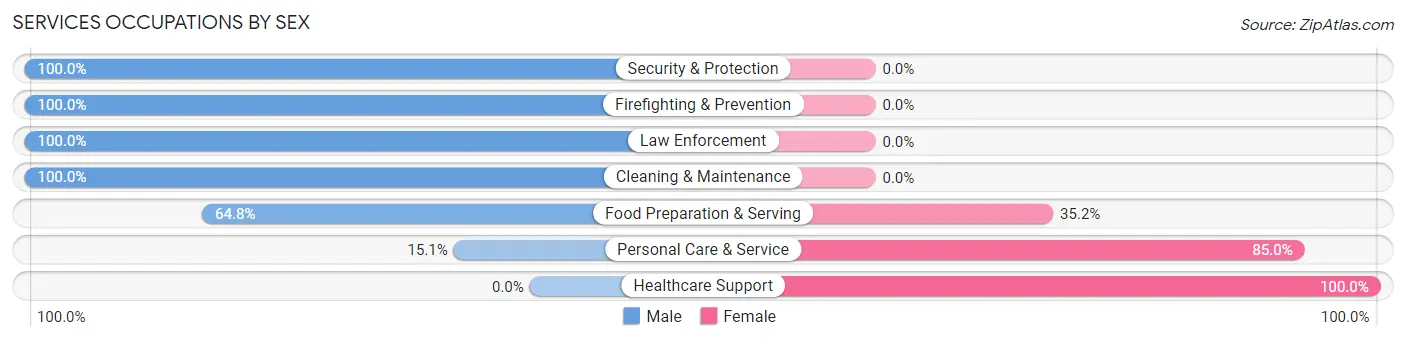
Services Occupations by Sex
Within the Services occupations in Bonne Terre, the most male-oriented occupations are Security & Protection (100.0%), Firefighting & Prevention (100.0%), and Law Enforcement (100.0%), while the most female-oriented occupations are Healthcare Support (100.0%), Personal Care & Service (85.0%), and Food Preparation & Serving (35.2%).
| Occupation | Male | Female |
| Healthcare Support | 0 (0.0%) | 25 (100.0%) |
| Security & Protection | 90 (100.0%) | 0 (0.0%) |
| Firefighting & Prevention | 37 (100.0%) | 0 (0.0%) |
| Law Enforcement | 53 (100.0%) | 0 (0.0%) |
| Food Preparation & Serving | 153 (64.8%) | 83 (35.2%) |
| Cleaning & Maintenance | 62 (100.0%) | 0 (0.0%) |
| Personal Care & Service | 14 (15.0%) | 79 (85.0%) |
| Total (Category) | 319 (63.0%) | 187 (37.0%) |
| Total (Overall) | 1,255 (61.3%) | 794 (38.8%) |
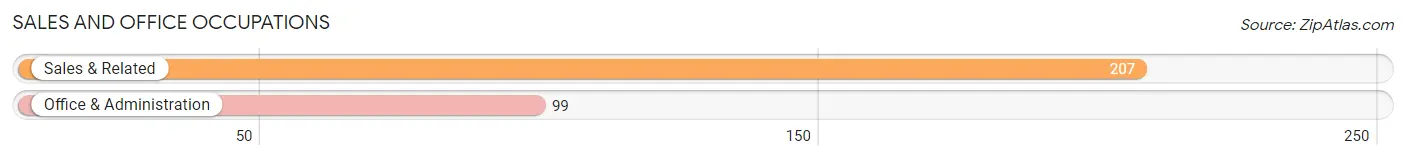
Sales and Office Occupations
The most common Sales and Office occupations in Bonne Terre are Sales & Related (207 | 10.1%), and Office & Administration (99 | 4.8%).
Sales and Office Occupations by Sex
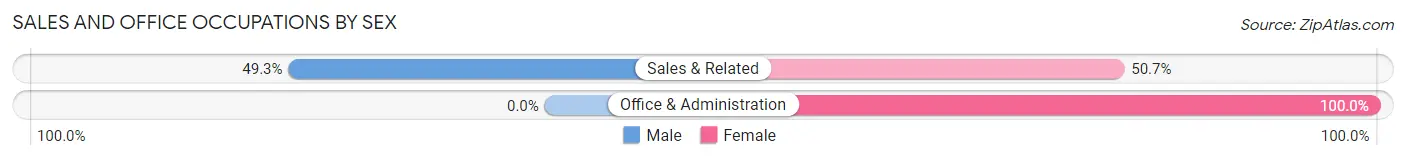
| Occupation | Male | Female |
| Sales & Related | 102 (49.3%) | 105 (50.7%) |
| Office & Administration | 0 (0.0%) | 99 (100.0%) |
| Total (Category) | 102 (33.3%) | 204 (66.7%) |
| Total (Overall) | 1,255 (61.3%) | 794 (38.8%) |
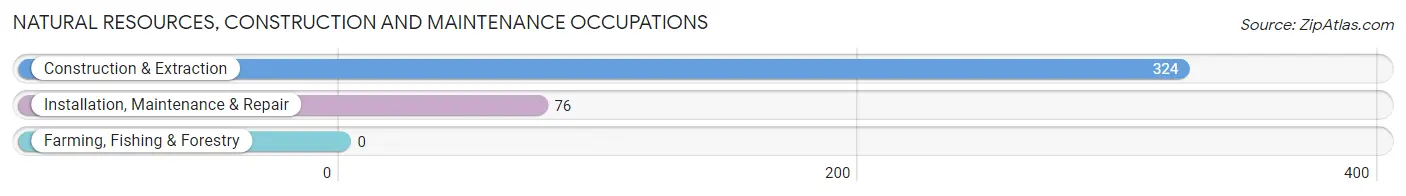
Natural Resources, Construction and Maintenance Occupations
The most common Natural Resources, Construction and Maintenance occupations in Bonne Terre are Construction & Extraction (324 | 15.8%), and Installation, Maintenance & Repair (76 | 3.7%).
Natural Resources, Construction and Maintenance Occupations by Sex
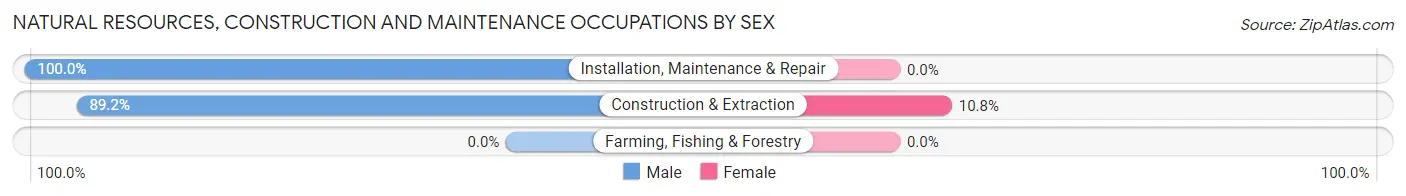
| Occupation | Male | Female |
| Farming, Fishing & Forestry | 0 (0.0%) | 0 (0.0%) |
| Construction & Extraction | 289 (89.2%) | 35 (10.8%) |
| Installation, Maintenance & Repair | 76 (100.0%) | 0 (0.0%) |
| Total (Category) | 365 (91.2%) | 35 (8.7%) |
| Total (Overall) | 1,255 (61.3%) | 794 (38.8%) |
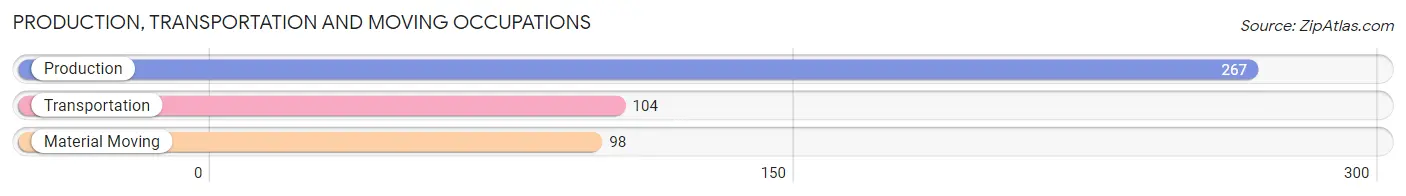
Production, Transportation and Moving Occupations
The most common Production, Transportation and Moving occupations in Bonne Terre are Production (267 | 13.0%), Transportation (104 | 5.1%), and Material Moving (98 | 4.8%).
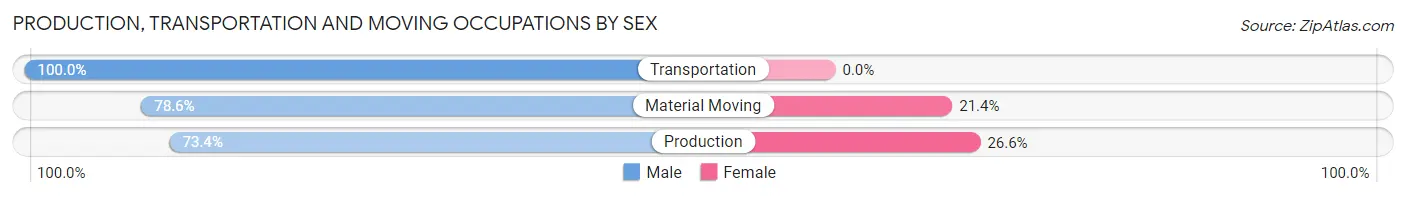
Production, Transportation and Moving Occupations by Sex
| Occupation | Male | Female |
| Production | 196 (73.4%) | 71 (26.6%) |
| Transportation | 104 (100.0%) | 0 (0.0%) |
| Material Moving | 77 (78.6%) | 21 (21.4%) |
| Total (Category) | 377 (80.4%) | 92 (19.6%) |
| Total (Overall) | 1,255 (61.3%) | 794 (38.8%) |
Employment Industries by Sex in Bonne Terre
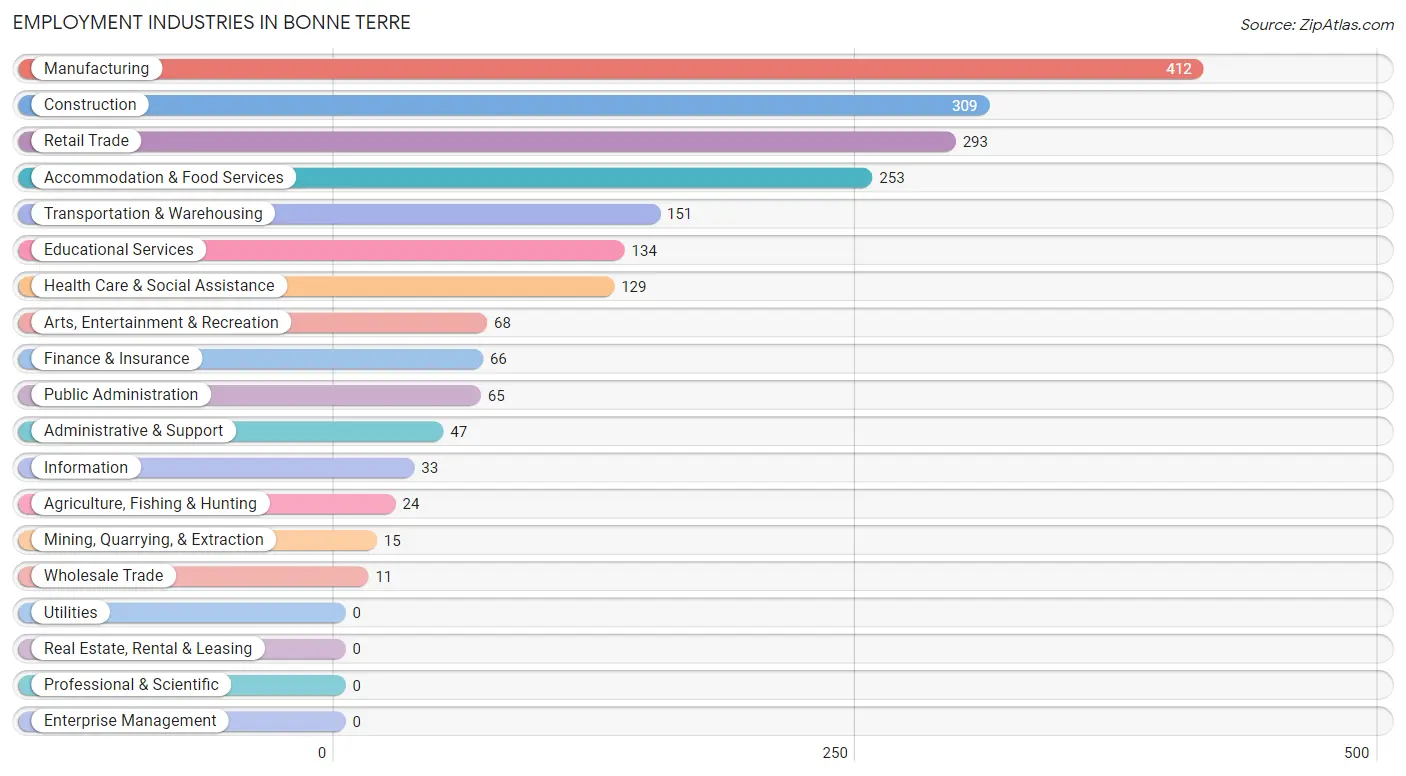
Employment Industries in Bonne Terre
The major employment industries in Bonne Terre include Manufacturing (412 | 20.1%), Construction (309 | 15.1%), Retail Trade (293 | 14.3%), Accommodation & Food Services (253 | 12.3%), and Transportation & Warehousing (151 | 7.4%).
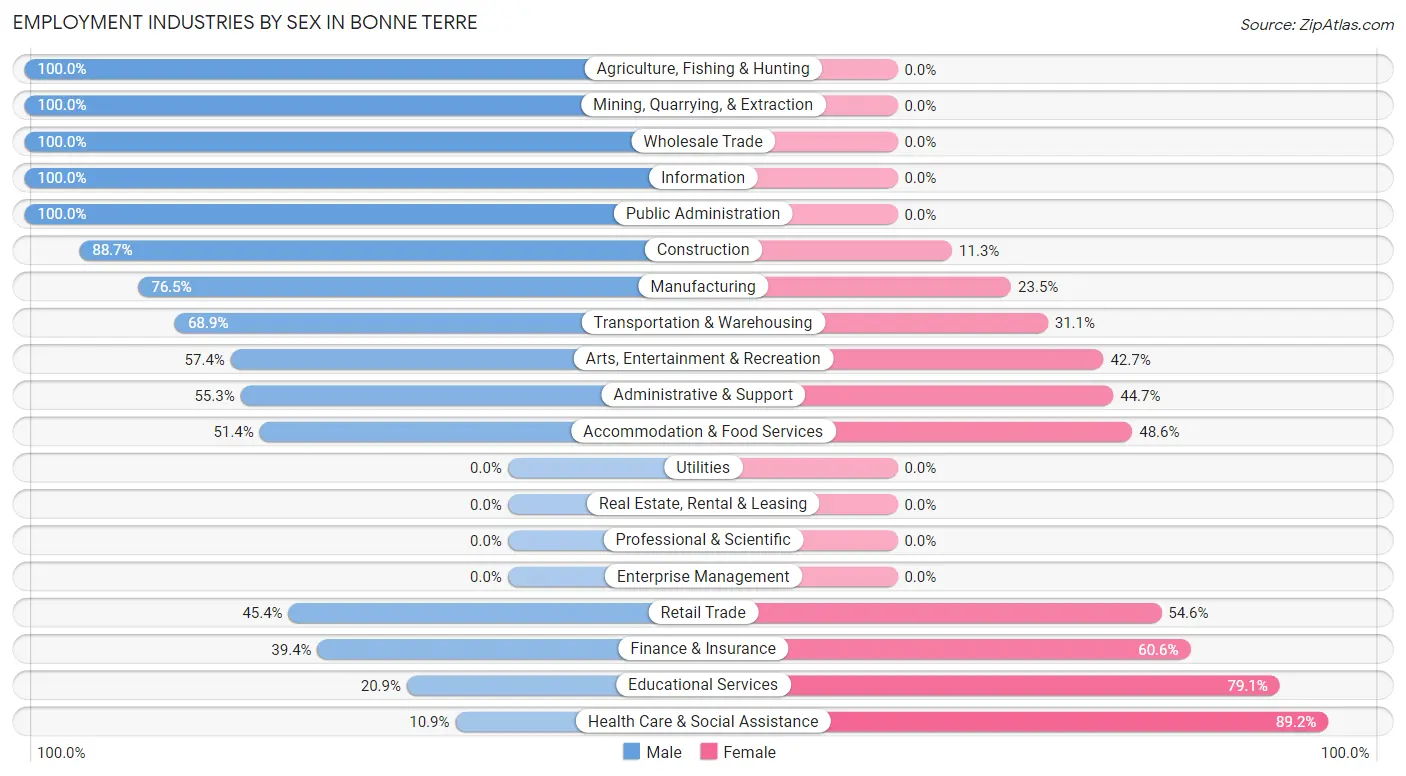
Employment Industries by Sex in Bonne Terre
The Bonne Terre industries that see more men than women are Agriculture, Fishing & Hunting (100.0%), Mining, Quarrying, & Extraction (100.0%), and Wholesale Trade (100.0%), whereas the industries that tend to have a higher number of women are Health Care & Social Assistance (89.1%), Educational Services (79.1%), and Finance & Insurance (60.6%).
| Industry | Male | Female |
| Agriculture, Fishing & Hunting | 24 (100.0%) | 0 (0.0%) |
| Mining, Quarrying, & Extraction | 15 (100.0%) | 0 (0.0%) |
| Construction | 274 (88.7%) | 35 (11.3%) |
| Manufacturing | 315 (76.5%) | 97 (23.5%) |
| Wholesale Trade | 11 (100.0%) | 0 (0.0%) |
| Retail Trade | 133 (45.4%) | 160 (54.6%) |
| Transportation & Warehousing | 104 (68.9%) | 47 (31.1%) |
| Utilities | 0 (0.0%) | 0 (0.0%) |
| Information | 33 (100.0%) | 0 (0.0%) |
| Finance & Insurance | 26 (39.4%) | 40 (60.6%) |
| Real Estate, Rental & Leasing | 0 (0.0%) | 0 (0.0%) |
| Professional & Scientific | 0 (0.0%) | 0 (0.0%) |
| Enterprise Management | 0 (0.0%) | 0 (0.0%) |
| Administrative & Support | 26 (55.3%) | 21 (44.7%) |
| Educational Services | 28 (20.9%) | 106 (79.1%) |
| Health Care & Social Assistance | 14 (10.8%) | 115 (89.1%) |
| Arts, Entertainment & Recreation | 39 (57.4%) | 29 (42.6%) |
| Accommodation & Food Services | 130 (51.4%) | 123 (48.6%) |
| Public Administration | 65 (100.0%) | 0 (0.0%) |
| Total | 1,255 (61.3%) | 794 (38.8%) |
Education in Bonne Terre
School Enrollment in Bonne Terre
The most common levels of schooling among the 890 students in Bonne Terre are high school (284 | 31.9%), college / undergraduate (196 | 22.0%), and elementary school (176 | 19.8%).
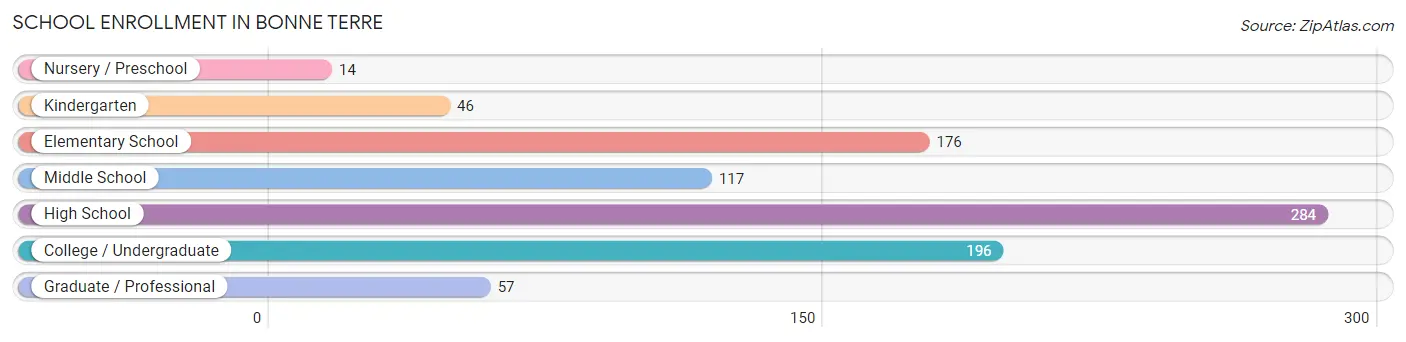
| School Level | # Students | % Students |
| Nursery / Preschool | 14 | 1.6% |
| Kindergarten | 46 | 5.2% |
| Elementary School | 176 | 19.8% |
| Middle School | 117 | 13.2% |
| High School | 284 | 31.9% |
| College / Undergraduate | 196 | 22.0% |
| Graduate / Professional | 57 | 6.4% |
| Total | 890 | 100.0% |
School Enrollment by Age by Funding Source in Bonne Terre
Out of a total of 890 students who are enrolled in schools in Bonne Terre, 218 (24.5%) attend a private institution, while the remaining 672 (75.5%) are enrolled in public schools. The age group of 3 to 4 year olds has the highest likelihood of being enrolled in private schools, with 14 (100.0% in the age bracket) enrolled. Conversely, the age group of 5 to 9 year old has the lowest likelihood of being enrolled in a private school, with 138 (100.0% in the age bracket) attending a public institution.
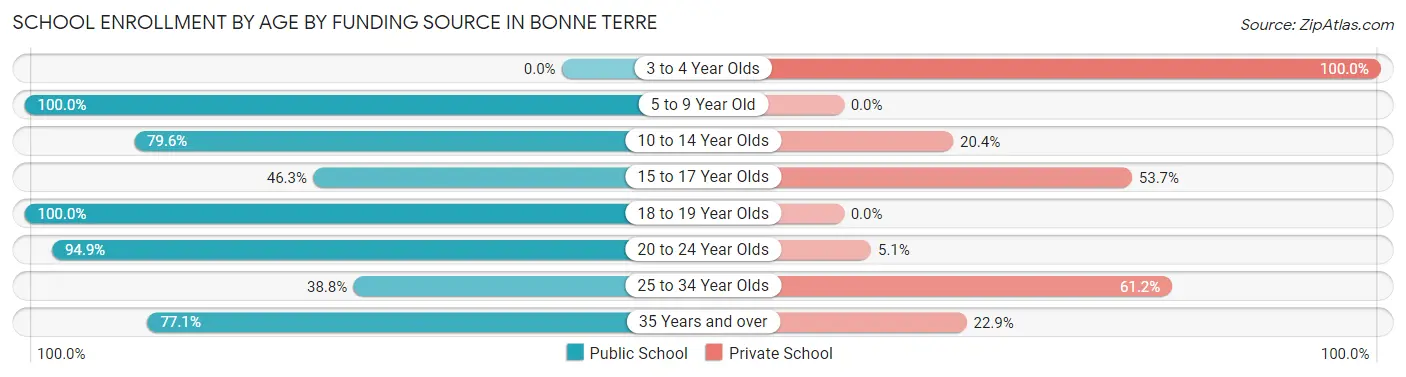
| Age Bracket | Public School | Private School |
| 3 to 4 Year Olds | 0 (0.0%) | 14 (100.0%) |
| 5 to 9 Year Old | 138 (100.0%) | 0 (0.0%) |
| 10 to 14 Year Olds | 172 (79.6%) | 44 (20.4%) |
| 15 to 17 Year Olds | 63 (46.3%) | 73 (53.7%) |
| 18 to 19 Year Olds | 102 (100.0%) | 0 (0.0%) |
| 20 to 24 Year Olds | 93 (94.9%) | 5 (5.1%) |
| 25 to 34 Year Olds | 40 (38.8%) | 63 (61.2%) |
| 35 Years and over | 64 (77.1%) | 19 (22.9%) |
| Total | 672 (75.5%) | 218 (24.5%) |
Educational Attainment by Field of Study in Bonne Terre
Business (140 | 27.5%), education (98 | 19.3%), arts & humanities (72 | 14.1%), psychology (54 | 10.6%), and science & technology (54 | 10.6%) are the most common fields of study among 509 individuals in Bonne Terre who have obtained a bachelor's degree or higher.
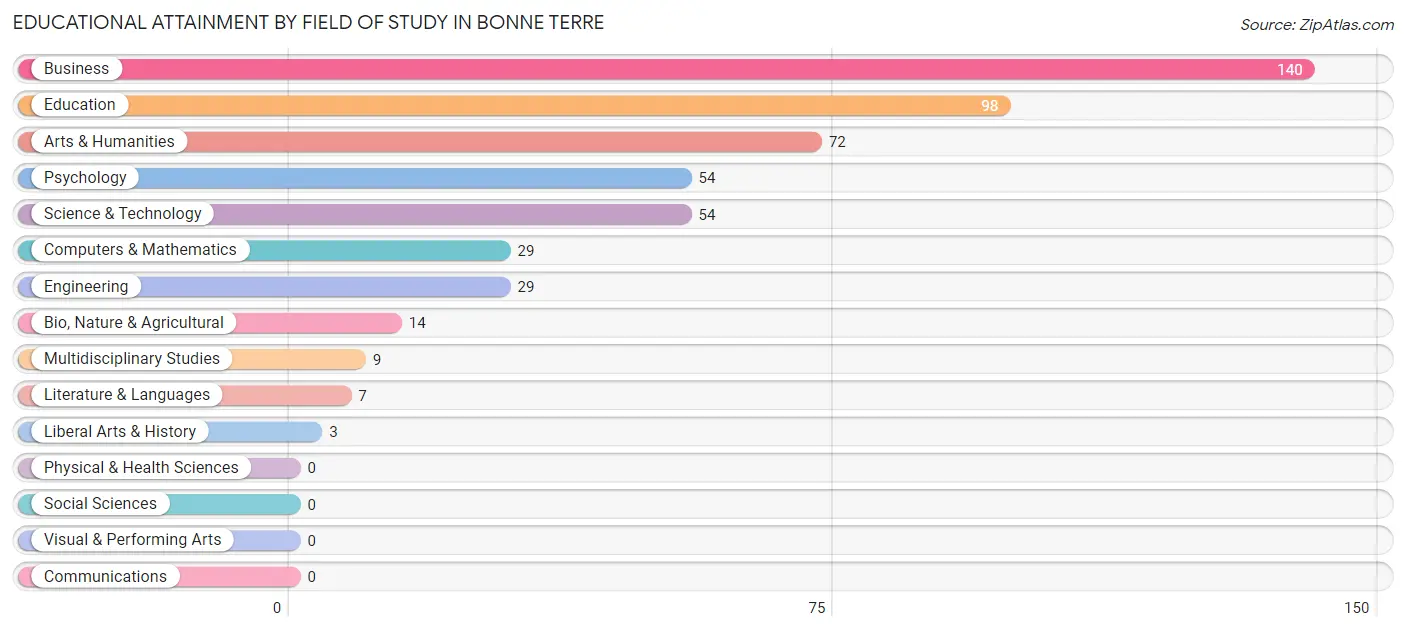
| Field of Study | # Graduates | % Graduates |
| Computers & Mathematics | 29 | 5.7% |
| Bio, Nature & Agricultural | 14 | 2.8% |
| Physical & Health Sciences | 0 | 0.0% |
| Psychology | 54 | 10.6% |
| Social Sciences | 0 | 0.0% |
| Engineering | 29 | 5.7% |
| Multidisciplinary Studies | 9 | 1.8% |
| Science & Technology | 54 | 10.6% |
| Business | 140 | 27.5% |
| Education | 98 | 19.3% |
| Literature & Languages | 7 | 1.4% |
| Liberal Arts & History | 3 | 0.6% |
| Visual & Performing Arts | 0 | 0.0% |
| Communications | 0 | 0.0% |
| Arts & Humanities | 72 | 14.1% |
| Total | 509 | 100.0% |
Transportation & Commute in Bonne Terre
Vehicle Availability by Sex in Bonne Terre
The most prevalent vehicle ownership categories in Bonne Terre are males with 2 vehicles (416, accounting for 34.3%) and females with 2 vehicles (260, making up 52.4%).
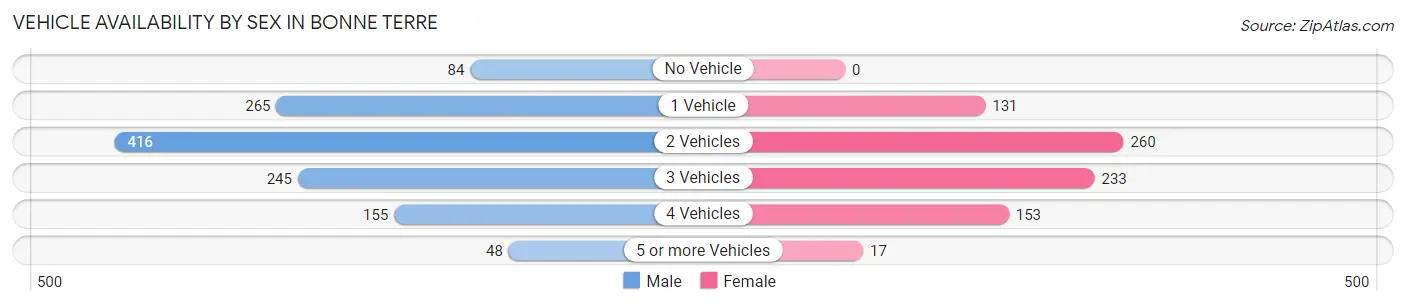
| Vehicles Available | Male | Female |
| No Vehicle | 84 (6.9%) | 0 (0.0%) |
| 1 Vehicle | 265 (21.8%) | 131 (16.5%) |
| 2 Vehicles | 416 (34.3%) | 260 (32.8%) |
| 3 Vehicles | 245 (20.2%) | 233 (29.3%) |
| 4 Vehicles | 155 (12.8%) | 153 (19.3%) |
| 5 or more Vehicles | 48 (4.0%) | 17 (2.1%) |
| Total | 1,213 (100.0%) | 794 (100.0%) |
Commute Time in Bonne Terre
The most frequently occuring commute durations in Bonne Terre are 15 to 19 minutes (367 commuters, 18.3%), 10 to 14 minutes (257 commuters, 12.8%), and 20 to 24 minutes (252 commuters, 12.6%).
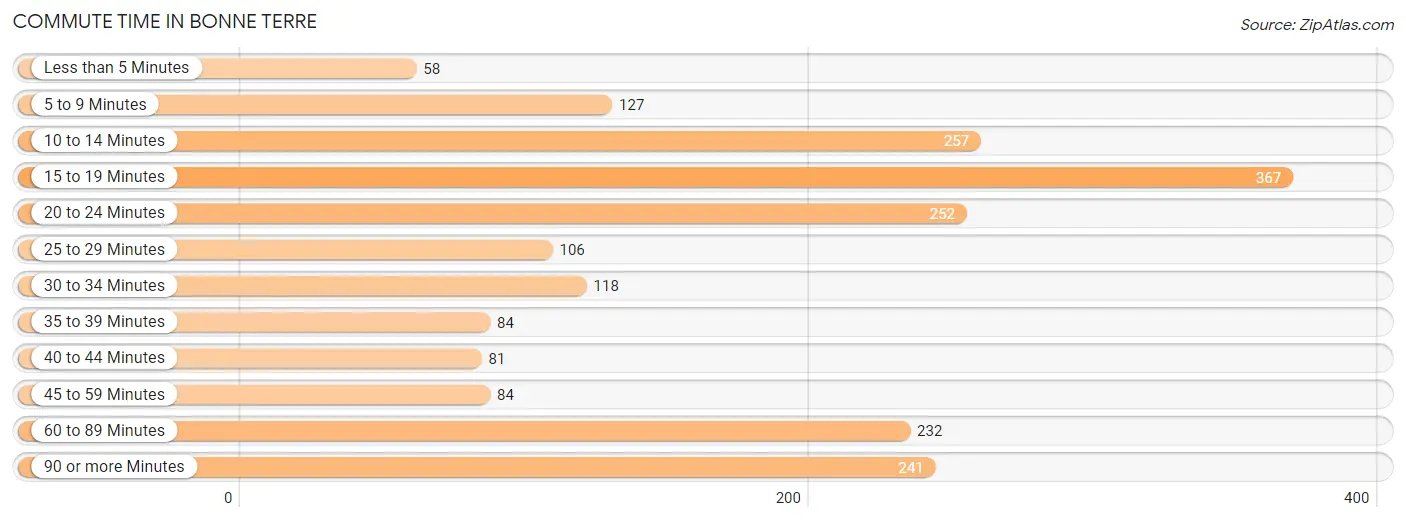
| Commute Time | # Commuters | % Commuters |
| Less than 5 Minutes | 58 | 2.9% |
| 5 to 9 Minutes | 127 | 6.3% |
| 10 to 14 Minutes | 257 | 12.8% |
| 15 to 19 Minutes | 367 | 18.3% |
| 20 to 24 Minutes | 252 | 12.6% |
| 25 to 29 Minutes | 106 | 5.3% |
| 30 to 34 Minutes | 118 | 5.9% |
| 35 to 39 Minutes | 84 | 4.2% |
| 40 to 44 Minutes | 81 | 4.0% |
| 45 to 59 Minutes | 84 | 4.2% |
| 60 to 89 Minutes | 232 | 11.6% |
| 90 or more Minutes | 241 | 12.0% |
Commute Time by Sex in Bonne Terre
The most common commute times in Bonne Terre are 15 to 19 minutes (233 commuters, 19.2%) for males and 10 to 14 minutes (145 commuters, 18.3%) for females.
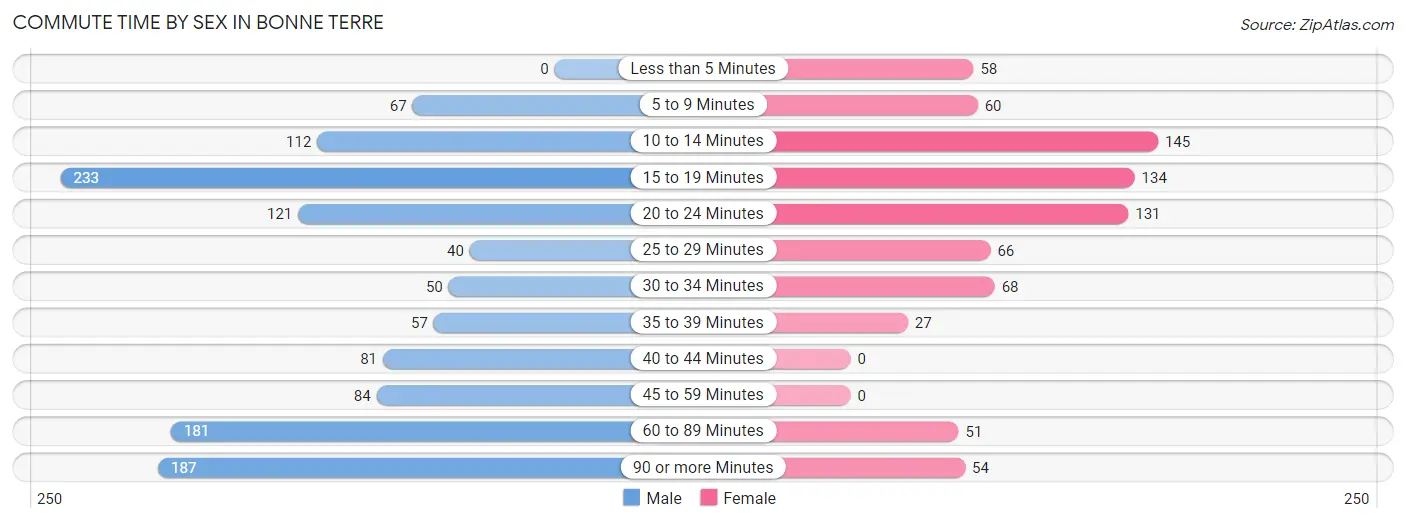
| Commute Time | Male | Female |
| Less than 5 Minutes | 0 (0.0%) | 58 (7.3%) |
| 5 to 9 Minutes | 67 (5.5%) | 60 (7.6%) |
| 10 to 14 Minutes | 112 (9.2%) | 145 (18.3%) |
| 15 to 19 Minutes | 233 (19.2%) | 134 (16.9%) |
| 20 to 24 Minutes | 121 (10.0%) | 131 (16.5%) |
| 25 to 29 Minutes | 40 (3.3%) | 66 (8.3%) |
| 30 to 34 Minutes | 50 (4.1%) | 68 (8.6%) |
| 35 to 39 Minutes | 57 (4.7%) | 27 (3.4%) |
| 40 to 44 Minutes | 81 (6.7%) | 0 (0.0%) |
| 45 to 59 Minutes | 84 (6.9%) | 0 (0.0%) |
| 60 to 89 Minutes | 181 (14.9%) | 51 (6.4%) |
| 90 or more Minutes | 187 (15.4%) | 54 (6.8%) |
Time of Departure to Work by Sex in Bonne Terre
The most frequent times of departure to work in Bonne Terre are 5:00 AM to 5:29 AM (247, 20.4%) for males and 7:30 AM to 7:59 AM (153, 19.3%) for females.
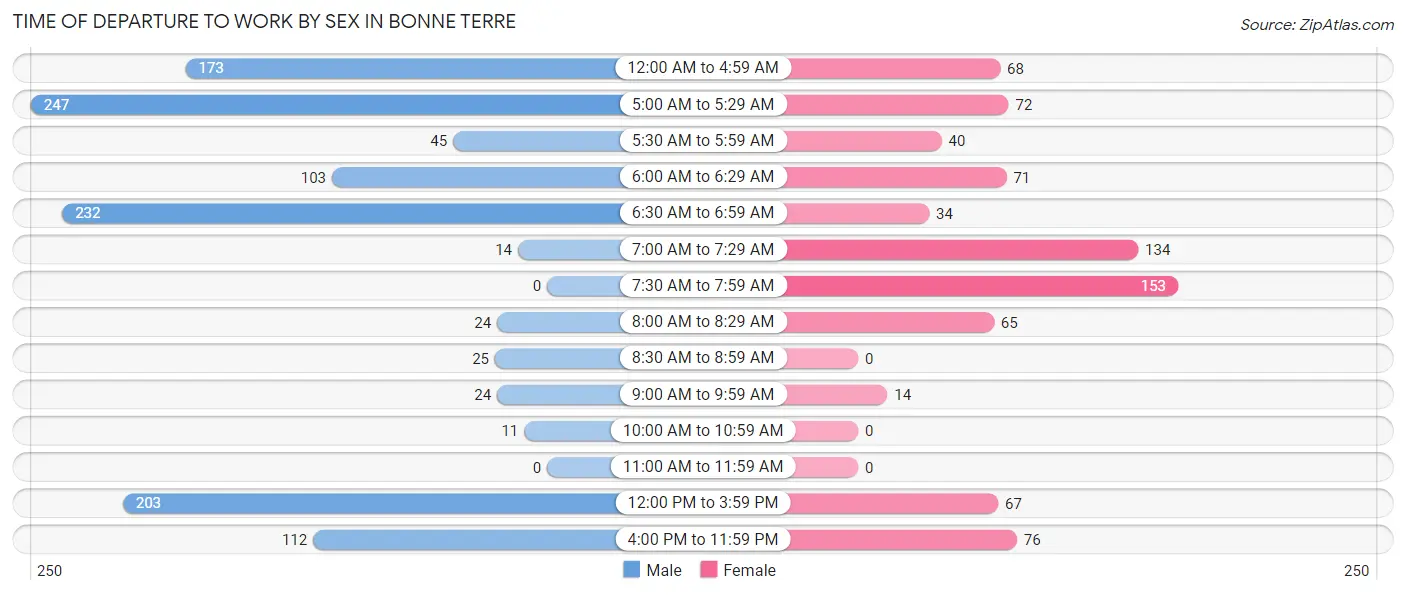
| Time of Departure | Male | Female |
| 12:00 AM to 4:59 AM | 173 (14.3%) | 68 (8.6%) |
| 5:00 AM to 5:29 AM | 247 (20.4%) | 72 (9.1%) |
| 5:30 AM to 5:59 AM | 45 (3.7%) | 40 (5.0%) |
| 6:00 AM to 6:29 AM | 103 (8.5%) | 71 (8.9%) |
| 6:30 AM to 6:59 AM | 232 (19.1%) | 34 (4.3%) |
| 7:00 AM to 7:29 AM | 14 (1.1%) | 134 (16.9%) |
| 7:30 AM to 7:59 AM | 0 (0.0%) | 153 (19.3%) |
| 8:00 AM to 8:29 AM | 24 (2.0%) | 65 (8.2%) |
| 8:30 AM to 8:59 AM | 25 (2.1%) | 0 (0.0%) |
| 9:00 AM to 9:59 AM | 24 (2.0%) | 14 (1.8%) |
| 10:00 AM to 10:59 AM | 11 (0.9%) | 0 (0.0%) |
| 11:00 AM to 11:59 AM | 0 (0.0%) | 0 (0.0%) |
| 12:00 PM to 3:59 PM | 203 (16.7%) | 67 (8.4%) |
| 4:00 PM to 11:59 PM | 112 (9.2%) | 76 (9.6%) |
| Total | 1,213 (100.0%) | 794 (100.0%) |
Housing Occupancy in Bonne Terre
Occupancy by Ownership in Bonne Terre
Of the total 1,820 dwellings in Bonne Terre, owner-occupied units account for 1,073 (59.0%), while renter-occupied units make up 747 (41.0%).
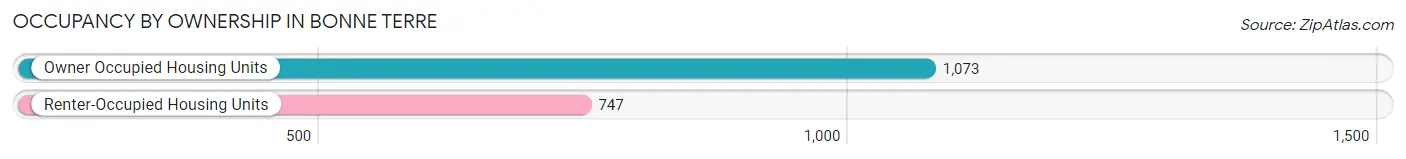
| Occupancy | # Housing Units | % Housing Units |
| Owner Occupied Housing Units | 1,073 | 59.0% |
| Renter-Occupied Housing Units | 747 | 41.0% |
| Total Occupied Housing Units | 1,820 | 100.0% |
Occupancy by Household Size in Bonne Terre
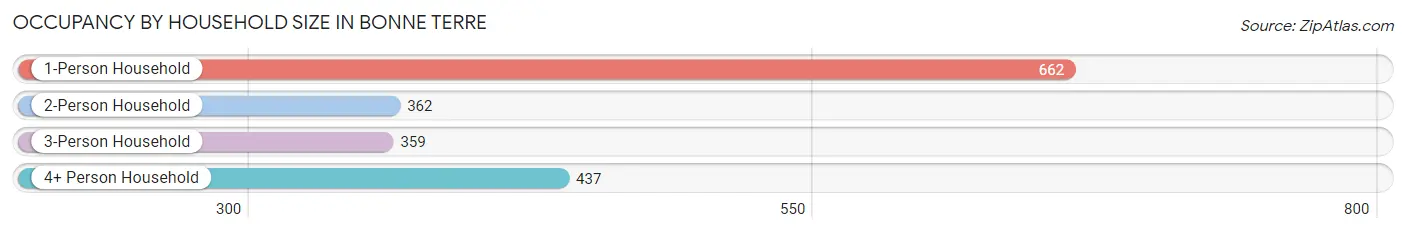
| Household Size | # Housing Units | % Housing Units |
| 1-Person Household | 662 | 36.4% |
| 2-Person Household | 362 | 19.9% |
| 3-Person Household | 359 | 19.7% |
| 4+ Person Household | 437 | 24.0% |
| Total Housing Units | 1,820 | 100.0% |
Occupancy by Ownership by Household Size in Bonne Terre
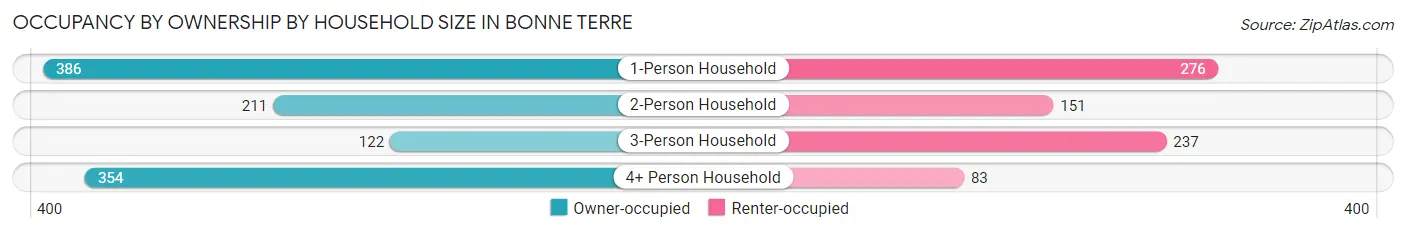
| Household Size | Owner-occupied | Renter-occupied |
| 1-Person Household | 386 (58.3%) | 276 (41.7%) |
| 2-Person Household | 211 (58.3%) | 151 (41.7%) |
| 3-Person Household | 122 (34.0%) | 237 (66.0%) |
| 4+ Person Household | 354 (81.0%) | 83 (19.0%) |
| Total Housing Units | 1,073 (59.0%) | 747 (41.0%) |
Occupancy by Educational Attainment in Bonne Terre
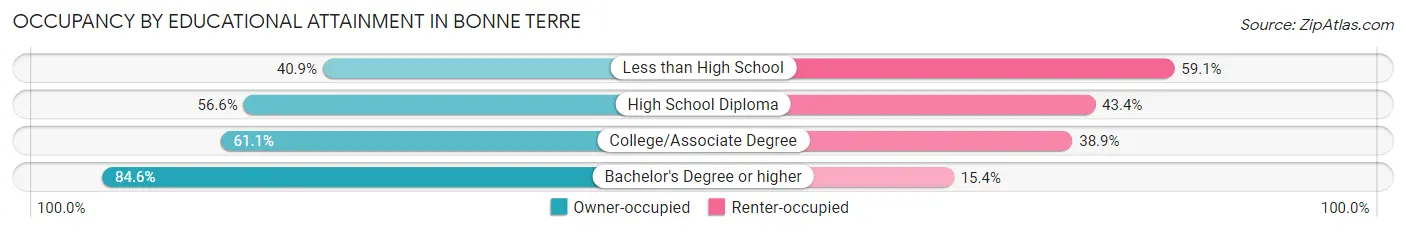
| Household Size | Owner-occupied | Renter-occupied |
| Less than High School | 94 (40.9%) | 136 (59.1%) |
| High School Diploma | 443 (56.6%) | 340 (43.4%) |
| College/Associate Degree | 382 (61.1%) | 243 (38.9%) |
| Bachelor's Degree or higher | 154 (84.6%) | 28 (15.4%) |
Occupancy by Age of Householder in Bonne Terre
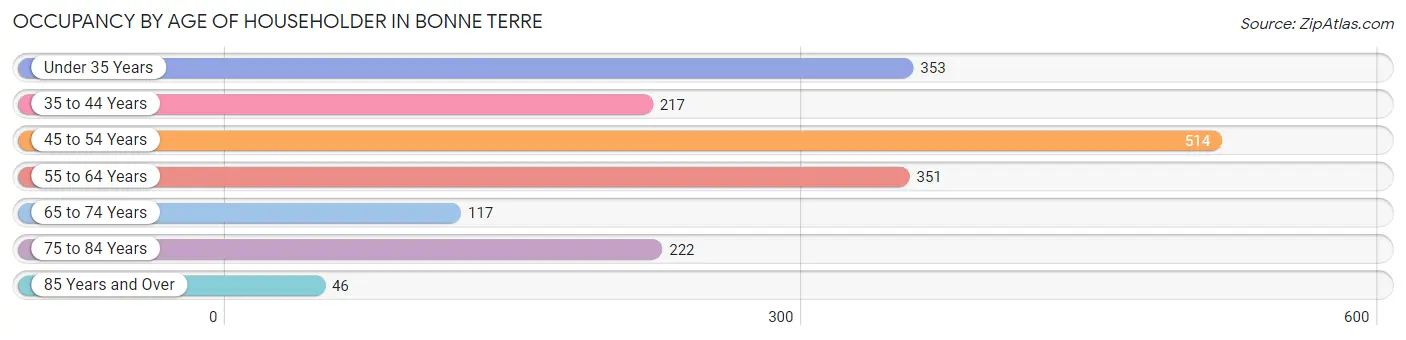
| Age Bracket | # Households | % Households |
| Under 35 Years | 353 | 19.4% |
| 35 to 44 Years | 217 | 11.9% |
| 45 to 54 Years | 514 | 28.2% |
| 55 to 64 Years | 351 | 19.3% |
| 65 to 74 Years | 117 | 6.4% |
| 75 to 84 Years | 222 | 12.2% |
| 85 Years and Over | 46 | 2.5% |
| Total | 1,820 | 100.0% |
Housing Finances in Bonne Terre
Median Income by Occupancy in Bonne Terre
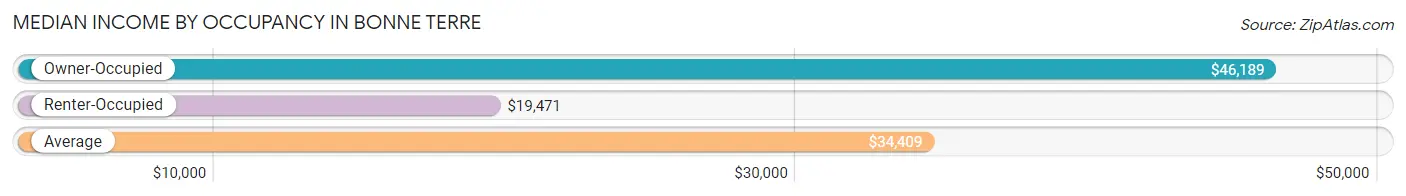
| Occupancy Type | # Households | Median Income |
| Owner-Occupied | 1,073 (59.0%) | $46,189 |
| Renter-Occupied | 747 (41.0%) | $19,471 |
| Average | 1,820 (100.0%) | $34,409 |
Occupancy by Householder Income Bracket in Bonne Terre
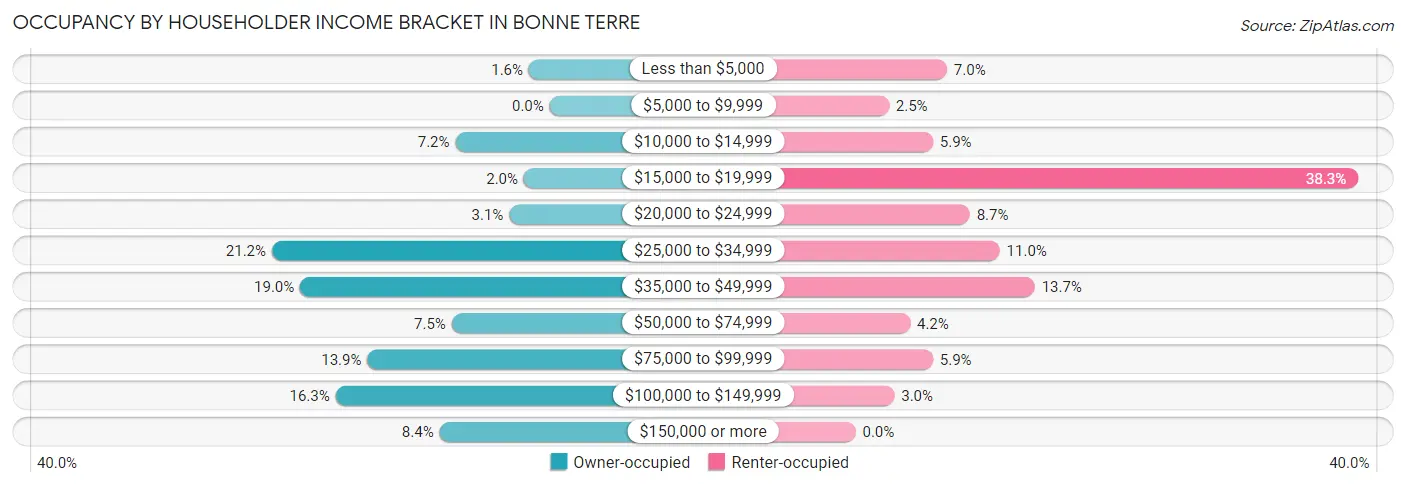
| Income Bracket | Owner-occupied | Renter-occupied |
| Less than $5,000 | 17 (1.6%) | 52 (7.0%) |
| $5,000 to $9,999 | 0 (0.0%) | 19 (2.5%) |
| $10,000 to $14,999 | 77 (7.2%) | 44 (5.9%) |
| $15,000 to $19,999 | 21 (2.0%) | 286 (38.3%) |
| $20,000 to $24,999 | 33 (3.1%) | 65 (8.7%) |
| $25,000 to $34,999 | 227 (21.2%) | 82 (11.0%) |
| $35,000 to $49,999 | 204 (19.0%) | 102 (13.7%) |
| $50,000 to $74,999 | 80 (7.5%) | 31 (4.2%) |
| $75,000 to $99,999 | 149 (13.9%) | 44 (5.9%) |
| $100,000 to $149,999 | 175 (16.3%) | 22 (2.9%) |
| $150,000 or more | 90 (8.4%) | 0 (0.0%) |
| Total | 1,073 (100.0%) | 747 (100.0%) |
Monthly Housing Cost Tiers in Bonne Terre
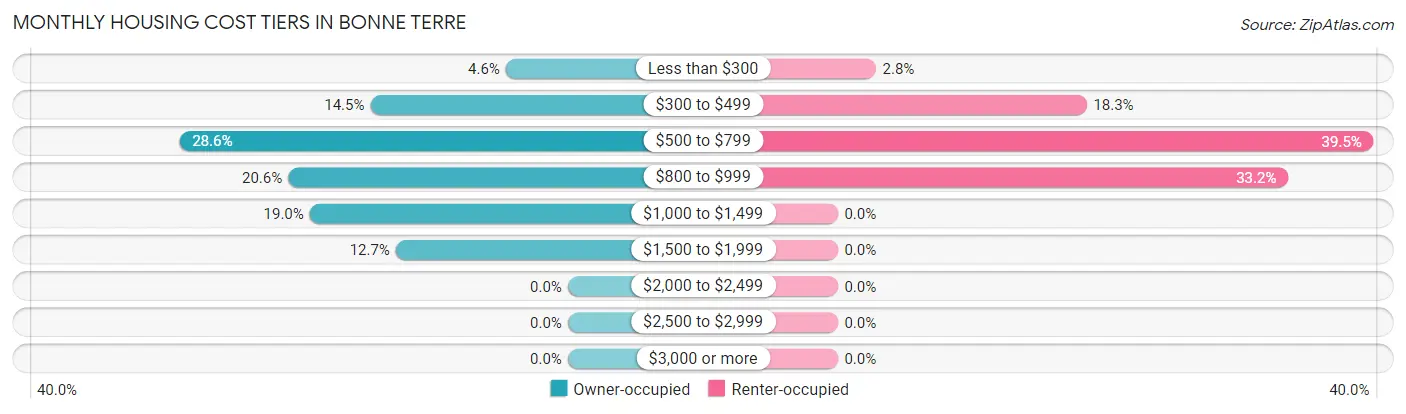
| Monthly Cost | Owner-occupied | Renter-occupied |
| Less than $300 | 49 (4.6%) | 21 (2.8%) |
| $300 to $499 | 156 (14.5%) | 137 (18.3%) |
| $500 to $799 | 307 (28.6%) | 295 (39.5%) |
| $800 to $999 | 221 (20.6%) | 248 (33.2%) |
| $1,000 to $1,499 | 204 (19.0%) | 0 (0.0%) |
| $1,500 to $1,999 | 136 (12.7%) | 0 (0.0%) |
| $2,000 to $2,499 | 0 (0.0%) | 0 (0.0%) |
| $2,500 to $2,999 | 0 (0.0%) | 0 (0.0%) |
| $3,000 or more | 0 (0.0%) | 0 (0.0%) |
| Total | 1,073 (100.0%) | 747 (100.0%) |
Physical Housing Characteristics in Bonne Terre
Housing Structures in Bonne Terre
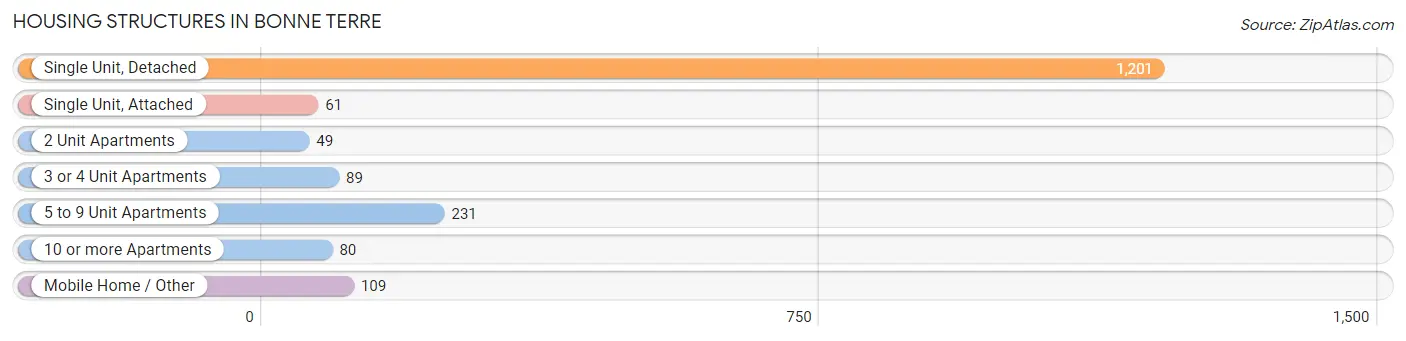
| Structure Type | # Housing Units | % Housing Units |
| Single Unit, Detached | 1,201 | 66.0% |
| Single Unit, Attached | 61 | 3.4% |
| 2 Unit Apartments | 49 | 2.7% |
| 3 or 4 Unit Apartments | 89 | 4.9% |
| 5 to 9 Unit Apartments | 231 | 12.7% |
| 10 or more Apartments | 80 | 4.4% |
| Mobile Home / Other | 109 | 6.0% |
| Total | 1,820 | 100.0% |
Housing Structures by Occupancy in Bonne Terre
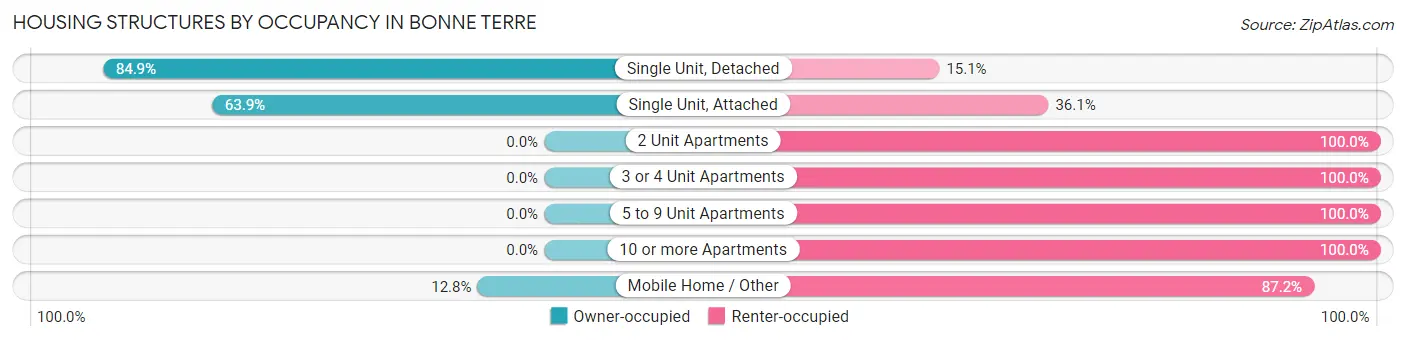
| Structure Type | Owner-occupied | Renter-occupied |
| Single Unit, Detached | 1,020 (84.9%) | 181 (15.1%) |
| Single Unit, Attached | 39 (63.9%) | 22 (36.1%) |
| 2 Unit Apartments | 0 (0.0%) | 49 (100.0%) |
| 3 or 4 Unit Apartments | 0 (0.0%) | 89 (100.0%) |
| 5 to 9 Unit Apartments | 0 (0.0%) | 231 (100.0%) |
| 10 or more Apartments | 0 (0.0%) | 80 (100.0%) |
| Mobile Home / Other | 14 (12.8%) | 95 (87.2%) |
| Total | 1,073 (59.0%) | 747 (41.0%) |
Housing Structures by Number of Rooms in Bonne Terre
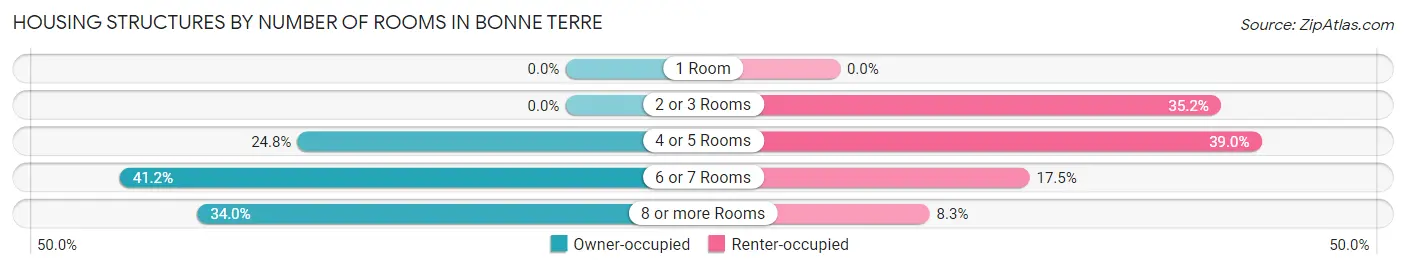
| Number of Rooms | Owner-occupied | Renter-occupied |
| 1 Room | 0 (0.0%) | 0 (0.0%) |
| 2 or 3 Rooms | 0 (0.0%) | 263 (35.2%) |
| 4 or 5 Rooms | 266 (24.8%) | 291 (39.0%) |
| 6 or 7 Rooms | 442 (41.2%) | 131 (17.5%) |
| 8 or more Rooms | 365 (34.0%) | 62 (8.3%) |
| Total | 1,073 (100.0%) | 747 (100.0%) |
Housing Structure by Heating Type in Bonne Terre
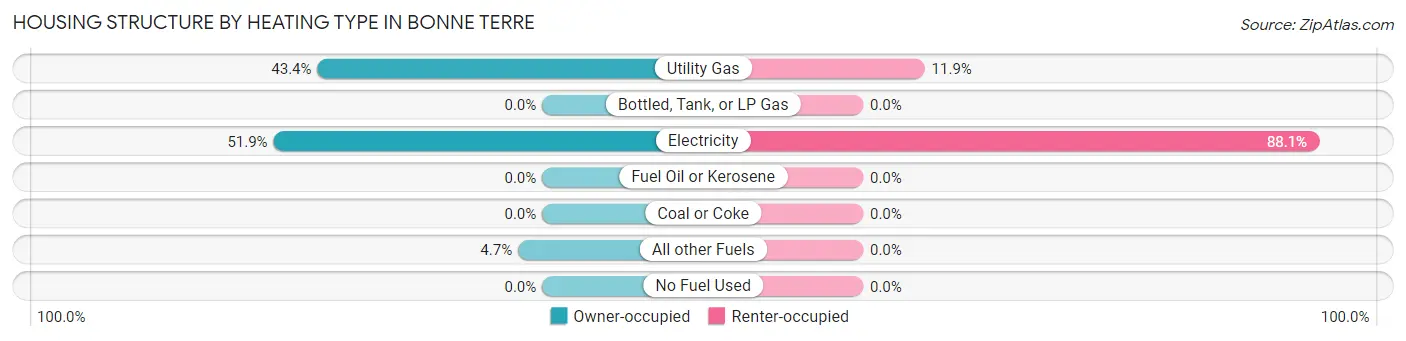
| Heating Type | Owner-occupied | Renter-occupied |
| Utility Gas | 466 (43.4%) | 89 (11.9%) |
| Bottled, Tank, or LP Gas | 0 (0.0%) | 0 (0.0%) |
| Electricity | 557 (51.9%) | 658 (88.1%) |
| Fuel Oil or Kerosene | 0 (0.0%) | 0 (0.0%) |
| Coal or Coke | 0 (0.0%) | 0 (0.0%) |
| All other Fuels | 50 (4.7%) | 0 (0.0%) |
| No Fuel Used | 0 (0.0%) | 0 (0.0%) |
| Total | 1,073 (100.0%) | 747 (100.0%) |
Household Vehicle Usage in Bonne Terre
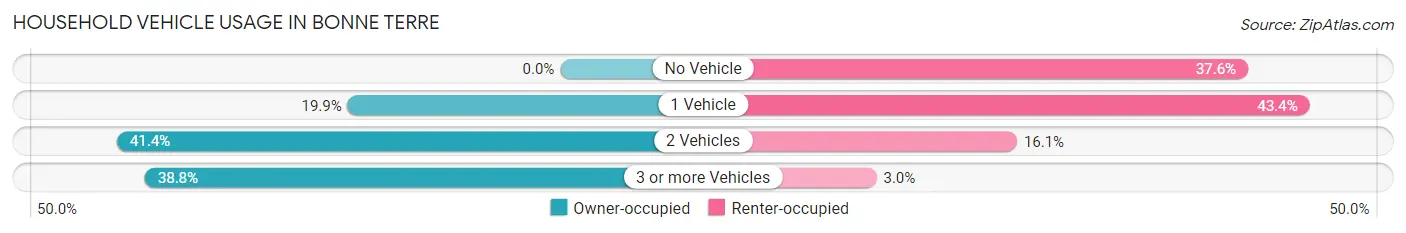
| Vehicles per Household | Owner-occupied | Renter-occupied |
| No Vehicle | 0 (0.0%) | 281 (37.6%) |
| 1 Vehicle | 213 (19.9%) | 324 (43.4%) |
| 2 Vehicles | 444 (41.4%) | 120 (16.1%) |
| 3 or more Vehicles | 416 (38.8%) | 22 (2.9%) |
| Total | 1,073 (100.0%) | 747 (100.0%) |
Real Estate & Mortgages in Bonne Terre
Real Estate and Mortgage Overview in Bonne Terre
| Characteristic | Without Mortgage | With Mortgage |
| Housing Units | 313 | 760 |
| Median Property Value | $120,900 | $121,300 |
| Median Household Income | $55,724 | $67 |
| Monthly Housing Costs | $420 | $0 |
| Real Estate Taxes | $930 | $17 |
Property Value by Mortgage Status in Bonne Terre
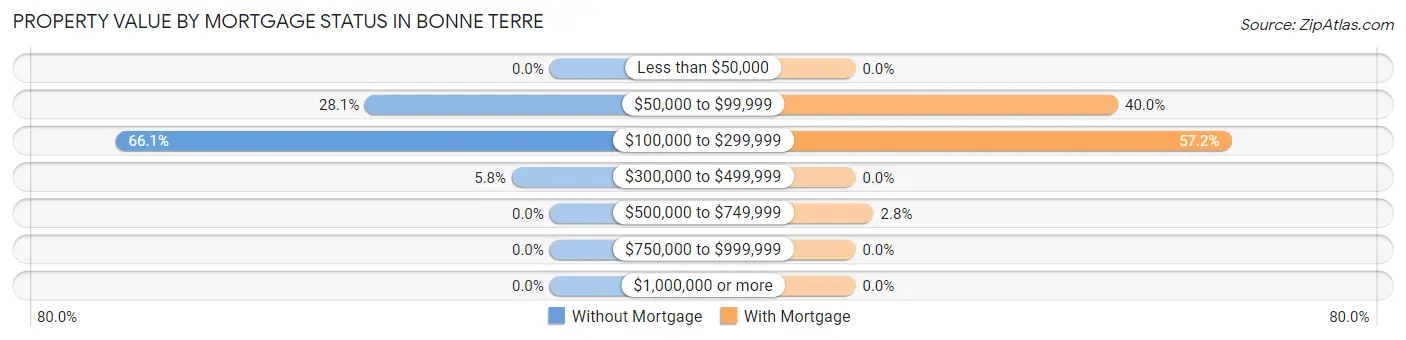
| Property Value | Without Mortgage | With Mortgage |
| Less than $50,000 | 0 (0.0%) | 0 (0.0%) |
| $50,000 to $99,999 | 88 (28.1%) | 304 (40.0%) |
| $100,000 to $299,999 | 207 (66.1%) | 435 (57.2%) |
| $300,000 to $499,999 | 18 (5.8%) | 0 (0.0%) |
| $500,000 to $749,999 | 0 (0.0%) | 21 (2.8%) |
| $750,000 to $999,999 | 0 (0.0%) | 0 (0.0%) |
| $1,000,000 or more | 0 (0.0%) | 0 (0.0%) |
| Total | 313 (100.0%) | 760 (100.0%) |
Household Income by Mortgage Status in Bonne Terre
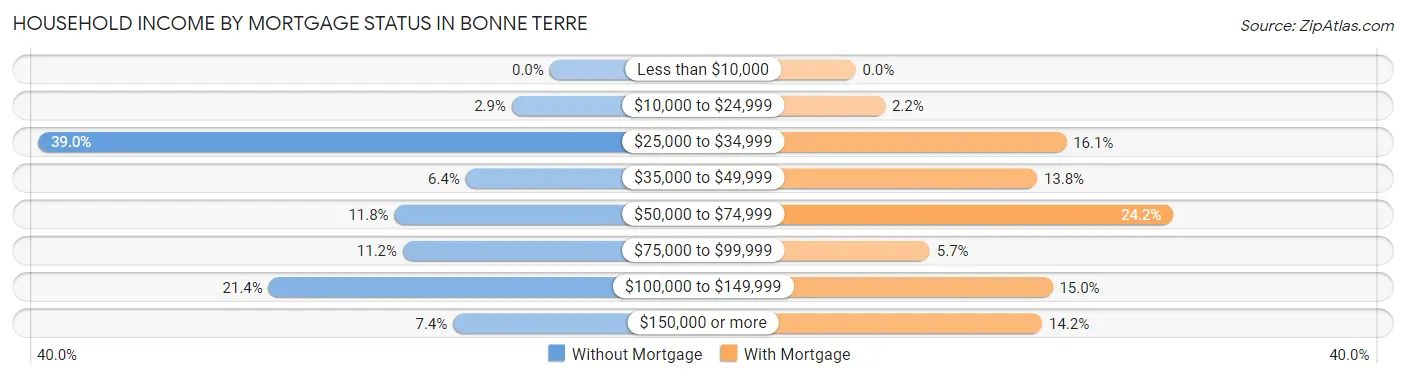
| Household Income | Without Mortgage | With Mortgage |
| Less than $10,000 | 0 (0.0%) | 0 (0.0%) |
| $10,000 to $24,999 | 9 (2.9%) | 17 (2.2%) |
| $25,000 to $34,999 | 122 (39.0%) | 122 (16.1%) |
| $35,000 to $49,999 | 20 (6.4%) | 105 (13.8%) |
| $50,000 to $74,999 | 37 (11.8%) | 184 (24.2%) |
| $75,000 to $99,999 | 35 (11.2%) | 43 (5.7%) |
| $100,000 to $149,999 | 67 (21.4%) | 114 (15.0%) |
| $150,000 or more | 23 (7.3%) | 108 (14.2%) |
| Total | 313 (100.0%) | 760 (100.0%) |
Property Value to Household Income Ratio in Bonne Terre
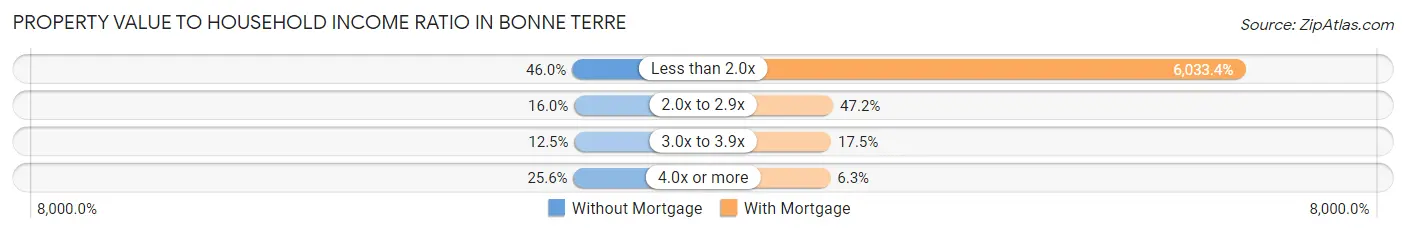
| Value-to-Income Ratio | Without Mortgage | With Mortgage |
| Less than 2.0x | 144 (46.0%) | 45,854 (6,033.4%) |
| 2.0x to 2.9x | 50 (16.0%) | 359 (47.2%) |
| 3.0x to 3.9x | 39 (12.5%) | 133 (17.5%) |
| 4.0x or more | 80 (25.6%) | 48 (6.3%) |
| Total | 313 (100.0%) | 760 (100.0%) |
Real Estate Taxes by Mortgage Status in Bonne Terre
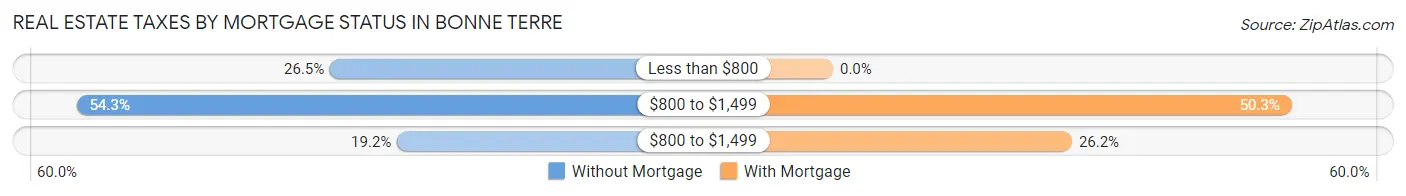
| Property Taxes | Without Mortgage | With Mortgage |
| Less than $800 | 83 (26.5%) | 0 (0.0%) |
| $800 to $1,499 | 170 (54.3%) | 382 (50.3%) |
| $800 to $1,499 | 60 (19.2%) | 199 (26.2%) |
| Total | 313 (100.0%) | 760 (100.0%) |
Health & Disability in Bonne Terre
Health Insurance Coverage by Age in Bonne Terre
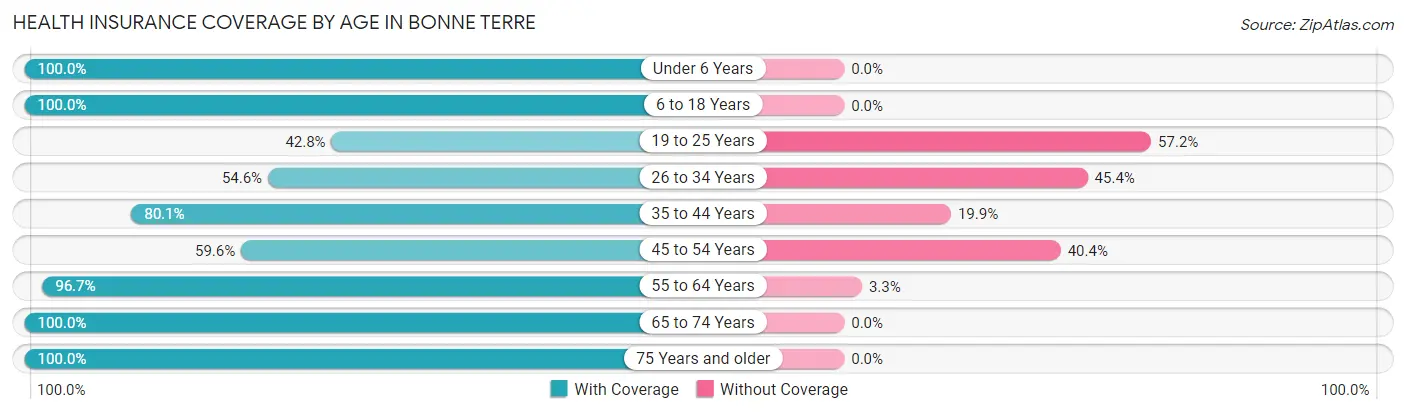
| Age Bracket | With Coverage | Without Coverage |
| Under 6 Years | 326 (100.0%) | 0 (0.0%) |
| 6 to 18 Years | 552 (100.0%) | 0 (0.0%) |
| 19 to 25 Years | 299 (42.8%) | 400 (57.2%) |
| 26 to 34 Years | 420 (54.6%) | 349 (45.4%) |
| 35 to 44 Years | 471 (80.1%) | 117 (19.9%) |
| 45 to 54 Years | 427 (59.6%) | 289 (40.4%) |
| 55 to 64 Years | 527 (96.7%) | 18 (3.3%) |
| 65 to 74 Years | 209 (100.0%) | 0 (0.0%) |
| 75 Years and older | 353 (100.0%) | 0 (0.0%) |
| Total | 3,584 (75.3%) | 1,173 (24.7%) |
Health Insurance Coverage by Citizenship Status in Bonne Terre
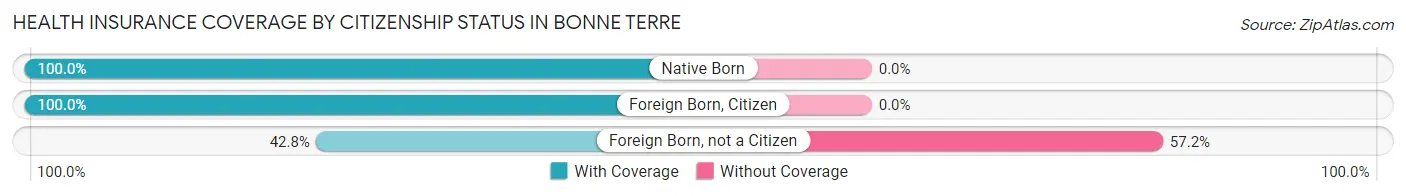
| Citizenship Status | With Coverage | Without Coverage |
| Native Born | 326 (100.0%) | 0 (0.0%) |
| Foreign Born, Citizen | 552 (100.0%) | 0 (0.0%) |
| Foreign Born, not a Citizen | 299 (42.8%) | 400 (57.2%) |
Health Insurance Coverage by Household Income in Bonne Terre
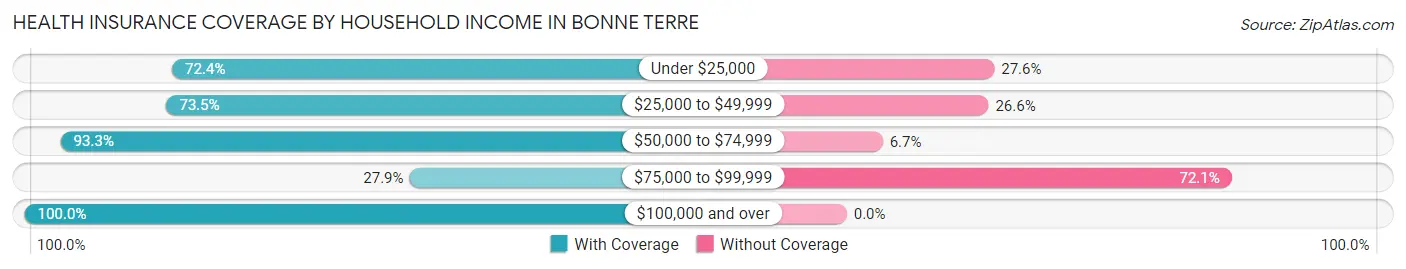
| Household Income | With Coverage | Without Coverage |
| Under $25,000 | 702 (72.4%) | 268 (27.6%) |
| $25,000 to $49,999 | 1,303 (73.5%) | 471 (26.6%) |
| $50,000 to $74,999 | 291 (93.3%) | 21 (6.7%) |
| $75,000 to $99,999 | 160 (27.9%) | 413 (72.1%) |
| $100,000 and over | 1,128 (100.0%) | 0 (0.0%) |
Public vs Private Health Insurance Coverage by Age in Bonne Terre
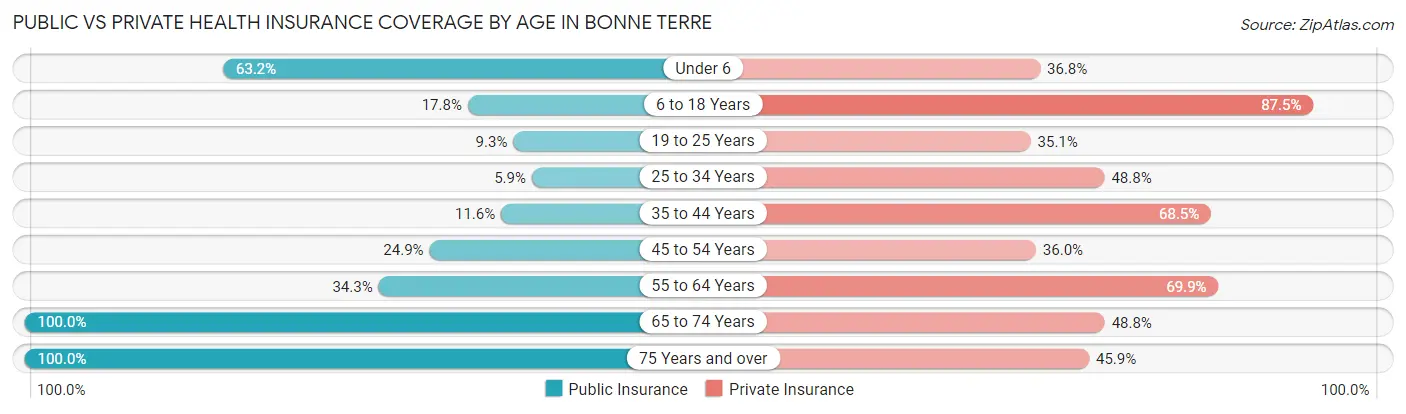
| Age Bracket | Public Insurance | Private Insurance |
| Under 6 | 206 (63.2%) | 120 (36.8%) |
| 6 to 18 Years | 98 (17.7%) | 483 (87.5%) |
| 19 to 25 Years | 65 (9.3%) | 245 (35.0%) |
| 25 to 34 Years | 45 (5.9%) | 375 (48.8%) |
| 35 to 44 Years | 68 (11.6%) | 403 (68.5%) |
| 45 to 54 Years | 178 (24.9%) | 258 (36.0%) |
| 55 to 64 Years | 187 (34.3%) | 381 (69.9%) |
| 65 to 74 Years | 209 (100.0%) | 102 (48.8%) |
| 75 Years and over | 353 (100.0%) | 162 (45.9%) |
| Total | 1,409 (29.6%) | 2,529 (53.2%) |
Disability Status by Sex by Age in Bonne Terre
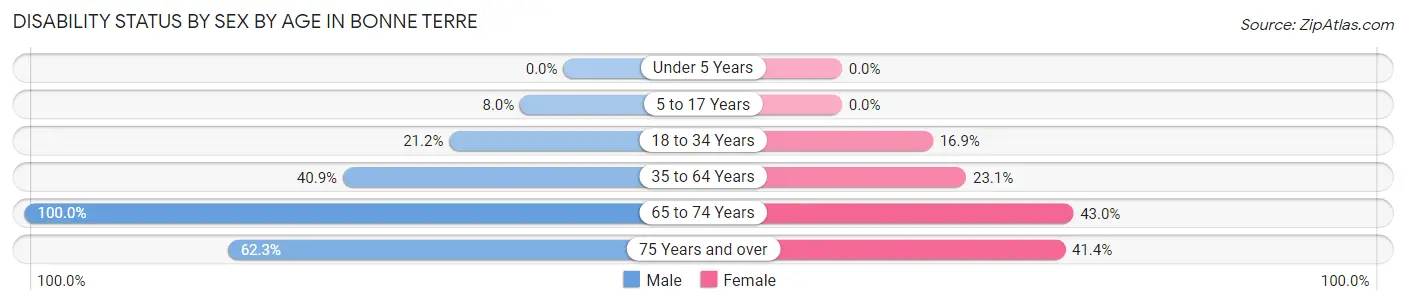
| Age Bracket | Male | Female |
| Under 5 Years | 0 (0.0%) | 0 (0.0%) |
| 5 to 17 Years | 26 (8.0%) | 0 (0.0%) |
| 18 to 34 Years | 201 (21.2%) | 96 (16.9%) |
| 35 to 64 Years | 446 (40.9%) | 175 (23.1%) |
| 65 to 74 Years | 60 (100.0%) | 64 (42.9%) |
| 75 Years and over | 38 (62.3%) | 121 (41.4%) |
Disability Class by Sex by Age in Bonne Terre
Disability Class: Hearing Difficulty
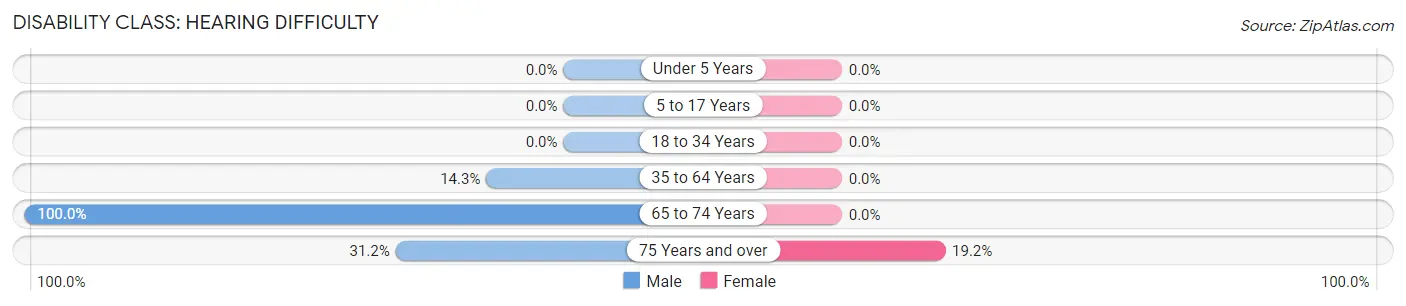
| Age Bracket | Male | Female |
| Under 5 Years | 0 (0.0%) | 0 (0.0%) |
| 5 to 17 Years | 0 (0.0%) | 0 (0.0%) |
| 18 to 34 Years | 0 (0.0%) | 0 (0.0%) |
| 35 to 64 Years | 156 (14.3%) | 0 (0.0%) |
| 65 to 74 Years | 60 (100.0%) | 0 (0.0%) |
| 75 Years and over | 19 (31.1%) | 56 (19.2%) |
Disability Class: Vision Difficulty
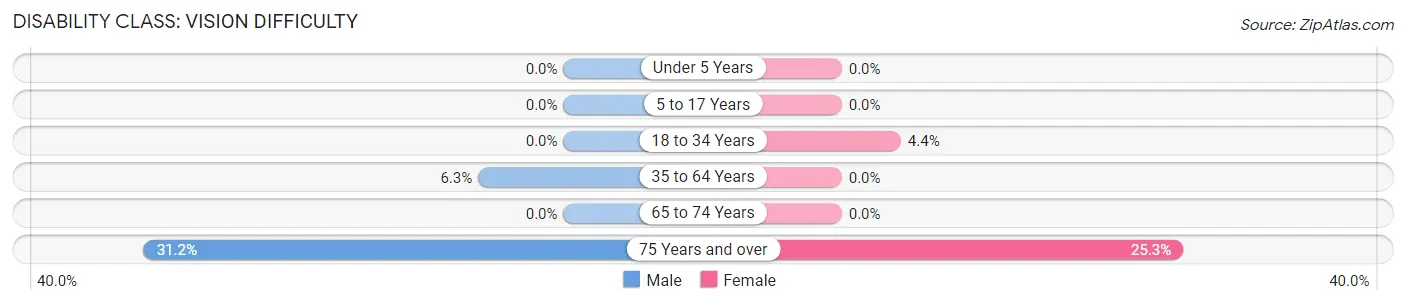
| Age Bracket | Male | Female |
| Under 5 Years | 0 (0.0%) | 0 (0.0%) |
| 5 to 17 Years | 0 (0.0%) | 0 (0.0%) |
| 18 to 34 Years | 0 (0.0%) | 25 (4.4%) |
| 35 to 64 Years | 69 (6.3%) | 0 (0.0%) |
| 65 to 74 Years | 0 (0.0%) | 0 (0.0%) |
| 75 Years and over | 19 (31.1%) | 74 (25.3%) |
Disability Class: Cognitive Difficulty
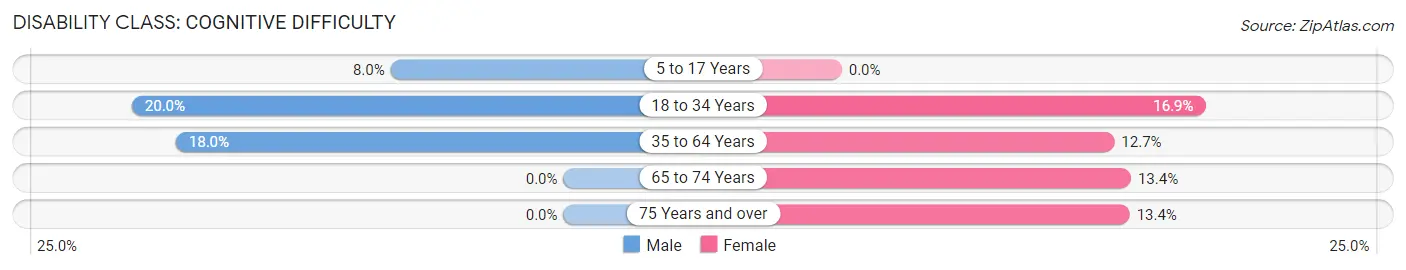
| Age Bracket | Male | Female |
| 5 to 17 Years | 26 (8.0%) | 0 (0.0%) |
| 18 to 34 Years | 190 (20.0%) | 96 (16.9%) |
| 35 to 64 Years | 196 (18.0%) | 96 (12.7%) |
| 65 to 74 Years | 0 (0.0%) | 20 (13.4%) |
| 75 Years and over | 0 (0.0%) | 39 (13.4%) |
Disability Class: Ambulatory Difficulty
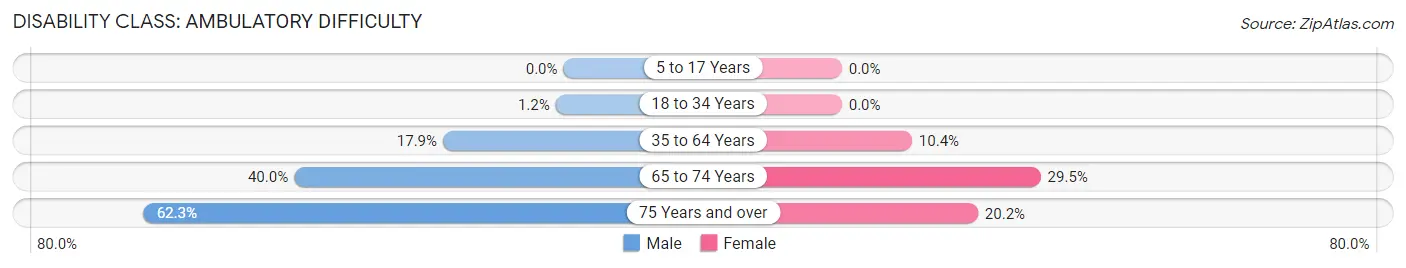
| Age Bracket | Male | Female |
| 5 to 17 Years | 0 (0.0%) | 0 (0.0%) |
| 18 to 34 Years | 11 (1.2%) | 0 (0.0%) |
| 35 to 64 Years | 195 (17.9%) | 79 (10.4%) |
| 65 to 74 Years | 24 (40.0%) | 44 (29.5%) |
| 75 Years and over | 38 (62.3%) | 59 (20.2%) |
Disability Class: Self-Care Difficulty
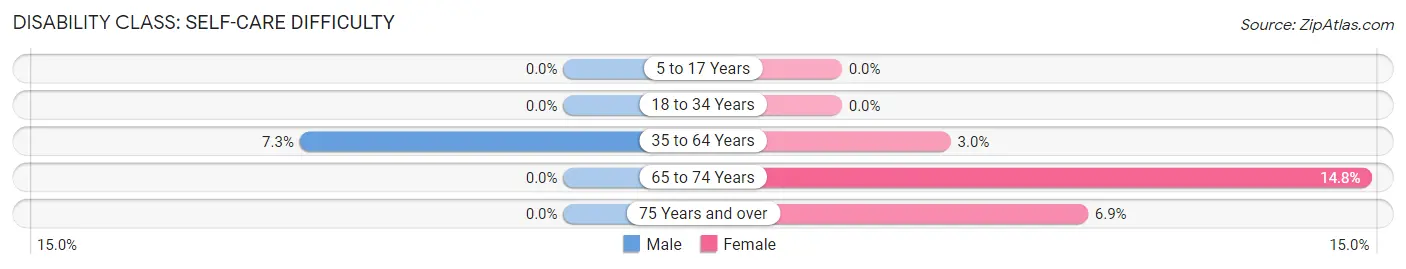
| Age Bracket | Male | Female |
| 5 to 17 Years | 0 (0.0%) | 0 (0.0%) |
| 18 to 34 Years | 0 (0.0%) | 0 (0.0%) |
| 35 to 64 Years | 80 (7.3%) | 23 (3.0%) |
| 65 to 74 Years | 0 (0.0%) | 22 (14.8%) |
| 75 Years and over | 0 (0.0%) | 20 (6.9%) |
Technology Access in Bonne Terre
Computing Device Access in Bonne Terre
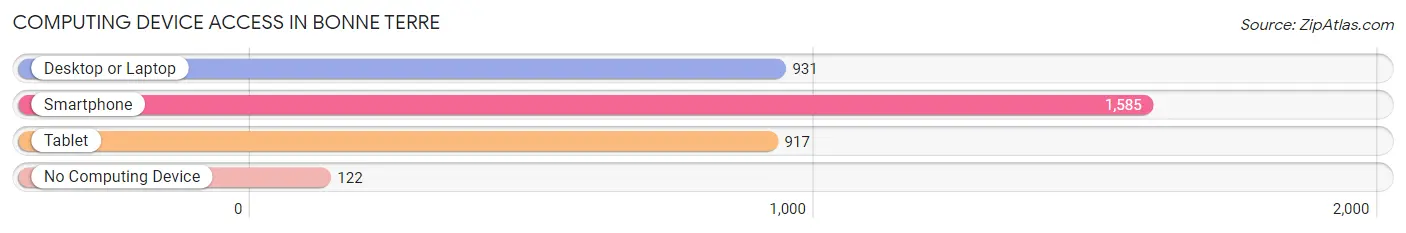
| Device Type | # Households | % Households |
| Desktop or Laptop | 931 | 51.1% |
| Smartphone | 1,585 | 87.1% |
| Tablet | 917 | 50.4% |
| No Computing Device | 122 | 6.7% |
| Total | 1,820 | 100.0% |
Internet Access in Bonne Terre
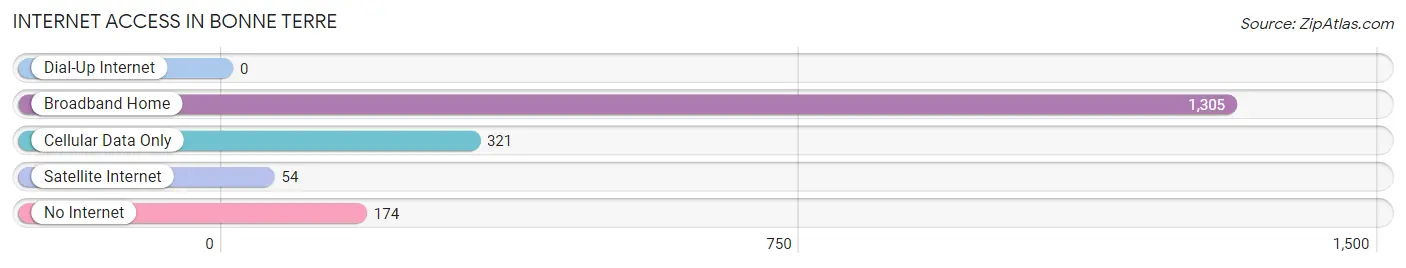
| Internet Type | # Households | % Households |
| Dial-Up Internet | 0 | 0.0% |
| Broadband Home | 1,305 | 71.7% |
| Cellular Data Only | 321 | 17.6% |
| Satellite Internet | 54 | 3.0% |
| No Internet | 174 | 9.6% |
| Total | 1,820 | 100.0% |
Bonne Terre Summary
Bonne Terre, Missouri is a small city located in St. Francois County in the southeastern part of the state. It is situated on the banks of the Big River, and is home to a population of approximately 5,000 people. The city is known for its rich history, diverse geography, and vibrant economy.
History
Bonne Terre was founded in 1819 by French settlers who named the city after the French phrase for “good earth.” The city was originally a farming community, and the settlers grew crops such as corn, wheat, and tobacco. The city was also home to a number of coal mines, which provided employment for many of the residents. In the late 19th century, the city began to grow and develop, and by the early 20th century, it had become a bustling industrial center.
The city was also home to a number of notable figures, including the first African-American mayor of Bonne Terre, William H. Johnson, who served from 1891 to 1895. The city was also the birthplace of the famous American author, Mark Twain, who was born in 1835.
Geography
Bonne Terre is located in the southeastern part of Missouri, and is situated on the banks of the Big River. The city is surrounded by rolling hills and lush forests, and is home to a number of parks and recreational areas. The city is also home to a number of lakes, including Lake Bismarck, which is a popular spot for fishing and boating.
The city is located approximately 50 miles south of St. Louis, and is easily accessible by car or train. The city is also home to a number of small towns and villages, including Desloge, Park Hills, and Farmington.
Economy
Bonne Terre is home to a vibrant economy, and is home to a number of businesses and industries. The city is home to a number of manufacturing companies, including a steel mill, a paper mill, and a number of other industrial plants. The city is also home to a number of retail stores, restaurants, and other businesses.
The city is also home to a number of educational institutions, including the Mineral Area College, which is a two-year community college. The city is also home to a number of healthcare facilities, including a hospital and a number of clinics.
Demographics
As of the 2010 census, the population of Bonne Terre was 5,099. The city is predominantly white, with approximately 87.3% of the population identifying as white. The city is also home to a small African-American population, with approximately 8.3% of the population identifying as African-American. The city is also home to a small Hispanic population, with approximately 2.2% of the population identifying as Hispanic or Latino. The city is also home to a small Asian population, with approximately 0.7% of the population identifying as Asian. The median household income in Bonne Terre is $37,941, and the median home value is $90,000.
Common Questions
What is Per Capita Income in Bonne Terre?
Per Capita income in Bonne Terre is $15,744.
What is the Median Family Income in Bonne Terre?
Median Family Income in Bonne Terre is $47,893.
What is the Median Household income in Bonne Terre?
Median Household Income in Bonne Terre is $34,409.
What is Income or Wage Gap in Bonne Terre?
Income or Wage Gap in Bonne Terre is 21.0%.
Women in Bonne Terre earn 79.0 cents for every dollar earned by a man.
What is Inequality or Gini Index in Bonne Terre?
Inequality or Gini Index in Bonne Terre is 0.47.
What is the Total Population of Bonne Terre?
Total Population of Bonne Terre is 6,863.
What is the Total Male Population of Bonne Terre?
Total Male Population of Bonne Terre is 4,577.
What is the Total Female Population of Bonne Terre?
Total Female Population of Bonne Terre is 2,286.
What is the Ratio of Males per 100 Females in Bonne Terre?
There are 200.22 Males per 100 Females in Bonne Terre.
What is the Ratio of Females per 100 Males in Bonne Terre?
There are 49.95 Females per 100 Males in Bonne Terre.
What is the Median Population Age in Bonne Terre?
Median Population Age in Bonne Terre is 39.0 Years.
What is the Average Family Size in Bonne Terre
Average Family Size in Bonne Terre is 3.5 People.
What is the Average Household Size in Bonne Terre
Average Household Size in Bonne Terre is 2.6 People.
How Large is the Labor Force in Bonne Terre?
There are 2,128 People in the Labor Forcein in Bonne Terre.
What is the Percentage of People in the Labor Force in Bonne Terre?
34.9% of People are in the Labor Force in Bonne Terre.
What is the Unemployment Rate in Bonne Terre?
Unemployment Rate in Bonne Terre is 3.7%.