Sedalia, MO Map & Demographics
Sedalia Map
Sedalia Overview
$27,891
PER CAPITA INCOME
$61,517
AVG FAMILY INCOME
$48,518
AVG HOUSEHOLD INCOME
31.0%
WAGE / INCOME GAP [ % ]
69.0¢/ $1
WAGE / INCOME GAP [ $ ]
$11,042
FAMILY INCOME DEFICIT
0.47
INEQUALITY / GINI INDEX
21,767
TOTAL POPULATION
10,627
MALE POPULATION
11,140
FEMALE POPULATION
95.39
MALES / 100 FEMALES
104.83
FEMALES / 100 MALES
36.3
MEDIAN AGE
3.1
AVG FAMILY SIZE
2.4
AVG HOUSEHOLD SIZE
10,687
LABOR FORCE [ PEOPLE ]
62.9%
PERCENT IN LABOR FORCE
5.4%
UNEMPLOYMENT RATE
Sedalia Zip Codes
Sedalia Area Codes
Income in Sedalia
Income Overview in Sedalia
Per Capita Income in Sedalia is $27,891, while median incomes of families and households are $61,517 and $48,518 respectively.
| Characteristic | Number | Measure |
| Per Capita Income | 21,767 | $27,891 |
| Median Family Income | 5,299 | $61,517 |
| Mean Family Income | 5,299 | $78,197 |
| Median Household Income | 8,915 | $48,518 |
| Mean Household Income | 8,915 | $68,997 |
| Income Deficit | 5,299 | $11,042 |
| Wage / Income Gap (%) | 21,767 | 31.04% |
| Wage / Income Gap ($) | 21,767 | 68.96¢ per $1 |
| Gini / Inequality Index | 21,767 | 0.47 |
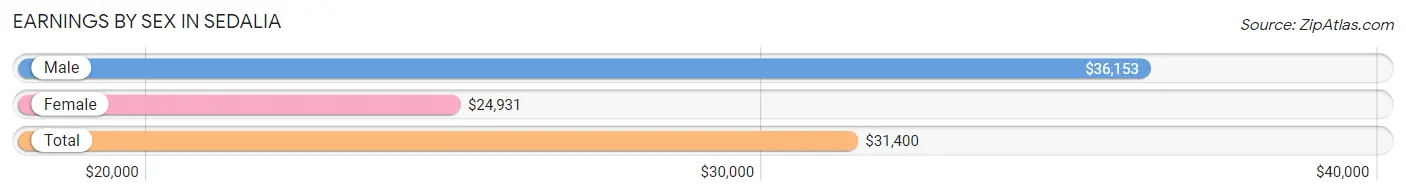
Earnings by Sex in Sedalia
Average Earnings in Sedalia are $31,400, $36,153 for men and $24,931 for women, a difference of 31.0%.
| Sex | Number | Average Earnings |
| Male | 5,706 (51.4%) | $36,153 |
| Female | 5,399 (48.6%) | $24,931 |
| Total | 11,105 (100.0%) | $31,400 |
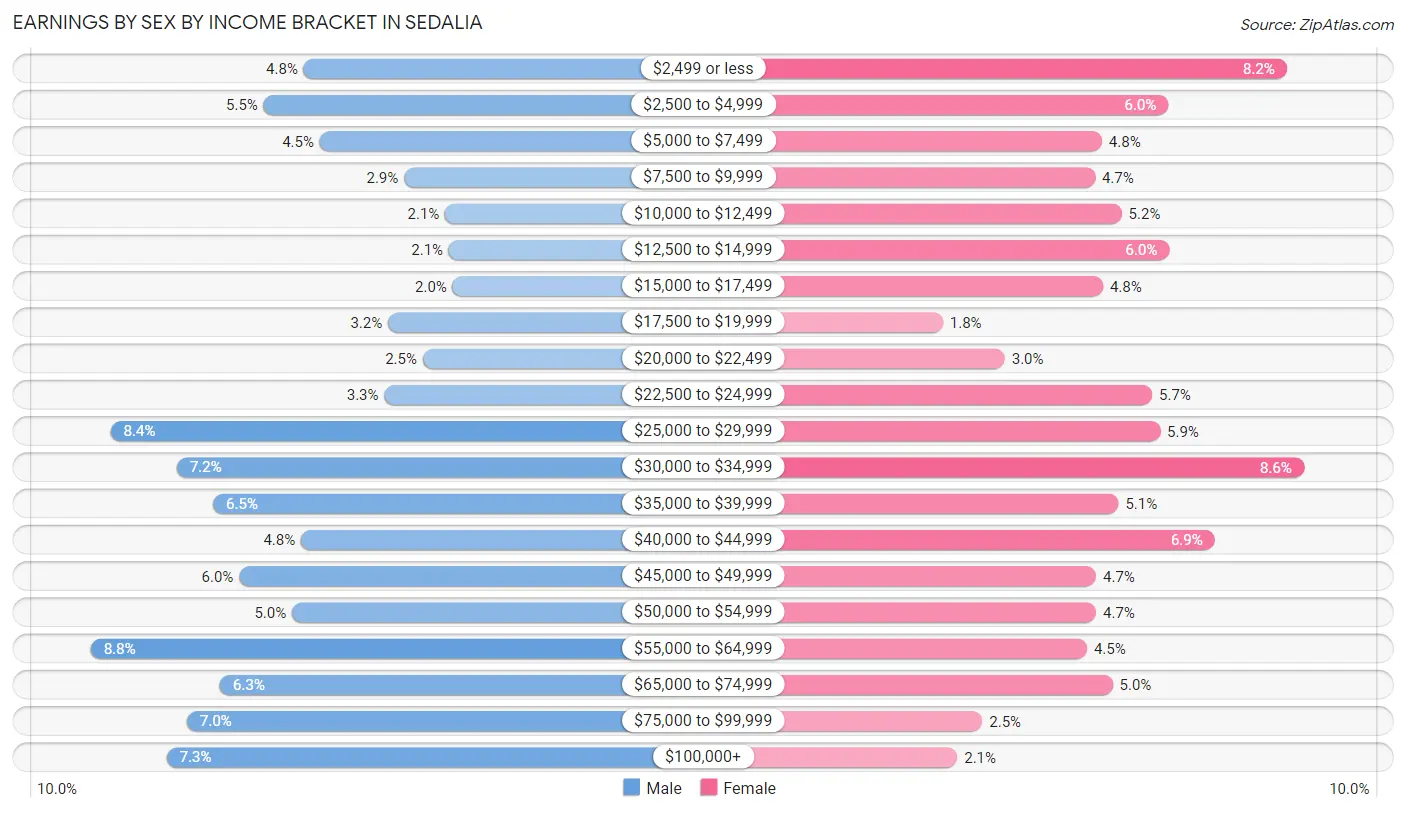
Earnings by Sex by Income Bracket in Sedalia
The most common earnings brackets in Sedalia are $55,000 to $64,999 for men (500 | 8.8%) and $30,000 to $34,999 for women (462 | 8.6%).
| Income | Male | Female |
| $2,499 or less | 272 (4.8%) | 445 (8.2%) |
| $2,500 to $4,999 | 315 (5.5%) | 325 (6.0%) |
| $5,000 to $7,499 | 255 (4.5%) | 258 (4.8%) |
| $7,500 to $9,999 | 165 (2.9%) | 251 (4.6%) |
| $10,000 to $12,499 | 121 (2.1%) | 278 (5.1%) |
| $12,500 to $14,999 | 117 (2.1%) | 326 (6.0%) |
| $15,000 to $17,499 | 113 (2.0%) | 259 (4.8%) |
| $17,500 to $19,999 | 182 (3.2%) | 97 (1.8%) |
| $20,000 to $22,499 | 145 (2.5%) | 160 (3.0%) |
| $22,500 to $24,999 | 186 (3.3%) | 309 (5.7%) |
| $25,000 to $29,999 | 479 (8.4%) | 317 (5.9%) |
| $30,000 to $34,999 | 408 (7.1%) | 462 (8.6%) |
| $35,000 to $39,999 | 369 (6.5%) | 275 (5.1%) |
| $40,000 to $44,999 | 275 (4.8%) | 372 (6.9%) |
| $45,000 to $49,999 | 341 (6.0%) | 252 (4.7%) |
| $50,000 to $54,999 | 285 (5.0%) | 252 (4.7%) |
| $55,000 to $64,999 | 500 (8.8%) | 243 (4.5%) |
| $65,000 to $74,999 | 362 (6.3%) | 269 (5.0%) |
| $75,000 to $99,999 | 397 (7.0%) | 137 (2.5%) |
| $100,000+ | 419 (7.3%) | 112 (2.1%) |
| Total | 5,706 (100.0%) | 5,399 (100.0%) |
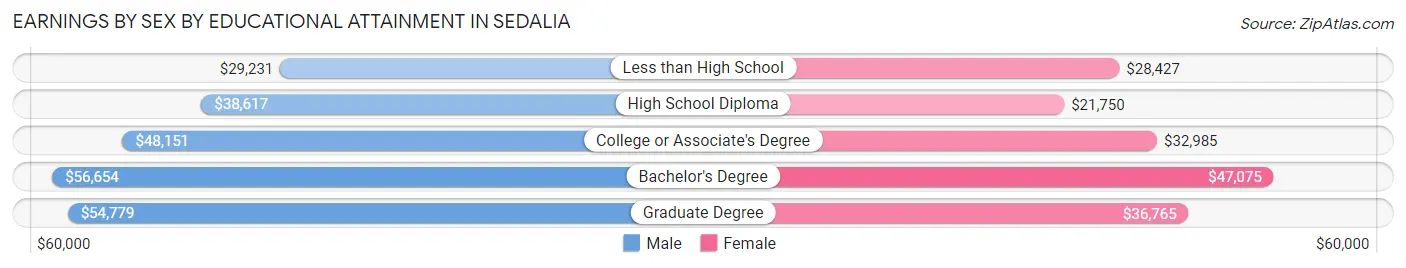
Earnings by Sex by Educational Attainment in Sedalia
Average earnings in Sedalia are $42,748 for men and $32,242 for women, a difference of 24.6%. Men with an educational attainment of bachelor's degree enjoy the highest average annual earnings of $56,654, while those with less than high school education earn the least with $29,231. Women with an educational attainment of bachelor's degree earn the most with the average annual earnings of $47,075, while those with high school diploma education have the smallest earnings of $21,750.
| Educational Attainment | Male Income | Female Income |
| Less than High School | $29,231 | $28,427 |
| High School Diploma | $38,617 | $21,750 |
| College or Associate's Degree | $48,151 | $32,985 |
| Bachelor's Degree | $56,654 | $47,075 |
| Graduate Degree | $54,779 | $36,765 |
| Total | $42,748 | $32,242 |
Family Income in Sedalia
Family Income Brackets in Sedalia
According to the Sedalia family income data, there are 1,367 families falling into the $50,000 to $74,999 income range, which is the most common income bracket and makes up 25.8% of all families. Conversely, the $10,000 to $14,999 income bracket is the least frequent group with only 95 families (1.8%) belonging to this category.
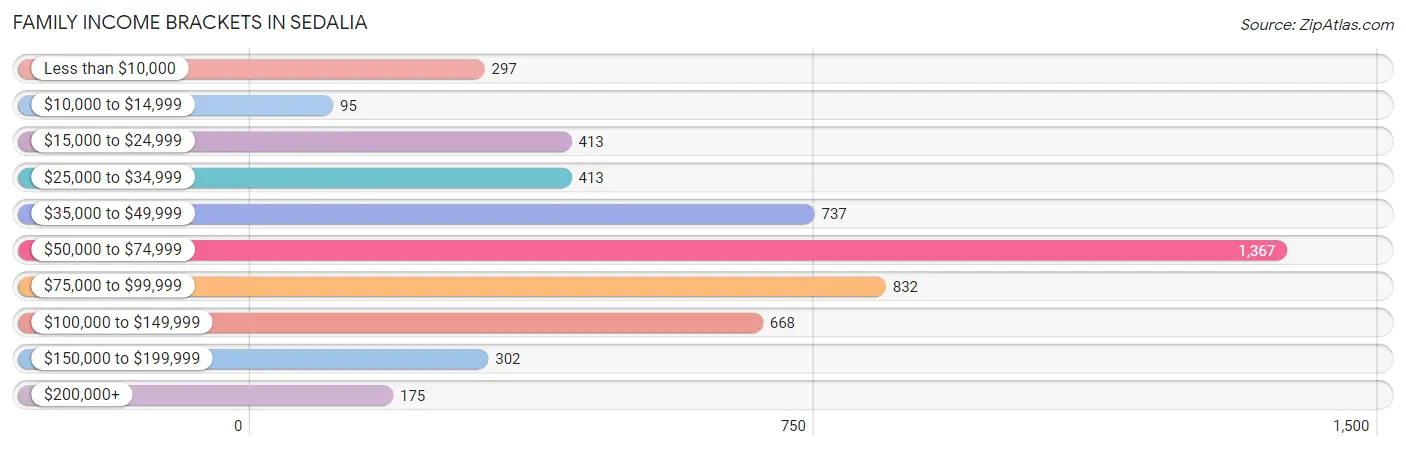
| Income Bracket | # Families | % Families |
| Less than $10,000 | 297 | 5.6% |
| $10,000 to $14,999 | 95 | 1.8% |
| $15,000 to $24,999 | 413 | 7.8% |
| $25,000 to $34,999 | 413 | 7.8% |
| $35,000 to $49,999 | 737 | 13.9% |
| $50,000 to $74,999 | 1,367 | 25.8% |
| $75,000 to $99,999 | 832 | 15.7% |
| $100,000 to $149,999 | 668 | 12.6% |
| $150,000 to $199,999 | 302 | 5.7% |
| $200,000+ | 175 | 3.3% |
Family Income by Famaliy Size in Sedalia
6-person families (151 | 2.9%) account for the highest median family income in Sedalia with $79,766 per family, while 2-person families (2,655 | 50.1%) have the highest median income of $27,540 per family member.
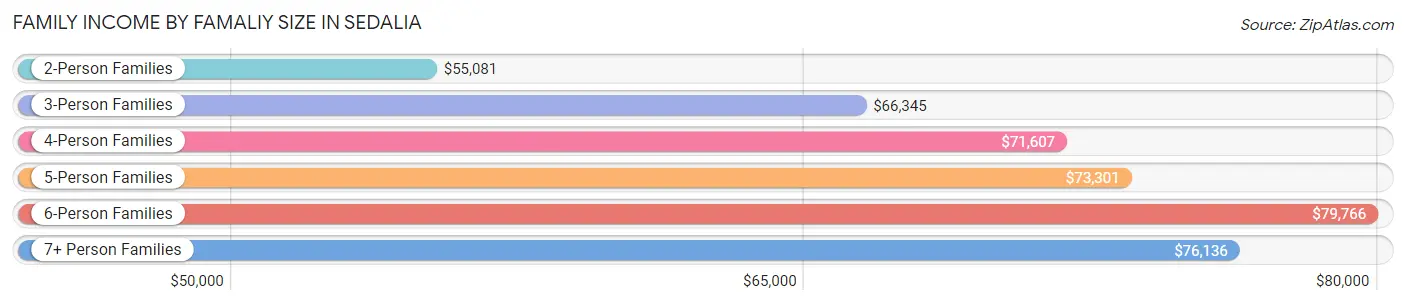
| Income Bracket | # Families | Median Income |
| 2-Person Families | 2,655 (50.1%) | $55,081 |
| 3-Person Families | 1,067 (20.1%) | $66,345 |
| 4-Person Families | 1,021 (19.3%) | $71,607 |
| 5-Person Families | 337 (6.4%) | $73,301 |
| 6-Person Families | 151 (2.9%) | $79,766 |
| 7+ Person Families | 68 (1.3%) | $76,136 |
| Total | 5,299 (100.0%) | $61,517 |
Family Income by Number of Earners in Sedalia
The median family income in Sedalia is $61,517, with families comprising 3+ earners (543) having the highest median family income of $104,875, while families with no earners (826) have the lowest median family income of $38,298, accounting for 10.2% and 15.6% of families, respectively.
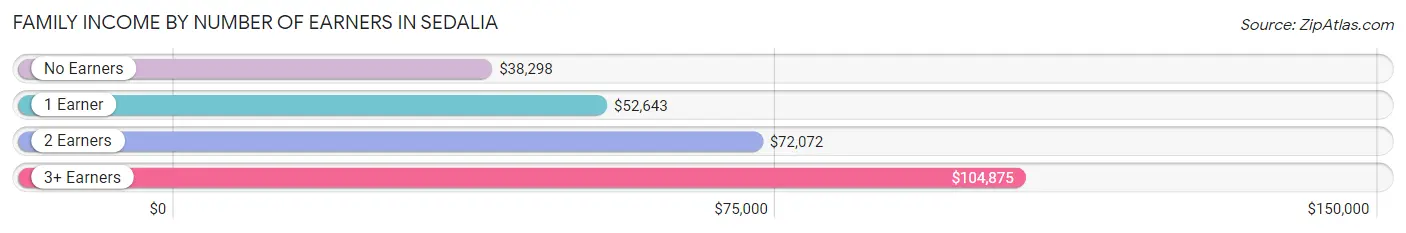
| Number of Earners | # Families | Median Income |
| No Earners | 826 (15.6%) | $38,298 |
| 1 Earner | 2,045 (38.6%) | $52,643 |
| 2 Earners | 1,885 (35.6%) | $72,072 |
| 3+ Earners | 543 (10.2%) | $104,875 |
| Total | 5,299 (100.0%) | $61,517 |
Household Income in Sedalia
Household Income Brackets in Sedalia
With 1,703 households falling in the category, the $50,000 to $74,999 income range is the most frequent in Sedalia, accounting for 19.1% of all households. In contrast, only 259 households (2.9%) fall into the $200,000+ income bracket, making it the least populous group.
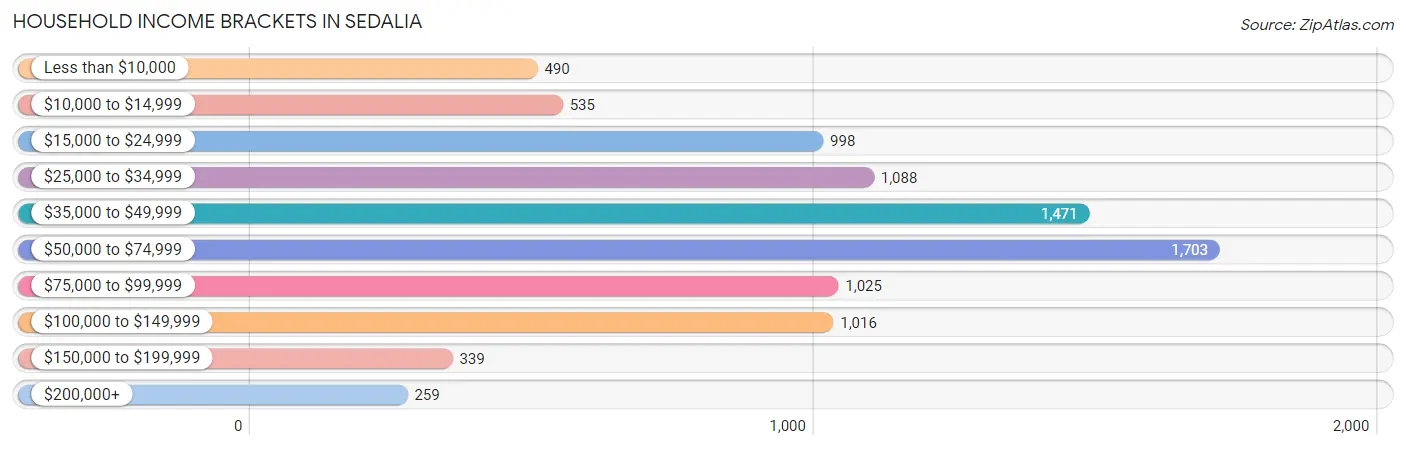
| Income Bracket | # Households | % Households |
| Less than $10,000 | 490 | 5.5% |
| $10,000 to $14,999 | 535 | 6.0% |
| $15,000 to $24,999 | 998 | 11.2% |
| $25,000 to $34,999 | 1,088 | 12.2% |
| $35,000 to $49,999 | 1,471 | 16.5% |
| $50,000 to $74,999 | 1,703 | 19.1% |
| $75,000 to $99,999 | 1,025 | 11.5% |
| $100,000 to $149,999 | 1,016 | 11.4% |
| $150,000 to $199,999 | 339 | 3.8% |
| $200,000+ | 259 | 2.9% |
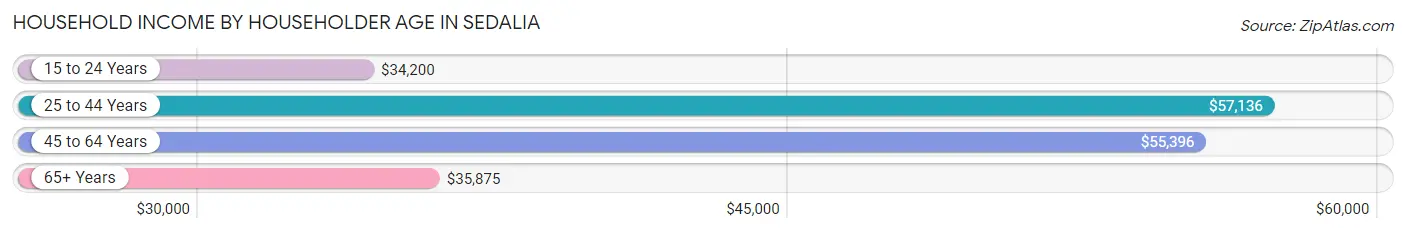
Household Income by Householder Age in Sedalia
The median household income in Sedalia is $48,518, with the highest median household income of $57,136 found in the 25 to 44 years age bracket for the primary householder. A total of 2,931 households (32.9%) fall into this category. Meanwhile, the 15 to 24 years age bracket for the primary householder has the lowest median household income of $34,200, with 613 households (6.9%) in this group.
| Income Bracket | # Households | Median Income |
| 15 to 24 Years | 613 (6.9%) | $34,200 |
| 25 to 44 Years | 2,931 (32.9%) | $57,136 |
| 45 to 64 Years | 2,867 (32.2%) | $55,396 |
| 65+ Years | 2,504 (28.1%) | $35,875 |
| Total | 8,915 (100.0%) | $48,518 |
Poverty in Sedalia
Income Below Poverty by Sex and Age in Sedalia
With 14.8% poverty level for males and 20.3% for females among the residents of Sedalia, 12 to 14 year old males and 5 year old females are the most vulnerable to poverty, with 154 males (35.3%) and 81 females (52.3%) in their respective age groups living below the poverty level.
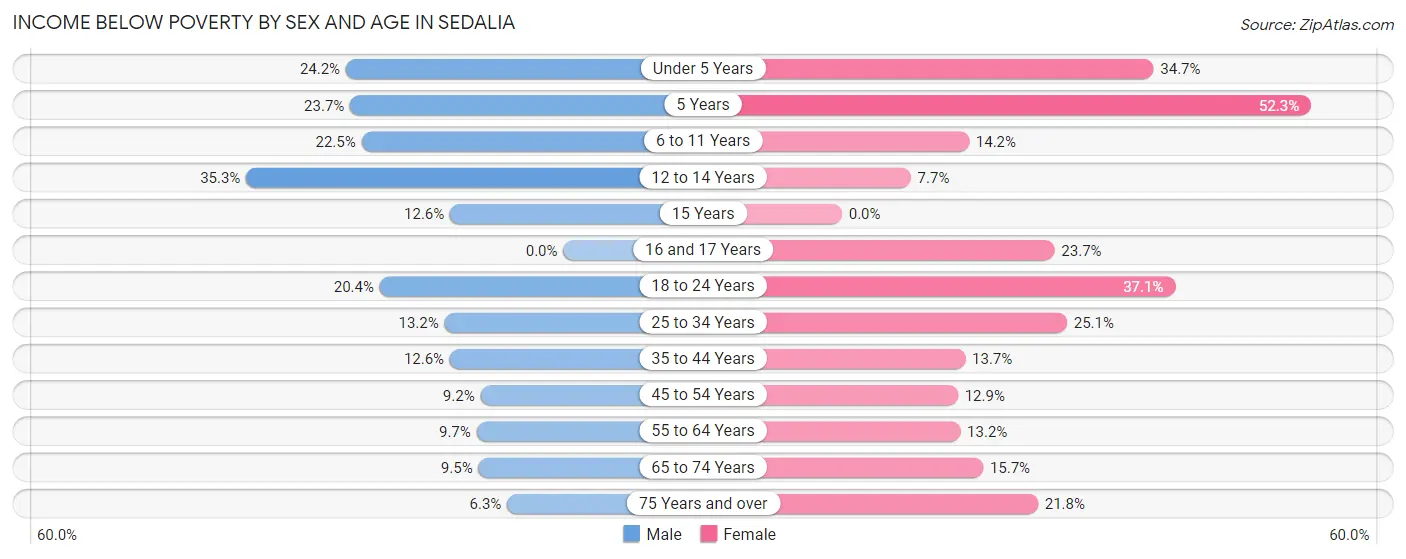
| Age Bracket | Male | Female |
| Under 5 Years | 230 (24.2%) | 246 (34.7%) |
| 5 Years | 33 (23.7%) | 81 (52.3%) |
| 6 to 11 Years | 195 (22.5%) | 135 (14.1%) |
| 12 to 14 Years | 154 (35.3%) | 27 (7.7%) |
| 15 Years | 14 (12.6%) | 0 (0.0%) |
| 16 and 17 Years | 0 (0.0%) | 76 (23.7%) |
| 18 to 24 Years | 222 (20.4%) | 385 (37.1%) |
| 25 to 34 Years | 185 (13.2%) | 388 (25.1%) |
| 35 to 44 Years | 164 (12.6%) | 179 (13.7%) |
| 45 to 54 Years | 106 (9.2%) | 144 (12.9%) |
| 55 to 64 Years | 119 (9.7%) | 162 (13.2%) |
| 65 to 74 Years | 89 (9.5%) | 171 (15.7%) |
| 75 Years and over | 32 (6.3%) | 217 (21.8%) |
| Total | 1,543 (14.8%) | 2,211 (20.3%) |
Income Above Poverty by Sex and Age in Sedalia
According to the poverty statistics in Sedalia, males aged 16 and 17 years and females aged 15 years are the age groups that are most secure financially, with 100.0% of males and 100.0% of females in these age groups living above the poverty line.
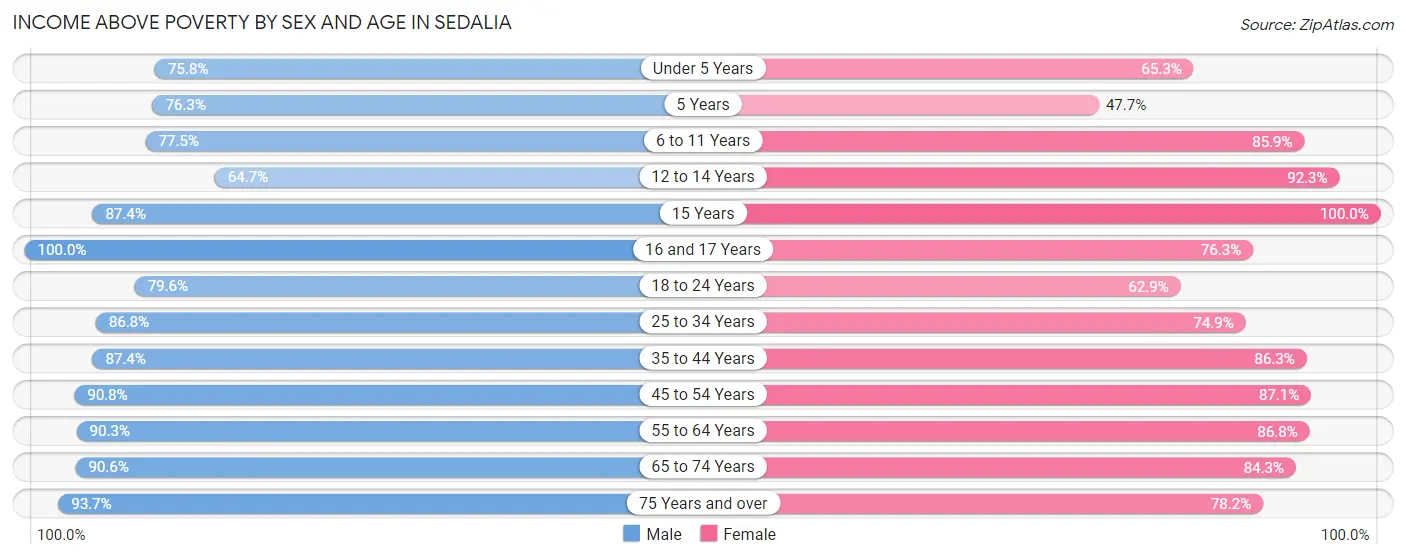
| Age Bracket | Male | Female |
| Under 5 Years | 720 (75.8%) | 463 (65.3%) |
| 5 Years | 106 (76.3%) | 74 (47.7%) |
| 6 to 11 Years | 673 (77.5%) | 819 (85.9%) |
| 12 to 14 Years | 282 (64.7%) | 325 (92.3%) |
| 15 Years | 97 (87.4%) | 72 (100.0%) |
| 16 and 17 Years | 304 (100.0%) | 245 (76.3%) |
| 18 to 24 Years | 864 (79.6%) | 652 (62.9%) |
| 25 to 34 Years | 1,213 (86.8%) | 1,160 (74.9%) |
| 35 to 44 Years | 1,134 (87.4%) | 1,125 (86.3%) |
| 45 to 54 Years | 1,042 (90.8%) | 971 (87.1%) |
| 55 to 64 Years | 1,113 (90.3%) | 1,067 (86.8%) |
| 65 to 74 Years | 853 (90.5%) | 917 (84.3%) |
| 75 Years and over | 479 (93.7%) | 777 (78.2%) |
| Total | 8,880 (85.2%) | 8,667 (79.7%) |
Income Below Poverty Among Married-Couple Families in Sedalia
The poverty statistics for married-couple families in Sedalia show that 6.1% or 210 of the total 3,414 families live below the poverty line. Families with 5 or more children have the highest poverty rate of 45.0%, comprising of 18 families. On the other hand, families with no children have the lowest poverty rate of 2.2%, which includes 41 families.
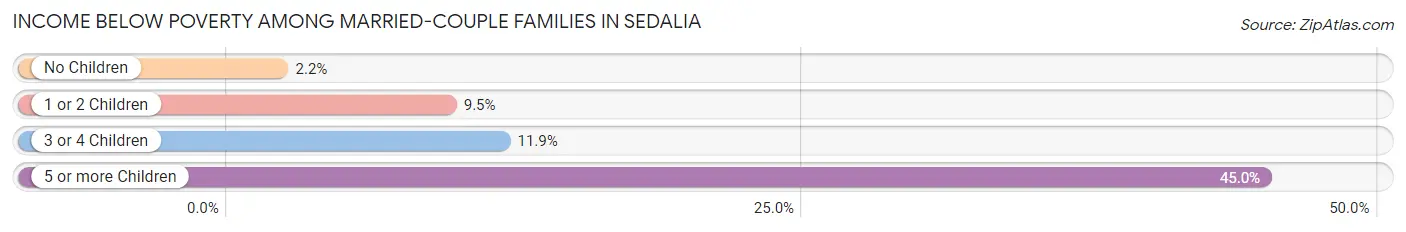
| Children | Above Poverty | Below Poverty |
| No Children | 1,820 (97.8%) | 41 (2.2%) |
| 1 or 2 Children | 1,102 (90.5%) | 116 (9.5%) |
| 3 or 4 Children | 260 (88.1%) | 35 (11.9%) |
| 5 or more Children | 22 (55.0%) | 18 (45.0%) |
| Total | 3,204 (93.9%) | 210 (6.1%) |
Income Below Poverty Among Single-Parent Households in Sedalia
According to the poverty data in Sedalia, 10.9% or 58 single-father households and 28.3% or 383 single-mother households are living below the poverty line. Among single-father households, those with no children have the highest poverty rate, with 40 households (22.0%) experiencing poverty. Likewise, among single-mother households, those with 5 or more children have the highest poverty rate, with 6 households (100.0%) falling below the poverty line.
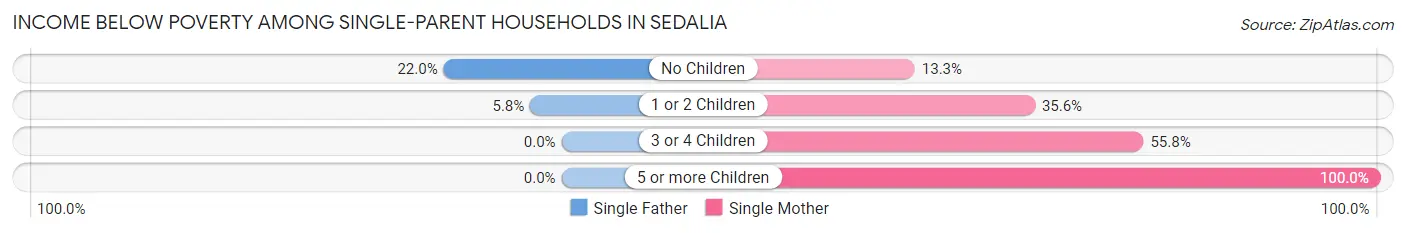
| Children | Single Father | Single Mother |
| No Children | 40 (22.0%) | 70 (13.3%) |
| 1 or 2 Children | 18 (5.8%) | 264 (35.6%) |
| 3 or 4 Children | 0 (0.0%) | 43 (55.8%) |
| 5 or more Children | 0 (0.0%) | 6 (100.0%) |
| Total | 58 (10.9%) | 383 (28.3%) |
Income Below Poverty Among Married-Couple vs Single-Parent Households in Sedalia
The poverty data for Sedalia shows that 210 of the married-couple family households (6.1%) and 441 of the single-parent households (23.4%) are living below the poverty level. Within the married-couple family households, those with 5 or more children have the highest poverty rate, with 18 households (45.0%) falling below the poverty line. Among the single-parent households, those with 5 or more children have the highest poverty rate, with 6 household (100.0%) living below poverty.
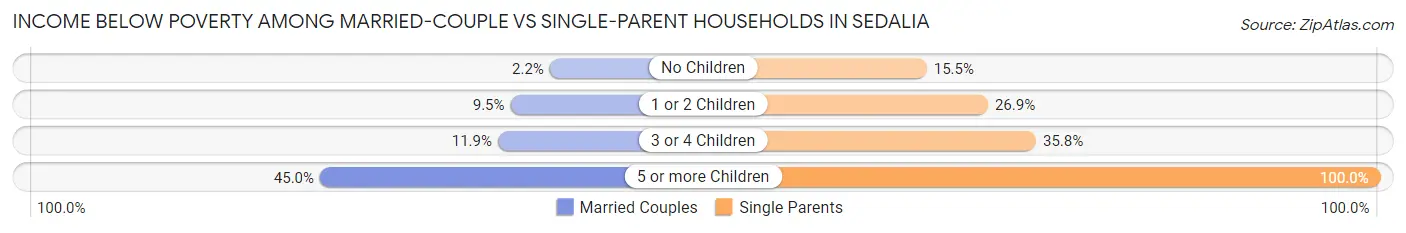
| Children | Married-Couple Families | Single-Parent Households |
| No Children | 41 (2.2%) | 110 (15.5%) |
| 1 or 2 Children | 116 (9.5%) | 282 (26.9%) |
| 3 or 4 Children | 35 (11.9%) | 43 (35.8%) |
| 5 or more Children | 18 (45.0%) | 6 (100.0%) |
| Total | 210 (6.1%) | 441 (23.4%) |
Race in Sedalia
The most populous races in Sedalia are White / Caucasian (17,959 | 82.5%), Hispanic or Latino (3,007 | 13.8%), and Two or more Races (1,605 | 7.4%).
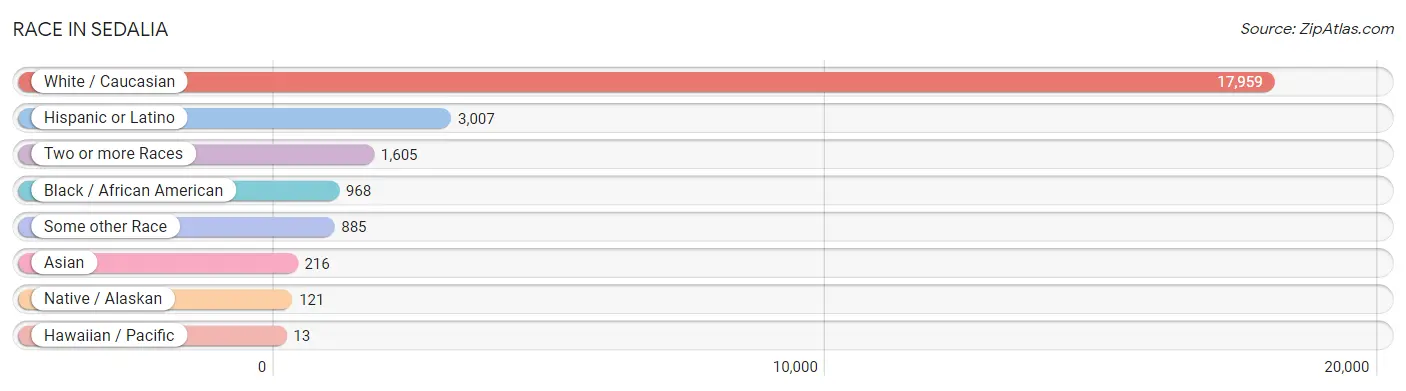
| Race | # Population | % Population |
| Asian | 216 | 1.0% |
| Black / African American | 968 | 4.4% |
| Hawaiian / Pacific | 13 | 0.1% |
| Hispanic or Latino | 3,007 | 13.8% |
| Native / Alaskan | 121 | 0.6% |
| White / Caucasian | 17,959 | 82.5% |
| Two or more Races | 1,605 | 7.4% |
| Some other Race | 885 | 4.1% |
| Total | 21,767 | 100.0% |
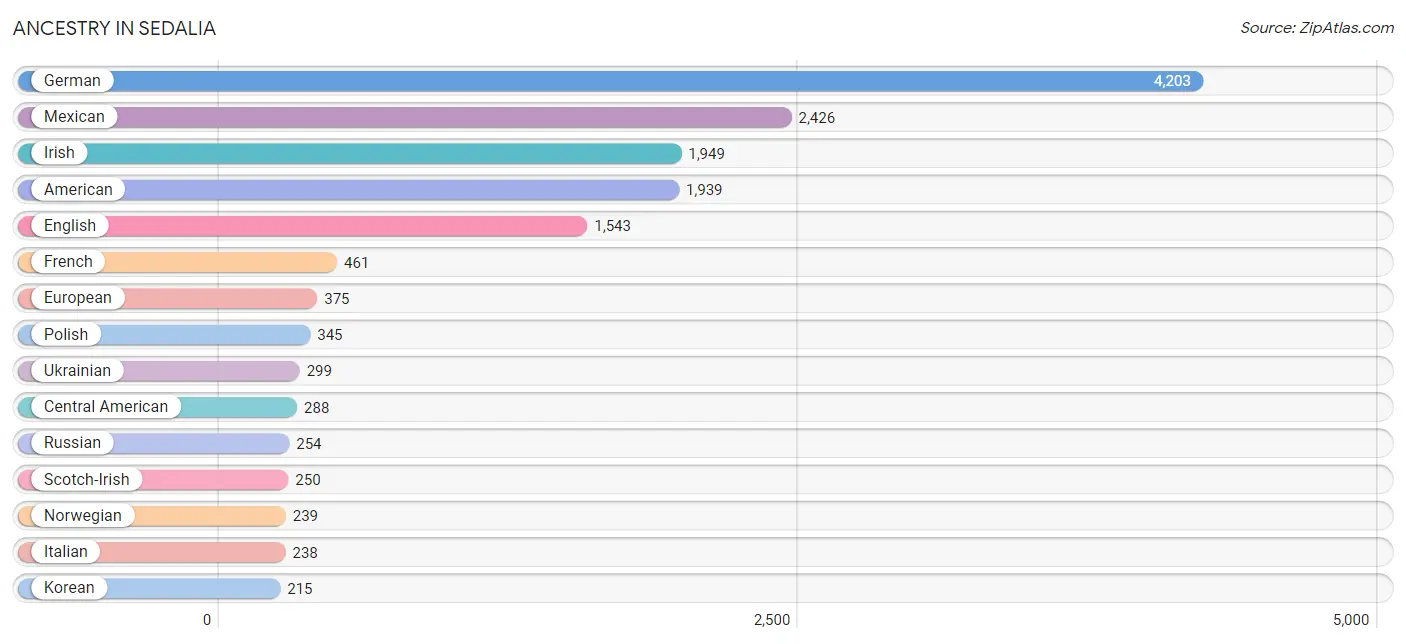
Ancestry in Sedalia
The most populous ancestries reported in Sedalia are German (4,203 | 19.3%), Mexican (2,426 | 11.2%), Irish (1,949 | 8.9%), American (1,939 | 8.9%), and English (1,543 | 7.1%), together accounting for 55.4% of all Sedalia residents.
| Ancestry | # Population | % Population |
| African | 16 | 0.1% |
| American | 1,939 | 8.9% |
| Austrian | 22 | 0.1% |
| Belgian | 6 | 0.0% |
| Bhutanese | 18 | 0.1% |
| Blackfeet | 51 | 0.2% |
| Brazilian | 5 | 0.0% |
| British | 34 | 0.2% |
| Canadian | 25 | 0.1% |
| Celtic | 13 | 0.1% |
| Central American | 288 | 1.3% |
| Cherokee | 98 | 0.4% |
| Colombian | 8 | 0.0% |
| Comanche | 4 | 0.0% |
| Czech | 174 | 0.8% |
| Danish | 14 | 0.1% |
| Dutch | 207 | 0.9% |
| Eastern European | 12 | 0.1% |
| Ecuadorian | 18 | 0.1% |
| English | 1,543 | 7.1% |
| Ethiopian | 7 | 0.0% |
| European | 375 | 1.7% |
| French | 461 | 2.1% |
| German | 4,203 | 19.3% |
| Greek | 29 | 0.1% |
| Guatemalan | 94 | 0.4% |
| Haitian | 89 | 0.4% |
| Honduran | 92 | 0.4% |
| Indian (Asian) | 52 | 0.2% |
| Irish | 1,949 | 8.9% |
| Italian | 238 | 1.1% |
| Jamaican | 30 | 0.1% |
| Japanese | 6 | 0.0% |
| Korean | 215 | 1.0% |
| Laotian | 8 | 0.0% |
| Marshallese | 49 | 0.2% |
| Mexican | 2,426 | 11.2% |
| Native Hawaiian | 44 | 0.2% |
| Nigerian | 7 | 0.0% |
| Northern European | 21 | 0.1% |
| Norwegian | 239 | 1.1% |
| Osage | 16 | 0.1% |
| Panamanian | 102 | 0.5% |
| Polish | 345 | 1.6% |
| Portuguese | 11 | 0.1% |
| Puerto Rican | 59 | 0.3% |
| Romanian | 49 | 0.2% |
| Russian | 254 | 1.2% |
| Scandinavian | 10 | 0.1% |
| Scotch-Irish | 250 | 1.1% |
| Scottish | 210 | 1.0% |
| Sioux | 1 | 0.0% |
| Slavic | 20 | 0.1% |
| Somali | 9 | 0.0% |
| South American | 26 | 0.1% |
| Soviet Union | 9 | 0.0% |
| Spaniard | 55 | 0.3% |
| Sri Lankan | 41 | 0.2% |
| Subsaharan African | 39 | 0.2% |
| Swedish | 176 | 0.8% |
| Thai | 35 | 0.2% |
| Trinidadian and Tobagonian | 45 | 0.2% |
| Ukrainian | 299 | 1.4% |
| Welsh | 64 | 0.3% |
| West Indian | 4 | 0.0% |
| Yugoslavian | 14 | 0.1% | View All 66 Rows |
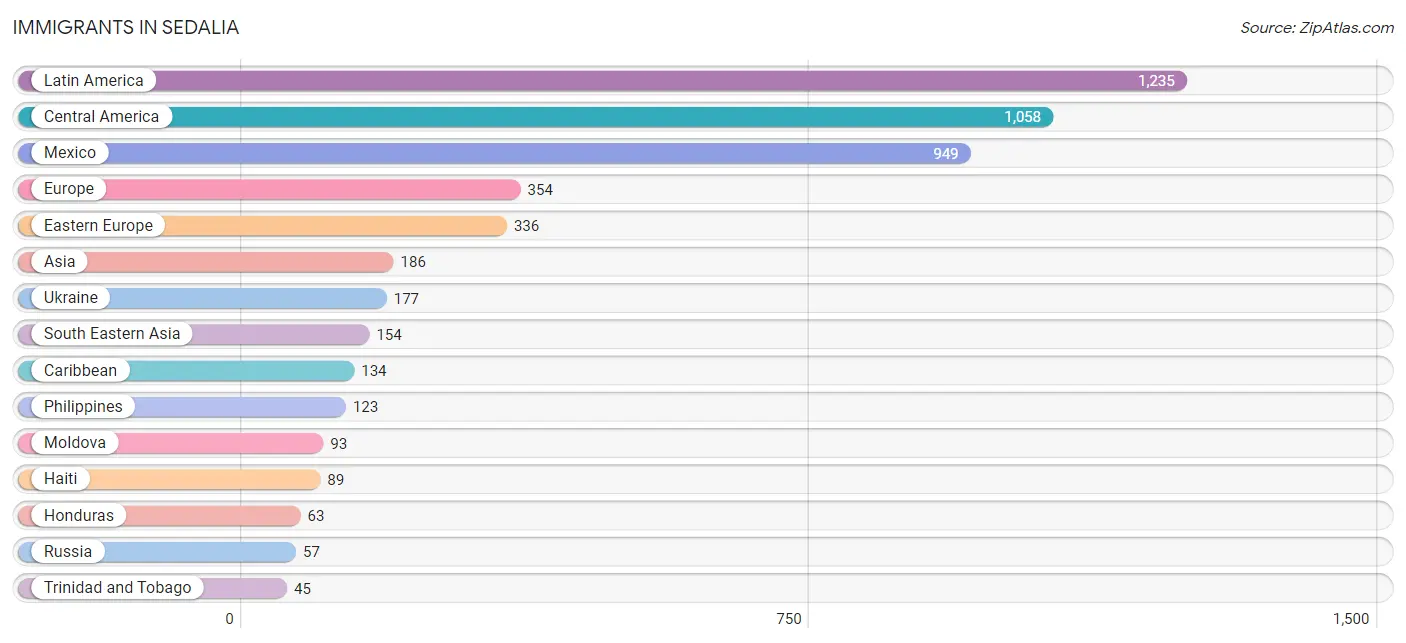
Immigrants in Sedalia
The most numerous immigrant groups reported in Sedalia came from Latin America (1,235 | 5.7%), Central America (1,058 | 4.9%), Mexico (949 | 4.4%), Europe (354 | 1.6%), and Eastern Europe (336 | 1.5%), together accounting for 18.1% of all Sedalia residents.
| Immigration Origin | # Population | % Population |
| Africa | 9 | 0.0% |
| Armenia | 8 | 0.0% |
| Asia | 186 | 0.9% |
| Brazil | 5 | 0.0% |
| Cambodia | 6 | 0.0% |
| Caribbean | 134 | 0.6% |
| Central America | 1,058 | 4.9% |
| Eastern Africa | 9 | 0.0% |
| Eastern Europe | 336 | 1.5% |
| Ecuador | 13 | 0.1% |
| England | 4 | 0.0% |
| Europe | 354 | 1.6% |
| Germany | 8 | 0.0% |
| Guatemala | 22 | 0.1% |
| Haiti | 89 | 0.4% |
| Honduras | 63 | 0.3% |
| India | 24 | 0.1% |
| Indonesia | 8 | 0.0% |
| Latin America | 1,235 | 5.7% |
| Mexico | 949 | 4.4% |
| Micronesia | 13 | 0.1% |
| Moldova | 93 | 0.4% |
| Northern Europe | 4 | 0.0% |
| Oceania | 13 | 0.1% |
| Panama | 24 | 0.1% |
| Philippines | 123 | 0.6% |
| Russia | 57 | 0.3% |
| Somalia | 9 | 0.0% |
| South America | 43 | 0.2% |
| South Central Asia | 24 | 0.1% |
| South Eastern Asia | 154 | 0.7% |
| Trinidad and Tobago | 45 | 0.2% |
| Ukraine | 177 | 0.8% |
| Venezuela | 25 | 0.1% |
| Vietnam | 17 | 0.1% |
| Western Asia | 8 | 0.0% |
| Western Europe | 8 | 0.0% | View All 37 Rows |
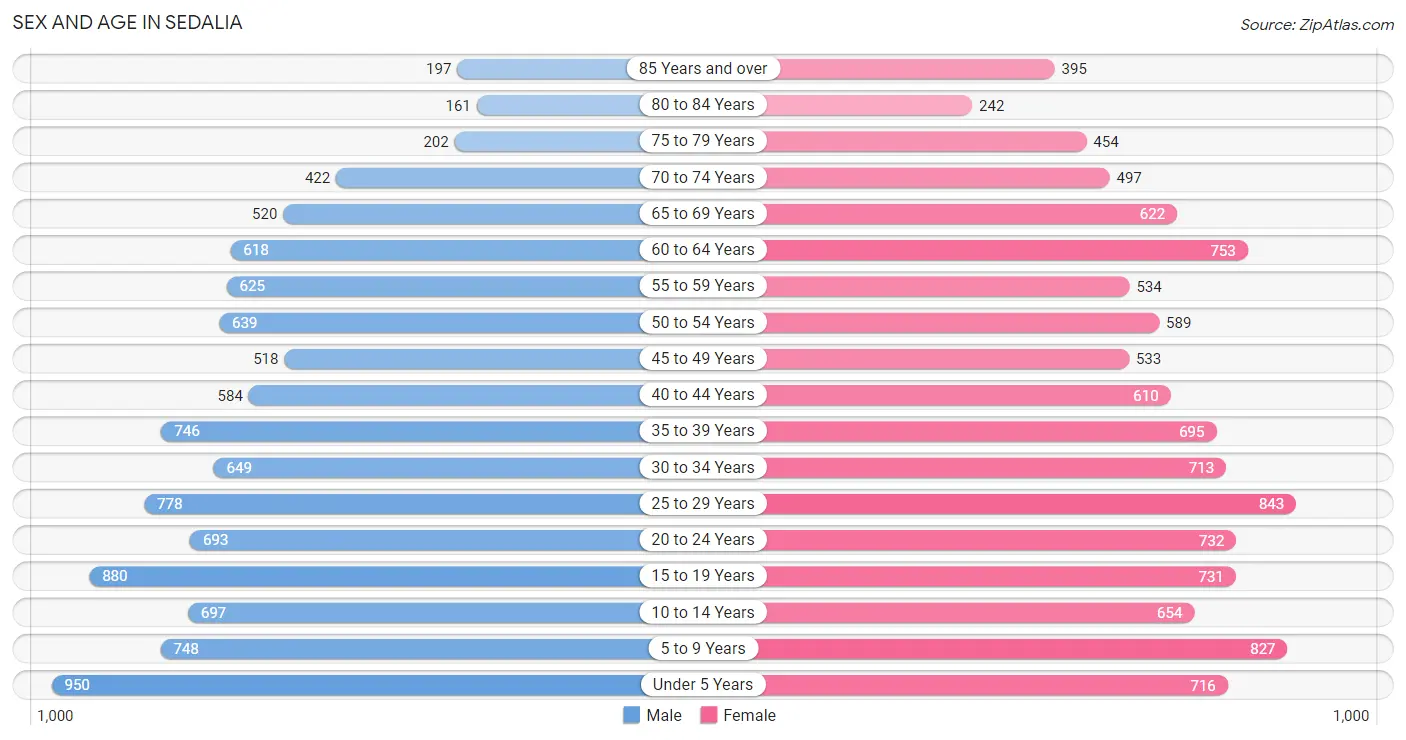
Sex and Age in Sedalia
Sex and Age in Sedalia
The most populous age groups in Sedalia are Under 5 Years (950 | 8.9%) for men and 25 to 29 Years (843 | 7.6%) for women.
| Age Bracket | Male | Female |
| Under 5 Years | 950 (8.9%) | 716 (6.4%) |
| 5 to 9 Years | 748 (7.0%) | 827 (7.4%) |
| 10 to 14 Years | 697 (6.6%) | 654 (5.9%) |
| 15 to 19 Years | 880 (8.3%) | 731 (6.6%) |
| 20 to 24 Years | 693 (6.5%) | 732 (6.6%) |
| 25 to 29 Years | 778 (7.3%) | 843 (7.6%) |
| 30 to 34 Years | 649 (6.1%) | 713 (6.4%) |
| 35 to 39 Years | 746 (7.0%) | 695 (6.2%) |
| 40 to 44 Years | 584 (5.5%) | 610 (5.5%) |
| 45 to 49 Years | 518 (4.9%) | 533 (4.8%) |
| 50 to 54 Years | 639 (6.0%) | 589 (5.3%) |
| 55 to 59 Years | 625 (5.9%) | 534 (4.8%) |
| 60 to 64 Years | 618 (5.8%) | 753 (6.8%) |
| 65 to 69 Years | 520 (4.9%) | 622 (5.6%) |
| 70 to 74 Years | 422 (4.0%) | 497 (4.5%) |
| 75 to 79 Years | 202 (1.9%) | 454 (4.1%) |
| 80 to 84 Years | 161 (1.5%) | 242 (2.2%) |
| 85 Years and over | 197 (1.8%) | 395 (3.5%) |
| Total | 10,627 (100.0%) | 11,140 (100.0%) |
Families and Households in Sedalia
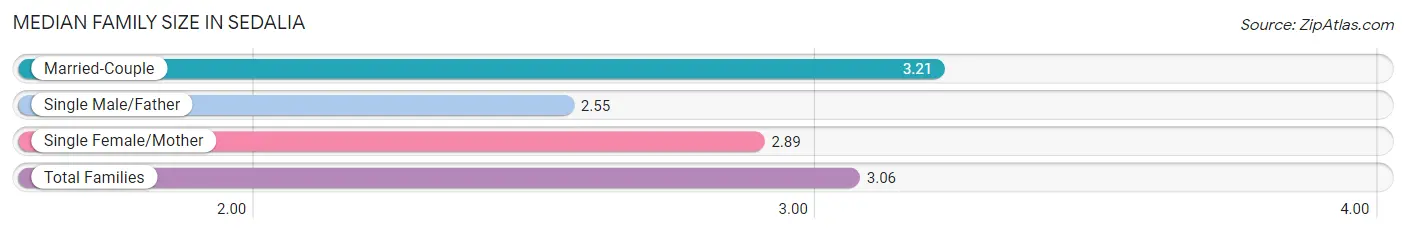
Median Family Size in Sedalia
The median family size in Sedalia is 3.06 persons per family, with married-couple families (3,414 | 64.4%) accounting for the largest median family size of 3.21 persons per family. On the other hand, single male/father families (533 | 10.1%) represent the smallest median family size with 2.55 persons per family.
| Family Type | # Families | Family Size |
| Married-Couple | 3,414 (64.4%) | 3.21 |
| Single Male/Father | 533 (10.1%) | 2.55 |
| Single Female/Mother | 1,352 (25.5%) | 2.89 |
| Total Families | 5,299 (100.0%) | 3.06 |
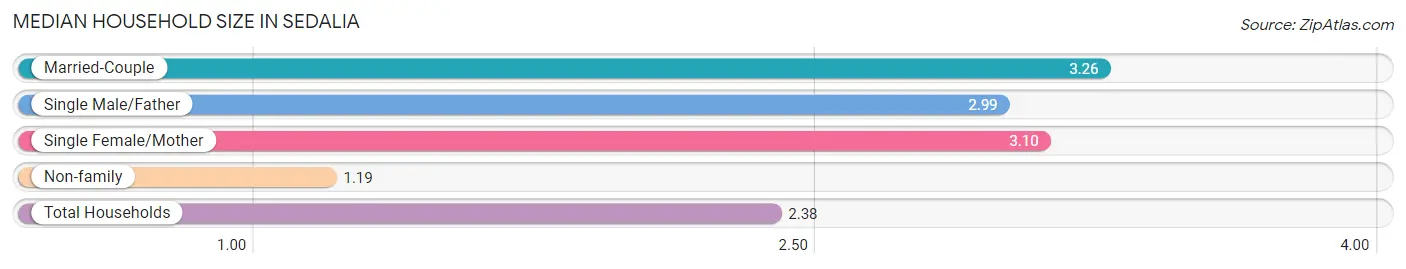
Median Household Size in Sedalia
The median household size in Sedalia is 2.38 persons per household, with married-couple households (3,414 | 38.3%) accounting for the largest median household size of 3.26 persons per household. non-family households (3,616 | 40.6%) represent the smallest median household size with 1.19 persons per household.
| Household Type | # Households | Household Size |
| Married-Couple | 3,414 (38.3%) | 3.26 |
| Single Male/Father | 533 (6.0%) | 2.99 |
| Single Female/Mother | 1,352 (15.2%) | 3.10 |
| Non-family | 3,616 (40.6%) | 1.19 |
| Total Households | 8,915 (100.0%) | 2.38 |
Household Size by Marriage Status in Sedalia
Out of a total of 8,915 households in Sedalia, 5,299 (59.4%) are family households, while 3,616 (40.6%) are nonfamily households. The most numerous type of family households are 2-person households, comprising 2,410, and the most common type of nonfamily households are 1-person households, comprising 3,038.
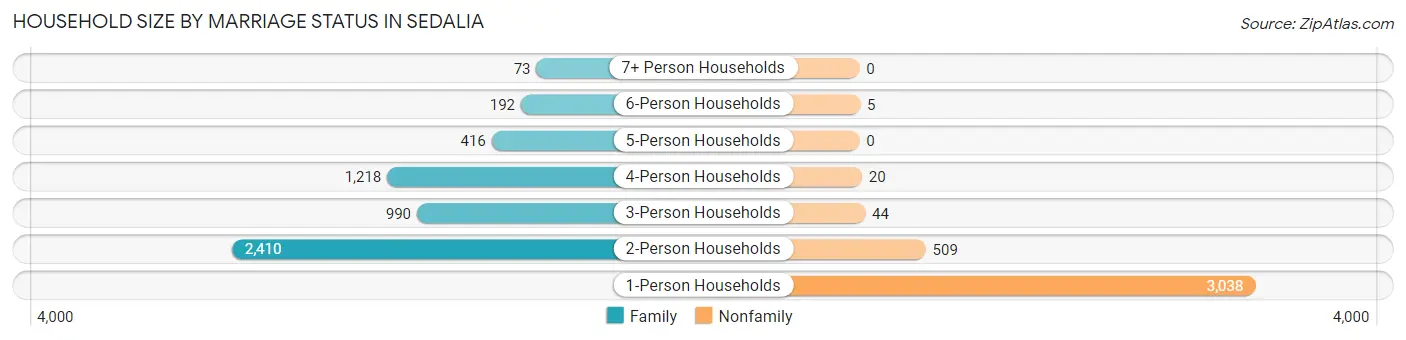
| Household Size | Family Households | Nonfamily Households |
| 1-Person Households | - | 3,038 (34.1%) |
| 2-Person Households | 2,410 (27.0%) | 509 (5.7%) |
| 3-Person Households | 990 (11.1%) | 44 (0.5%) |
| 4-Person Households | 1,218 (13.7%) | 20 (0.2%) |
| 5-Person Households | 416 (4.7%) | 0 (0.0%) |
| 6-Person Households | 192 (2.1%) | 5 (0.1%) |
| 7+ Person Households | 73 (0.8%) | 0 (0.0%) |
| Total | 5,299 (59.4%) | 3,616 (40.6%) |
Female Fertility in Sedalia
Fertility by Age in Sedalia
Average fertility rate in Sedalia is 73.0 births per 1,000 women. Women in the age bracket of 20 to 34 years have the highest fertility rate with 117.0 births per 1,000 women. Women in the age bracket of 20 to 34 years acount for 74.0% of all women with births.
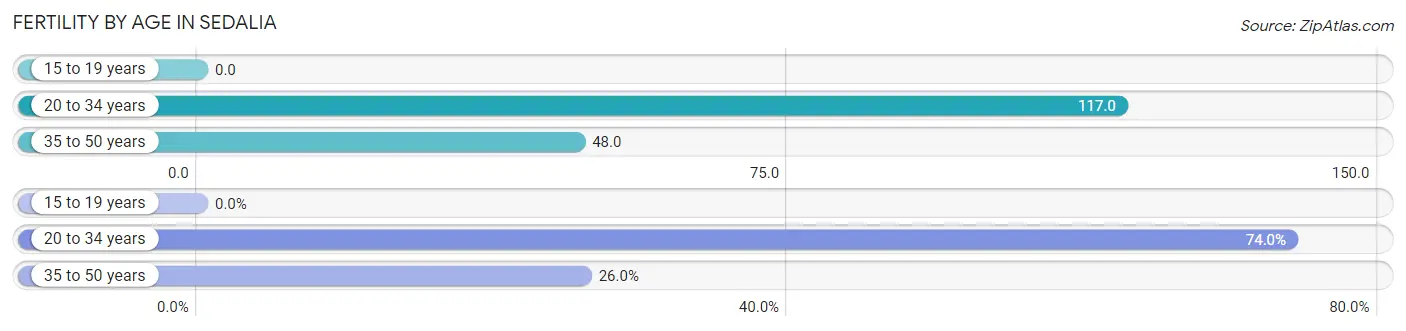
| Age Bracket | Women with Births | Births / 1,000 Women |
| 15 to 19 years | 0 (0.0%) | 0.0 |
| 20 to 34 years | 267 (74.0%) | 117.0 |
| 35 to 50 years | 94 (26.0%) | 48.0 |
| Total | 361 (100.0%) | 73.0 |
Fertility by Age by Marriage Status in Sedalia
69.3% of women with births (361) in Sedalia are married. The highest percentage of unmarried women with births falls into 20 to 34 years age bracket with 41.6% of them unmarried at the time of birth, while the lowest percentage of unmarried women with births belong to 35 to 50 years age bracket with 0.0% of them unmarried.
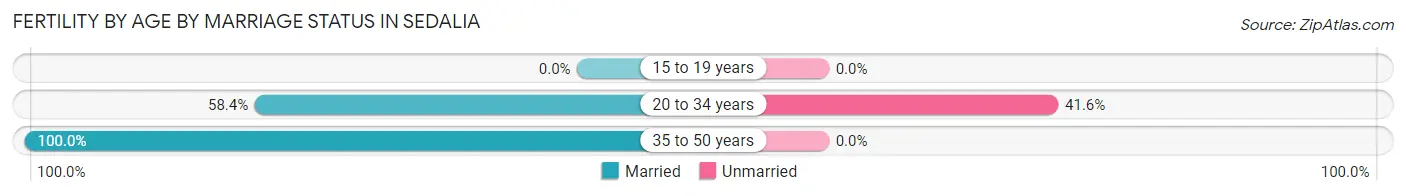
| Age Bracket | Married | Unmarried |
| 15 to 19 years | 0 (0.0%) | 0 (0.0%) |
| 20 to 34 years | 156 (58.4%) | 111 (41.6%) |
| 35 to 50 years | 94 (100.0%) | 0 (0.0%) |
| Total | 250 (69.3%) | 111 (30.7%) |
Fertility by Education in Sedalia
Average fertility rate in Sedalia is 73.0 births per 1,000 women. Women with the education attainment of graduate degree have the highest fertility rate of 306.0 births per 1,000 women, while women with the education attainment of college or associate's degree have the lowest fertility at 37.0 births per 1,000 women. Women with the education attainment of bachelor's degree represent 28.5% of all women with births.
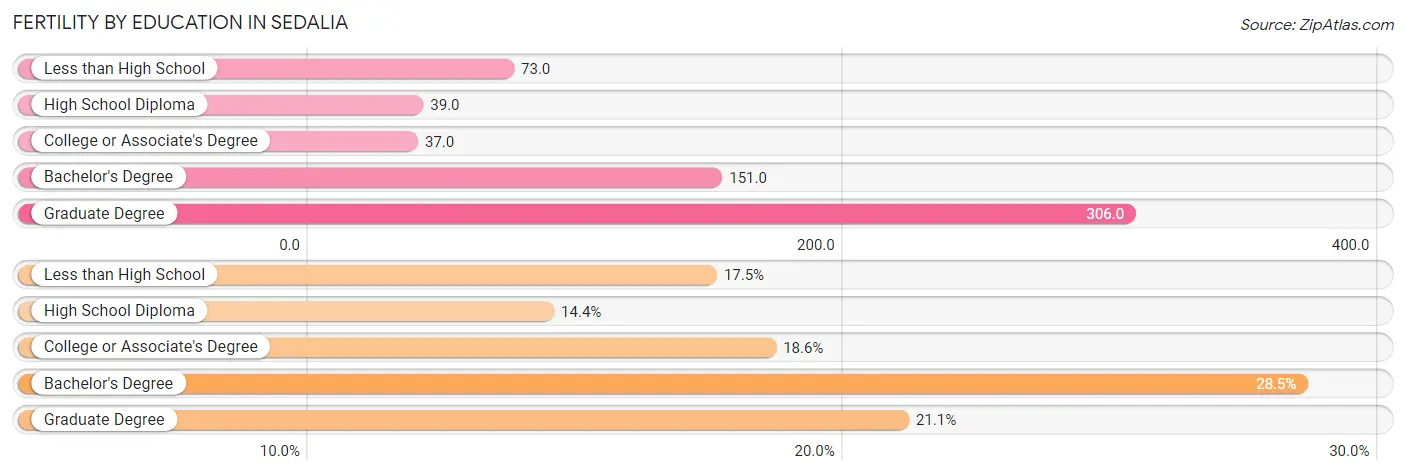
| Educational Attainment | Women with Births | Births / 1,000 Women |
| Less than High School | 63 (17.4%) | 73.0 |
| High School Diploma | 52 (14.4%) | 39.0 |
| College or Associate's Degree | 67 (18.6%) | 37.0 |
| Bachelor's Degree | 103 (28.5%) | 151.0 |
| Graduate Degree | 76 (21.0%) | 306.0 |
| Total | 361 (100.0%) | 73.0 |
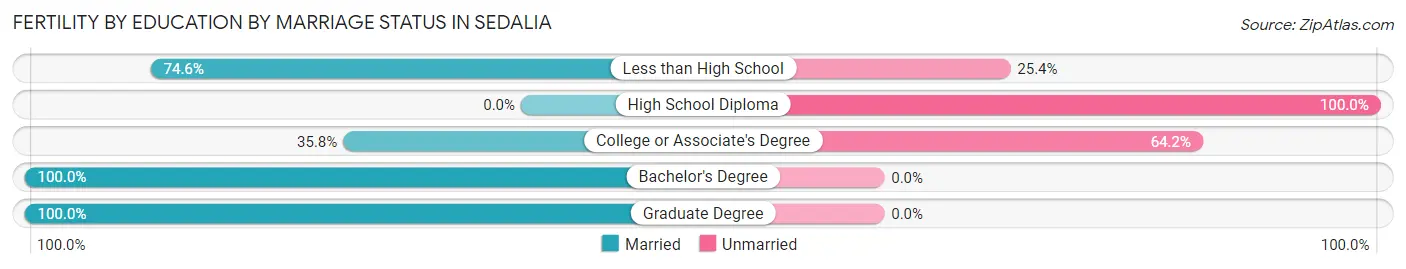
Fertility by Education by Marriage Status in Sedalia
30.7% of women with births in Sedalia are unmarried. Women with the educational attainment of bachelor's degree are most likely to be married with 100.0% of them married at childbirth, while women with the educational attainment of high school diploma are least likely to be married with 100.0% of them unmarried at childbirth.
| Educational Attainment | Married | Unmarried |
| Less than High School | 47 (74.6%) | 16 (25.4%) |
| High School Diploma | 0 (0.0%) | 52 (100.0%) |
| College or Associate's Degree | 24 (35.8%) | 43 (64.2%) |
| Bachelor's Degree | 103 (100.0%) | 0 (0.0%) |
| Graduate Degree | 76 (100.0%) | 0 (0.0%) |
| Total | 250 (69.3%) | 111 (30.7%) |
Employment Characteristics in Sedalia
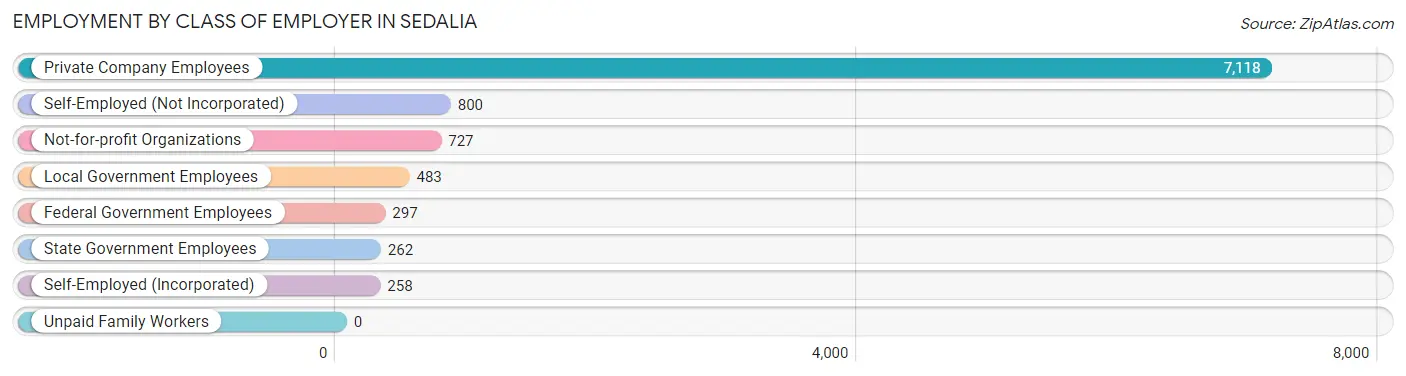
Employment by Class of Employer in Sedalia
Among the 9,945 employed individuals in Sedalia, private company employees (7,118 | 71.6%), self-employed (not incorporated) (800 | 8.0%), and not-for-profit organizations (727 | 7.3%) make up the most common classes of employment.
| Employer Class | # Employees | % Employees |
| Private Company Employees | 7,118 | 71.6% |
| Self-Employed (Incorporated) | 258 | 2.6% |
| Self-Employed (Not Incorporated) | 800 | 8.0% |
| Not-for-profit Organizations | 727 | 7.3% |
| Local Government Employees | 483 | 4.9% |
| State Government Employees | 262 | 2.6% |
| Federal Government Employees | 297 | 3.0% |
| Unpaid Family Workers | 0 | 0.0% |
| Total | 9,945 | 100.0% |
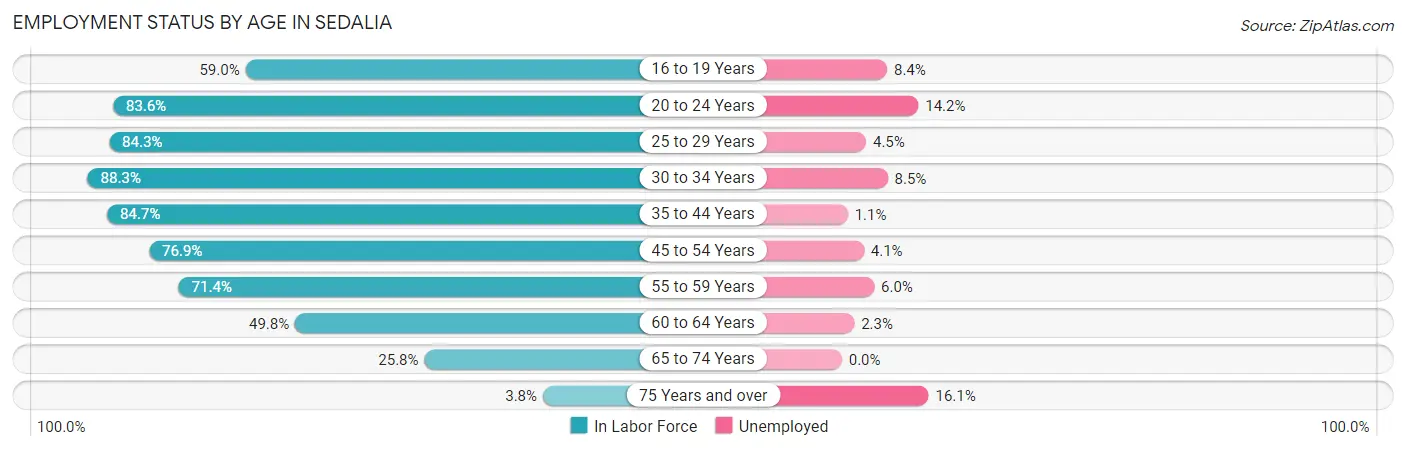
Employment Status by Age in Sedalia
According to the labor force statistics for Sedalia, out of the total population over 16 years of age (16,991), 62.9% or 10,687 individuals are in the labor force, with 5.4% or 577 of them unemployed. The age group with the highest labor force participation rate is 30 to 34 years, with 88.3% or 1,203 individuals in the labor force. Within the labor force, the 75 years and over age range has the highest percentage of unemployed individuals, with 16.1% or 10 of them being unemployed.
| Age Bracket | In Labor Force | Unemployed |
| 16 to 19 Years | 842 (59.0%) | 71 (8.4%) |
| 20 to 24 Years | 1,191 (83.6%) | 169 (14.2%) |
| 25 to 29 Years | 1,367 (84.3%) | 62 (4.5%) |
| 30 to 34 Years | 1,203 (88.3%) | 102 (8.5%) |
| 35 to 44 Years | 2,232 (84.7%) | 25 (1.1%) |
| 45 to 54 Years | 1,753 (76.9%) | 72 (4.1%) |
| 55 to 59 Years | 828 (71.4%) | 50 (6.0%) |
| 60 to 64 Years | 683 (49.8%) | 16 (2.3%) |
| 65 to 74 Years | 532 (25.8%) | 0 (0.0%) |
| 75 Years and over | 63 (3.8%) | 10 (16.1%) |
| Total | 10,687 (62.9%) | 577 (5.4%) |
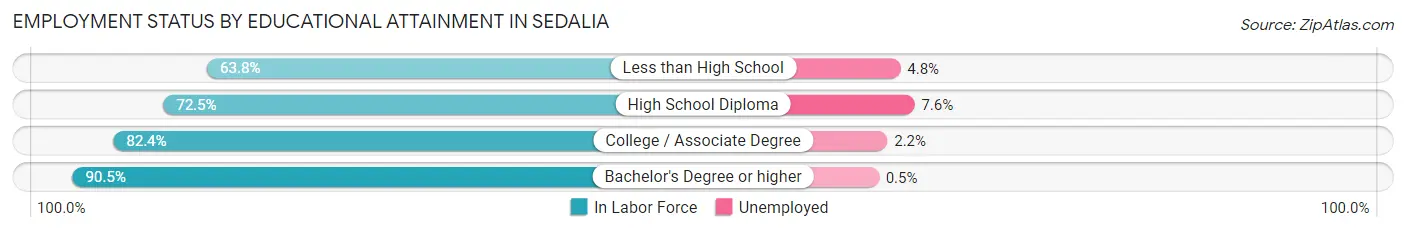
Employment Status by Educational Attainment in Sedalia
According to labor force statistics for Sedalia, 77.4% of individuals (8,070) out of the total population between 25 and 64 years of age (10,427) are in the labor force, with 4.1% or 331 of them being unemployed. The group with the highest labor force participation rate are those with the educational attainment of bachelor's degree or higher, with 90.5% or 1,550 individuals in the labor force. Within the labor force, individuals with high school diploma education have the highest percentage of unemployment, with 7.6% or 204 of them being unemployed.
| Educational Attainment | In Labor Force | Unemployed |
| Less than High School | 1,024 (63.8%) | 77 (4.8%) |
| High School Diploma | 2,679 (72.5%) | 281 (7.6%) |
| College / Associate Degree | 2,813 (82.4%) | 75 (2.2%) |
| Bachelor's Degree or higher | 1,550 (90.5%) | 9 (0.5%) |
| Total | 8,070 (77.4%) | 428 (4.1%) |
Employment Occupations by Sex in Sedalia
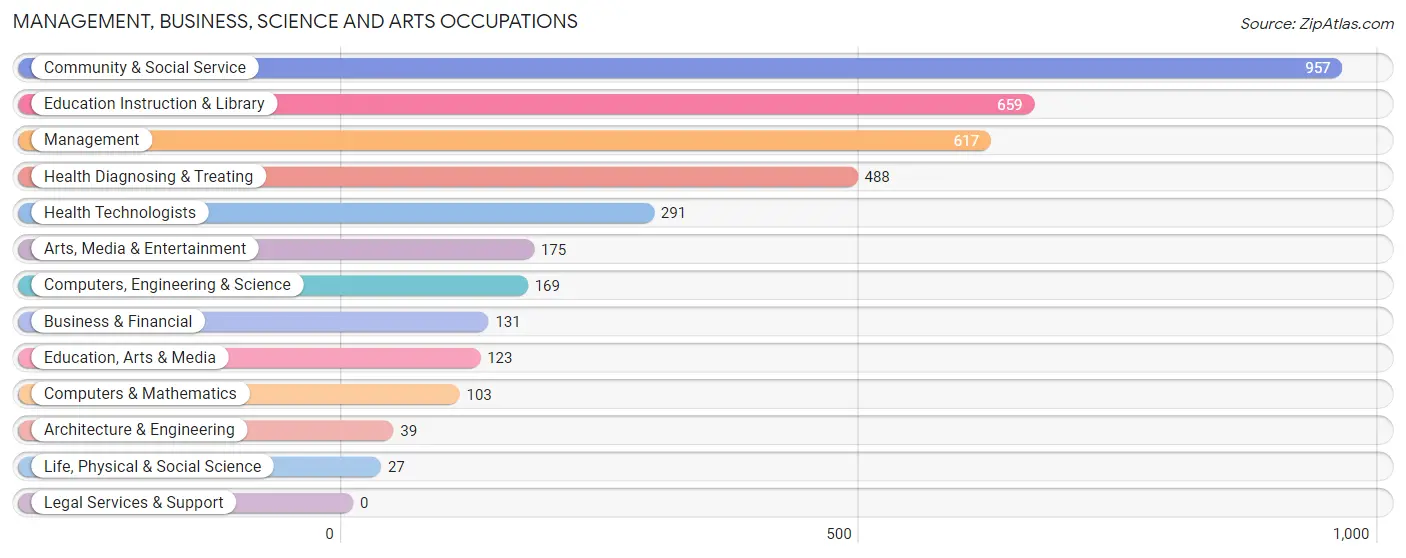
Management, Business, Science and Arts Occupations
The most common Management, Business, Science and Arts occupations in Sedalia are Community & Social Service (957 | 9.6%), Education Instruction & Library (659 | 6.6%), Management (617 | 6.2%), Health Diagnosing & Treating (488 | 4.9%), and Health Technologists (291 | 2.9%).
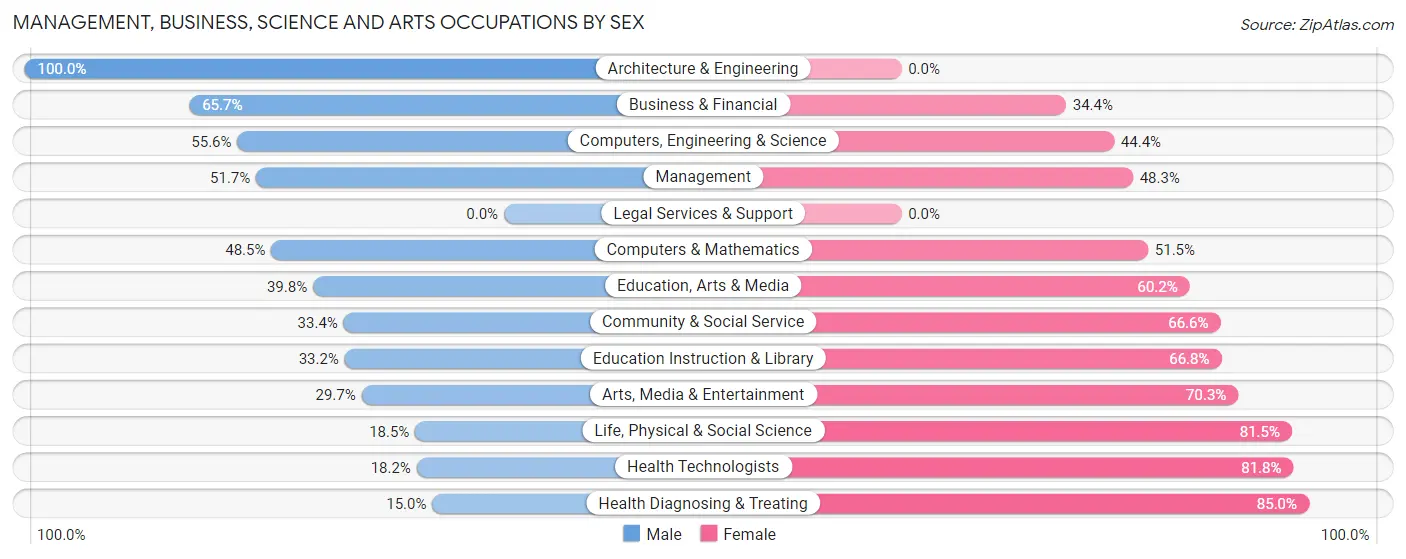
Management, Business, Science and Arts Occupations by Sex
Within the Management, Business, Science and Arts occupations in Sedalia, the most male-oriented occupations are Architecture & Engineering (100.0%), Business & Financial (65.6%), and Computers, Engineering & Science (55.6%), while the most female-oriented occupations are Health Diagnosing & Treating (85.0%), Health Technologists (81.8%), and Life, Physical & Social Science (81.5%).
| Occupation | Male | Female |
| Management | 319 (51.7%) | 298 (48.3%) |
| Business & Financial | 86 (65.6%) | 45 (34.4%) |
| Computers, Engineering & Science | 94 (55.6%) | 75 (44.4%) |
| Computers & Mathematics | 50 (48.5%) | 53 (51.5%) |
| Architecture & Engineering | 39 (100.0%) | 0 (0.0%) |
| Life, Physical & Social Science | 5 (18.5%) | 22 (81.5%) |
| Community & Social Service | 320 (33.4%) | 637 (66.6%) |
| Education, Arts & Media | 49 (39.8%) | 74 (60.2%) |
| Legal Services & Support | 0 (0.0%) | 0 (0.0%) |
| Education Instruction & Library | 219 (33.2%) | 440 (66.8%) |
| Arts, Media & Entertainment | 52 (29.7%) | 123 (70.3%) |
| Health Diagnosing & Treating | 73 (15.0%) | 415 (85.0%) |
| Health Technologists | 53 (18.2%) | 238 (81.8%) |
| Total (Category) | 892 (37.8%) | 1,470 (62.2%) |
| Total (Overall) | 5,279 (52.7%) | 4,740 (47.3%) |
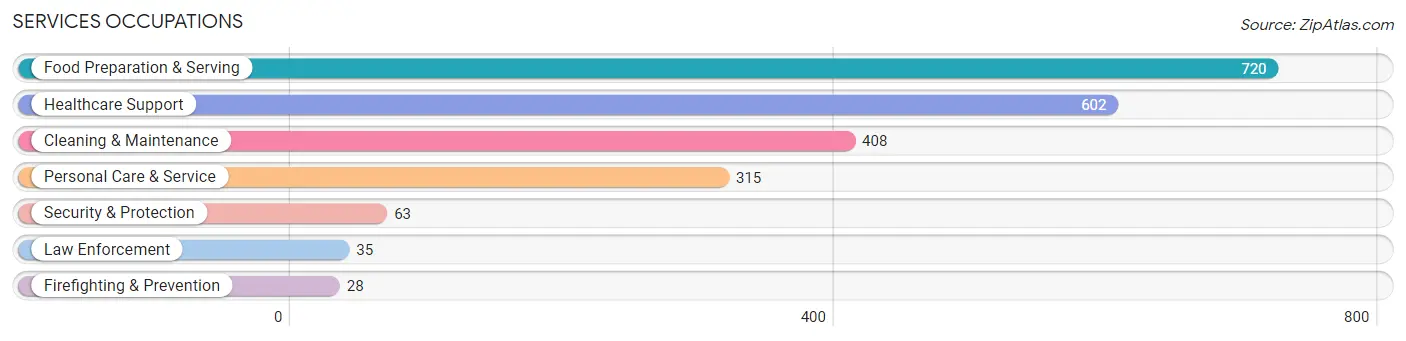
Services Occupations
The most common Services occupations in Sedalia are Food Preparation & Serving (720 | 7.2%), Healthcare Support (602 | 6.0%), Cleaning & Maintenance (408 | 4.1%), Personal Care & Service (315 | 3.1%), and Security & Protection (63 | 0.6%).
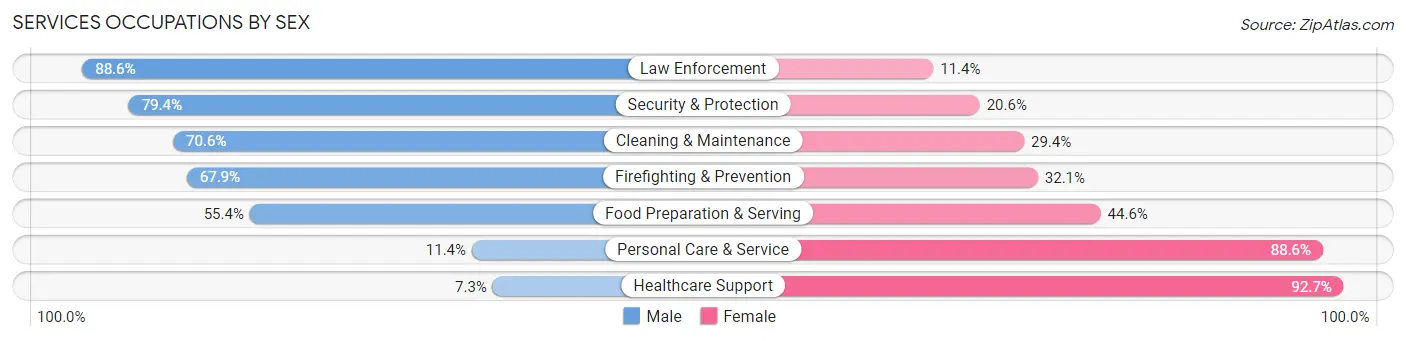
Services Occupations by Sex
Within the Services occupations in Sedalia, the most male-oriented occupations are Law Enforcement (88.6%), Security & Protection (79.4%), and Cleaning & Maintenance (70.6%), while the most female-oriented occupations are Healthcare Support (92.7%), Personal Care & Service (88.6%), and Food Preparation & Serving (44.6%).
| Occupation | Male | Female |
| Healthcare Support | 44 (7.3%) | 558 (92.7%) |
| Security & Protection | 50 (79.4%) | 13 (20.6%) |
| Firefighting & Prevention | 19 (67.9%) | 9 (32.1%) |
| Law Enforcement | 31 (88.6%) | 4 (11.4%) |
| Food Preparation & Serving | 399 (55.4%) | 321 (44.6%) |
| Cleaning & Maintenance | 288 (70.6%) | 120 (29.4%) |
| Personal Care & Service | 36 (11.4%) | 279 (88.6%) |
| Total (Category) | 817 (38.8%) | 1,291 (61.2%) |
| Total (Overall) | 5,279 (52.7%) | 4,740 (47.3%) |
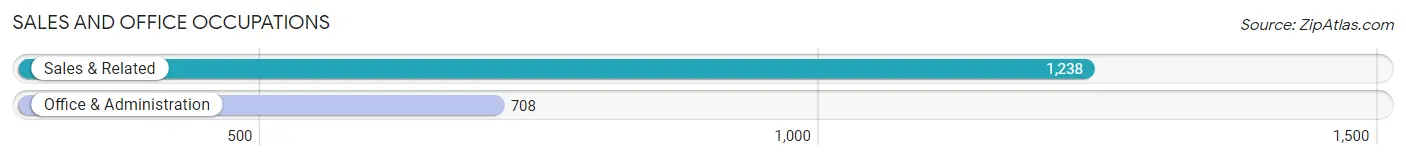
Sales and Office Occupations
The most common Sales and Office occupations in Sedalia are Sales & Related (1,238 | 12.4%), and Office & Administration (708 | 7.1%).
Sales and Office Occupations by Sex
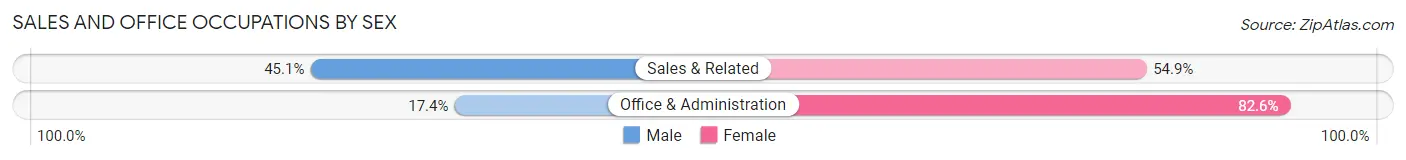
| Occupation | Male | Female |
| Sales & Related | 558 (45.1%) | 680 (54.9%) |
| Office & Administration | 123 (17.4%) | 585 (82.6%) |
| Total (Category) | 681 (35.0%) | 1,265 (65.0%) |
| Total (Overall) | 5,279 (52.7%) | 4,740 (47.3%) |
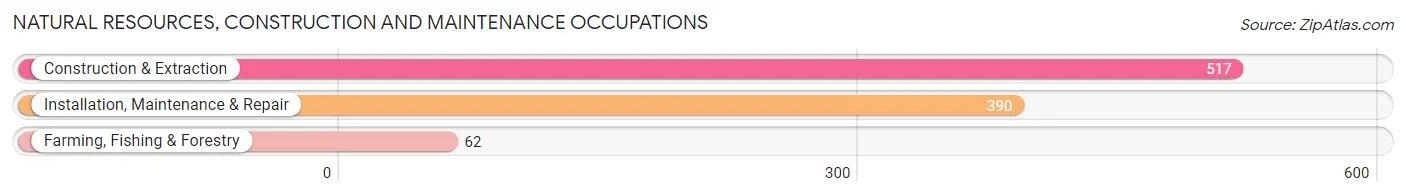
Natural Resources, Construction and Maintenance Occupations
The most common Natural Resources, Construction and Maintenance occupations in Sedalia are Construction & Extraction (517 | 5.2%), Installation, Maintenance & Repair (390 | 3.9%), and Farming, Fishing & Forestry (62 | 0.6%).
Natural Resources, Construction and Maintenance Occupations by Sex
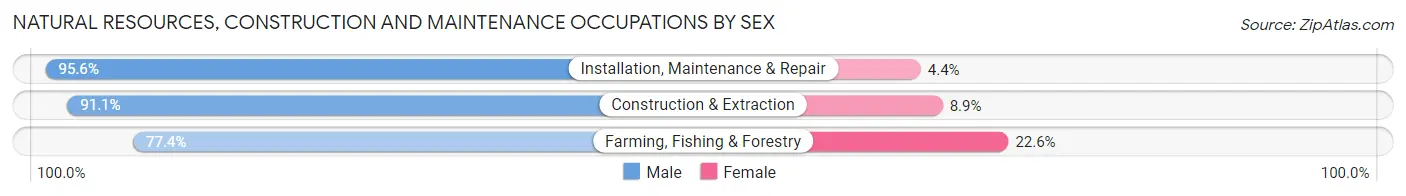
| Occupation | Male | Female |
| Farming, Fishing & Forestry | 48 (77.4%) | 14 (22.6%) |
| Construction & Extraction | 471 (91.1%) | 46 (8.9%) |
| Installation, Maintenance & Repair | 373 (95.6%) | 17 (4.4%) |
| Total (Category) | 892 (92.0%) | 77 (8.0%) |
| Total (Overall) | 5,279 (52.7%) | 4,740 (47.3%) |
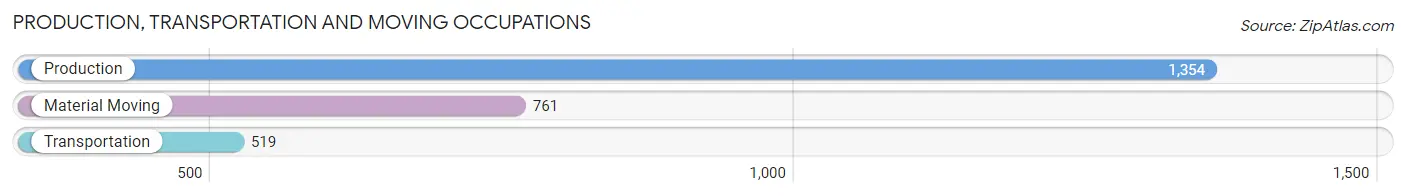
Production, Transportation and Moving Occupations
The most common Production, Transportation and Moving occupations in Sedalia are Production (1,354 | 13.5%), Material Moving (761 | 7.6%), and Transportation (519 | 5.2%).
Production, Transportation and Moving Occupations by Sex
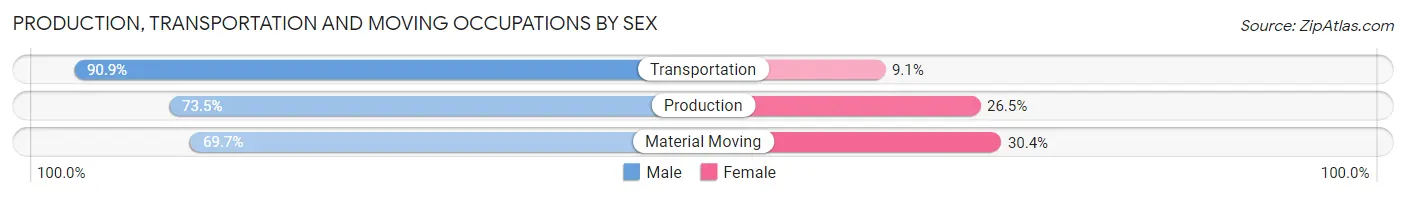
| Occupation | Male | Female |
| Production | 995 (73.5%) | 359 (26.5%) |
| Transportation | 472 (90.9%) | 47 (9.1%) |
| Material Moving | 530 (69.7%) | 231 (30.3%) |
| Total (Category) | 1,997 (75.8%) | 637 (24.2%) |
| Total (Overall) | 5,279 (52.7%) | 4,740 (47.3%) |
Employment Industries by Sex in Sedalia
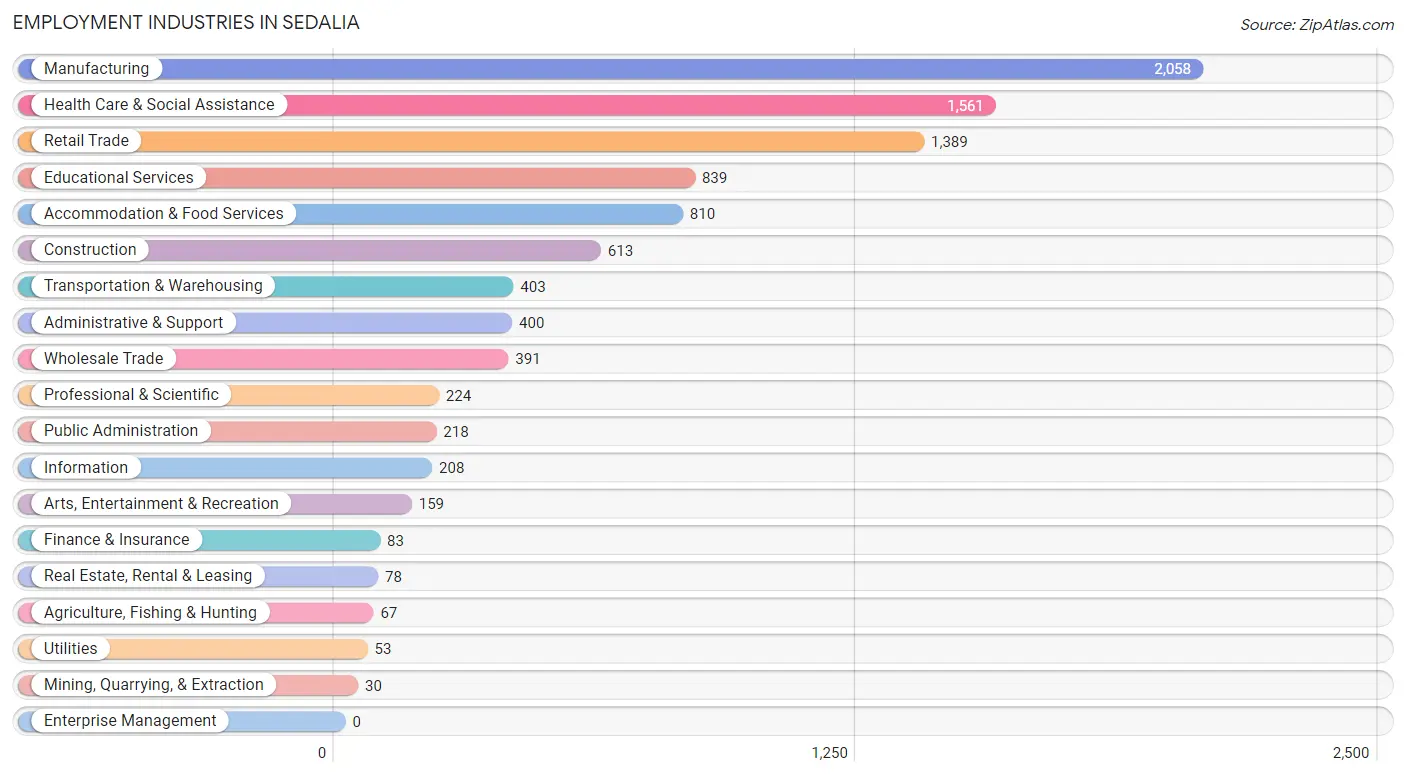
Employment Industries in Sedalia
The major employment industries in Sedalia include Manufacturing (2,058 | 20.5%), Health Care & Social Assistance (1,561 | 15.6%), Retail Trade (1,389 | 13.9%), Educational Services (839 | 8.4%), and Accommodation & Food Services (810 | 8.1%).
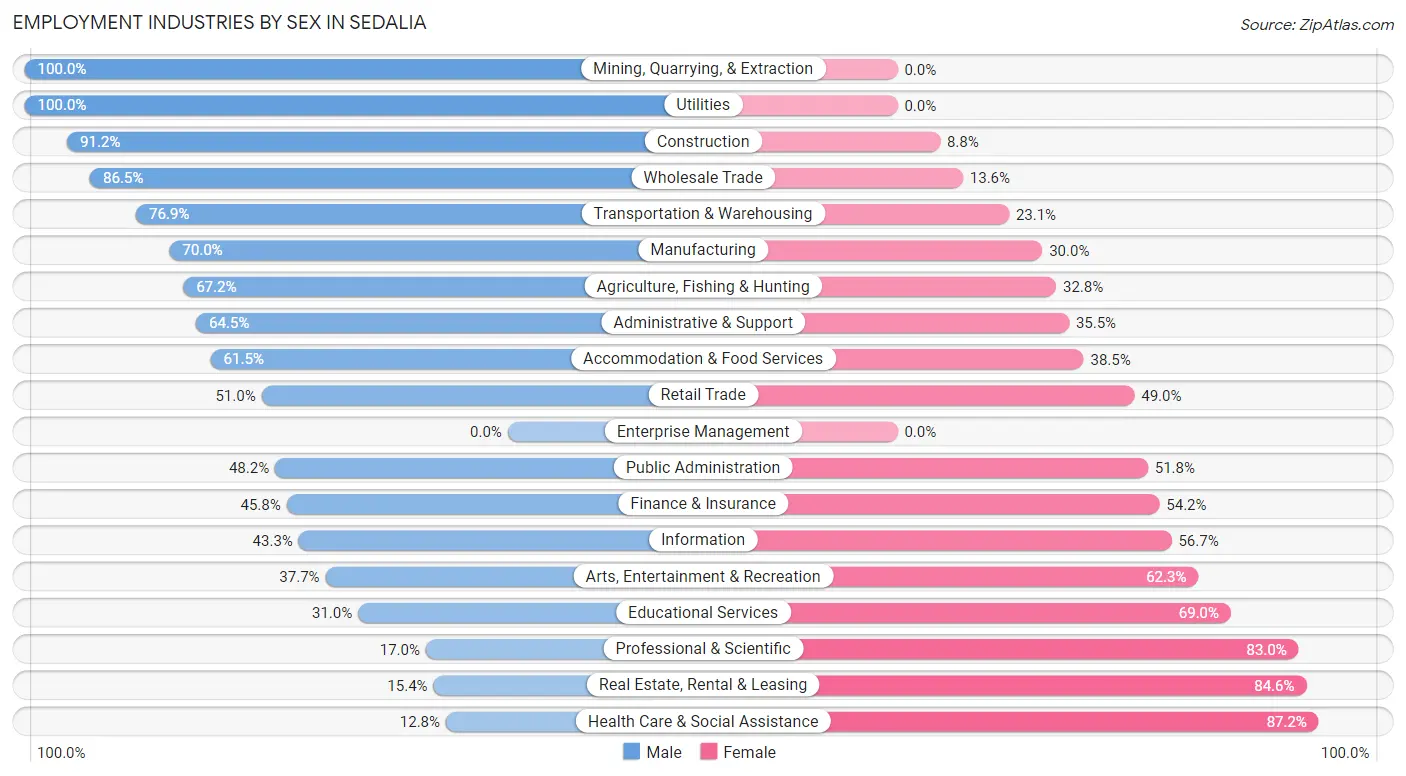
Employment Industries by Sex in Sedalia
The Sedalia industries that see more men than women are Mining, Quarrying, & Extraction (100.0%), Utilities (100.0%), and Construction (91.2%), whereas the industries that tend to have a higher number of women are Health Care & Social Assistance (87.2%), Real Estate, Rental & Leasing (84.6%), and Professional & Scientific (83.0%).
| Industry | Male | Female |
| Agriculture, Fishing & Hunting | 45 (67.2%) | 22 (32.8%) |
| Mining, Quarrying, & Extraction | 30 (100.0%) | 0 (0.0%) |
| Construction | 559 (91.2%) | 54 (8.8%) |
| Manufacturing | 1,441 (70.0%) | 617 (30.0%) |
| Wholesale Trade | 338 (86.5%) | 53 (13.6%) |
| Retail Trade | 708 (51.0%) | 681 (49.0%) |
| Transportation & Warehousing | 310 (76.9%) | 93 (23.1%) |
| Utilities | 53 (100.0%) | 0 (0.0%) |
| Information | 90 (43.3%) | 118 (56.7%) |
| Finance & Insurance | 38 (45.8%) | 45 (54.2%) |
| Real Estate, Rental & Leasing | 12 (15.4%) | 66 (84.6%) |
| Professional & Scientific | 38 (17.0%) | 186 (83.0%) |
| Enterprise Management | 0 (0.0%) | 0 (0.0%) |
| Administrative & Support | 258 (64.5%) | 142 (35.5%) |
| Educational Services | 260 (31.0%) | 579 (69.0%) |
| Health Care & Social Assistance | 200 (12.8%) | 1,361 (87.2%) |
| Arts, Entertainment & Recreation | 60 (37.7%) | 99 (62.3%) |
| Accommodation & Food Services | 498 (61.5%) | 312 (38.5%) |
| Public Administration | 105 (48.2%) | 113 (51.8%) |
| Total | 5,279 (52.7%) | 4,740 (47.3%) |
Education in Sedalia
School Enrollment in Sedalia
The most common levels of schooling among the 5,134 students in Sedalia are elementary school (1,147 | 22.3%), middle school (1,120 | 21.8%), and high school (1,100 | 21.4%).
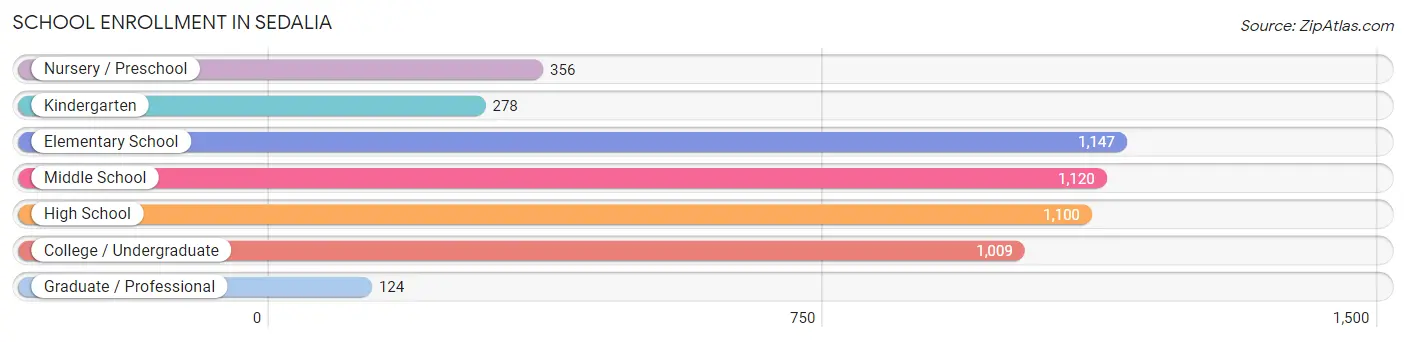
| School Level | # Students | % Students |
| Nursery / Preschool | 356 | 6.9% |
| Kindergarten | 278 | 5.4% |
| Elementary School | 1,147 | 22.3% |
| Middle School | 1,120 | 21.8% |
| High School | 1,100 | 21.4% |
| College / Undergraduate | 1,009 | 19.7% |
| Graduate / Professional | 124 | 2.4% |
| Total | 5,134 | 100.0% |
School Enrollment by Age by Funding Source in Sedalia
Out of a total of 5,134 students who are enrolled in schools in Sedalia, 796 (15.5%) attend a private institution, while the remaining 4,338 (84.5%) are enrolled in public schools. The age group of 3 to 4 year olds has the highest likelihood of being enrolled in private schools, with 71 (26.6% in the age bracket) enrolled. Conversely, the age group of 18 to 19 year olds has the lowest likelihood of being enrolled in a private school, with 620 (93.7% in the age bracket) attending a public institution.
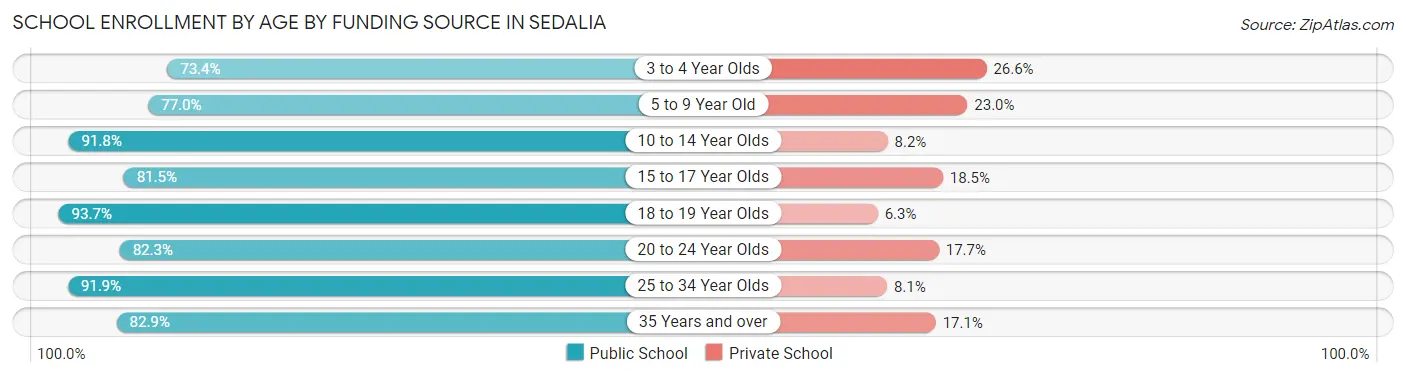
| Age Bracket | Public School | Private School |
| 3 to 4 Year Olds | 196 (73.4%) | 71 (26.6%) |
| 5 to 9 Year Old | 1,059 (77.0%) | 317 (23.0%) |
| 10 to 14 Year Olds | 1,190 (91.8%) | 106 (8.2%) |
| 15 to 17 Year Olds | 662 (81.5%) | 150 (18.5%) |
| 18 to 19 Year Olds | 620 (93.7%) | 42 (6.3%) |
| 20 to 24 Year Olds | 325 (82.3%) | 70 (17.7%) |
| 25 to 34 Year Olds | 171 (91.9%) | 15 (8.1%) |
| 35 Years and over | 116 (82.9%) | 24 (17.1%) |
| Total | 4,338 (84.5%) | 796 (15.5%) |
Educational Attainment by Field of Study in Sedalia
Education (671 | 25.9%), business (418 | 16.1%), science & technology (320 | 12.4%), arts & humanities (227 | 8.8%), and communications (157 | 6.1%) are the most common fields of study among 2,590 individuals in Sedalia who have obtained a bachelor's degree or higher.
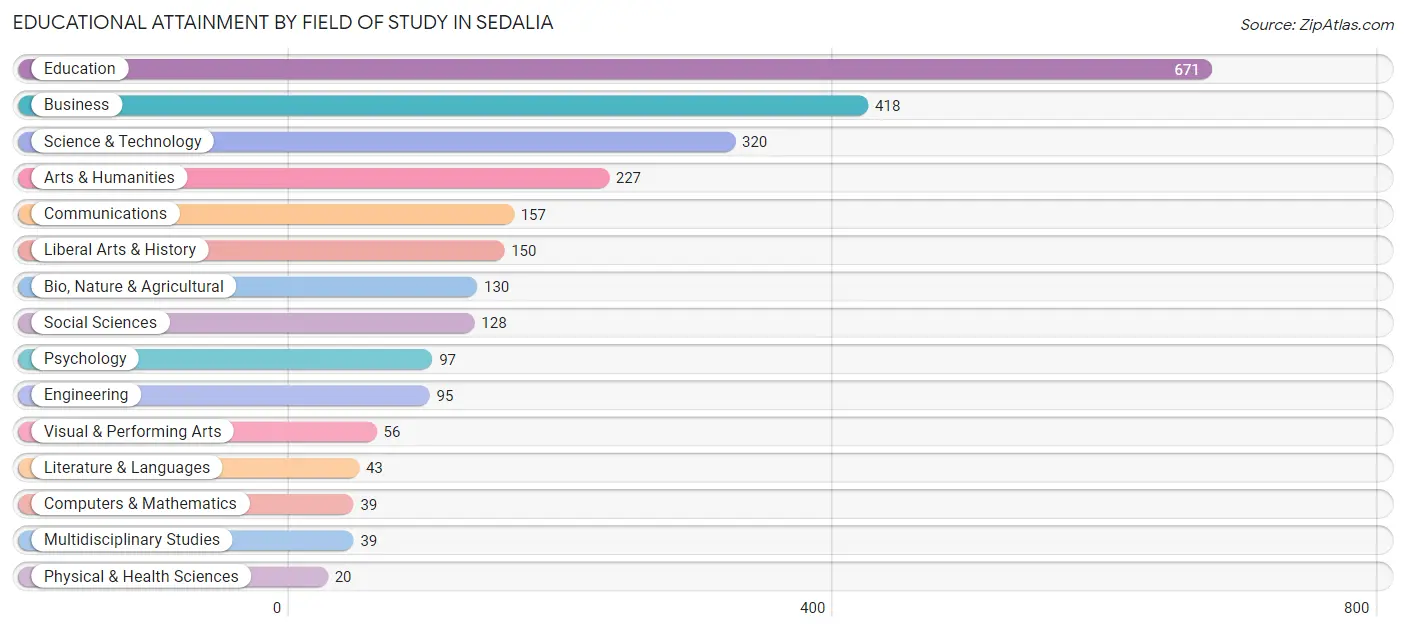
| Field of Study | # Graduates | % Graduates |
| Computers & Mathematics | 39 | 1.5% |
| Bio, Nature & Agricultural | 130 | 5.0% |
| Physical & Health Sciences | 20 | 0.8% |
| Psychology | 97 | 3.7% |
| Social Sciences | 128 | 4.9% |
| Engineering | 95 | 3.7% |
| Multidisciplinary Studies | 39 | 1.5% |
| Science & Technology | 320 | 12.4% |
| Business | 418 | 16.1% |
| Education | 671 | 25.9% |
| Literature & Languages | 43 | 1.7% |
| Liberal Arts & History | 150 | 5.8% |
| Visual & Performing Arts | 56 | 2.2% |
| Communications | 157 | 6.1% |
| Arts & Humanities | 227 | 8.8% |
| Total | 2,590 | 100.0% |
Transportation & Commute in Sedalia
Vehicle Availability by Sex in Sedalia
The most prevalent vehicle ownership categories in Sedalia are males with 2 vehicles (2,104, accounting for 40.2%) and females with 2 vehicles (2,023, making up 45.0%).
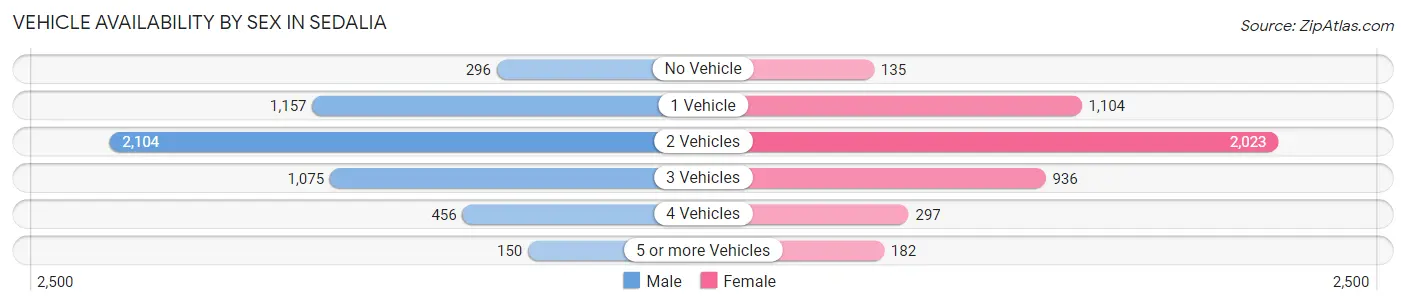
| Vehicles Available | Male | Female |
| No Vehicle | 296 (5.7%) | 135 (2.9%) |
| 1 Vehicle | 1,157 (22.1%) | 1,104 (23.6%) |
| 2 Vehicles | 2,104 (40.2%) | 2,023 (43.2%) |
| 3 Vehicles | 1,075 (20.5%) | 936 (20.0%) |
| 4 Vehicles | 456 (8.7%) | 297 (6.4%) |
| 5 or more Vehicles | 150 (2.9%) | 182 (3.9%) |
| Total | 5,238 (100.0%) | 4,677 (100.0%) |
Commute Time in Sedalia
The most frequently occuring commute durations in Sedalia are 5 to 9 minutes (2,525 commuters, 26.5%), 10 to 14 minutes (2,312 commuters, 24.2%), and 15 to 19 minutes (1,785 commuters, 18.7%).
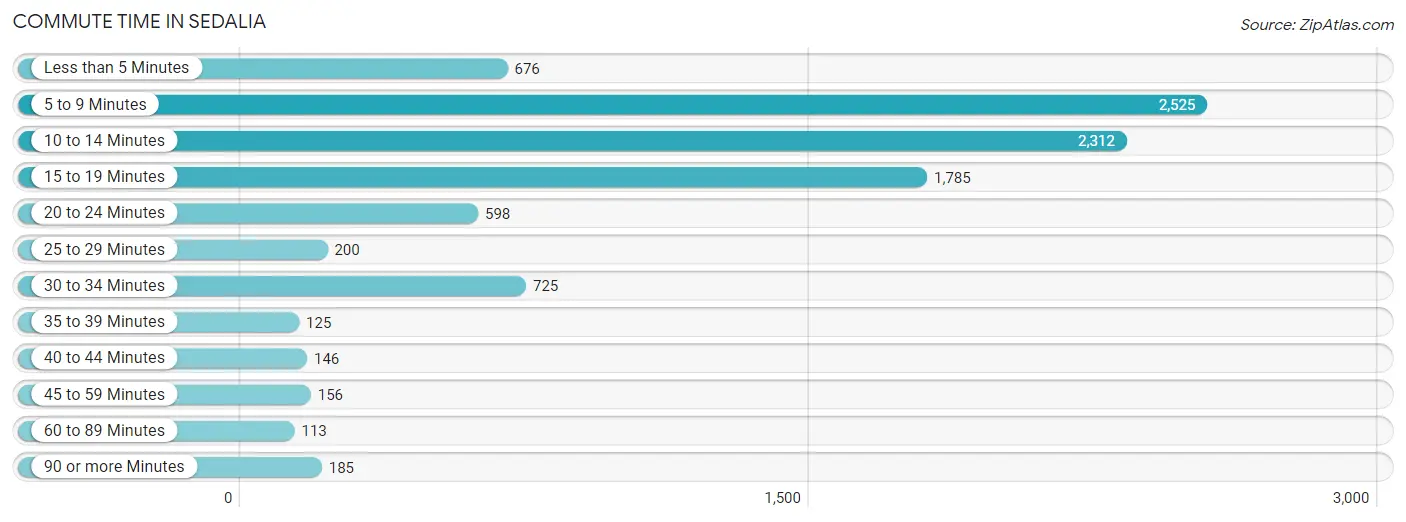
| Commute Time | # Commuters | % Commuters |
| Less than 5 Minutes | 676 | 7.1% |
| 5 to 9 Minutes | 2,525 | 26.5% |
| 10 to 14 Minutes | 2,312 | 24.2% |
| 15 to 19 Minutes | 1,785 | 18.7% |
| 20 to 24 Minutes | 598 | 6.3% |
| 25 to 29 Minutes | 200 | 2.1% |
| 30 to 34 Minutes | 725 | 7.6% |
| 35 to 39 Minutes | 125 | 1.3% |
| 40 to 44 Minutes | 146 | 1.5% |
| 45 to 59 Minutes | 156 | 1.6% |
| 60 to 89 Minutes | 113 | 1.2% |
| 90 or more Minutes | 185 | 1.9% |
Commute Time by Sex in Sedalia
The most common commute times in Sedalia are 5 to 9 minutes (1,361 commuters, 26.2%) for males and 5 to 9 minutes (1,164 commuters, 26.7%) for females.
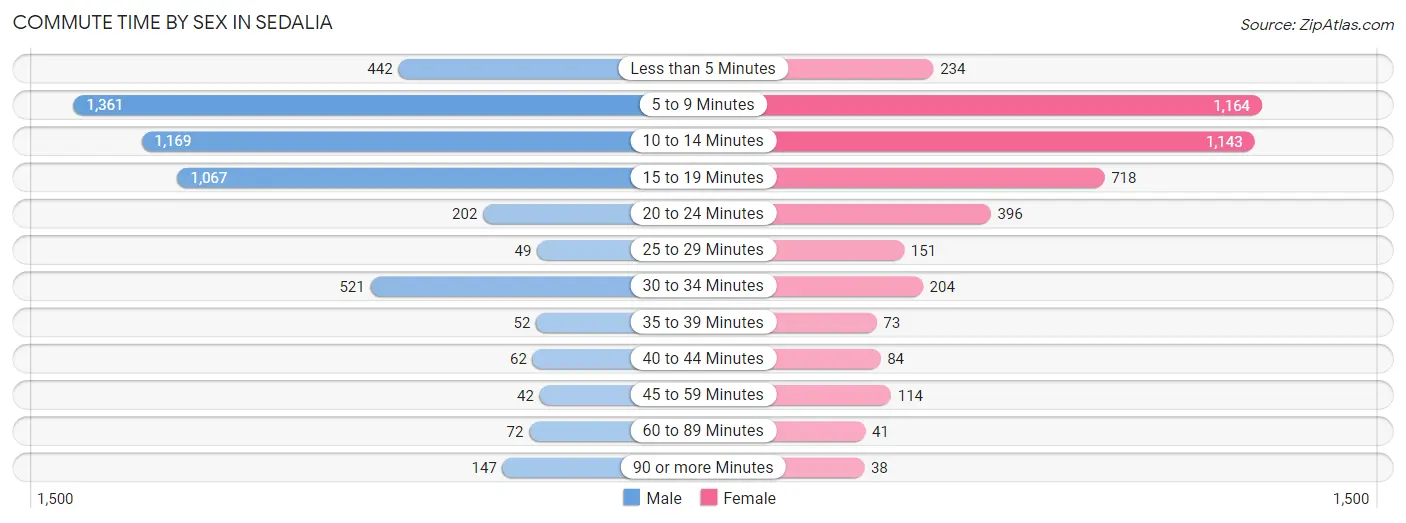
| Commute Time | Male | Female |
| Less than 5 Minutes | 442 (8.5%) | 234 (5.4%) |
| 5 to 9 Minutes | 1,361 (26.2%) | 1,164 (26.7%) |
| 10 to 14 Minutes | 1,169 (22.5%) | 1,143 (26.2%) |
| 15 to 19 Minutes | 1,067 (20.6%) | 718 (16.5%) |
| 20 to 24 Minutes | 202 (3.9%) | 396 (9.1%) |
| 25 to 29 Minutes | 49 (0.9%) | 151 (3.5%) |
| 30 to 34 Minutes | 521 (10.1%) | 204 (4.7%) |
| 35 to 39 Minutes | 52 (1.0%) | 73 (1.7%) |
| 40 to 44 Minutes | 62 (1.2%) | 84 (1.9%) |
| 45 to 59 Minutes | 42 (0.8%) | 114 (2.6%) |
| 60 to 89 Minutes | 72 (1.4%) | 41 (0.9%) |
| 90 or more Minutes | 147 (2.8%) | 38 (0.9%) |
Time of Departure to Work by Sex in Sedalia
The most frequent times of departure to work in Sedalia are 4:00 PM to 11:59 PM (727, 14.0%) for males and 7:00 AM to 7:29 AM (607, 13.9%) for females.
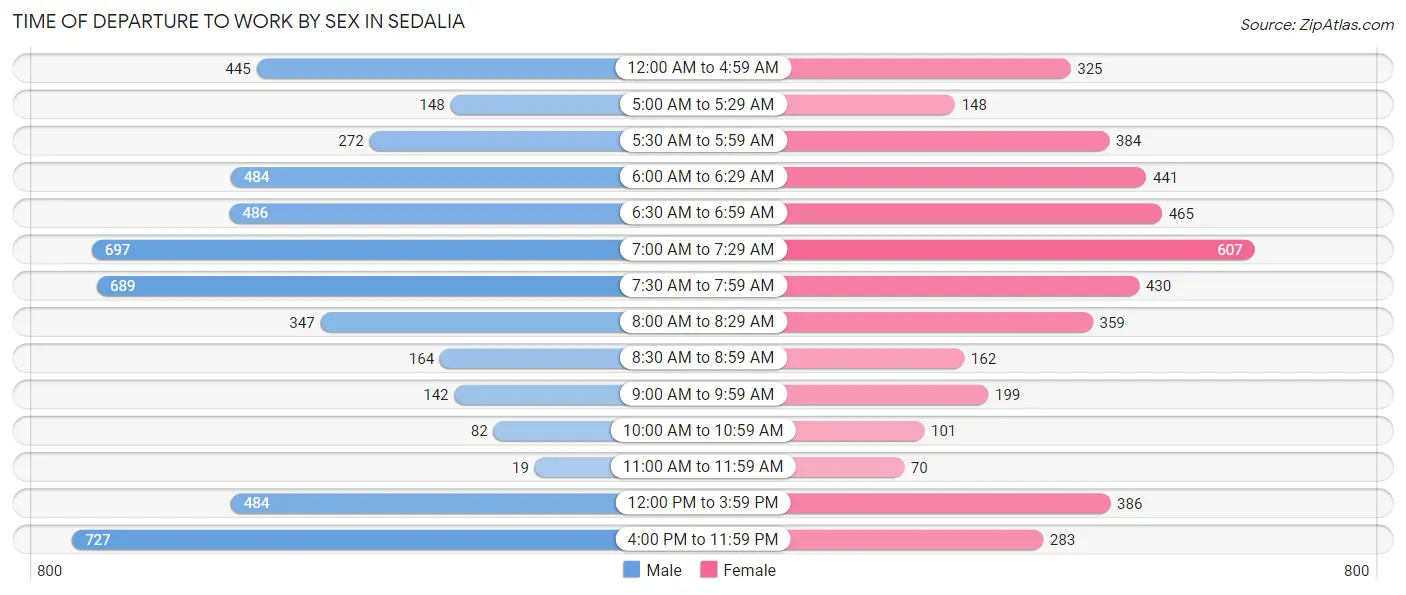
| Time of Departure | Male | Female |
| 12:00 AM to 4:59 AM | 445 (8.6%) | 325 (7.4%) |
| 5:00 AM to 5:29 AM | 148 (2.9%) | 148 (3.4%) |
| 5:30 AM to 5:59 AM | 272 (5.2%) | 384 (8.8%) |
| 6:00 AM to 6:29 AM | 484 (9.3%) | 441 (10.1%) |
| 6:30 AM to 6:59 AM | 486 (9.4%) | 465 (10.7%) |
| 7:00 AM to 7:29 AM | 697 (13.4%) | 607 (13.9%) |
| 7:30 AM to 7:59 AM | 689 (13.3%) | 430 (9.9%) |
| 8:00 AM to 8:29 AM | 347 (6.7%) | 359 (8.2%) |
| 8:30 AM to 8:59 AM | 164 (3.2%) | 162 (3.7%) |
| 9:00 AM to 9:59 AM | 142 (2.7%) | 199 (4.6%) |
| 10:00 AM to 10:59 AM | 82 (1.6%) | 101 (2.3%) |
| 11:00 AM to 11:59 AM | 19 (0.4%) | 70 (1.6%) |
| 12:00 PM to 3:59 PM | 484 (9.3%) | 386 (8.8%) |
| 4:00 PM to 11:59 PM | 727 (14.0%) | 283 (6.5%) |
| Total | 5,186 (100.0%) | 4,360 (100.0%) |
Housing Occupancy in Sedalia
Occupancy by Ownership in Sedalia
Of the total 8,915 dwellings in Sedalia, owner-occupied units account for 5,130 (57.5%), while renter-occupied units make up 3,785 (42.5%).
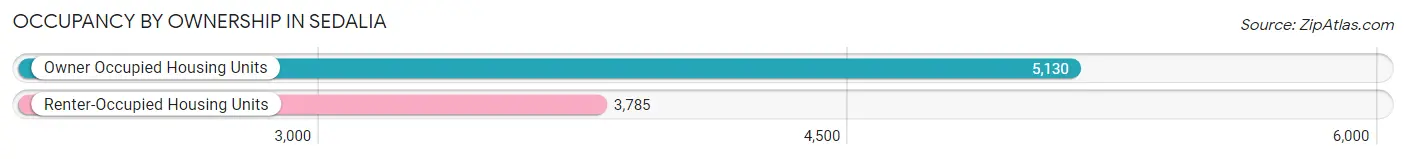
| Occupancy | # Housing Units | % Housing Units |
| Owner Occupied Housing Units | 5,130 | 57.5% |
| Renter-Occupied Housing Units | 3,785 | 42.5% |
| Total Occupied Housing Units | 8,915 | 100.0% |
Occupancy by Household Size in Sedalia
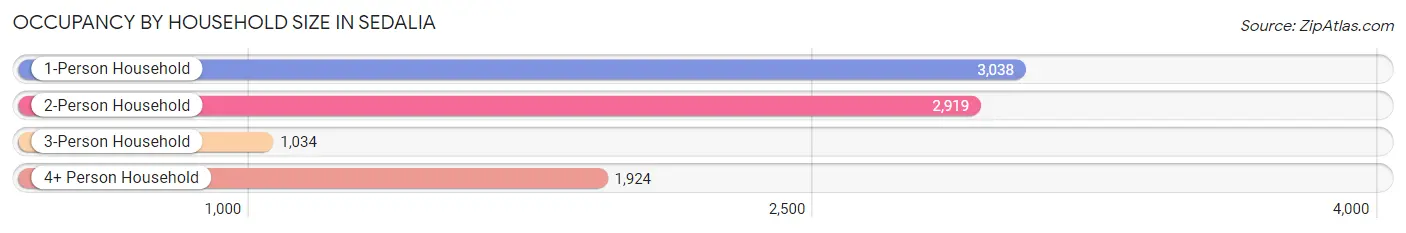
| Household Size | # Housing Units | % Housing Units |
| 1-Person Household | 3,038 | 34.1% |
| 2-Person Household | 2,919 | 32.7% |
| 3-Person Household | 1,034 | 11.6% |
| 4+ Person Household | 1,924 | 21.6% |
| Total Housing Units | 8,915 | 100.0% |
Occupancy by Ownership by Household Size in Sedalia
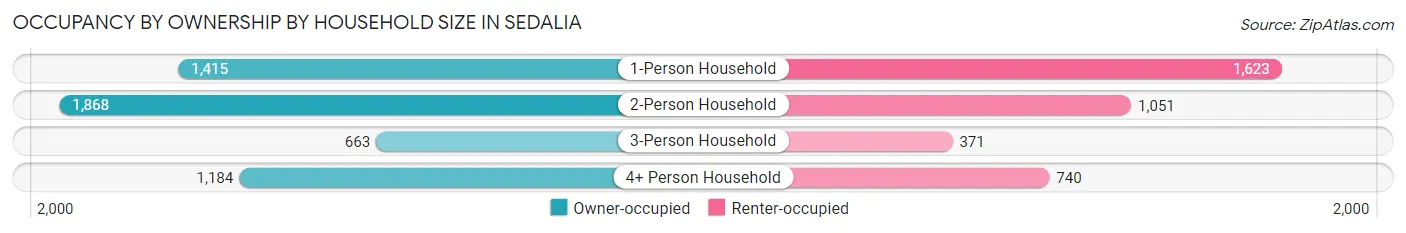
| Household Size | Owner-occupied | Renter-occupied |
| 1-Person Household | 1,415 (46.6%) | 1,623 (53.4%) |
| 2-Person Household | 1,868 (64.0%) | 1,051 (36.0%) |
| 3-Person Household | 663 (64.1%) | 371 (35.9%) |
| 4+ Person Household | 1,184 (61.5%) | 740 (38.5%) |
| Total Housing Units | 5,130 (57.5%) | 3,785 (42.5%) |
Occupancy by Educational Attainment in Sedalia
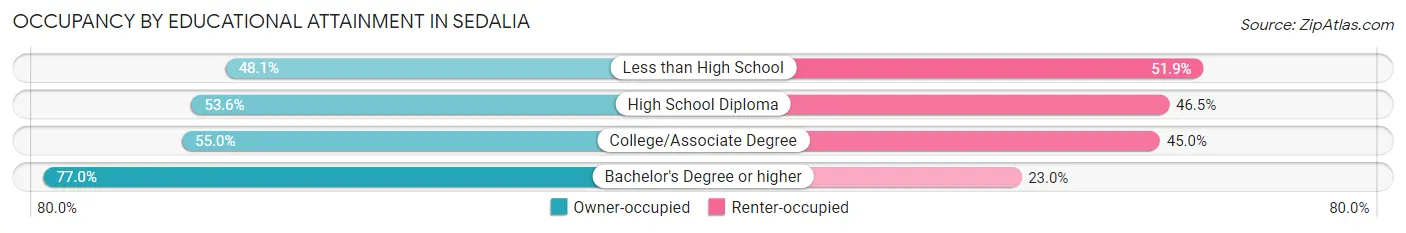
| Household Size | Owner-occupied | Renter-occupied |
| Less than High School | 456 (48.1%) | 492 (51.9%) |
| High School Diploma | 1,623 (53.5%) | 1,408 (46.5%) |
| College/Associate Degree | 1,876 (55.0%) | 1,534 (45.0%) |
| Bachelor's Degree or higher | 1,175 (77.0%) | 351 (23.0%) |
Occupancy by Age of Householder in Sedalia
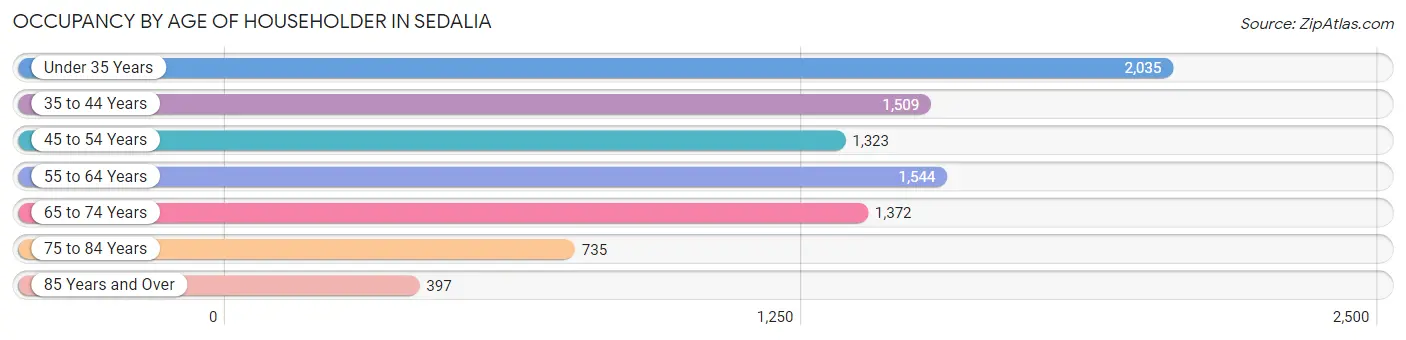
| Age Bracket | # Households | % Households |
| Under 35 Years | 2,035 | 22.8% |
| 35 to 44 Years | 1,509 | 16.9% |
| 45 to 54 Years | 1,323 | 14.8% |
| 55 to 64 Years | 1,544 | 17.3% |
| 65 to 74 Years | 1,372 | 15.4% |
| 75 to 84 Years | 735 | 8.2% |
| 85 Years and Over | 397 | 4.4% |
| Total | 8,915 | 100.0% |
Housing Finances in Sedalia
Median Income by Occupancy in Sedalia
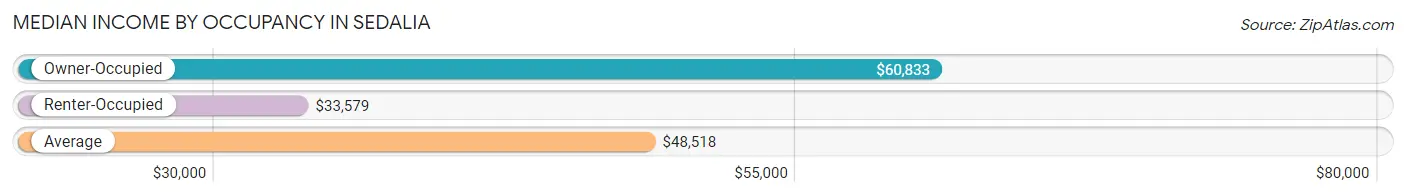
| Occupancy Type | # Households | Median Income |
| Owner-Occupied | 5,130 (57.5%) | $60,833 |
| Renter-Occupied | 3,785 (42.5%) | $33,579 |
| Average | 8,915 (100.0%) | $48,518 |
Occupancy by Householder Income Bracket in Sedalia
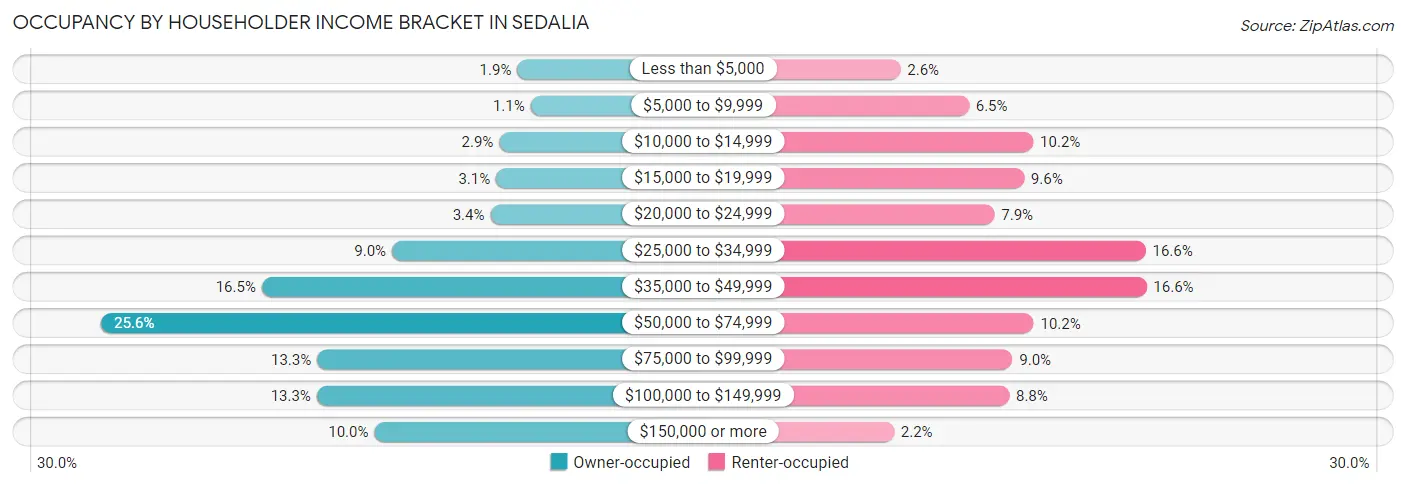
| Income Bracket | Owner-occupied | Renter-occupied |
| Less than $5,000 | 95 (1.8%) | 97 (2.6%) |
| $5,000 to $9,999 | 56 (1.1%) | 245 (6.5%) |
| $10,000 to $14,999 | 148 (2.9%) | 384 (10.2%) |
| $15,000 to $19,999 | 157 (3.1%) | 364 (9.6%) |
| $20,000 to $24,999 | 174 (3.4%) | 300 (7.9%) |
| $25,000 to $34,999 | 462 (9.0%) | 627 (16.6%) |
| $35,000 to $49,999 | 844 (16.5%) | 629 (16.6%) |
| $50,000 to $74,999 | 1,315 (25.6%) | 385 (10.2%) |
| $75,000 to $99,999 | 682 (13.3%) | 339 (9.0%) |
| $100,000 to $149,999 | 683 (13.3%) | 332 (8.8%) |
| $150,000 or more | 514 (10.0%) | 83 (2.2%) |
| Total | 5,130 (100.0%) | 3,785 (100.0%) |
Monthly Housing Cost Tiers in Sedalia
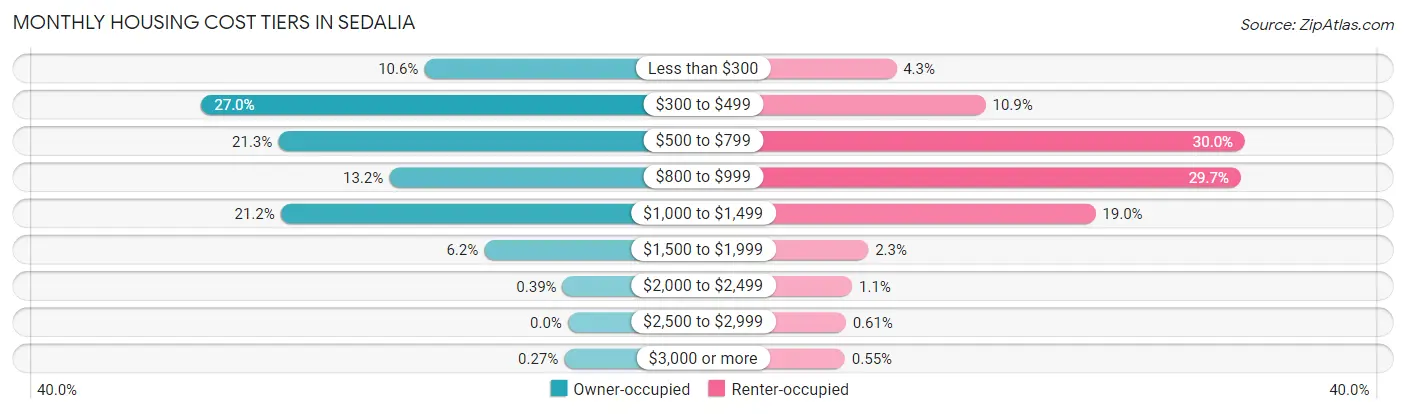
| Monthly Cost | Owner-occupied | Renter-occupied |
| Less than $300 | 542 (10.6%) | 164 (4.3%) |
| $300 to $499 | 1,384 (27.0%) | 413 (10.9%) |
| $500 to $799 | 1,094 (21.3%) | 1,136 (30.0%) |
| $800 to $999 | 675 (13.2%) | 1,124 (29.7%) |
| $1,000 to $1,499 | 1,085 (21.1%) | 719 (19.0%) |
| $1,500 to $1,999 | 316 (6.2%) | 86 (2.3%) |
| $2,000 to $2,499 | 20 (0.4%) | 41 (1.1%) |
| $2,500 to $2,999 | 0 (0.0%) | 23 (0.6%) |
| $3,000 or more | 14 (0.3%) | 21 (0.5%) |
| Total | 5,130 (100.0%) | 3,785 (100.0%) |
Physical Housing Characteristics in Sedalia
Housing Structures in Sedalia
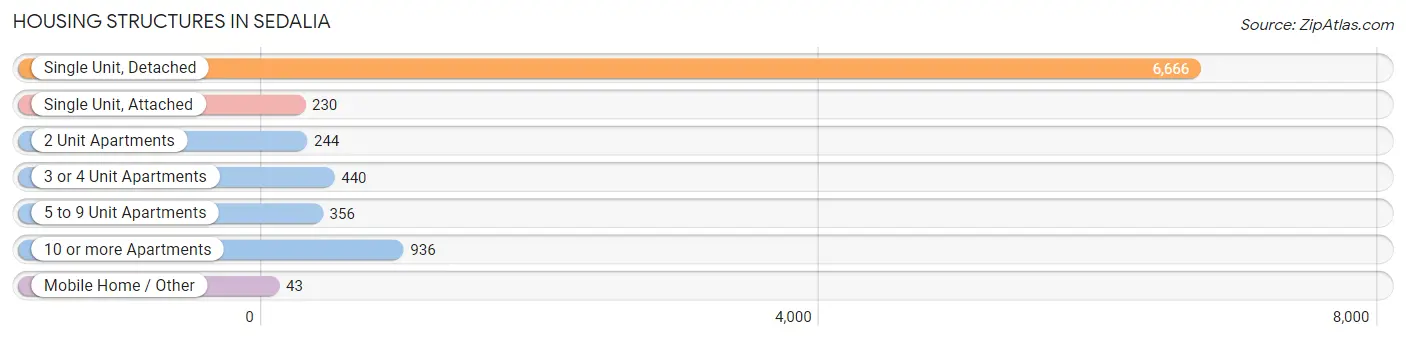
| Structure Type | # Housing Units | % Housing Units |
| Single Unit, Detached | 6,666 | 74.8% |
| Single Unit, Attached | 230 | 2.6% |
| 2 Unit Apartments | 244 | 2.7% |
| 3 or 4 Unit Apartments | 440 | 4.9% |
| 5 to 9 Unit Apartments | 356 | 4.0% |
| 10 or more Apartments | 936 | 10.5% |
| Mobile Home / Other | 43 | 0.5% |
| Total | 8,915 | 100.0% |
Housing Structures by Occupancy in Sedalia
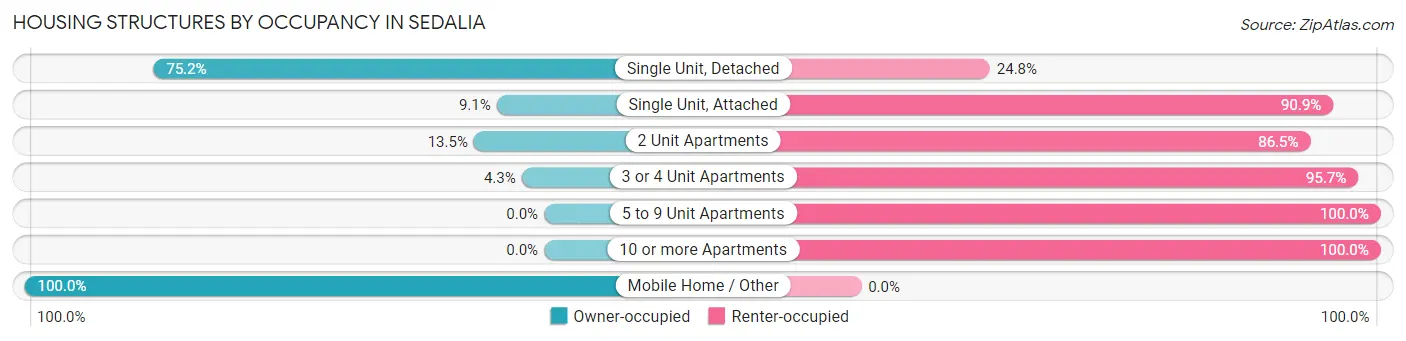
| Structure Type | Owner-occupied | Renter-occupied |
| Single Unit, Detached | 5,014 (75.2%) | 1,652 (24.8%) |
| Single Unit, Attached | 21 (9.1%) | 209 (90.9%) |
| 2 Unit Apartments | 33 (13.5%) | 211 (86.5%) |
| 3 or 4 Unit Apartments | 19 (4.3%) | 421 (95.7%) |
| 5 to 9 Unit Apartments | 0 (0.0%) | 356 (100.0%) |
| 10 or more Apartments | 0 (0.0%) | 936 (100.0%) |
| Mobile Home / Other | 43 (100.0%) | 0 (0.0%) |
| Total | 5,130 (57.5%) | 3,785 (42.5%) |
Housing Structures by Number of Rooms in Sedalia
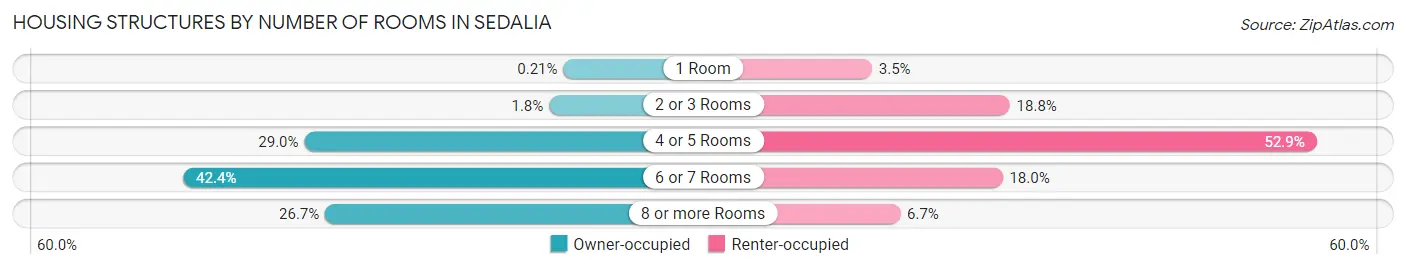
| Number of Rooms | Owner-occupied | Renter-occupied |
| 1 Room | 11 (0.2%) | 134 (3.5%) |
| 2 or 3 Rooms | 92 (1.8%) | 713 (18.8%) |
| 4 or 5 Rooms | 1,485 (28.9%) | 2,002 (52.9%) |
| 6 or 7 Rooms | 2,175 (42.4%) | 683 (18.0%) |
| 8 or more Rooms | 1,367 (26.7%) | 253 (6.7%) |
| Total | 5,130 (100.0%) | 3,785 (100.0%) |
Housing Structure by Heating Type in Sedalia
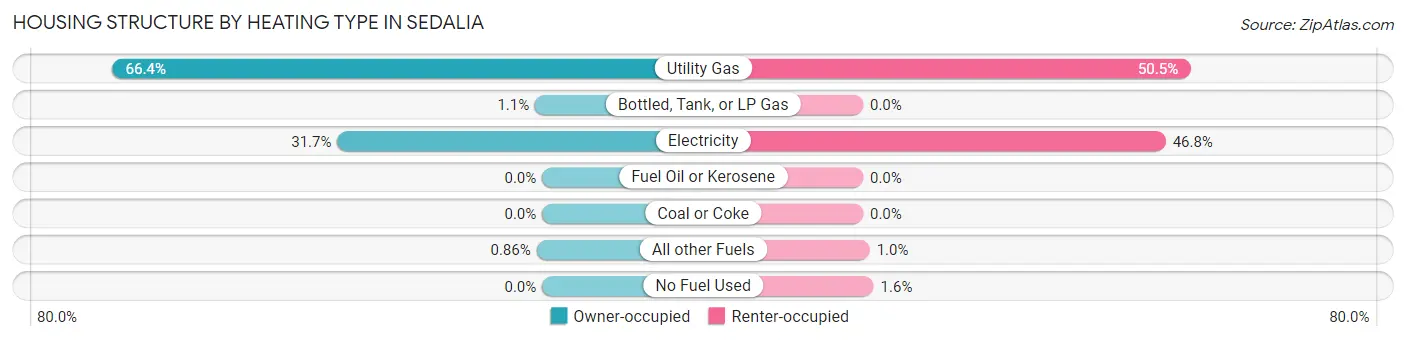
| Heating Type | Owner-occupied | Renter-occupied |
| Utility Gas | 3,406 (66.4%) | 1,913 (50.5%) |
| Bottled, Tank, or LP Gas | 56 (1.1%) | 0 (0.0%) |
| Electricity | 1,624 (31.7%) | 1,771 (46.8%) |
| Fuel Oil or Kerosene | 0 (0.0%) | 0 (0.0%) |
| Coal or Coke | 0 (0.0%) | 0 (0.0%) |
| All other Fuels | 44 (0.9%) | 39 (1.0%) |
| No Fuel Used | 0 (0.0%) | 62 (1.6%) |
| Total | 5,130 (100.0%) | 3,785 (100.0%) |
Household Vehicle Usage in Sedalia
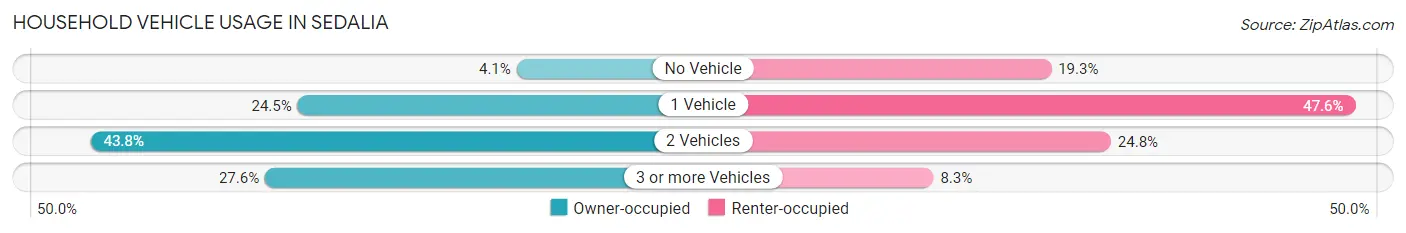
| Vehicles per Household | Owner-occupied | Renter-occupied |
| No Vehicle | 209 (4.1%) | 729 (19.3%) |
| 1 Vehicle | 1,258 (24.5%) | 1,803 (47.6%) |
| 2 Vehicles | 2,249 (43.8%) | 940 (24.8%) |
| 3 or more Vehicles | 1,414 (27.6%) | 313 (8.3%) |
| Total | 5,130 (100.0%) | 3,785 (100.0%) |
Real Estate & Mortgages in Sedalia
Real Estate and Mortgage Overview in Sedalia
| Characteristic | Without Mortgage | With Mortgage |
| Housing Units | 2,432 | 2,698 |
| Median Property Value | $126,700 | $127,400 |
| Median Household Income | $50,702 | $269 |
| Monthly Housing Costs | $395 | $14 |
| Real Estate Taxes | $1,019 | $114 |
Property Value by Mortgage Status in Sedalia
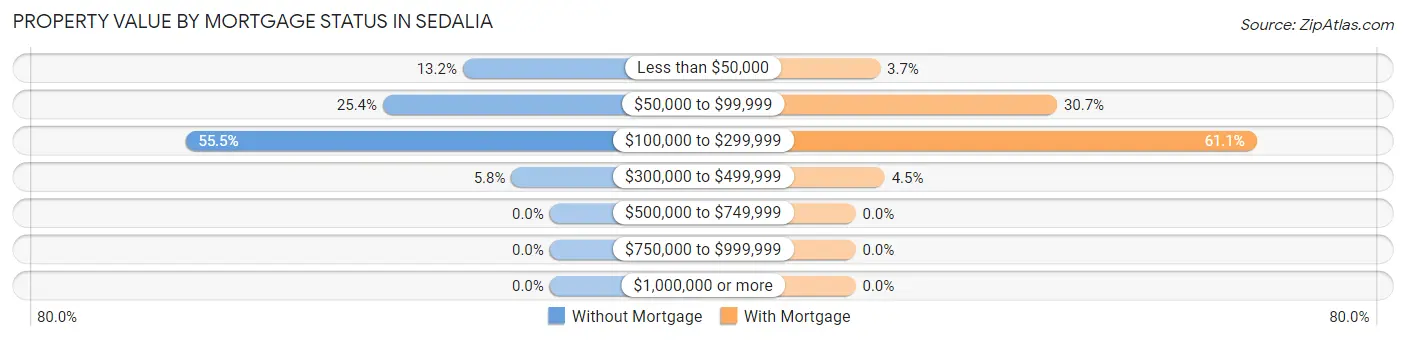
| Property Value | Without Mortgage | With Mortgage |
| Less than $50,000 | 322 (13.2%) | 101 (3.7%) |
| $50,000 to $99,999 | 618 (25.4%) | 828 (30.7%) |
| $100,000 to $299,999 | 1,350 (55.5%) | 1,649 (61.1%) |
| $300,000 to $499,999 | 142 (5.8%) | 120 (4.4%) |
| $500,000 to $749,999 | 0 (0.0%) | 0 (0.0%) |
| $750,000 to $999,999 | 0 (0.0%) | 0 (0.0%) |
| $1,000,000 or more | 0 (0.0%) | 0 (0.0%) |
| Total | 2,432 (100.0%) | 2,698 (100.0%) |
Household Income by Mortgage Status in Sedalia
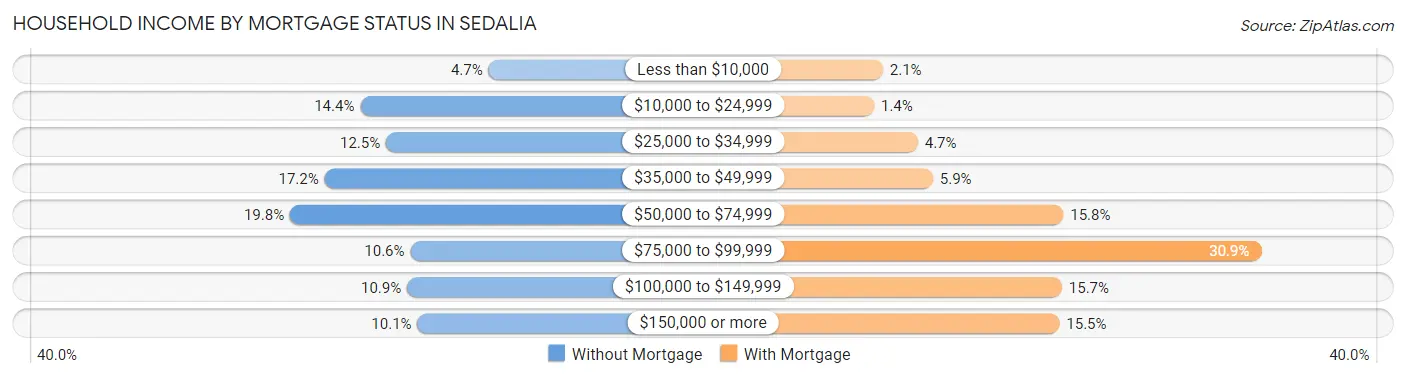
| Household Income | Without Mortgage | With Mortgage |
| Less than $10,000 | 113 (4.6%) | 56 (2.1%) |
| $10,000 to $24,999 | 351 (14.4%) | 38 (1.4%) |
| $25,000 to $34,999 | 303 (12.5%) | 128 (4.7%) |
| $35,000 to $49,999 | 417 (17.2%) | 159 (5.9%) |
| $50,000 to $74,999 | 481 (19.8%) | 427 (15.8%) |
| $75,000 to $99,999 | 258 (10.6%) | 834 (30.9%) |
| $100,000 to $149,999 | 264 (10.9%) | 424 (15.7%) |
| $150,000 or more | 245 (10.1%) | 419 (15.5%) |
| Total | 2,432 (100.0%) | 2,698 (100.0%) |
Property Value to Household Income Ratio in Sedalia
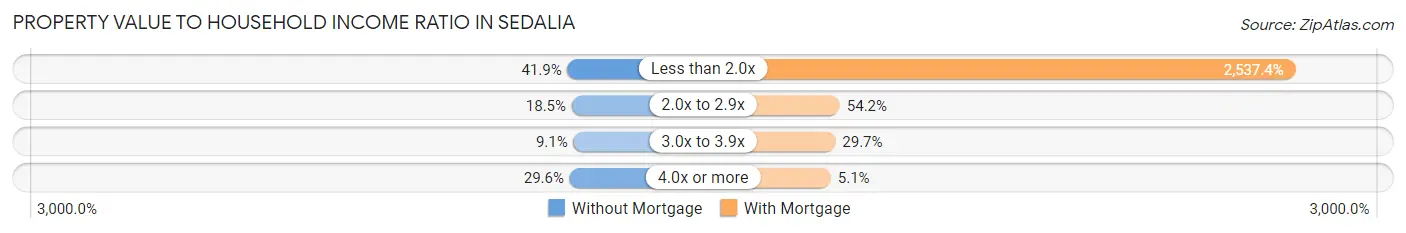
| Value-to-Income Ratio | Without Mortgage | With Mortgage |
| Less than 2.0x | 1,020 (41.9%) | 68,458 (2,537.4%) |
| 2.0x to 2.9x | 450 (18.5%) | 1,462 (54.2%) |
| 3.0x to 3.9x | 221 (9.1%) | 801 (29.7%) |
| 4.0x or more | 720 (29.6%) | 138 (5.1%) |
| Total | 2,432 (100.0%) | 2,698 (100.0%) |
Real Estate Taxes by Mortgage Status in Sedalia
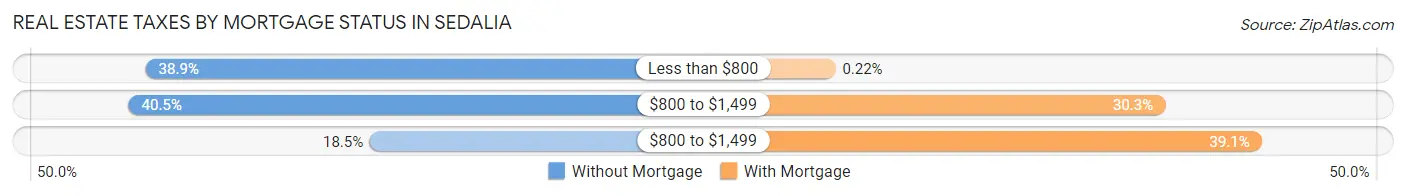
| Property Taxes | Without Mortgage | With Mortgage |
| Less than $800 | 947 (38.9%) | 6 (0.2%) |
| $800 to $1,499 | 985 (40.5%) | 818 (30.3%) |
| $800 to $1,499 | 451 (18.5%) | 1,056 (39.1%) |
| Total | 2,432 (100.0%) | 2,698 (100.0%) |
Health & Disability in Sedalia
Health Insurance Coverage by Age in Sedalia
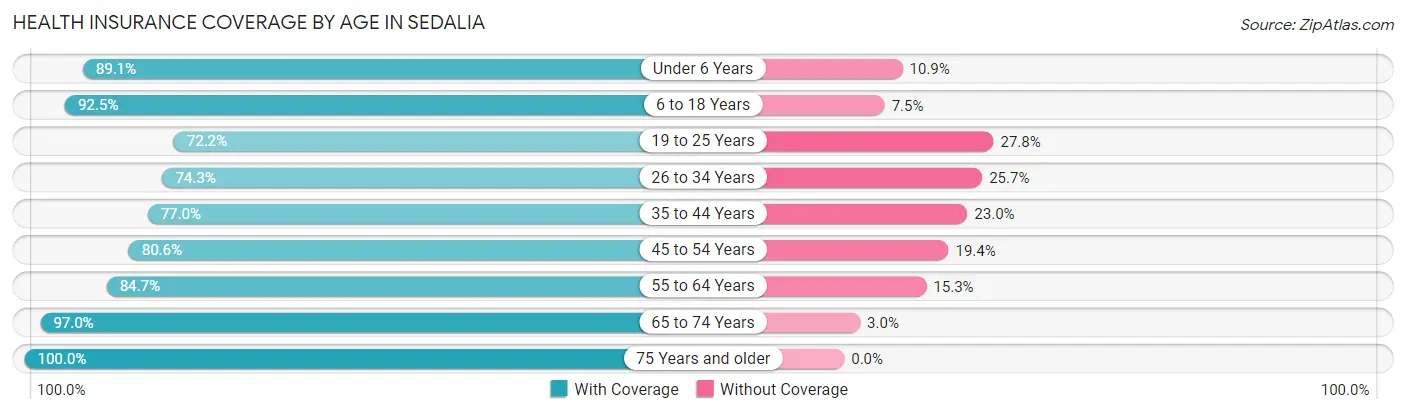
| Age Bracket | With Coverage | Without Coverage |
| Under 6 Years | 1,747 (89.1%) | 213 (10.9%) |
| 6 to 18 Years | 3,494 (92.5%) | 285 (7.5%) |
| 19 to 25 Years | 1,571 (72.2%) | 606 (27.8%) |
| 26 to 34 Years | 1,923 (74.3%) | 666 (25.7%) |
| 35 to 44 Years | 1,953 (77.0%) | 582 (23.0%) |
| 45 to 54 Years | 1,823 (80.6%) | 440 (19.4%) |
| 55 to 64 Years | 2,084 (84.7%) | 377 (15.3%) |
| 65 to 74 Years | 1,970 (97.0%) | 60 (3.0%) |
| 75 Years and older | 1,505 (100.0%) | 0 (0.0%) |
| Total | 18,070 (84.8%) | 3,229 (15.2%) |
Health Insurance Coverage by Citizenship Status in Sedalia
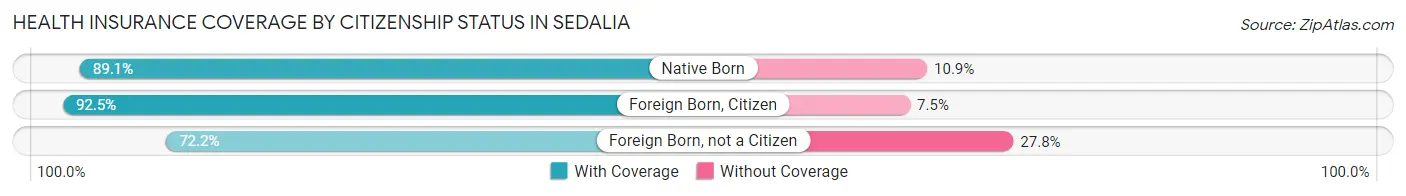
| Citizenship Status | With Coverage | Without Coverage |
| Native Born | 1,747 (89.1%) | 213 (10.9%) |
| Foreign Born, Citizen | 3,494 (92.5%) | 285 (7.5%) |
| Foreign Born, not a Citizen | 1,571 (72.2%) | 606 (27.8%) |
Health Insurance Coverage by Household Income in Sedalia
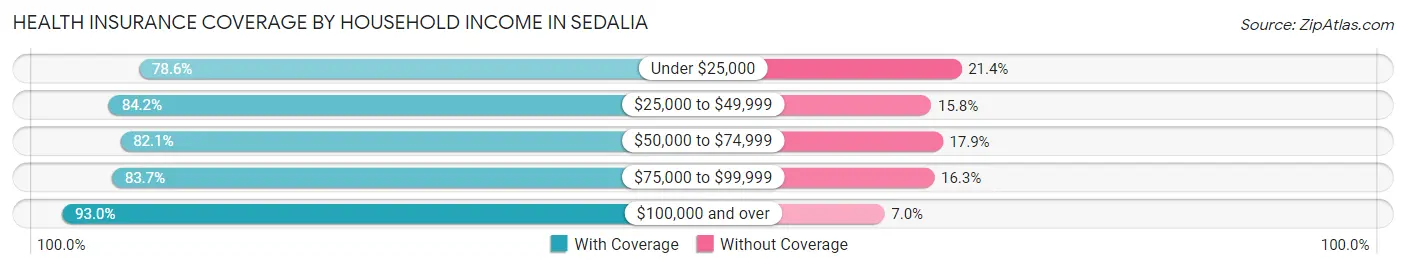
| Household Income | With Coverage | Without Coverage |
| Under $25,000 | 2,534 (78.6%) | 691 (21.4%) |
| $25,000 to $49,999 | 4,631 (84.2%) | 868 (15.8%) |
| $50,000 to $74,999 | 3,756 (82.1%) | 820 (17.9%) |
| $75,000 to $99,999 | 2,600 (83.7%) | 508 (16.3%) |
| $100,000 and over | 4,373 (93.0%) | 331 (7.0%) |
Public vs Private Health Insurance Coverage by Age in Sedalia
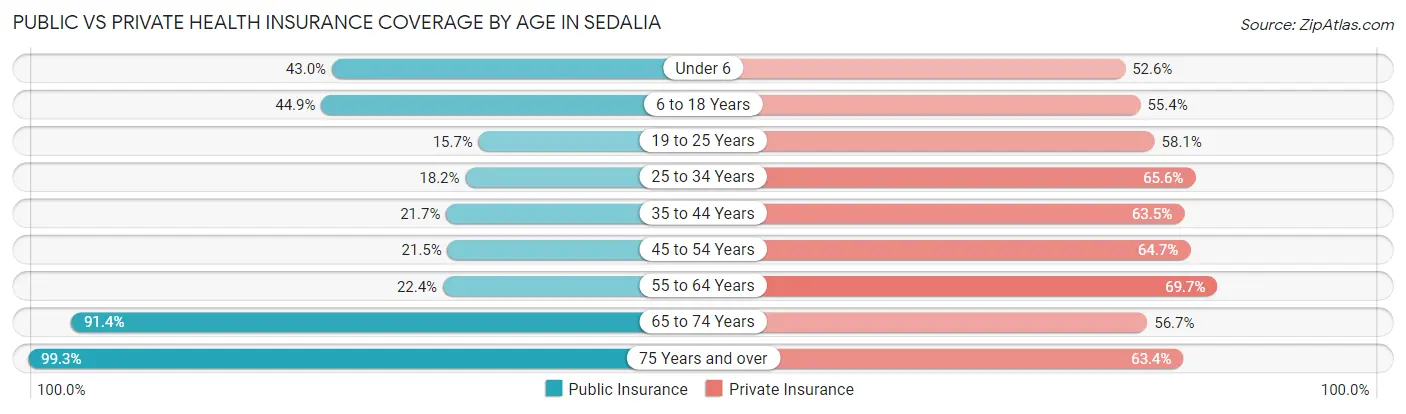
| Age Bracket | Public Insurance | Private Insurance |
| Under 6 | 842 (43.0%) | 1,031 (52.6%) |
| 6 to 18 Years | 1,698 (44.9%) | 2,095 (55.4%) |
| 19 to 25 Years | 342 (15.7%) | 1,264 (58.1%) |
| 25 to 34 Years | 471 (18.2%) | 1,698 (65.6%) |
| 35 to 44 Years | 551 (21.7%) | 1,610 (63.5%) |
| 45 to 54 Years | 486 (21.5%) | 1,463 (64.6%) |
| 55 to 64 Years | 550 (22.4%) | 1,715 (69.7%) |
| 65 to 74 Years | 1,855 (91.4%) | 1,151 (56.7%) |
| 75 Years and over | 1,495 (99.3%) | 954 (63.4%) |
| Total | 8,290 (38.9%) | 12,981 (61.0%) |
Disability Status by Sex by Age in Sedalia
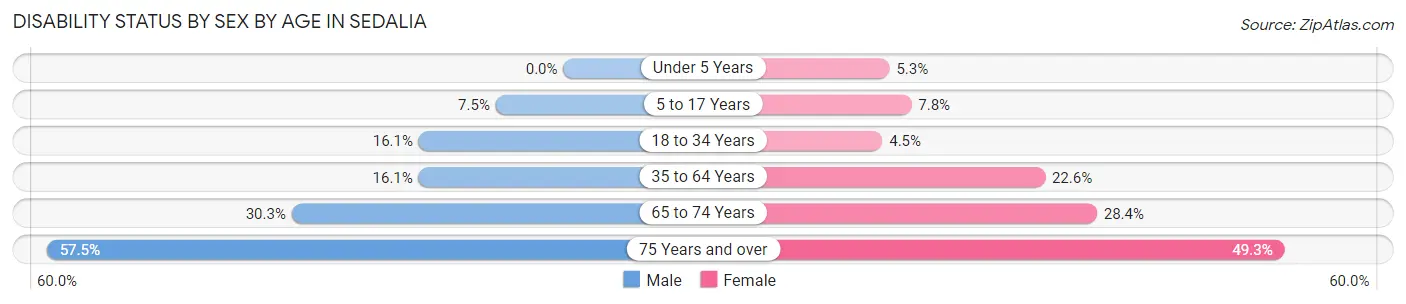
| Age Bracket | Male | Female |
| Under 5 Years | 0 (0.0%) | 38 (5.3%) |
| 5 to 17 Years | 140 (7.5%) | 145 (7.7%) |
| 18 to 34 Years | 401 (16.1%) | 118 (4.5%) |
| 35 to 64 Years | 591 (16.1%) | 813 (22.6%) |
| 65 to 74 Years | 285 (30.2%) | 309 (28.4%) |
| 75 Years and over | 294 (57.5%) | 490 (49.3%) |
Disability Class by Sex by Age in Sedalia
Disability Class: Hearing Difficulty
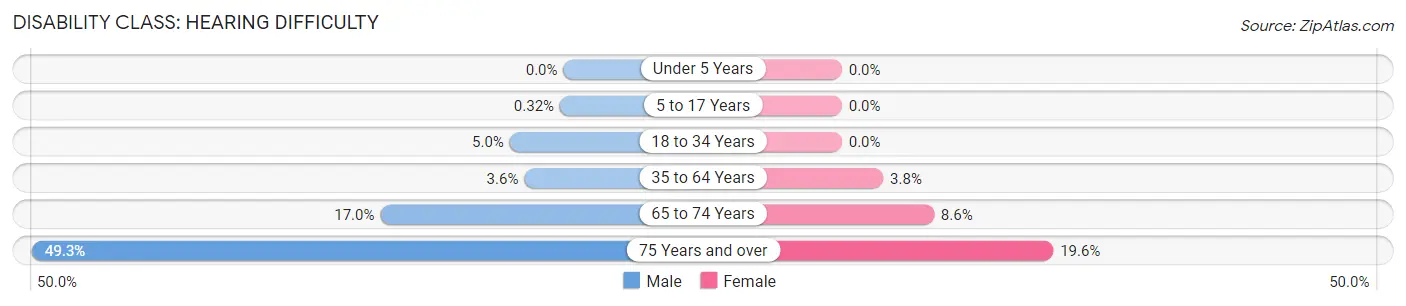
| Age Bracket | Male | Female |
| Under 5 Years | 0 (0.0%) | 0 (0.0%) |
| 5 to 17 Years | 6 (0.3%) | 0 (0.0%) |
| 18 to 34 Years | 124 (5.0%) | 0 (0.0%) |
| 35 to 64 Years | 133 (3.6%) | 138 (3.8%) |
| 65 to 74 Years | 160 (17.0%) | 93 (8.6%) |
| 75 Years and over | 252 (49.3%) | 195 (19.6%) |
Disability Class: Vision Difficulty
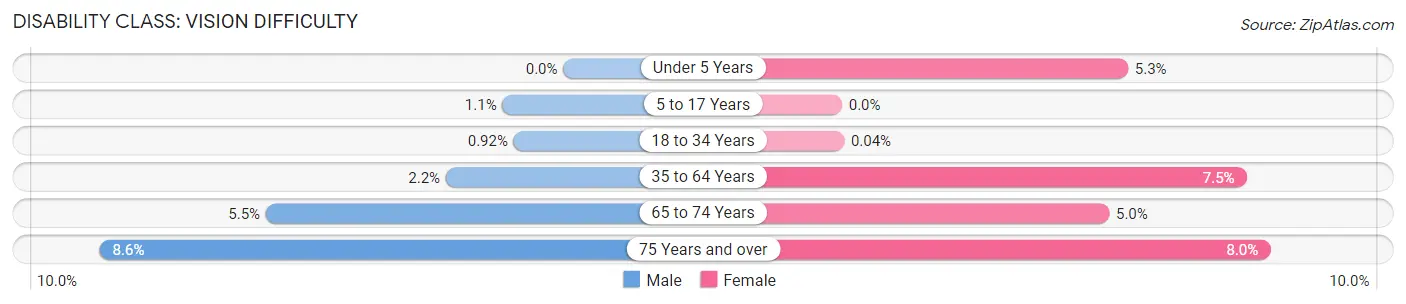
| Age Bracket | Male | Female |
| Under 5 Years | 0 (0.0%) | 38 (5.3%) |
| 5 to 17 Years | 21 (1.1%) | 0 (0.0%) |
| 18 to 34 Years | 23 (0.9%) | 1 (0.0%) |
| 35 to 64 Years | 80 (2.2%) | 270 (7.5%) |
| 65 to 74 Years | 52 (5.5%) | 54 (5.0%) |
| 75 Years and over | 44 (8.6%) | 79 (8.0%) |
Disability Class: Cognitive Difficulty
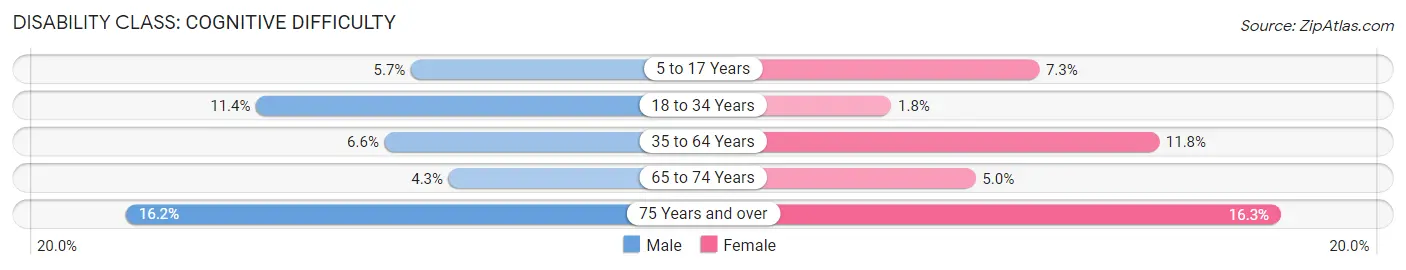
| Age Bracket | Male | Female |
| 5 to 17 Years | 105 (5.7%) | 137 (7.3%) |
| 18 to 34 Years | 284 (11.4%) | 48 (1.8%) |
| 35 to 64 Years | 243 (6.6%) | 423 (11.8%) |
| 65 to 74 Years | 40 (4.3%) | 54 (5.0%) |
| 75 Years and over | 83 (16.2%) | 162 (16.3%) |
Disability Class: Ambulatory Difficulty
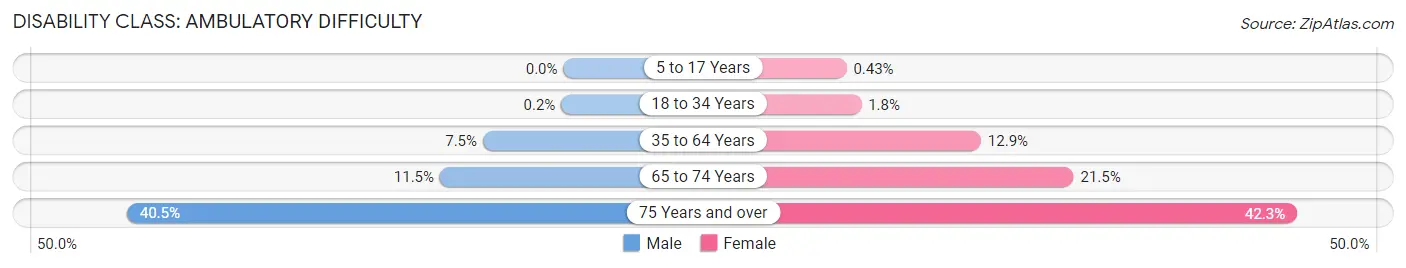
| Age Bracket | Male | Female |
| 5 to 17 Years | 0 (0.0%) | 8 (0.4%) |
| 18 to 34 Years | 5 (0.2%) | 47 (1.8%) |
| 35 to 64 Years | 274 (7.5%) | 464 (12.9%) |
| 65 to 74 Years | 108 (11.5%) | 234 (21.5%) |
| 75 Years and over | 207 (40.5%) | 420 (42.2%) |
Disability Class: Self-Care Difficulty
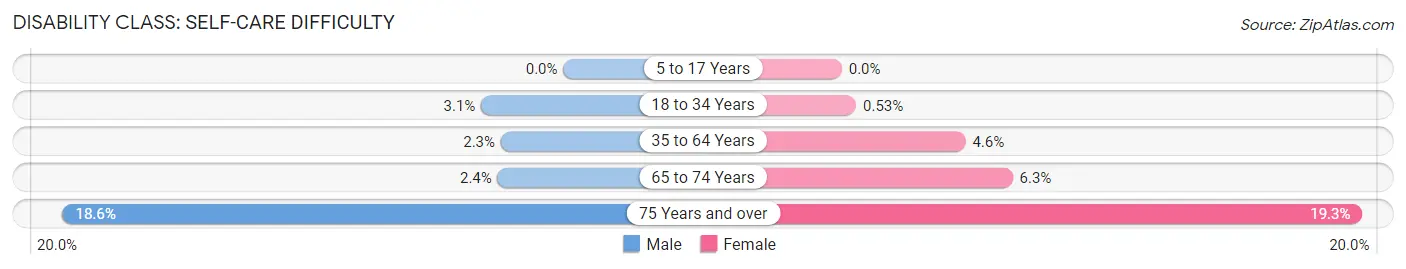
| Age Bracket | Male | Female |
| 5 to 17 Years | 0 (0.0%) | 0 (0.0%) |
| 18 to 34 Years | 76 (3.0%) | 14 (0.5%) |
| 35 to 64 Years | 85 (2.3%) | 165 (4.6%) |
| 65 to 74 Years | 23 (2.4%) | 69 (6.3%) |
| 75 Years and over | 95 (18.6%) | 192 (19.3%) |
Technology Access in Sedalia
Computing Device Access in Sedalia
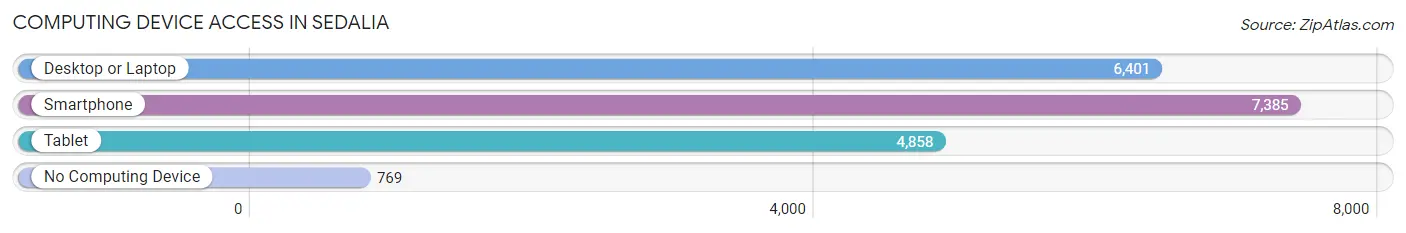
| Device Type | # Households | % Households |
| Desktop or Laptop | 6,401 | 71.8% |
| Smartphone | 7,385 | 82.8% |
| Tablet | 4,858 | 54.5% |
| No Computing Device | 769 | 8.6% |
| Total | 8,915 | 100.0% |
Internet Access in Sedalia
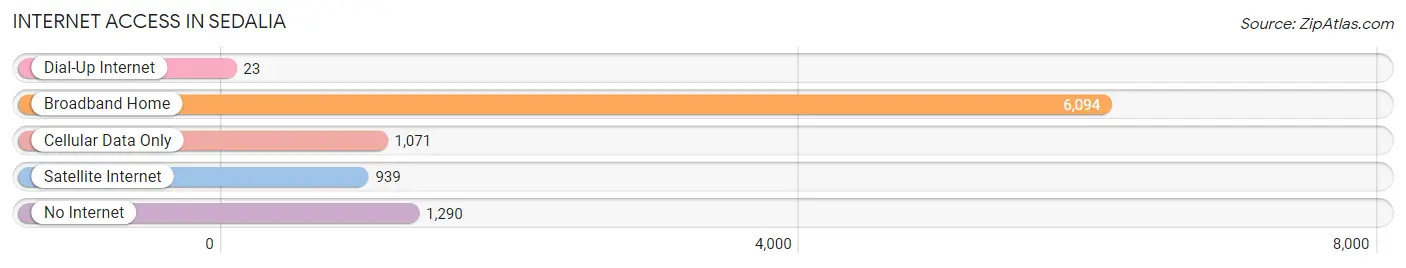
| Internet Type | # Households | % Households |
| Dial-Up Internet | 23 | 0.3% |
| Broadband Home | 6,094 | 68.4% |
| Cellular Data Only | 1,071 | 12.0% |
| Satellite Internet | 939 | 10.5% |
| No Internet | 1,290 | 14.5% |
| Total | 8,915 | 100.0% |
Sedalia Summary
Sedalia, Missouri is a city located in Pettis County, Missouri, United States. It is the county seat of Pettis County and is located approximately halfway between Kansas City and St. Louis. The population of Sedalia was 21,387 at the 2010 census, an increase of 6.2% from the 2000 census.
History
Sedalia was founded in 1857 by General George R. Smith, who named the city after his daughter, Sedalia. The city was incorporated in 1860 and became the county seat of Pettis County in 1861. During the Civil War, Sedalia was a major supply center for the Confederate Army and was the site of several battles. After the war, Sedalia became an important railroad center and was home to the Missouri Pacific Railroad.
In the late 19th century, Sedalia was a major center for the music industry, with several music publishers and recording studios located in the city. It was also home to the first African-American owned and operated record label, the Black Patti Record Company.
Geography
Sedalia is located at 38°41'N 93°12'W (38.68, -93.20). According to the United States Census Bureau, the city has a total area of 16.2 square miles (41.8 km2), of which 16.1 square miles (41.6 km2) is land and 0.1 square miles (0.2 km2) is water.
Economy
Sedalia is home to several major employers, including the State of Missouri, the Sedalia School District, and the Missouri State Fair. The city is also home to several manufacturing companies, including the Missouri Pacific Railroad, the Missouri-Kansas-Texas Railroad, and the Missouri-Kansas-Texas Railroad.
Demographics
As of the 2010 census, there were 21,387 people, 8,717 households, and 5,541 families residing in the city. The population density was 1,323.2 people per square mile (510.7/km2). There were 9,717 housing units at an average density of 602.3 per square mile (232.3/km2). The racial makeup of the city was 79.2% White, 15.2% African American, 0.4% Native American, 0.7% Asian, 0.1% Pacific Islander, 1.7% from other races, and 2.7% from two or more races. Hispanic or Latino of any race were 4.2% of the population.
The median income for a household in the city was $35,945, and the median income for a family was $45,945. Males had a median income of $31,945 versus $25,945 for females. The per capita income for the city was $18,945. About 11.2% of families and 14.2% of the population were below the poverty line, including 19.2% of those under age 18 and 10.2% of those age 65 or over.
Common Questions
What is Per Capita Income in Sedalia?
Per Capita income in Sedalia is $27,891.
What is the Median Family Income in Sedalia?
Median Family Income in Sedalia is $61,517.
What is the Median Household income in Sedalia?
Median Household Income in Sedalia is $48,518.
What is Income or Wage Gap in Sedalia?
Income or Wage Gap in Sedalia is 31.0%.
Women in Sedalia earn 69.0 cents for every dollar earned by a man.
What is Family Income Deficit in Sedalia?
Family Income Deficit in Sedalia is $11,042.
Families that are below poverty line in Sedalia earn $11,042 less on average than the poverty threshold level.
What is Inequality or Gini Index in Sedalia?
Inequality or Gini Index in Sedalia is 0.47.
What is the Total Population of Sedalia?
Total Population of Sedalia is 21,767.
What is the Total Male Population of Sedalia?
Total Male Population of Sedalia is 10,627.
What is the Total Female Population of Sedalia?
Total Female Population of Sedalia is 11,140.
What is the Ratio of Males per 100 Females in Sedalia?
There are 95.39 Males per 100 Females in Sedalia.
What is the Ratio of Females per 100 Males in Sedalia?
There are 104.83 Females per 100 Males in Sedalia.
What is the Median Population Age in Sedalia?
Median Population Age in Sedalia is 36.3 Years.
What is the Average Family Size in Sedalia
Average Family Size in Sedalia is 3.1 People.
What is the Average Household Size in Sedalia
Average Household Size in Sedalia is 2.4 People.
How Large is the Labor Force in Sedalia?
There are 10,687 People in the Labor Forcein in Sedalia.
What is the Percentage of People in the Labor Force in Sedalia?
62.9% of People are in the Labor Force in Sedalia.
What is the Unemployment Rate in Sedalia?
Unemployment Rate in Sedalia is 5.4%.