Marshall, MO Map & Demographics
Marshall Map
Marshall Overview
$24,612
PER CAPITA INCOME
$75,481
AVG FAMILY INCOME
$52,171
AVG HOUSEHOLD INCOME
18.1%
WAGE / INCOME GAP [ % ]
81.9¢/ $1
WAGE / INCOME GAP [ $ ]
0.42
INEQUALITY / GINI INDEX
13,687
TOTAL POPULATION
6,577
MALE POPULATION
7,110
FEMALE POPULATION
92.50
MALES / 100 FEMALES
108.10
FEMALES / 100 MALES
31.8
MEDIAN AGE
3.9
AVG FAMILY SIZE
2.8
AVG HOUSEHOLD SIZE
6,507
LABOR FORCE [ PEOPLE ]
58.6%
PERCENT IN LABOR FORCE
2.8%
UNEMPLOYMENT RATE
Marshall Zip Codes
Marshall Area Codes
Income in Marshall
Income Overview in Marshall
Per Capita Income in Marshall is $24,612, while median incomes of families and households are $75,481 and $52,171 respectively.
| Characteristic | Number | Measure |
| Per Capita Income | 13,687 | $24,612 |
| Median Family Income | 2,523 | $75,481 |
| Mean Family Income | 2,523 | $85,169 |
| Median Household Income | 4,376 | $52,171 |
| Mean Household Income | 4,376 | $68,648 |
| Income Deficit | 2,523 | $0 |
| Wage / Income Gap (%) | 13,687 | 18.14% |
| Wage / Income Gap ($) | 13,687 | 81.86¢ per $1 |
| Gini / Inequality Index | 13,687 | 0.42 |
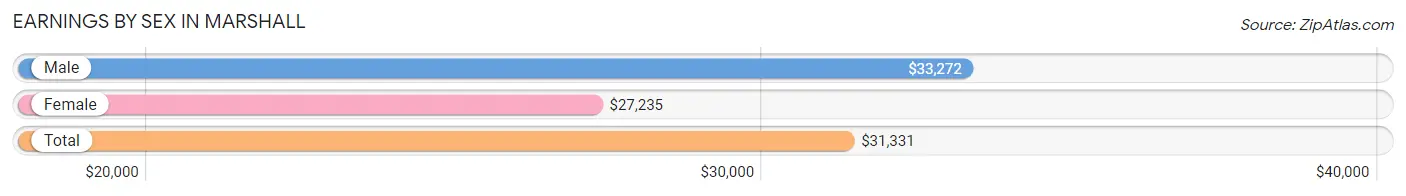
Earnings by Sex in Marshall
Average Earnings in Marshall are $31,331, $33,272 for men and $27,235 for women, a difference of 18.1%.
| Sex | Number | Average Earnings |
| Male | 3,650 (52.1%) | $33,272 |
| Female | 3,355 (47.9%) | $27,235 |
| Total | 7,005 (100.0%) | $31,331 |
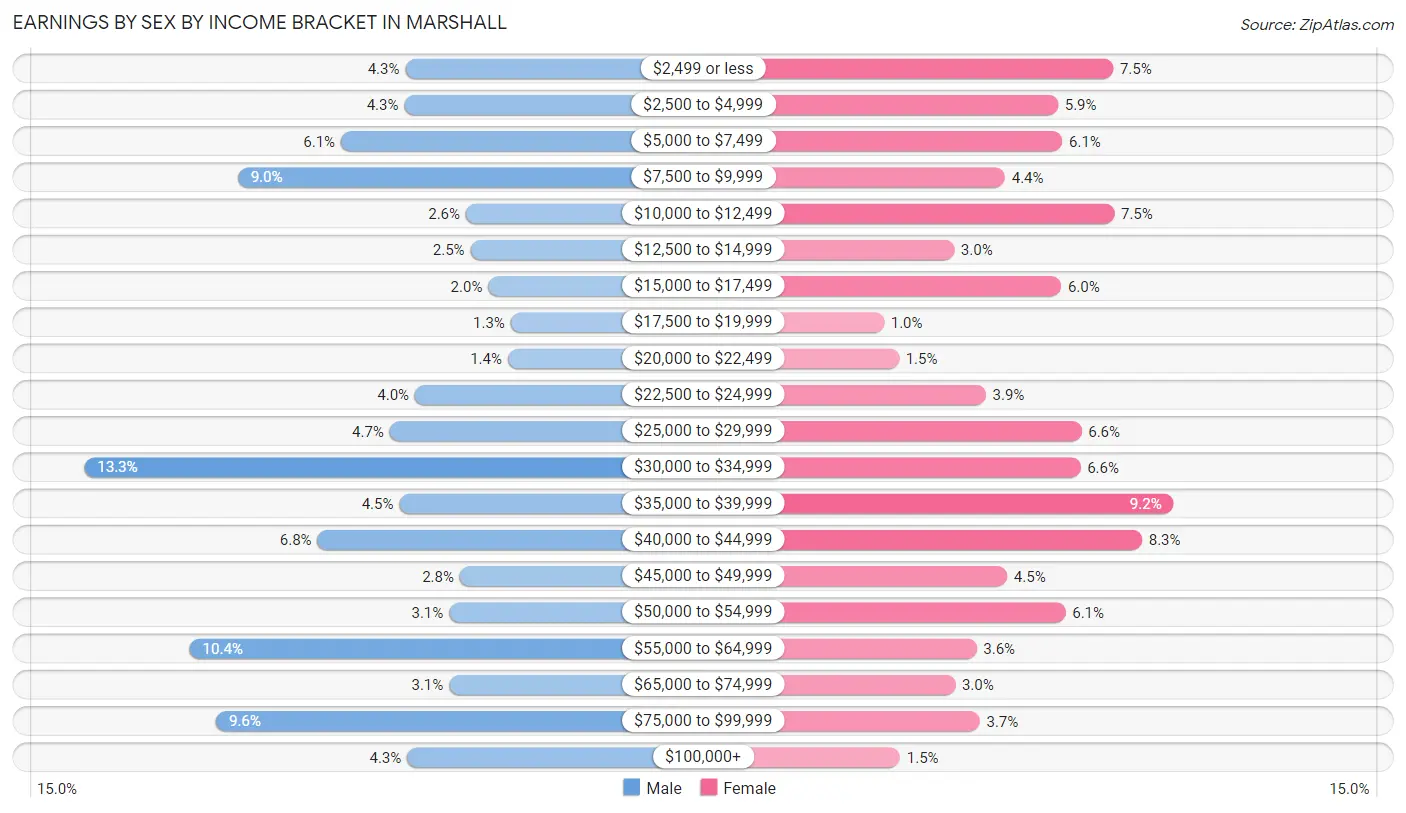
Earnings by Sex by Income Bracket in Marshall
The most common earnings brackets in Marshall are $30,000 to $34,999 for men (486 | 13.3%) and $35,000 to $39,999 for women (308 | 9.2%).
| Income | Male | Female |
| $2,499 or less | 157 (4.3%) | 251 (7.5%) |
| $2,500 to $4,999 | 158 (4.3%) | 199 (5.9%) |
| $5,000 to $7,499 | 223 (6.1%) | 203 (6.0%) |
| $7,500 to $9,999 | 329 (9.0%) | 149 (4.4%) |
| $10,000 to $12,499 | 95 (2.6%) | 252 (7.5%) |
| $12,500 to $14,999 | 90 (2.5%) | 101 (3.0%) |
| $15,000 to $17,499 | 72 (2.0%) | 202 (6.0%) |
| $17,500 to $19,999 | 49 (1.3%) | 35 (1.0%) |
| $20,000 to $22,499 | 52 (1.4%) | 49 (1.5%) |
| $22,500 to $24,999 | 147 (4.0%) | 131 (3.9%) |
| $25,000 to $29,999 | 173 (4.7%) | 221 (6.6%) |
| $30,000 to $34,999 | 486 (13.3%) | 220 (6.6%) |
| $35,000 to $39,999 | 163 (4.5%) | 308 (9.2%) |
| $40,000 to $44,999 | 247 (6.8%) | 278 (8.3%) |
| $45,000 to $49,999 | 101 (2.8%) | 151 (4.5%) |
| $50,000 to $54,999 | 112 (3.1%) | 206 (6.1%) |
| $55,000 to $64,999 | 378 (10.4%) | 122 (3.6%) |
| $65,000 to $74,999 | 112 (3.1%) | 102 (3.0%) |
| $75,000 to $99,999 | 351 (9.6%) | 125 (3.7%) |
| $100,000+ | 155 (4.3%) | 50 (1.5%) |
| Total | 3,650 (100.0%) | 3,355 (100.0%) |
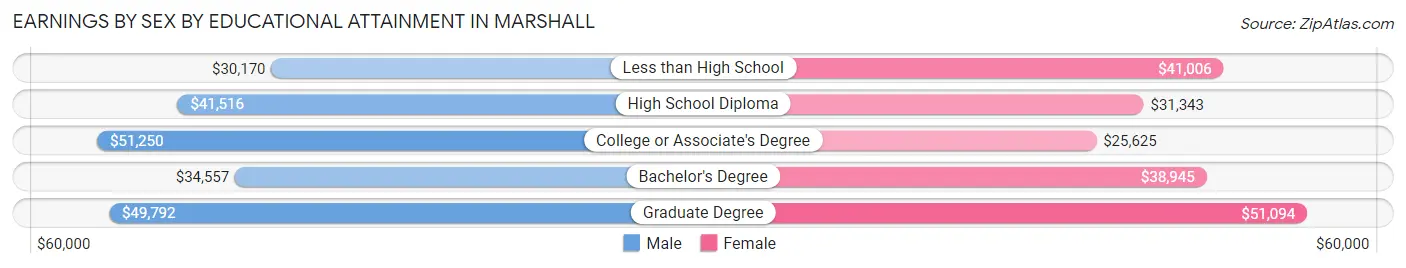
Earnings by Sex by Educational Attainment in Marshall
Average earnings in Marshall are $37,212 for men and $36,141 for women, a difference of 2.9%. Men with an educational attainment of college or associate's degree enjoy the highest average annual earnings of $51,250, while those with less than high school education earn the least with $30,170. Women with an educational attainment of graduate degree earn the most with the average annual earnings of $51,094, while those with college or associate's degree education have the smallest earnings of $25,625.
| Educational Attainment | Male Income | Female Income |
| Less than High School | $30,170 | $41,006 |
| High School Diploma | $41,516 | $31,343 |
| College or Associate's Degree | $51,250 | $25,625 |
| Bachelor's Degree | $34,557 | $38,945 |
| Graduate Degree | $49,792 | $51,094 |
| Total | $37,212 | $36,141 |
Family Income in Marshall
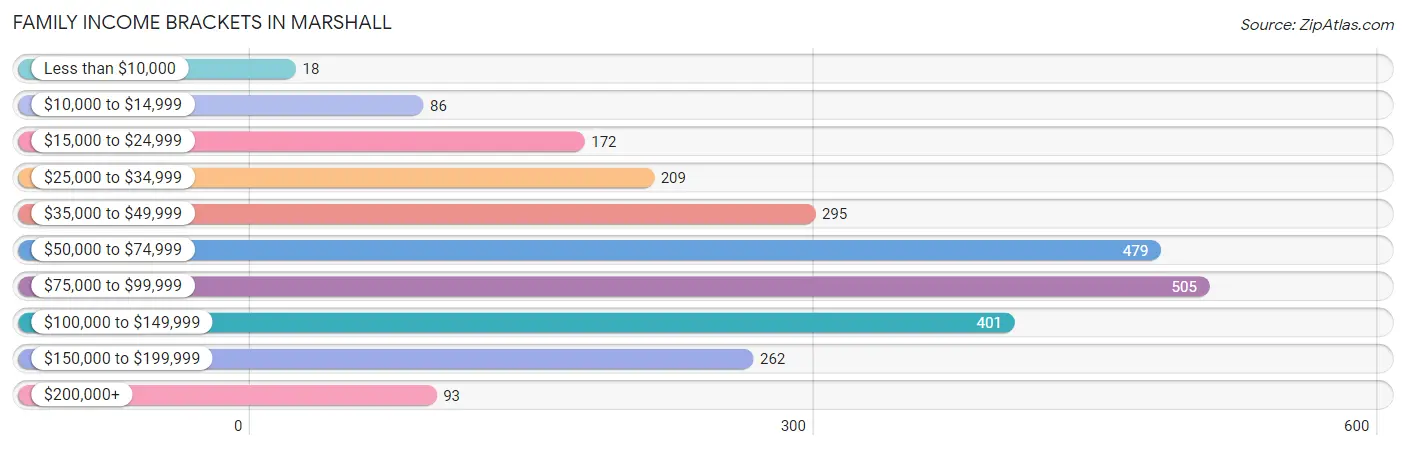
Family Income Brackets in Marshall
According to the Marshall family income data, there are 505 families falling into the $75,000 to $99,999 income range, which is the most common income bracket and makes up 20.0% of all families. Conversely, the less than $10,000 income bracket is the least frequent group with only 18 families (0.7%) belonging to this category.
| Income Bracket | # Families | % Families |
| Less than $10,000 | 18 | 0.7% |
| $10,000 to $14,999 | 86 | 3.4% |
| $15,000 to $24,999 | 172 | 6.8% |
| $25,000 to $34,999 | 209 | 8.3% |
| $35,000 to $49,999 | 295 | 11.7% |
| $50,000 to $74,999 | 479 | 19.0% |
| $75,000 to $99,999 | 505 | 20.0% |
| $100,000 to $149,999 | 401 | 15.9% |
| $150,000 to $199,999 | 262 | 10.4% |
| $200,000+ | 93 | 3.7% |
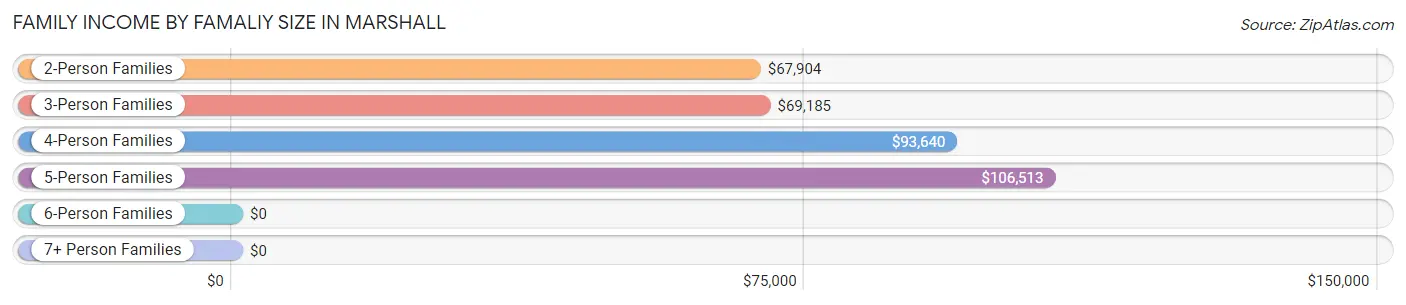
Family Income by Famaliy Size in Marshall
5-person families (129 | 5.1%) account for the highest median family income in Marshall with $106,513 per family, while 2-person families (1,209 | 47.9%) have the highest median income of $33,952 per family member.
| Income Bracket | # Families | Median Income |
| 2-Person Families | 1,209 (47.9%) | $67,904 |
| 3-Person Families | 701 (27.8%) | $69,185 |
| 4-Person Families | 394 (15.6%) | $93,640 |
| 5-Person Families | 129 (5.1%) | $106,513 |
| 6-Person Families | 62 (2.5%) | $0 |
| 7+ Person Families | 28 (1.1%) | $0 |
| Total | 2,523 (100.0%) | $75,481 |
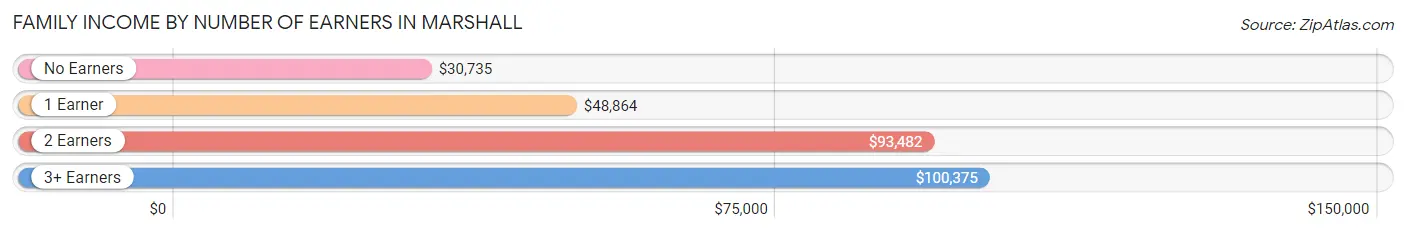
Family Income by Number of Earners in Marshall
The median family income in Marshall is $75,481, with families comprising 3+ earners (357) having the highest median family income of $100,375, while families with no earners (310) have the lowest median family income of $30,735, accounting for 14.1% and 12.3% of families, respectively.
| Number of Earners | # Families | Median Income |
| No Earners | 310 (12.3%) | $30,735 |
| 1 Earner | 850 (33.7%) | $48,864 |
| 2 Earners | 1,006 (39.9%) | $93,482 |
| 3+ Earners | 357 (14.1%) | $100,375 |
| Total | 2,523 (100.0%) | $75,481 |
Household Income in Marshall
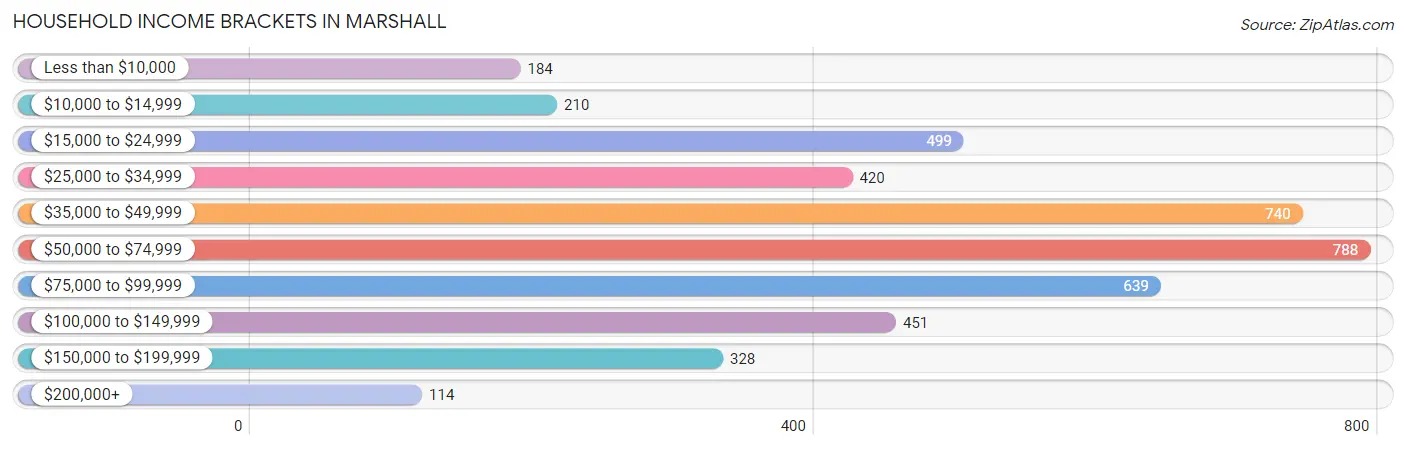
Household Income Brackets in Marshall
With 788 households falling in the category, the $50,000 to $74,999 income range is the most frequent in Marshall, accounting for 18.0% of all households. In contrast, only 114 households (2.6%) fall into the $200,000+ income bracket, making it the least populous group.
| Income Bracket | # Households | % Households |
| Less than $10,000 | 184 | 4.2% |
| $10,000 to $14,999 | 210 | 4.8% |
| $15,000 to $24,999 | 499 | 11.4% |
| $25,000 to $34,999 | 420 | 9.6% |
| $35,000 to $49,999 | 740 | 16.9% |
| $50,000 to $74,999 | 788 | 18.0% |
| $75,000 to $99,999 | 639 | 14.6% |
| $100,000 to $149,999 | 451 | 10.3% |
| $150,000 to $199,999 | 328 | 7.5% |
| $200,000+ | 114 | 2.6% |
Household Income by Householder Age in Marshall
The median household income in Marshall is $52,171, with the highest median household income of $68,537 found in the 25 to 44 years age bracket for the primary householder. A total of 1,292 households (29.5%) fall into this category. Meanwhile, the 15 to 24 years age bracket for the primary householder has the lowest median household income of $36,250, with 232 households (5.3%) in this group.
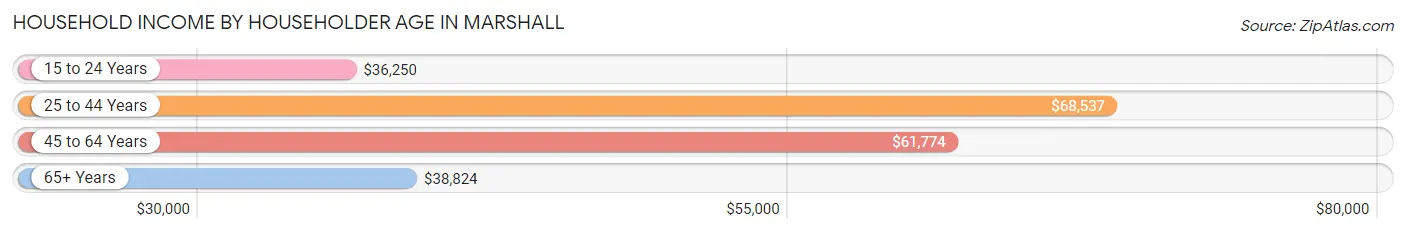
| Income Bracket | # Households | Median Income |
| 15 to 24 Years | 232 (5.3%) | $36,250 |
| 25 to 44 Years | 1,292 (29.5%) | $68,537 |
| 45 to 64 Years | 1,432 (32.7%) | $61,774 |
| 65+ Years | 1,420 (32.5%) | $38,824 |
| Total | 4,376 (100.0%) | $52,171 |
Poverty in Marshall
Income Below Poverty by Sex and Age in Marshall
With 11.2% poverty level for males and 15.8% for females among the residents of Marshall, 12 to 14 year old males and 18 to 24 year old females are the most vulnerable to poverty, with 59 males (38.8%) and 174 females (26.9%) in their respective age groups living below the poverty level.
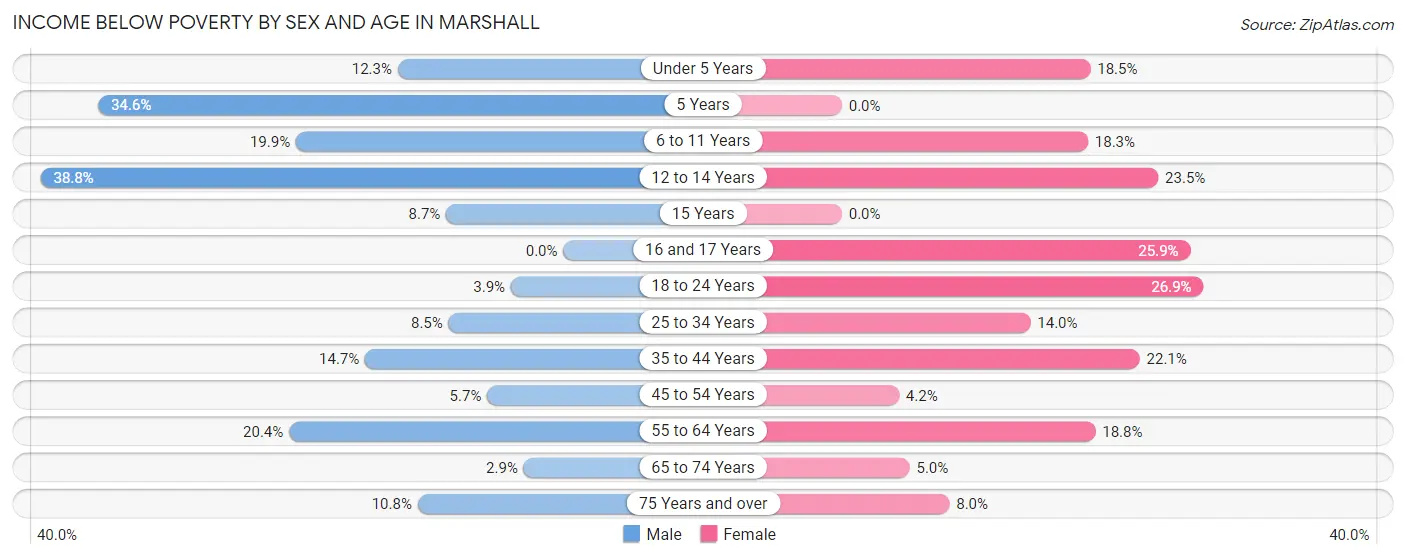
| Age Bracket | Male | Female |
| Under 5 Years | 43 (12.3%) | 50 (18.4%) |
| 5 Years | 19 (34.5%) | 0 (0.0%) |
| 6 to 11 Years | 80 (19.9%) | 99 (18.3%) |
| 12 to 14 Years | 59 (38.8%) | 101 (23.5%) |
| 15 Years | 4 (8.7%) | 0 (0.0%) |
| 16 and 17 Years | 0 (0.0%) | 44 (25.9%) |
| 18 to 24 Years | 31 (3.9%) | 174 (26.9%) |
| 25 to 34 Years | 94 (8.5%) | 117 (14.0%) |
| 35 to 44 Years | 101 (14.7%) | 172 (22.1%) |
| 45 to 54 Years | 35 (5.7%) | 26 (4.2%) |
| 55 to 64 Years | 149 (20.4%) | 162 (18.8%) |
| 65 to 74 Years | 18 (2.9%) | 28 (5.0%) |
| 75 Years and over | 40 (10.8%) | 40 (8.0%) |
| Total | 673 (11.2%) | 1,013 (15.8%) |
Income Above Poverty by Sex and Age in Marshall
According to the poverty statistics in Marshall, males aged 16 and 17 years and females aged 5 years are the age groups that are most secure financially, with 100.0% of males and 100.0% of females in these age groups living above the poverty line.
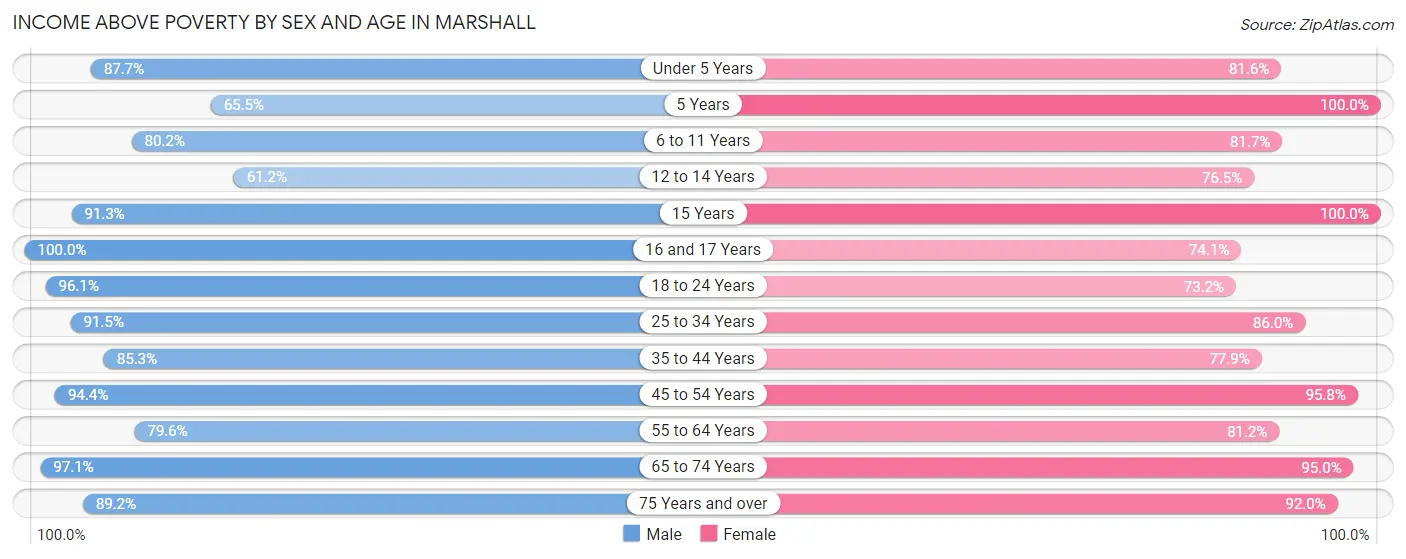
| Age Bracket | Male | Female |
| Under 5 Years | 307 (87.7%) | 221 (81.6%) |
| 5 Years | 36 (65.4%) | 140 (100.0%) |
| 6 to 11 Years | 323 (80.1%) | 443 (81.7%) |
| 12 to 14 Years | 93 (61.2%) | 329 (76.5%) |
| 15 Years | 42 (91.3%) | 67 (100.0%) |
| 16 and 17 Years | 100 (100.0%) | 126 (74.1%) |
| 18 to 24 Years | 766 (96.1%) | 474 (73.2%) |
| 25 to 34 Years | 1,009 (91.5%) | 719 (86.0%) |
| 35 to 44 Years | 585 (85.3%) | 606 (77.9%) |
| 45 to 54 Years | 585 (94.4%) | 587 (95.8%) |
| 55 to 64 Years | 583 (79.6%) | 699 (81.2%) |
| 65 to 74 Years | 594 (97.1%) | 529 (95.0%) |
| 75 Years and over | 330 (89.2%) | 461 (92.0%) |
| Total | 5,353 (88.8%) | 5,401 (84.2%) |
Income Below Poverty Among Married-Couple Families in Marshall
The poverty statistics for married-couple families in Marshall show that 4.1% or 77 of the total 1,864 families live below the poverty line. Families with 3 or 4 children have the highest poverty rate of 27.9%, comprising of 19 families. On the other hand, families with no children have the lowest poverty rate of 1.5%, which includes 17 families.
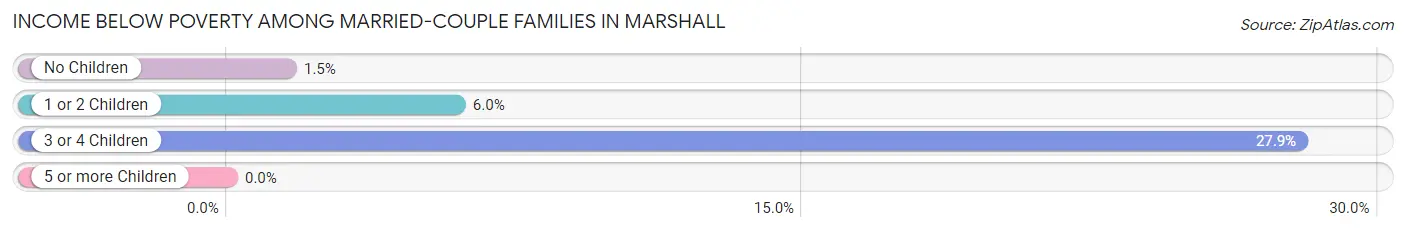
| Children | Above Poverty | Below Poverty |
| No Children | 1,090 (98.5%) | 17 (1.5%) |
| 1 or 2 Children | 648 (94.1%) | 41 (5.9%) |
| 3 or 4 Children | 49 (72.1%) | 19 (27.9%) |
| 5 or more Children | 0 (0.0%) | 0 (0.0%) |
| Total | 1,787 (95.9%) | 77 (4.1%) |
Income Below Poverty Among Single-Parent Households in Marshall
According to the poverty data in Marshall, 18.9% or 46 single-father households and 27.2% or 113 single-mother households are living below the poverty line. Among single-father households, those with 3 or 4 children have the highest poverty rate, with 30 households (100.0%) experiencing poverty. Likewise, among single-mother households, those with 3 or 4 children have the highest poverty rate, with 7 households (100.0%) falling below the poverty line.
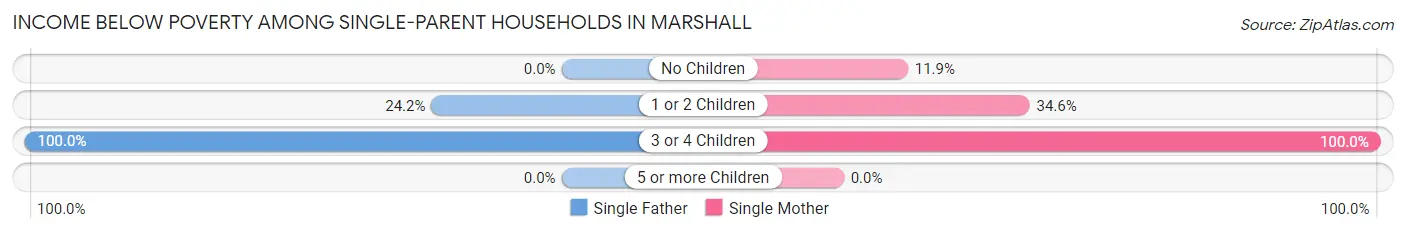
| Children | Single Father | Single Mother |
| No Children | 0 (0.0%) | 16 (11.9%) |
| 1 or 2 Children | 16 (24.2%) | 90 (34.6%) |
| 3 or 4 Children | 30 (100.0%) | 7 (100.0%) |
| 5 or more Children | 0 (0.0%) | 0 (0.0%) |
| Total | 46 (18.9%) | 113 (27.2%) |
Income Below Poverty Among Married-Couple vs Single-Parent Households in Marshall
The poverty data for Marshall shows that 77 of the married-couple family households (4.1%) and 159 of the single-parent households (24.1%) are living below the poverty level. Within the married-couple family households, those with 3 or 4 children have the highest poverty rate, with 19 households (27.9%) falling below the poverty line. Among the single-parent households, those with 3 or 4 children have the highest poverty rate, with 37 household (100.0%) living below poverty.
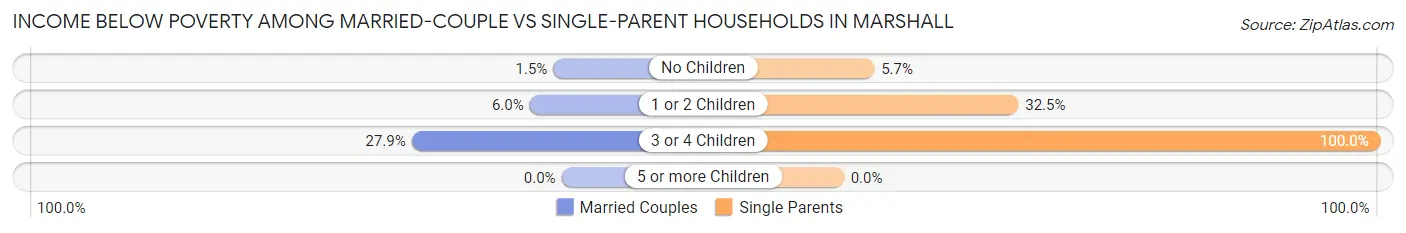
| Children | Married-Couple Families | Single-Parent Households |
| No Children | 17 (1.5%) | 16 (5.7%) |
| 1 or 2 Children | 41 (5.9%) | 106 (32.5%) |
| 3 or 4 Children | 19 (27.9%) | 37 (100.0%) |
| 5 or more Children | 0 (0.0%) | 0 (0.0%) |
| Total | 77 (4.1%) | 159 (24.1%) |
Race in Marshall
The most populous races in Marshall are White / Caucasian (10,003 | 73.1%), Hispanic or Latino (2,351 | 17.2%), and Two or more Races (1,272 | 9.3%).
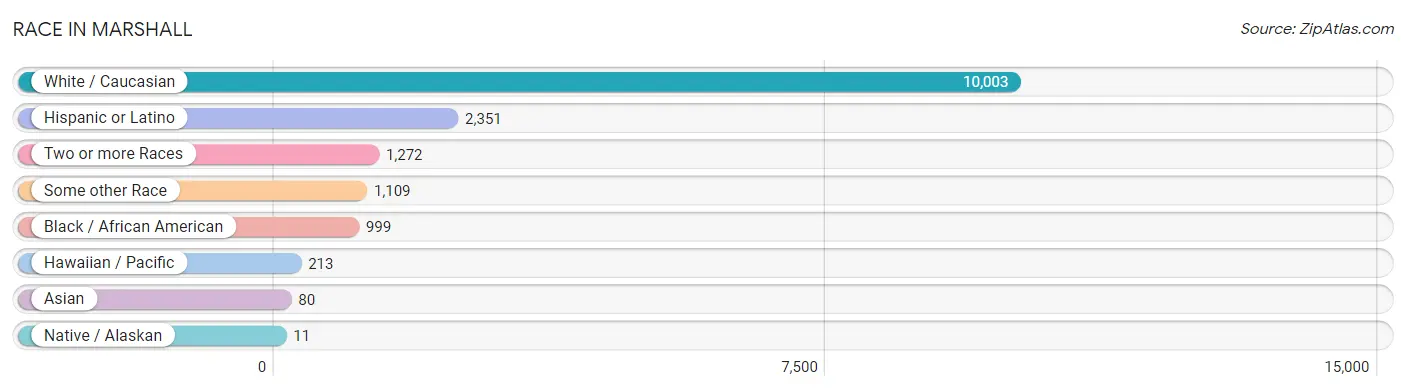
| Race | # Population | % Population |
| Asian | 80 | 0.6% |
| Black / African American | 999 | 7.3% |
| Hawaiian / Pacific | 213 | 1.6% |
| Hispanic or Latino | 2,351 | 17.2% |
| Native / Alaskan | 11 | 0.1% |
| White / Caucasian | 10,003 | 73.1% |
| Two or more Races | 1,272 | 9.3% |
| Some other Race | 1,109 | 8.1% |
| Total | 13,687 | 100.0% |
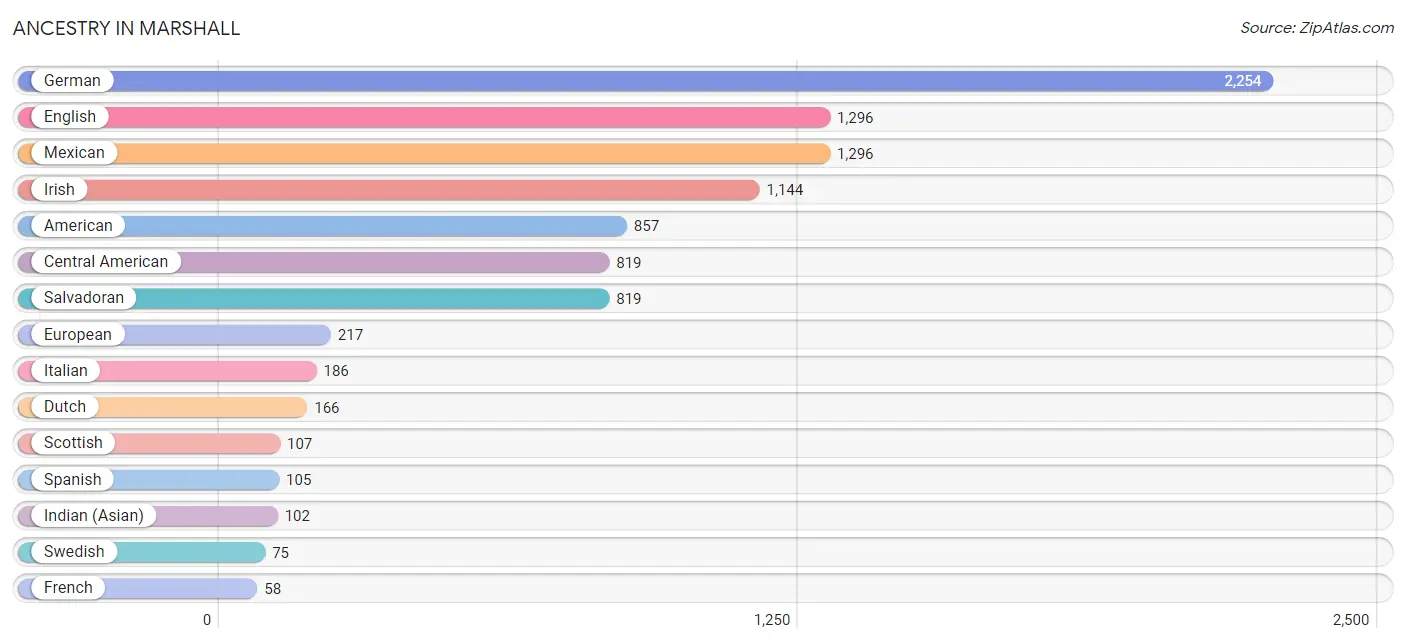
Ancestry in Marshall
The most populous ancestries reported in Marshall are German (2,254 | 16.5%), English (1,296 | 9.5%), Mexican (1,296 | 9.5%), Irish (1,144 | 8.4%), and American (857 | 6.3%), together accounting for 50.0% of all Marshall residents.
| Ancestry | # Population | % Population |
| African | 6 | 0.0% |
| American | 857 | 6.3% |
| Argentinean | 1 | 0.0% |
| Australian | 1 | 0.0% |
| Bhutanese | 1 | 0.0% |
| Brazilian | 16 | 0.1% |
| British | 46 | 0.3% |
| Central American | 819 | 6.0% |
| Cherokee | 27 | 0.2% |
| Colombian | 2 | 0.0% |
| Danish | 24 | 0.2% |
| Dutch | 166 | 1.2% |
| English | 1,296 | 9.5% |
| European | 217 | 1.6% |
| Fijian | 50 | 0.4% |
| Finnish | 25 | 0.2% |
| French | 58 | 0.4% |
| German | 2,254 | 16.5% |
| Greek | 20 | 0.2% |
| Hungarian | 20 | 0.2% |
| Indian (Asian) | 102 | 0.7% |
| Irish | 1,144 | 8.4% |
| Italian | 186 | 1.4% |
| Korean | 9 | 0.1% |
| Marshallese | 41 | 0.3% |
| Mexican | 1,296 | 9.5% |
| Mexican American Indian | 13 | 0.1% |
| Native Hawaiian | 12 | 0.1% |
| Northern European | 10 | 0.1% |
| Norwegian | 9 | 0.1% |
| Polish | 30 | 0.2% |
| Puerto Rican | 15 | 0.1% |
| Russian | 9 | 0.1% |
| Salvadoran | 819 | 6.0% |
| Scandinavian | 8 | 0.1% |
| Scotch-Irish | 57 | 0.4% |
| Scottish | 107 | 0.8% |
| South American | 3 | 0.0% |
| Spaniard | 31 | 0.2% |
| Spanish | 105 | 0.8% |
| Sri Lankan | 57 | 0.4% |
| Subsaharan African | 16 | 0.1% |
| Swedish | 75 | 0.5% |
| Thai | 11 | 0.1% |
| Welsh | 56 | 0.4% | View All 45 Rows |
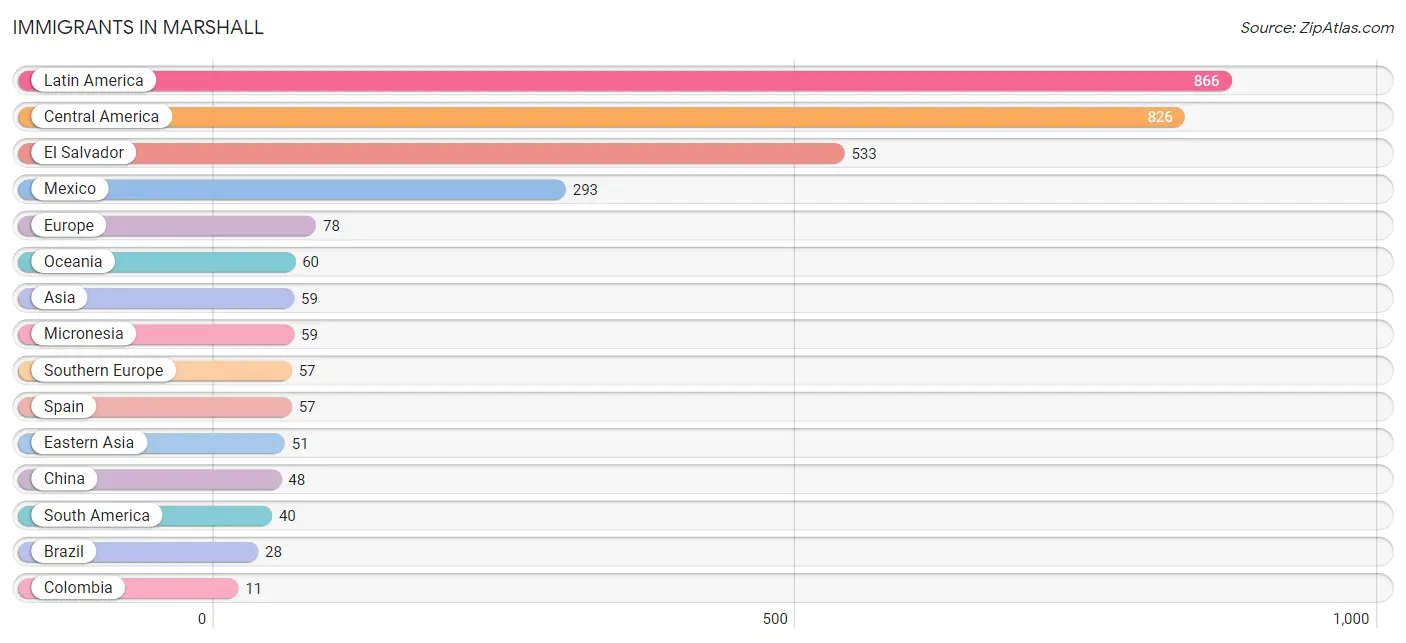
Immigrants in Marshall
The most numerous immigrant groups reported in Marshall came from Latin America (866 | 6.3%), Central America (826 | 6.0%), El Salvador (533 | 3.9%), Mexico (293 | 2.1%), and Europe (78 | 0.6%), together accounting for 19.0% of all Marshall residents.
| Immigration Origin | # Population | % Population |
| Africa | 6 | 0.0% |
| Argentina | 1 | 0.0% |
| Asia | 59 | 0.4% |
| Australia | 1 | 0.0% |
| Brazil | 28 | 0.2% |
| Central America | 826 | 6.0% |
| China | 48 | 0.4% |
| Colombia | 11 | 0.1% |
| Eastern Asia | 51 | 0.4% |
| Eastern Europe | 3 | 0.0% |
| El Salvador | 533 | 3.9% |
| England | 9 | 0.1% |
| Europe | 78 | 0.6% |
| Germany | 9 | 0.1% |
| Japan | 3 | 0.0% |
| Latin America | 866 | 6.3% |
| Mexico | 293 | 2.1% |
| Micronesia | 59 | 0.4% |
| Northern Europe | 9 | 0.1% |
| Oceania | 60 | 0.4% |
| Philippines | 1 | 0.0% |
| Russia | 3 | 0.0% |
| South Africa | 6 | 0.0% |
| South America | 40 | 0.3% |
| South Eastern Asia | 8 | 0.1% |
| Southern Europe | 57 | 0.4% |
| Spain | 57 | 0.4% |
| Vietnam | 7 | 0.1% |
| Western Europe | 9 | 0.1% | View All 29 Rows |
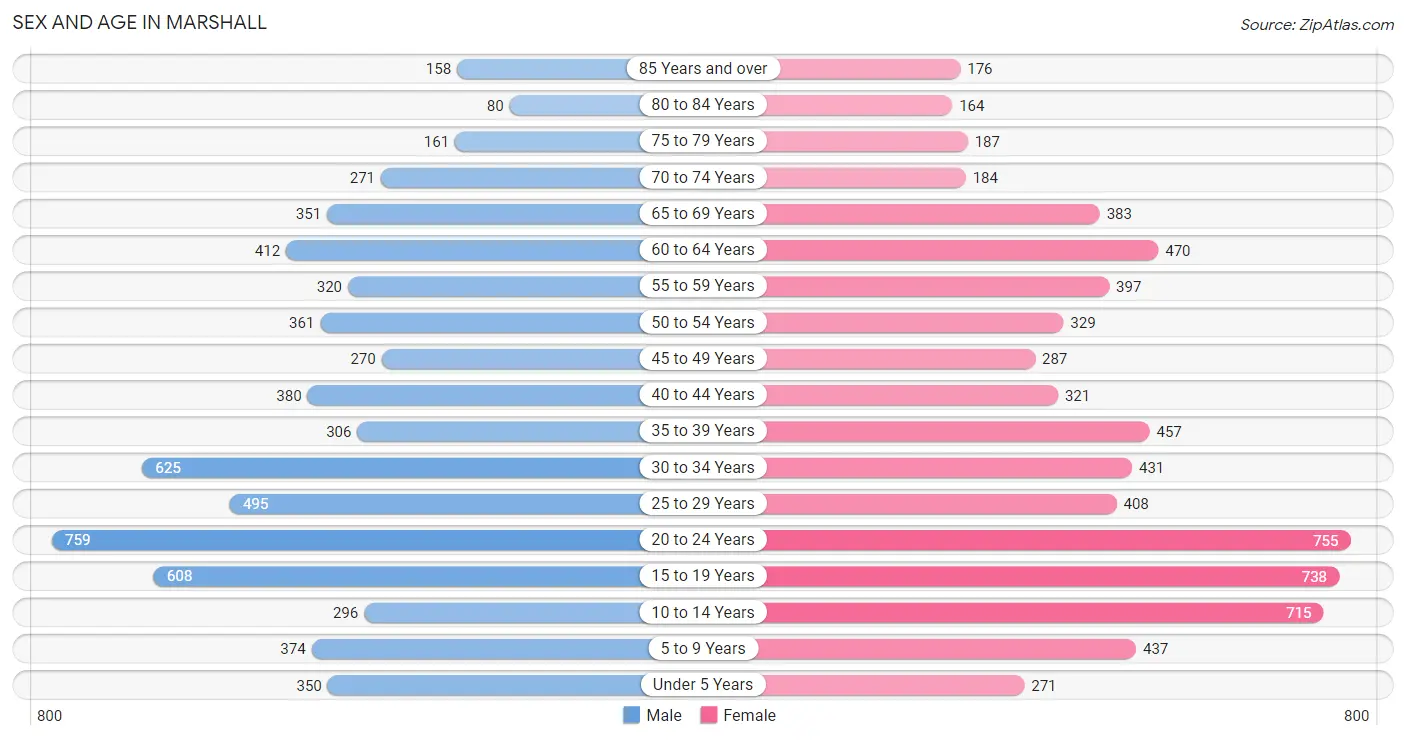
Sex and Age in Marshall
Sex and Age in Marshall
The most populous age groups in Marshall are 20 to 24 Years (759 | 11.5%) for men and 20 to 24 Years (755 | 10.6%) for women.
| Age Bracket | Male | Female |
| Under 5 Years | 350 (5.3%) | 271 (3.8%) |
| 5 to 9 Years | 374 (5.7%) | 437 (6.1%) |
| 10 to 14 Years | 296 (4.5%) | 715 (10.1%) |
| 15 to 19 Years | 608 (9.2%) | 738 (10.4%) |
| 20 to 24 Years | 759 (11.5%) | 755 (10.6%) |
| 25 to 29 Years | 495 (7.5%) | 408 (5.7%) |
| 30 to 34 Years | 625 (9.5%) | 431 (6.1%) |
| 35 to 39 Years | 306 (4.6%) | 457 (6.4%) |
| 40 to 44 Years | 380 (5.8%) | 321 (4.5%) |
| 45 to 49 Years | 270 (4.1%) | 287 (4.0%) |
| 50 to 54 Years | 361 (5.5%) | 329 (4.6%) |
| 55 to 59 Years | 320 (4.9%) | 397 (5.6%) |
| 60 to 64 Years | 412 (6.3%) | 470 (6.6%) |
| 65 to 69 Years | 351 (5.3%) | 383 (5.4%) |
| 70 to 74 Years | 271 (4.1%) | 184 (2.6%) |
| 75 to 79 Years | 161 (2.5%) | 187 (2.6%) |
| 80 to 84 Years | 80 (1.2%) | 164 (2.3%) |
| 85 Years and over | 158 (2.4%) | 176 (2.5%) |
| Total | 6,577 (100.0%) | 7,110 (100.0%) |
Families and Households in Marshall
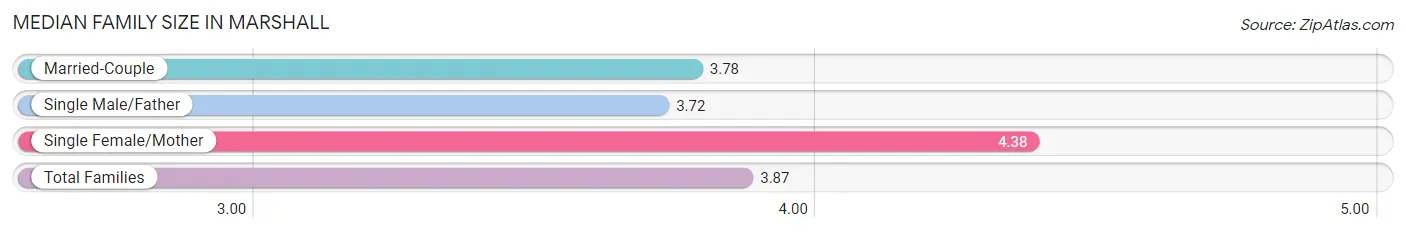
Median Family Size in Marshall
The median family size in Marshall is 3.87 persons per family, with single female/mother families (416 | 16.5%) accounting for the largest median family size of 4.38 persons per family. On the other hand, single male/father families (243 | 9.6%) represent the smallest median family size with 3.72 persons per family.
| Family Type | # Families | Family Size |
| Married-Couple | 1,864 (73.9%) | 3.78 |
| Single Male/Father | 243 (9.6%) | 3.72 |
| Single Female/Mother | 416 (16.5%) | 4.38 |
| Total Families | 2,523 (100.0%) | 3.87 |
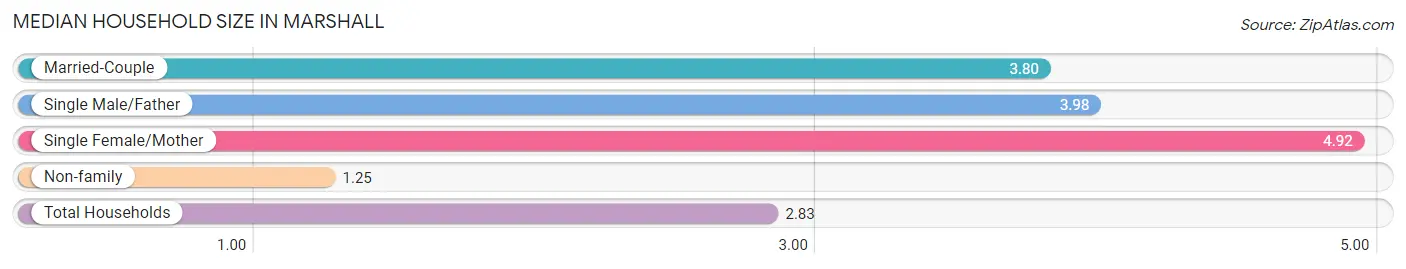
Median Household Size in Marshall
The median household size in Marshall is 2.83 persons per household, with single female/mother households (416 | 9.5%) accounting for the largest median household size of 4.92 persons per household. non-family households (1,853 | 42.3%) represent the smallest median household size with 1.25 persons per household.
| Household Type | # Households | Household Size |
| Married-Couple | 1,864 (42.6%) | 3.80 |
| Single Male/Father | 243 (5.6%) | 3.98 |
| Single Female/Mother | 416 (9.5%) | 4.92 |
| Non-family | 1,853 (42.3%) | 1.25 |
| Total Households | 4,376 (100.0%) | 2.83 |
Household Size by Marriage Status in Marshall
Out of a total of 4,376 households in Marshall, 2,523 (57.7%) are family households, while 1,853 (42.3%) are nonfamily households. The most numerous type of family households are 2-person households, comprising 1,155, and the most common type of nonfamily households are 1-person households, comprising 1,604.
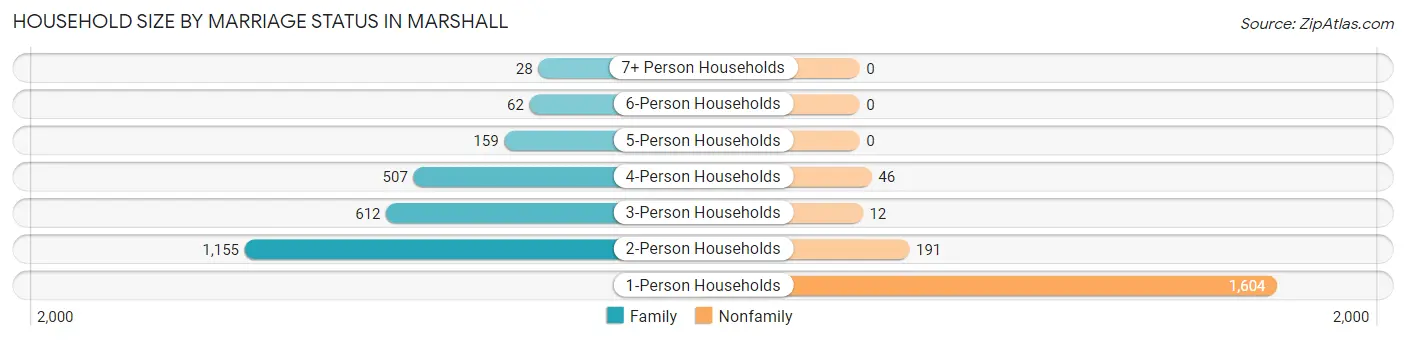
| Household Size | Family Households | Nonfamily Households |
| 1-Person Households | - | 1,604 (36.6%) |
| 2-Person Households | 1,155 (26.4%) | 191 (4.4%) |
| 3-Person Households | 612 (14.0%) | 12 (0.3%) |
| 4-Person Households | 507 (11.6%) | 46 (1.1%) |
| 5-Person Households | 159 (3.6%) | 0 (0.0%) |
| 6-Person Households | 62 (1.4%) | 0 (0.0%) |
| 7+ Person Households | 28 (0.6%) | 0 (0.0%) |
| Total | 2,523 (57.7%) | 1,853 (42.3%) |
Female Fertility in Marshall
Fertility by Age in Marshall
Average fertility rate in Marshall is 39.0 births per 1,000 women. Women in the age bracket of 20 to 34 years have the highest fertility rate with 70.0 births per 1,000 women. Women in the age bracket of 20 to 34 years acount for 83.0% of all women with births.
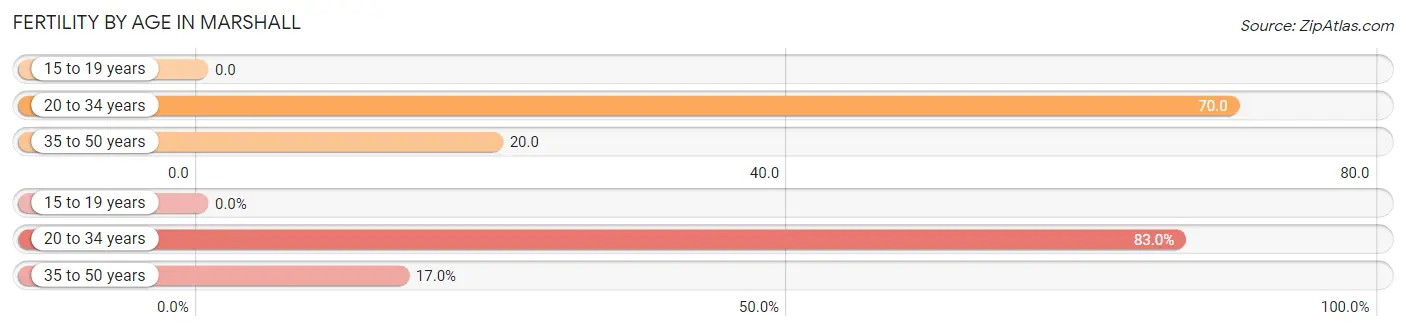
| Age Bracket | Women with Births | Births / 1,000 Women |
| 15 to 19 years | 0 (0.0%) | 0.0 |
| 20 to 34 years | 112 (83.0%) | 70.0 |
| 35 to 50 years | 23 (17.0%) | 20.0 |
| Total | 135 (100.0%) | 39.0 |
Fertility by Age by Marriage Status in Marshall
25.2% of women with births (135) in Marshall are married. The highest percentage of unmarried women with births falls into 35 to 50 years age bracket with 100.0% of them unmarried at the time of birth, while the lowest percentage of unmarried women with births belong to 20 to 34 years age bracket with 69.6% of them unmarried.
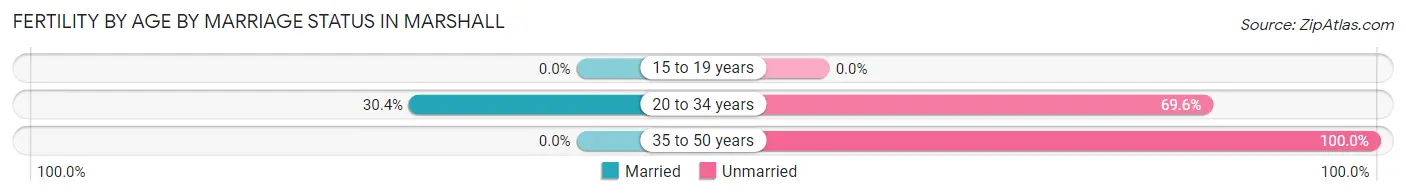
| Age Bracket | Married | Unmarried |
| 15 to 19 years | 0 (0.0%) | 0 (0.0%) |
| 20 to 34 years | 34 (30.4%) | 78 (69.6%) |
| 35 to 50 years | 0 (0.0%) | 23 (100.0%) |
| Total | 34 (25.2%) | 101 (74.8%) |
Fertility by Education in Marshall
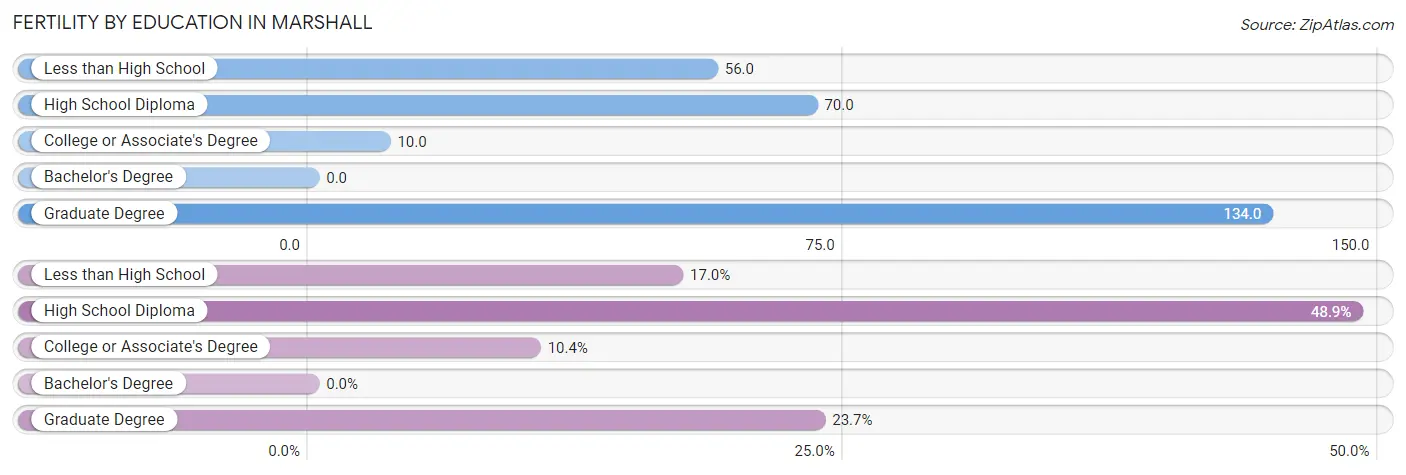
| Educational Attainment | Women with Births | Births / 1,000 Women |
| Less than High School | 23 (17.0%) | 56.0 |
| High School Diploma | 66 (48.9%) | 70.0 |
| College or Associate's Degree | 14 (10.4%) | 10.0 |
| Bachelor's Degree | 0 (0.0%) | 0.0 |
| Graduate Degree | 32 (23.7%) | 134.0 |
| Total | 135 (100.0%) | 39.0 |
Fertility by Education by Marriage Status in Marshall
74.8% of women with births in Marshall are unmarried. Women with the educational attainment of college or associate's degree are most likely to be married with 100.0% of them married at childbirth, while women with the educational attainment of less than high school are least likely to be married with 100.0% of them unmarried at childbirth.
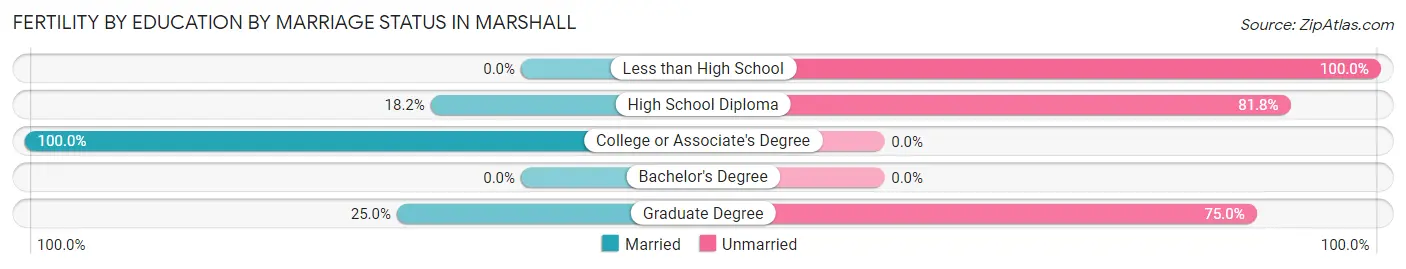
| Educational Attainment | Married | Unmarried |
| Less than High School | 0 (0.0%) | 23 (100.0%) |
| High School Diploma | 12 (18.2%) | 54 (81.8%) |
| College or Associate's Degree | 14 (100.0%) | 0 (0.0%) |
| Bachelor's Degree | 0 (0.0%) | 0 (0.0%) |
| Graduate Degree | 8 (25.0%) | 24 (75.0%) |
| Total | 34 (25.2%) | 101 (74.8%) |
Employment Characteristics in Marshall
Employment by Class of Employer in Marshall
Among the 6,208 employed individuals in Marshall, private company employees (3,887 | 62.6%), not-for-profit organizations (701 | 11.3%), and state government employees (625 | 10.1%) make up the most common classes of employment.
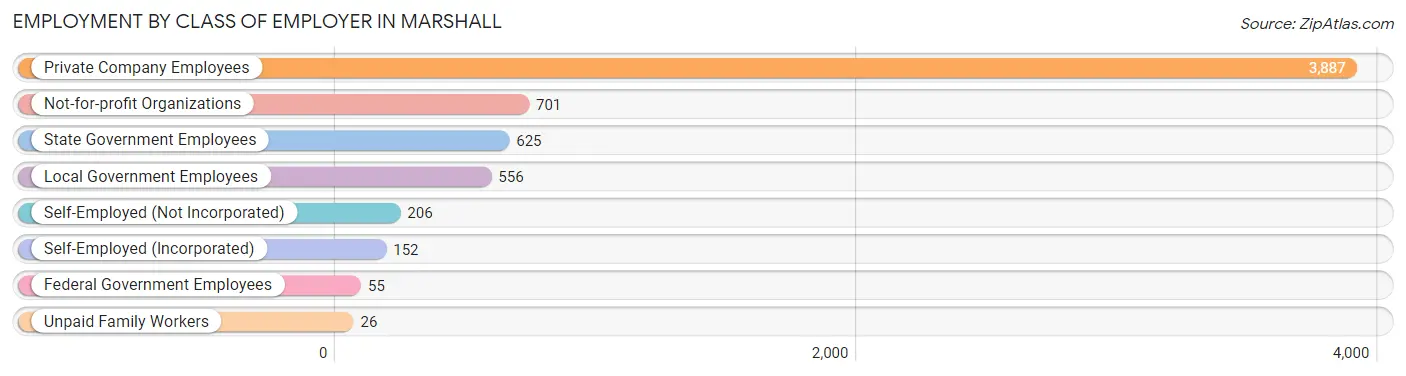
| Employer Class | # Employees | % Employees |
| Private Company Employees | 3,887 | 62.6% |
| Self-Employed (Incorporated) | 152 | 2.5% |
| Self-Employed (Not Incorporated) | 206 | 3.3% |
| Not-for-profit Organizations | 701 | 11.3% |
| Local Government Employees | 556 | 9.0% |
| State Government Employees | 625 | 10.1% |
| Federal Government Employees | 55 | 0.9% |
| Unpaid Family Workers | 26 | 0.4% |
| Total | 6,208 | 100.0% |
Employment Status by Age in Marshall
According to the labor force statistics for Marshall, out of the total population over 16 years of age (11,104), 58.6% or 6,507 individuals are in the labor force, with 2.8% or 182 of them unemployed. The age group with the highest labor force participation rate is 30 to 34 years, with 87.5% or 924 individuals in the labor force. Within the labor force, the 45 to 54 years age range has the highest percentage of unemployed individuals, with 7.1% or 71 of them being unemployed.
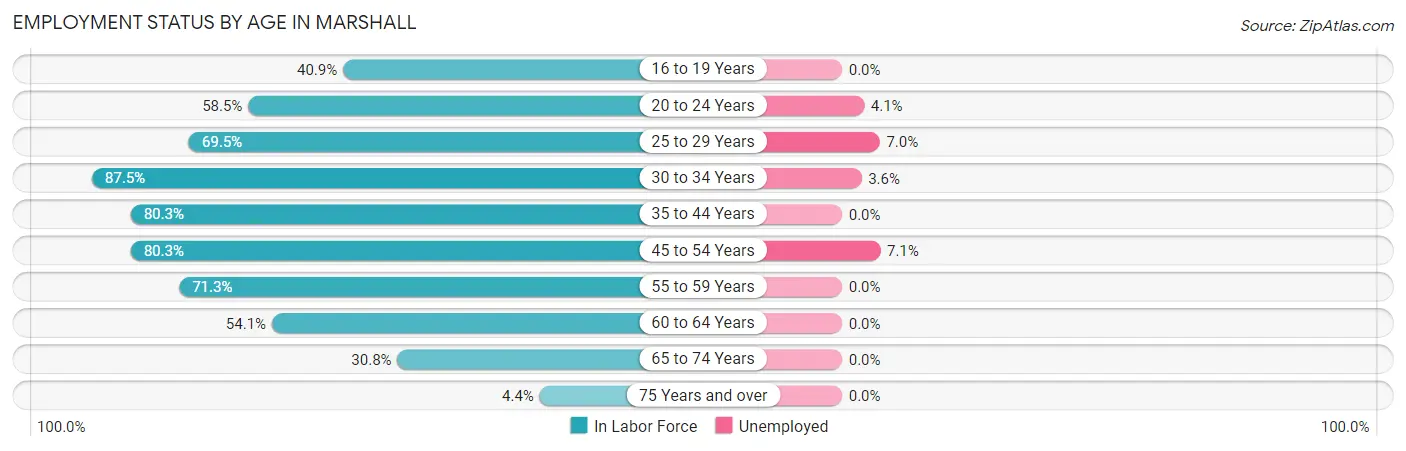
| Age Bracket | In Labor Force | Unemployed |
| 16 to 19 Years | 493 (40.9%) | 0 (0.0%) |
| 20 to 24 Years | 886 (58.5%) | 36 (4.1%) |
| 25 to 29 Years | 628 (69.5%) | 44 (7.0%) |
| 30 to 34 Years | 924 (87.5%) | 33 (3.6%) |
| 35 to 44 Years | 1,176 (80.3%) | 0 (0.0%) |
| 45 to 54 Years | 1,001 (80.3%) | 71 (7.1%) |
| 55 to 59 Years | 511 (71.3%) | 0 (0.0%) |
| 60 to 64 Years | 477 (54.1%) | 0 (0.0%) |
| 65 to 74 Years | 366 (30.8%) | 0 (0.0%) |
| 75 Years and over | 41 (4.4%) | 0 (0.0%) |
| Total | 6,507 (58.6%) | 182 (2.8%) |
Employment Status by Educational Attainment in Marshall
According to labor force statistics for Marshall, 75.2% of individuals (4,714) out of the total population between 25 and 64 years of age (6,269) are in the labor force, with 3.1% or 146 of them being unemployed. The group with the highest labor force participation rate are those with the educational attainment of bachelor's degree or higher, with 91.0% or 1,715 individuals in the labor force. Within the labor force, individuals with less than high school education have the highest percentage of unemployment, with 14.2% or 92 of them being unemployed.
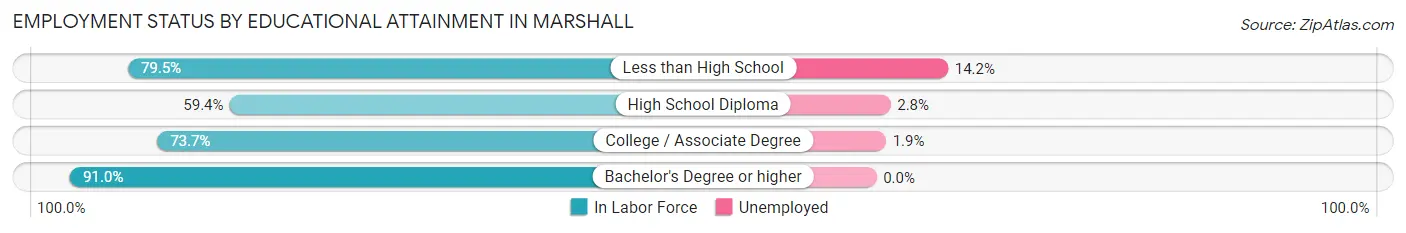
| Educational Attainment | In Labor Force | Unemployed |
| Less than High School | 650 (79.5%) | 116 (14.2%) |
| High School Diploma | 1,157 (59.4%) | 55 (2.8%) |
| College / Associate Degree | 1,192 (73.7%) | 31 (1.9%) |
| Bachelor's Degree or higher | 1,715 (91.0%) | 0 (0.0%) |
| Total | 4,714 (75.2%) | 194 (3.1%) |
Employment Occupations by Sex in Marshall
Management, Business, Science and Arts Occupations
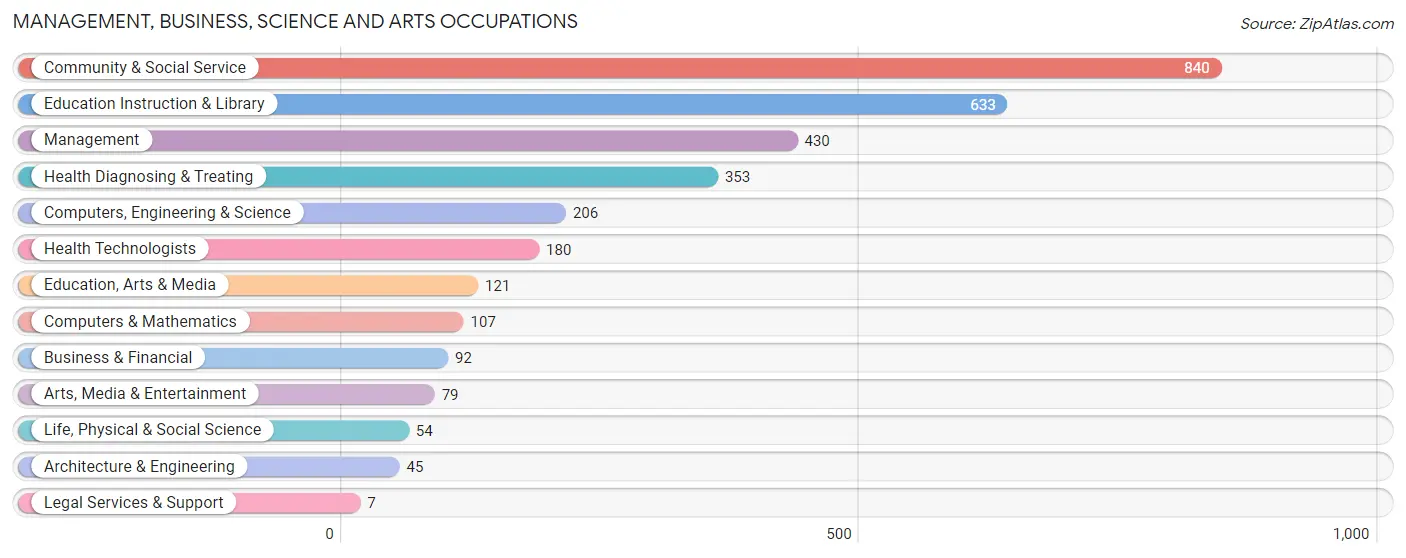
The most common Management, Business, Science and Arts occupations in Marshall are Community & Social Service (840 | 13.3%), Education Instruction & Library (633 | 10.0%), Management (430 | 6.8%), Health Diagnosing & Treating (353 | 5.6%), and Computers, Engineering & Science (206 | 3.3%).
Management, Business, Science and Arts Occupations by Sex
Within the Management, Business, Science and Arts occupations in Marshall, the most male-oriented occupations are Computers & Mathematics (100.0%), Architecture & Engineering (100.0%), and Computers, Engineering & Science (95.6%), while the most female-oriented occupations are Legal Services & Support (100.0%), Health Diagnosing & Treating (81.0%), and Education Instruction & Library (73.1%).
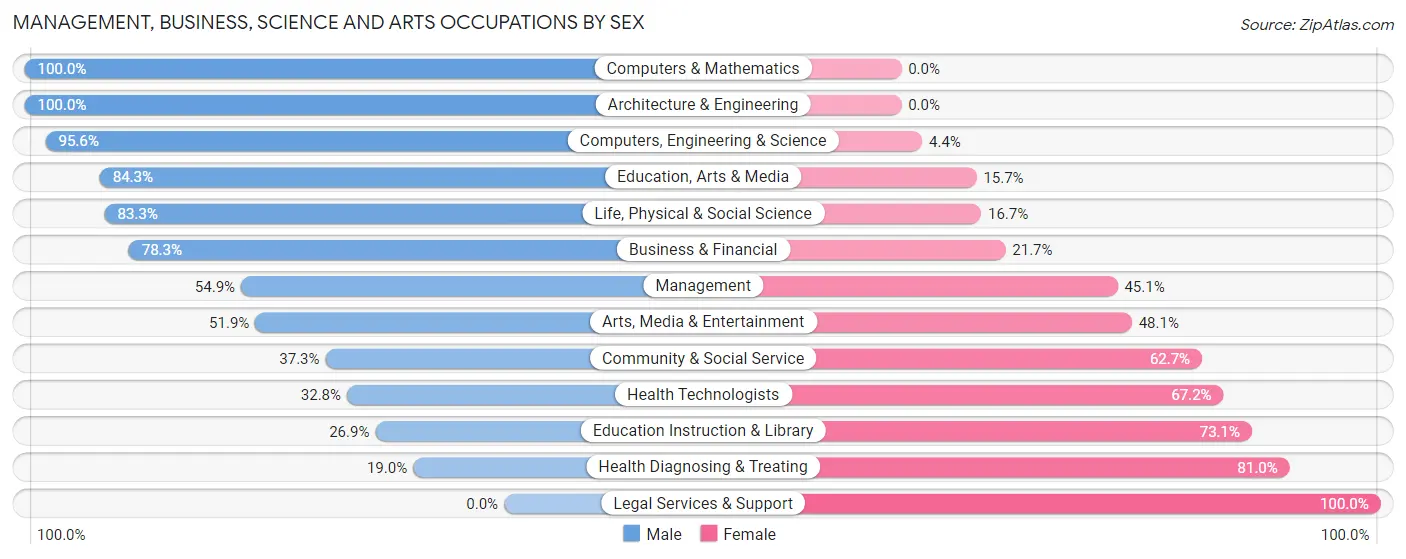
| Occupation | Male | Female |
| Management | 236 (54.9%) | 194 (45.1%) |
| Business & Financial | 72 (78.3%) | 20 (21.7%) |
| Computers, Engineering & Science | 197 (95.6%) | 9 (4.4%) |
| Computers & Mathematics | 107 (100.0%) | 0 (0.0%) |
| Architecture & Engineering | 45 (100.0%) | 0 (0.0%) |
| Life, Physical & Social Science | 45 (83.3%) | 9 (16.7%) |
| Community & Social Service | 313 (37.3%) | 527 (62.7%) |
| Education, Arts & Media | 102 (84.3%) | 19 (15.7%) |
| Legal Services & Support | 0 (0.0%) | 7 (100.0%) |
| Education Instruction & Library | 170 (26.9%) | 463 (73.1%) |
| Arts, Media & Entertainment | 41 (51.9%) | 38 (48.1%) |
| Health Diagnosing & Treating | 67 (19.0%) | 286 (81.0%) |
| Health Technologists | 59 (32.8%) | 121 (67.2%) |
| Total (Category) | 885 (46.1%) | 1,036 (53.9%) |
| Total (Overall) | 3,143 (49.7%) | 3,175 (50.2%) |
Services Occupations
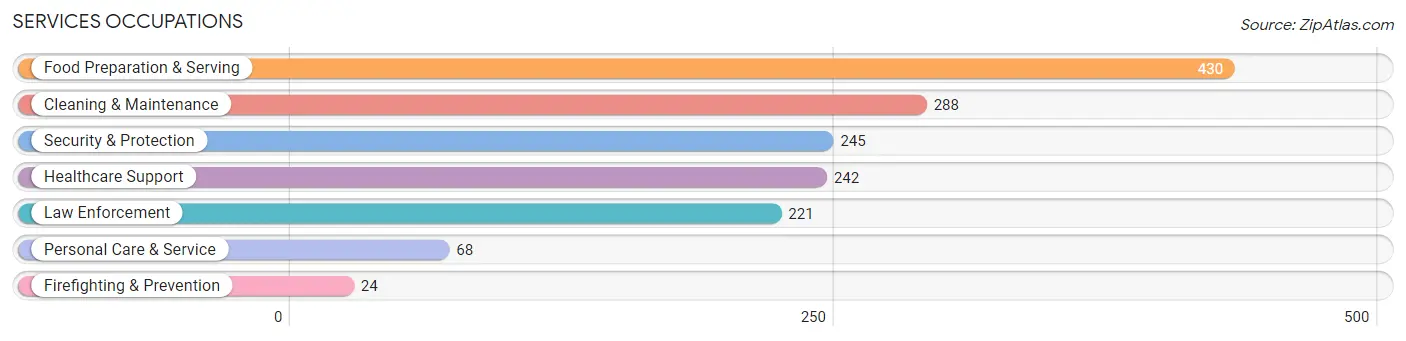
The most common Services occupations in Marshall are Food Preparation & Serving (430 | 6.8%), Cleaning & Maintenance (288 | 4.6%), Security & Protection (245 | 3.9%), Healthcare Support (242 | 3.8%), and Law Enforcement (221 | 3.5%).
Services Occupations by Sex
Within the Services occupations in Marshall, the most male-oriented occupations are Law Enforcement (96.8%), Security & Protection (91.0%), and Cleaning & Maintenance (73.3%), while the most female-oriented occupations are Personal Care & Service (97.1%), Healthcare Support (89.3%), and Firefighting & Prevention (62.5%).
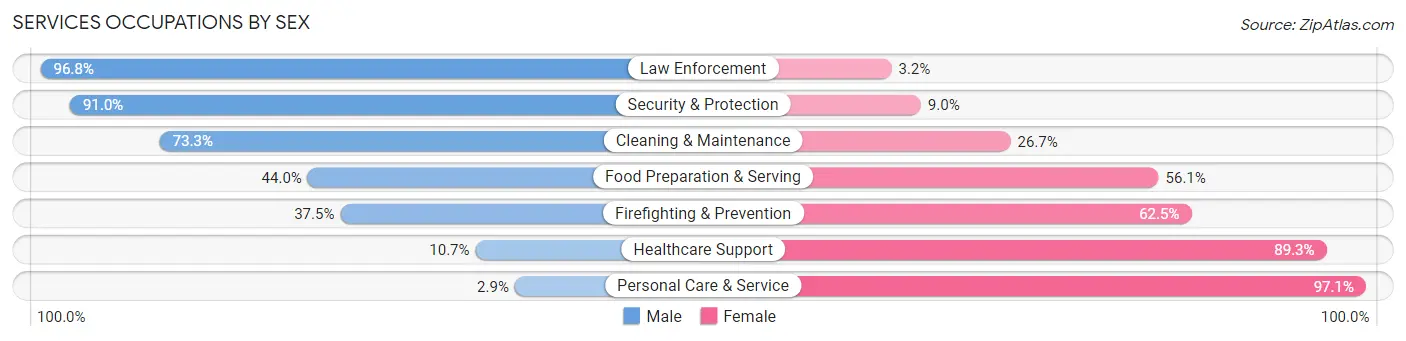
| Occupation | Male | Female |
| Healthcare Support | 26 (10.7%) | 216 (89.3%) |
| Security & Protection | 223 (91.0%) | 22 (9.0%) |
| Firefighting & Prevention | 9 (37.5%) | 15 (62.5%) |
| Law Enforcement | 214 (96.8%) | 7 (3.2%) |
| Food Preparation & Serving | 189 (44.0%) | 241 (56.0%) |
| Cleaning & Maintenance | 211 (73.3%) | 77 (26.7%) |
| Personal Care & Service | 2 (2.9%) | 66 (97.1%) |
| Total (Category) | 651 (51.1%) | 622 (48.9%) |
| Total (Overall) | 3,143 (49.7%) | 3,175 (50.2%) |
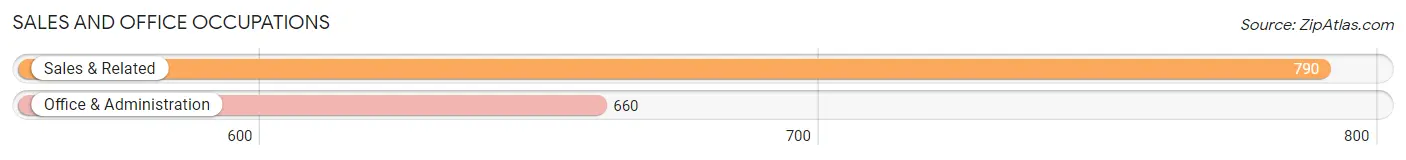
Sales and Office Occupations
The most common Sales and Office occupations in Marshall are Sales & Related (790 | 12.5%), and Office & Administration (660 | 10.4%).
Sales and Office Occupations by Sex
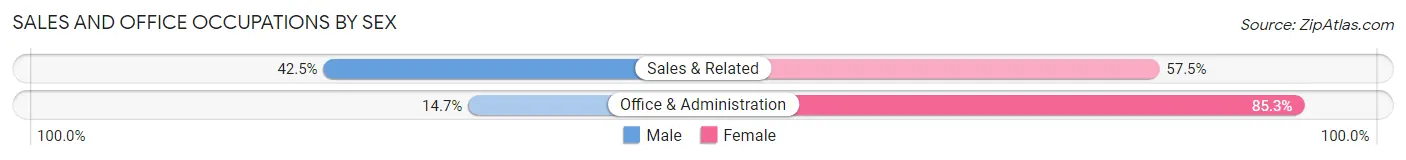
| Occupation | Male | Female |
| Sales & Related | 336 (42.5%) | 454 (57.5%) |
| Office & Administration | 97 (14.7%) | 563 (85.3%) |
| Total (Category) | 433 (29.9%) | 1,017 (70.1%) |
| Total (Overall) | 3,143 (49.7%) | 3,175 (50.2%) |
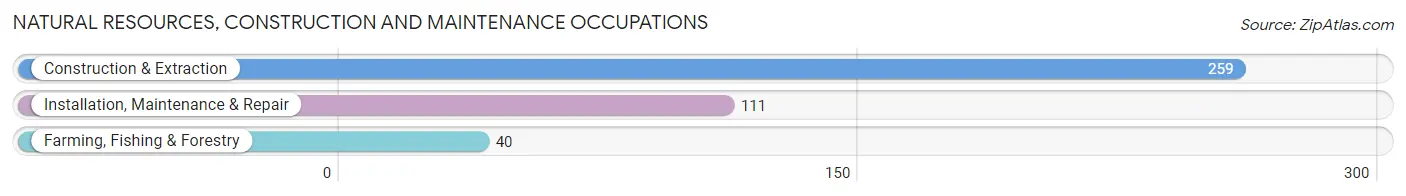
Natural Resources, Construction and Maintenance Occupations
The most common Natural Resources, Construction and Maintenance occupations in Marshall are Construction & Extraction (259 | 4.1%), Installation, Maintenance & Repair (111 | 1.8%), and Farming, Fishing & Forestry (40 | 0.6%).
Natural Resources, Construction and Maintenance Occupations by Sex
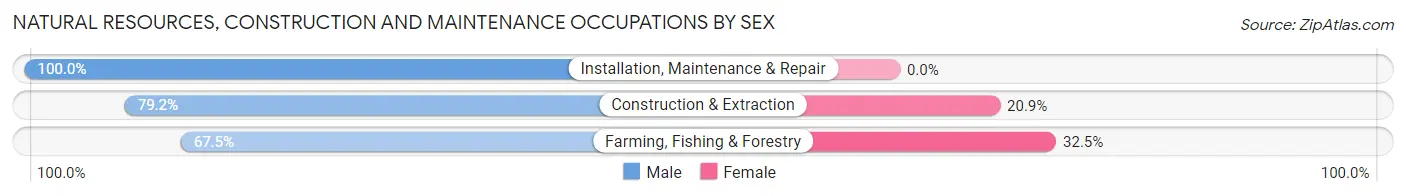
| Occupation | Male | Female |
| Farming, Fishing & Forestry | 27 (67.5%) | 13 (32.5%) |
| Construction & Extraction | 205 (79.1%) | 54 (20.8%) |
| Installation, Maintenance & Repair | 111 (100.0%) | 0 (0.0%) |
| Total (Category) | 343 (83.7%) | 67 (16.3%) |
| Total (Overall) | 3,143 (49.7%) | 3,175 (50.2%) |
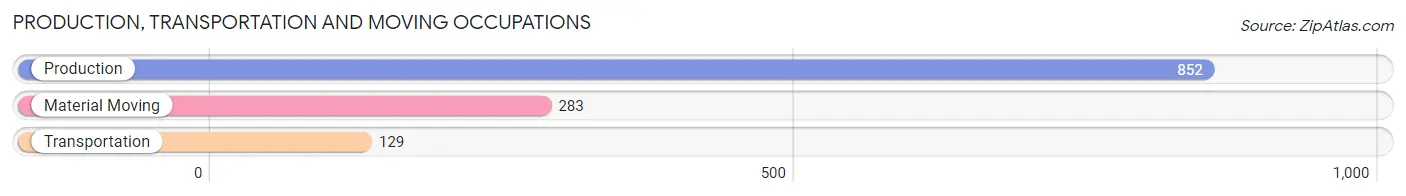
Production, Transportation and Moving Occupations
The most common Production, Transportation and Moving occupations in Marshall are Production (852 | 13.5%), Material Moving (283 | 4.5%), and Transportation (129 | 2.0%).
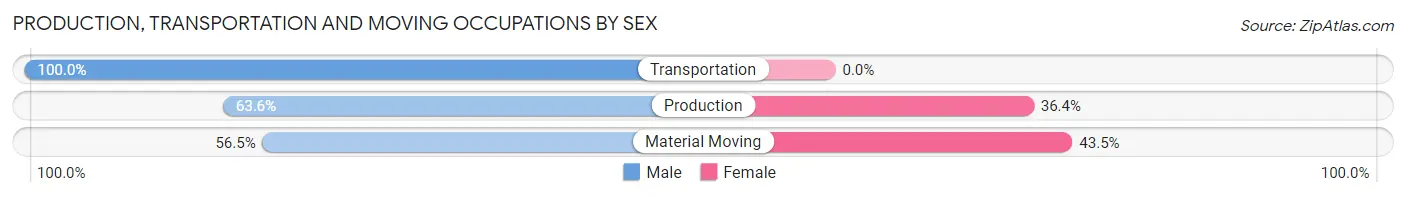
Production, Transportation and Moving Occupations by Sex
| Occupation | Male | Female |
| Production | 542 (63.6%) | 310 (36.4%) |
| Transportation | 129 (100.0%) | 0 (0.0%) |
| Material Moving | 160 (56.5%) | 123 (43.5%) |
| Total (Category) | 831 (65.7%) | 433 (34.3%) |
| Total (Overall) | 3,143 (49.7%) | 3,175 (50.2%) |
Employment Industries by Sex in Marshall
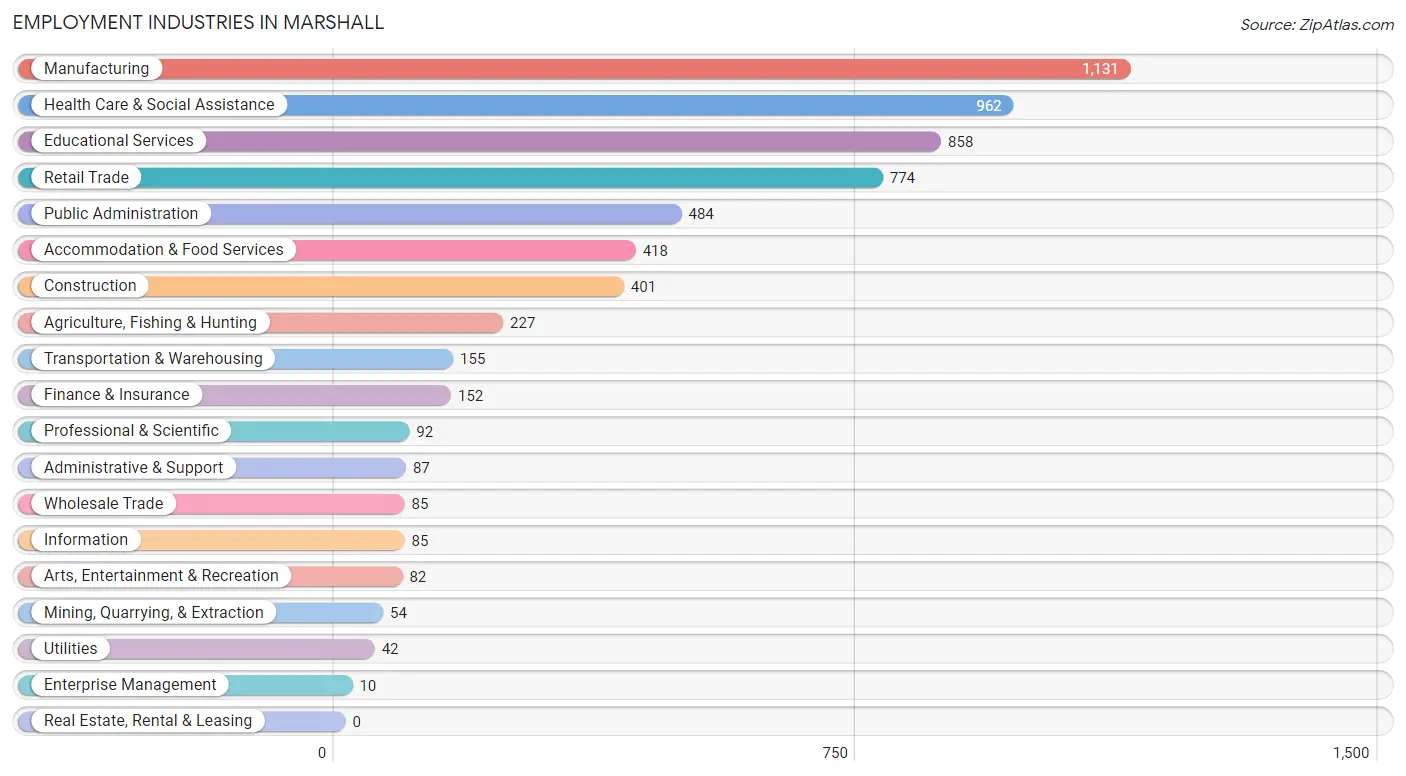
Employment Industries in Marshall
The major employment industries in Marshall include Manufacturing (1,131 | 17.9%), Health Care & Social Assistance (962 | 15.2%), Educational Services (858 | 13.6%), Retail Trade (774 | 12.2%), and Public Administration (484 | 7.7%).
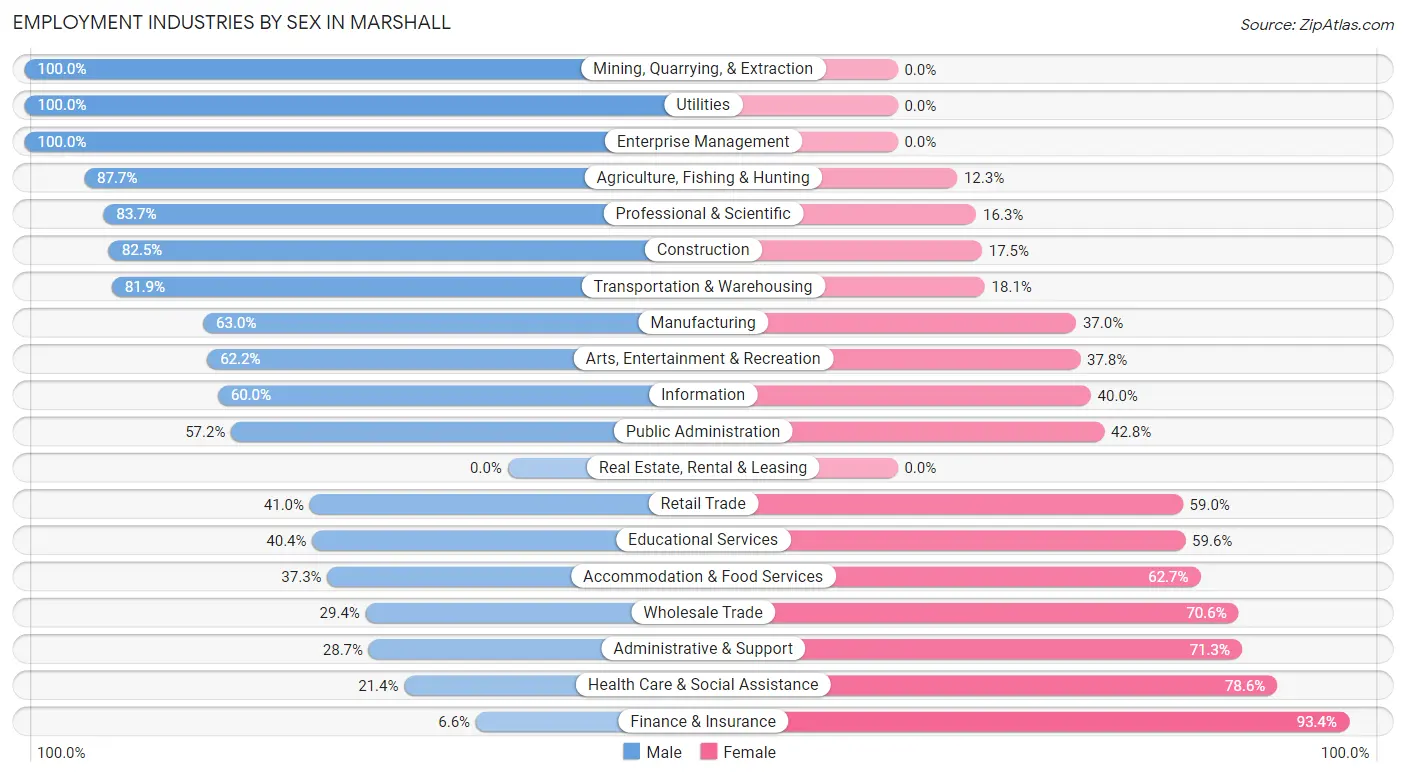
Employment Industries by Sex in Marshall
The Marshall industries that see more men than women are Mining, Quarrying, & Extraction (100.0%), Utilities (100.0%), and Enterprise Management (100.0%), whereas the industries that tend to have a higher number of women are Finance & Insurance (93.4%), Health Care & Social Assistance (78.6%), and Administrative & Support (71.3%).
| Industry | Male | Female |
| Agriculture, Fishing & Hunting | 199 (87.7%) | 28 (12.3%) |
| Mining, Quarrying, & Extraction | 54 (100.0%) | 0 (0.0%) |
| Construction | 331 (82.5%) | 70 (17.5%) |
| Manufacturing | 713 (63.0%) | 418 (37.0%) |
| Wholesale Trade | 25 (29.4%) | 60 (70.6%) |
| Retail Trade | 317 (41.0%) | 457 (59.0%) |
| Transportation & Warehousing | 127 (81.9%) | 28 (18.1%) |
| Utilities | 42 (100.0%) | 0 (0.0%) |
| Information | 51 (60.0%) | 34 (40.0%) |
| Finance & Insurance | 10 (6.6%) | 142 (93.4%) |
| Real Estate, Rental & Leasing | 0 (0.0%) | 0 (0.0%) |
| Professional & Scientific | 77 (83.7%) | 15 (16.3%) |
| Enterprise Management | 10 (100.0%) | 0 (0.0%) |
| Administrative & Support | 25 (28.7%) | 62 (71.3%) |
| Educational Services | 347 (40.4%) | 511 (59.6%) |
| Health Care & Social Assistance | 206 (21.4%) | 756 (78.6%) |
| Arts, Entertainment & Recreation | 51 (62.2%) | 31 (37.8%) |
| Accommodation & Food Services | 156 (37.3%) | 262 (62.7%) |
| Public Administration | 277 (57.2%) | 207 (42.8%) |
| Total | 3,143 (49.7%) | 3,175 (50.2%) |
Education in Marshall
School Enrollment in Marshall
The most common levels of schooling among the 4,375 students in Marshall are college / undergraduate (2,032 | 46.5%), middle school (705 | 16.1%), and elementary school (599 | 13.7%).
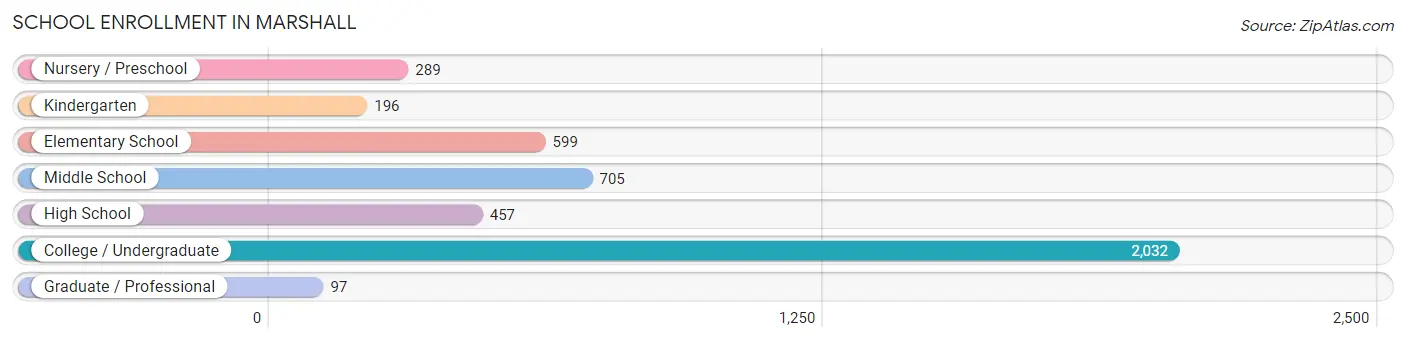
| School Level | # Students | % Students |
| Nursery / Preschool | 289 | 6.6% |
| Kindergarten | 196 | 4.5% |
| Elementary School | 599 | 13.7% |
| Middle School | 705 | 16.1% |
| High School | 457 | 10.4% |
| College / Undergraduate | 2,032 | 46.5% |
| Graduate / Professional | 97 | 2.2% |
| Total | 4,375 | 100.0% |
School Enrollment by Age by Funding Source in Marshall
Out of a total of 4,375 students who are enrolled in schools in Marshall, 1,273 (29.1%) attend a private institution, while the remaining 3,102 (70.9%) are enrolled in public schools. The age group of 18 to 19 year olds has the highest likelihood of being enrolled in private schools, with 522 (70.5% in the age bracket) enrolled. Conversely, the age group of 35 years and over has the lowest likelihood of being enrolled in a private school, with 31 (100.0% in the age bracket) attending a public institution.
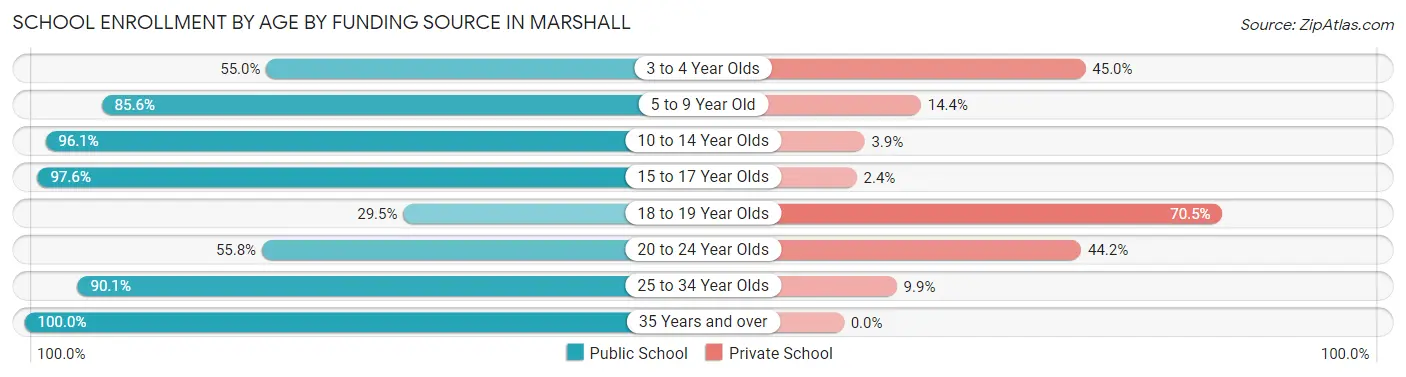
| Age Bracket | Public School | Private School |
| 3 to 4 Year Olds | 127 (55.0%) | 104 (45.0%) |
| 5 to 9 Year Old | 662 (85.6%) | 111 (14.4%) |
| 10 to 14 Year Olds | 795 (96.1%) | 32 (3.9%) |
| 15 to 17 Year Olds | 405 (97.6%) | 10 (2.4%) |
| 18 to 19 Year Olds | 218 (29.5%) | 522 (70.5%) |
| 20 to 24 Year Olds | 588 (55.8%) | 466 (44.2%) |
| 25 to 34 Year Olds | 274 (90.1%) | 30 (9.9%) |
| 35 Years and over | 31 (100.0%) | 0 (0.0%) |
| Total | 3,102 (70.9%) | 1,273 (29.1%) |
Educational Attainment by Field of Study in Marshall
Education (561 | 20.6%), business (533 | 19.5%), arts & humanities (292 | 10.7%), bio, nature & agricultural (205 | 7.5%), and literature & languages (172 | 6.3%) are the most common fields of study among 2,728 individuals in Marshall who have obtained a bachelor's degree or higher.
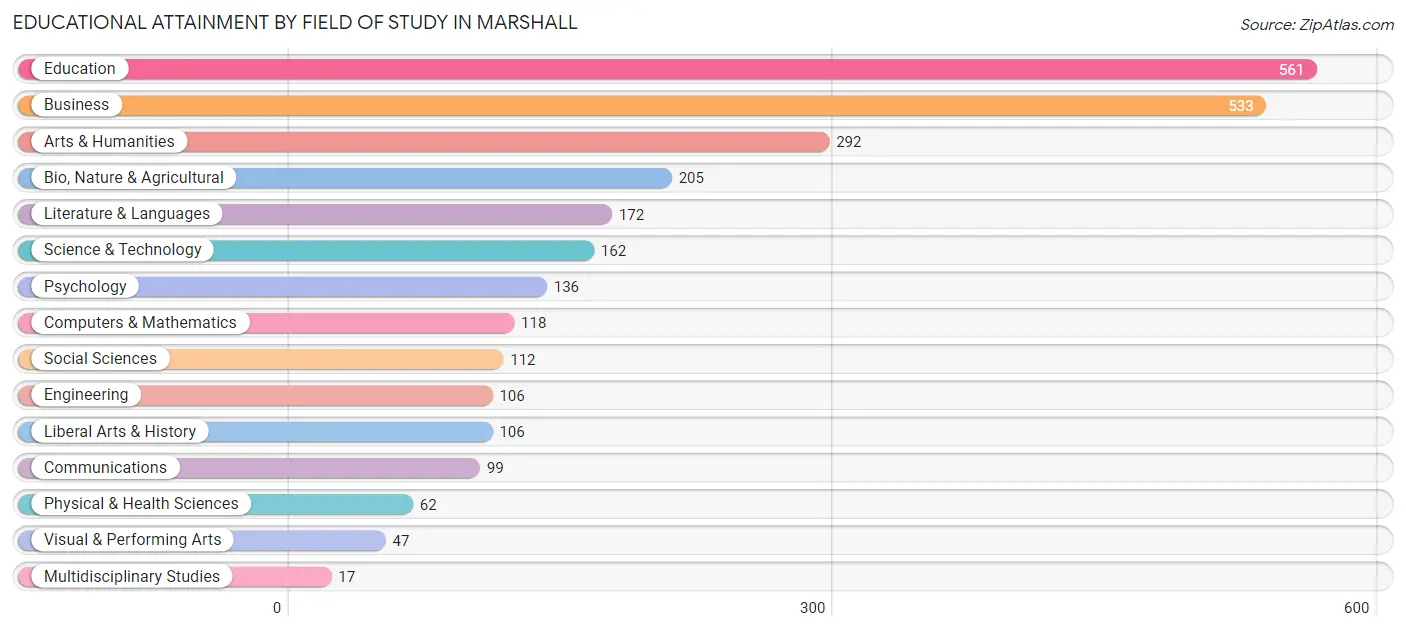
| Field of Study | # Graduates | % Graduates |
| Computers & Mathematics | 118 | 4.3% |
| Bio, Nature & Agricultural | 205 | 7.5% |
| Physical & Health Sciences | 62 | 2.3% |
| Psychology | 136 | 5.0% |
| Social Sciences | 112 | 4.1% |
| Engineering | 106 | 3.9% |
| Multidisciplinary Studies | 17 | 0.6% |
| Science & Technology | 162 | 5.9% |
| Business | 533 | 19.5% |
| Education | 561 | 20.6% |
| Literature & Languages | 172 | 6.3% |
| Liberal Arts & History | 106 | 3.9% |
| Visual & Performing Arts | 47 | 1.7% |
| Communications | 99 | 3.6% |
| Arts & Humanities | 292 | 10.7% |
| Total | 2,728 | 100.0% |
Transportation & Commute in Marshall
Vehicle Availability by Sex in Marshall
The most prevalent vehicle ownership categories in Marshall are males with 2 vehicles (1,266, accounting for 41.2%) and females with 2 vehicles (1,049, making up 43.7%).
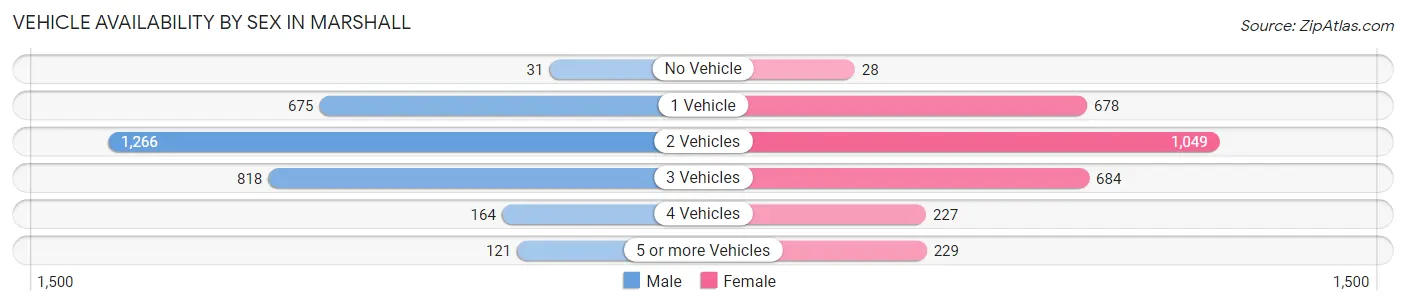
| Vehicles Available | Male | Female |
| No Vehicle | 31 (1.0%) | 28 (1.0%) |
| 1 Vehicle | 675 (22.0%) | 678 (23.4%) |
| 2 Vehicles | 1,266 (41.2%) | 1,049 (36.2%) |
| 3 Vehicles | 818 (26.6%) | 684 (23.6%) |
| 4 Vehicles | 164 (5.3%) | 227 (7.8%) |
| 5 or more Vehicles | 121 (3.9%) | 229 (7.9%) |
| Total | 3,075 (100.0%) | 2,895 (100.0%) |
Commute Time in Marshall
The most frequently occuring commute durations in Marshall are 5 to 9 minutes (2,217 commuters, 38.2%), 10 to 14 minutes (1,096 commuters, 18.9%), and less than 5 minutes (814 commuters, 14.0%).
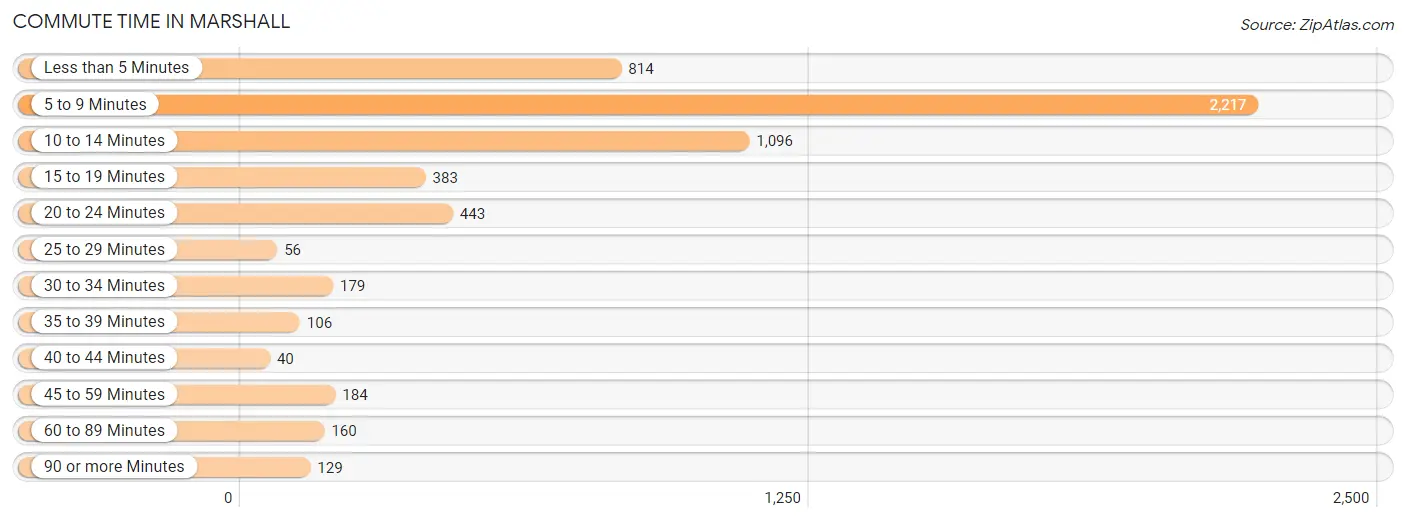
| Commute Time | # Commuters | % Commuters |
| Less than 5 Minutes | 814 | 14.0% |
| 5 to 9 Minutes | 2,217 | 38.2% |
| 10 to 14 Minutes | 1,096 | 18.9% |
| 15 to 19 Minutes | 383 | 6.6% |
| 20 to 24 Minutes | 443 | 7.6% |
| 25 to 29 Minutes | 56 | 1.0% |
| 30 to 34 Minutes | 179 | 3.1% |
| 35 to 39 Minutes | 106 | 1.8% |
| 40 to 44 Minutes | 40 | 0.7% |
| 45 to 59 Minutes | 184 | 3.2% |
| 60 to 89 Minutes | 160 | 2.8% |
| 90 or more Minutes | 129 | 2.2% |
Commute Time by Sex in Marshall
The most common commute times in Marshall are 5 to 9 minutes (981 commuters, 33.9%) for males and 5 to 9 minutes (1,236 commuters, 42.4%) for females.
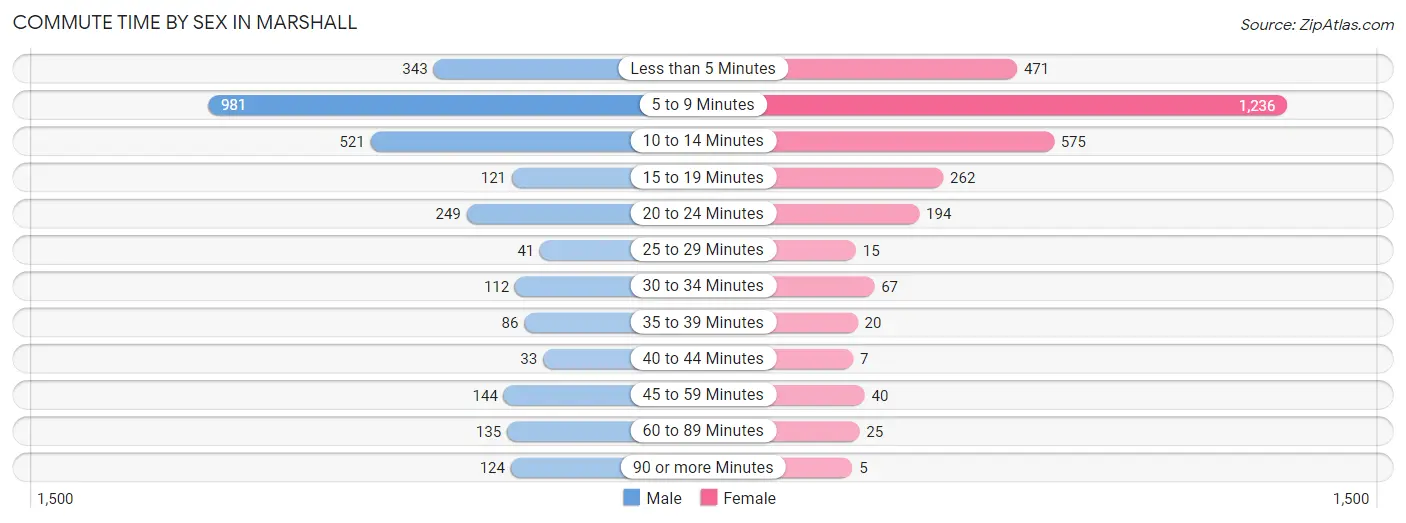
| Commute Time | Male | Female |
| Less than 5 Minutes | 343 (11.9%) | 471 (16.2%) |
| 5 to 9 Minutes | 981 (33.9%) | 1,236 (42.4%) |
| 10 to 14 Minutes | 521 (18.0%) | 575 (19.7%) |
| 15 to 19 Minutes | 121 (4.2%) | 262 (9.0%) |
| 20 to 24 Minutes | 249 (8.6%) | 194 (6.7%) |
| 25 to 29 Minutes | 41 (1.4%) | 15 (0.5%) |
| 30 to 34 Minutes | 112 (3.9%) | 67 (2.3%) |
| 35 to 39 Minutes | 86 (3.0%) | 20 (0.7%) |
| 40 to 44 Minutes | 33 (1.1%) | 7 (0.2%) |
| 45 to 59 Minutes | 144 (5.0%) | 40 (1.4%) |
| 60 to 89 Minutes | 135 (4.7%) | 25 (0.9%) |
| 90 or more Minutes | 124 (4.3%) | 5 (0.2%) |
Time of Departure to Work by Sex in Marshall
The most frequent times of departure to work in Marshall are 6:00 AM to 6:29 AM (509, 17.6%) for males and 7:30 AM to 7:59 AM (461, 15.8%) for females.
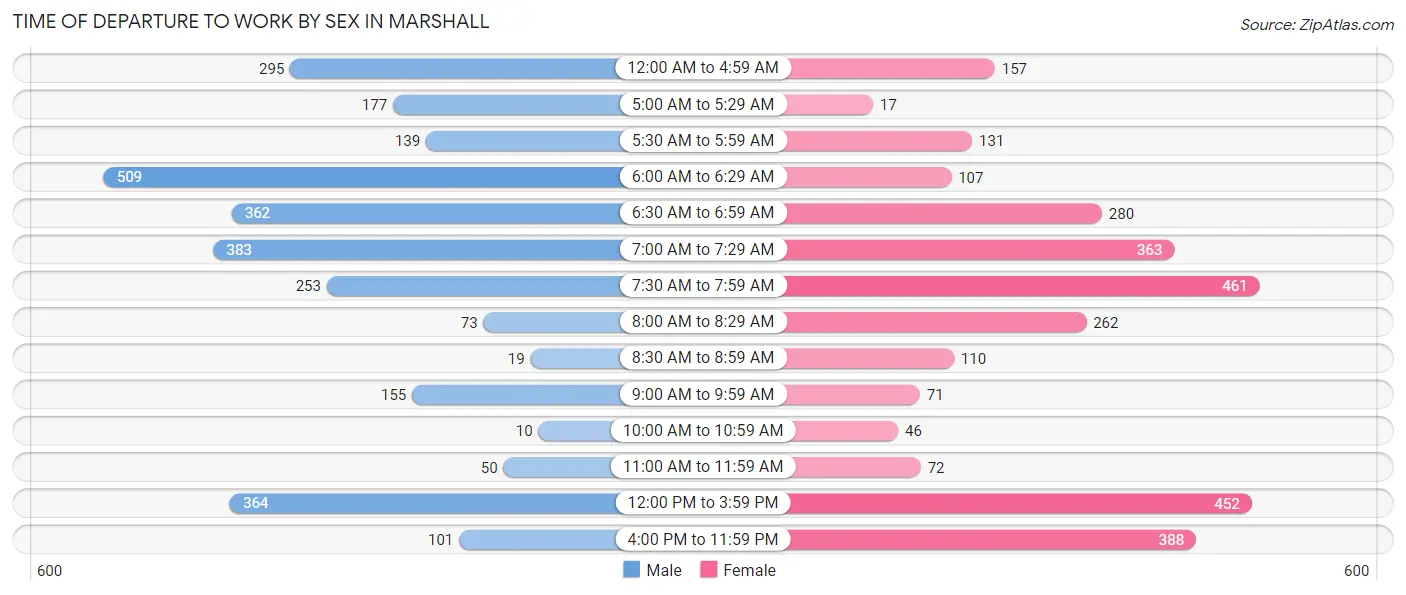
| Time of Departure | Male | Female |
| 12:00 AM to 4:59 AM | 295 (10.2%) | 157 (5.4%) |
| 5:00 AM to 5:29 AM | 177 (6.1%) | 17 (0.6%) |
| 5:30 AM to 5:59 AM | 139 (4.8%) | 131 (4.5%) |
| 6:00 AM to 6:29 AM | 509 (17.6%) | 107 (3.7%) |
| 6:30 AM to 6:59 AM | 362 (12.5%) | 280 (9.6%) |
| 7:00 AM to 7:29 AM | 383 (13.3%) | 363 (12.4%) |
| 7:30 AM to 7:59 AM | 253 (8.7%) | 461 (15.8%) |
| 8:00 AM to 8:29 AM | 73 (2.5%) | 262 (9.0%) |
| 8:30 AM to 8:59 AM | 19 (0.7%) | 110 (3.8%) |
| 9:00 AM to 9:59 AM | 155 (5.4%) | 71 (2.4%) |
| 10:00 AM to 10:59 AM | 10 (0.4%) | 46 (1.6%) |
| 11:00 AM to 11:59 AM | 50 (1.7%) | 72 (2.5%) |
| 12:00 PM to 3:59 PM | 364 (12.6%) | 452 (15.5%) |
| 4:00 PM to 11:59 PM | 101 (3.5%) | 388 (13.3%) |
| Total | 2,890 (100.0%) | 2,917 (100.0%) |
Housing Occupancy in Marshall
Occupancy by Ownership in Marshall
Of the total 4,376 dwellings in Marshall, owner-occupied units account for 2,980 (68.1%), while renter-occupied units make up 1,396 (31.9%).
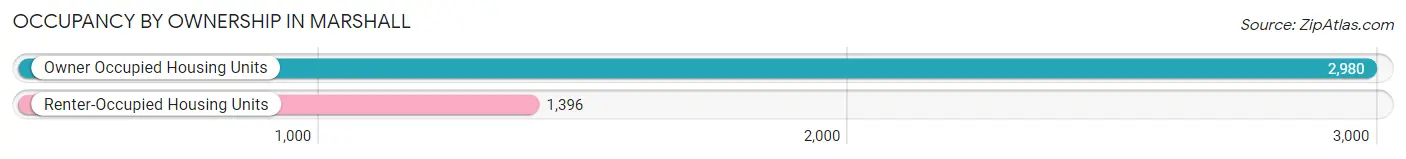
| Occupancy | # Housing Units | % Housing Units |
| Owner Occupied Housing Units | 2,980 | 68.1% |
| Renter-Occupied Housing Units | 1,396 | 31.9% |
| Total Occupied Housing Units | 4,376 | 100.0% |
Occupancy by Household Size in Marshall
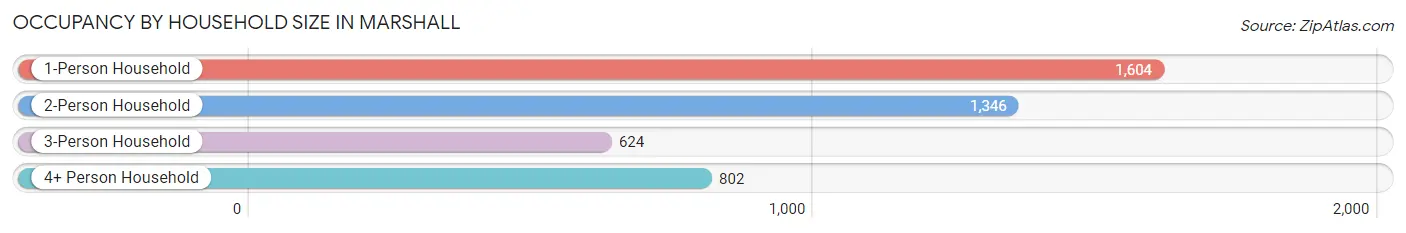
| Household Size | # Housing Units | % Housing Units |
| 1-Person Household | 1,604 | 36.6% |
| 2-Person Household | 1,346 | 30.8% |
| 3-Person Household | 624 | 14.3% |
| 4+ Person Household | 802 | 18.3% |
| Total Housing Units | 4,376 | 100.0% |
Occupancy by Ownership by Household Size in Marshall
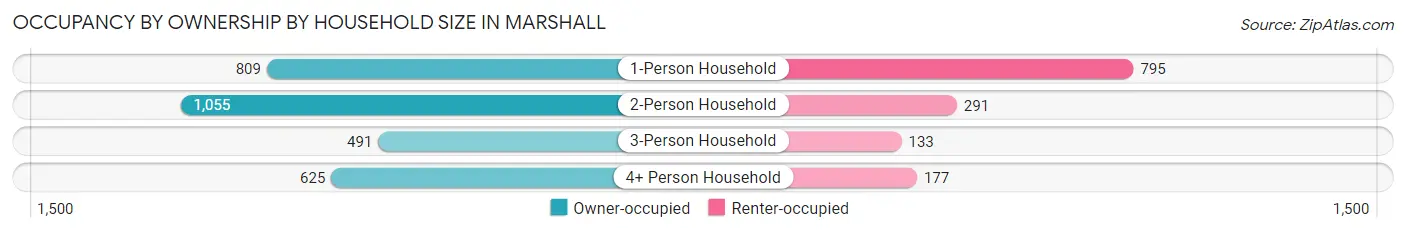
| Household Size | Owner-occupied | Renter-occupied |
| 1-Person Household | 809 (50.4%) | 795 (49.6%) |
| 2-Person Household | 1,055 (78.4%) | 291 (21.6%) |
| 3-Person Household | 491 (78.7%) | 133 (21.3%) |
| 4+ Person Household | 625 (77.9%) | 177 (22.1%) |
| Total Housing Units | 2,980 (68.1%) | 1,396 (31.9%) |
Occupancy by Educational Attainment in Marshall
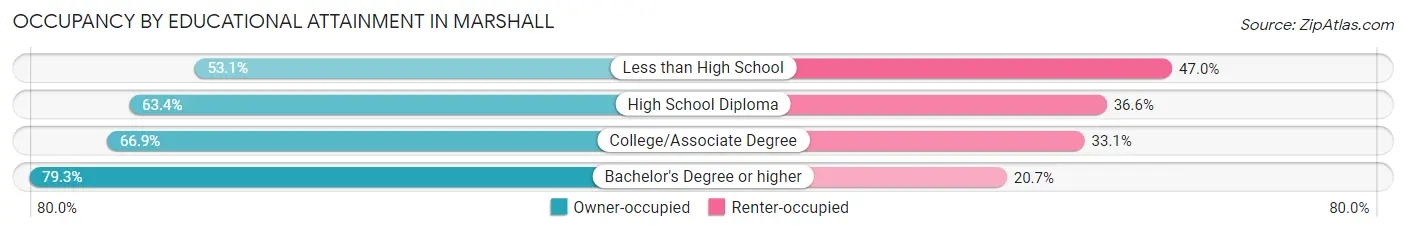
| Household Size | Owner-occupied | Renter-occupied |
| Less than High School | 235 (53.0%) | 208 (46.9%) |
| High School Diploma | 902 (63.4%) | 520 (36.6%) |
| College/Associate Degree | 802 (66.9%) | 396 (33.1%) |
| Bachelor's Degree or higher | 1,041 (79.3%) | 272 (20.7%) |
Occupancy by Age of Householder in Marshall
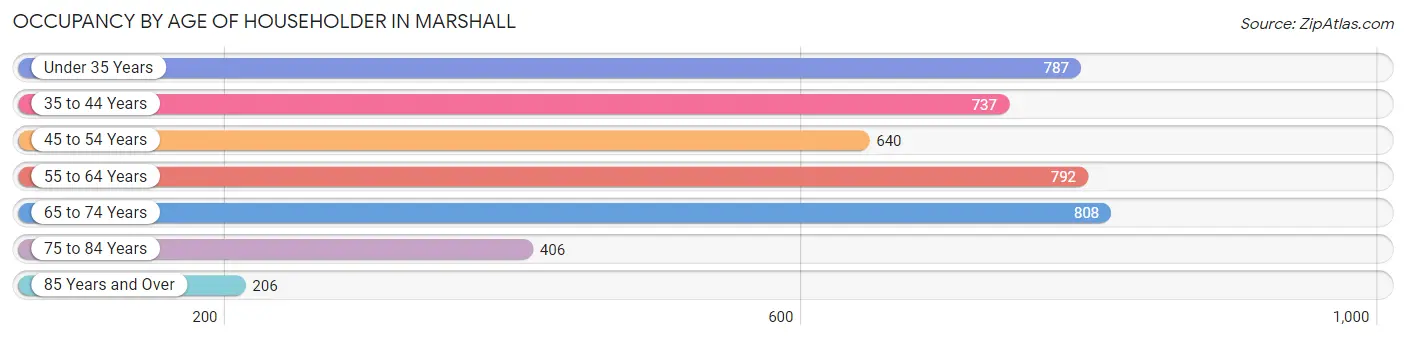
| Age Bracket | # Households | % Households |
| Under 35 Years | 787 | 18.0% |
| 35 to 44 Years | 737 | 16.8% |
| 45 to 54 Years | 640 | 14.6% |
| 55 to 64 Years | 792 | 18.1% |
| 65 to 74 Years | 808 | 18.5% |
| 75 to 84 Years | 406 | 9.3% |
| 85 Years and Over | 206 | 4.7% |
| Total | 4,376 | 100.0% |
Housing Finances in Marshall
Median Income by Occupancy in Marshall
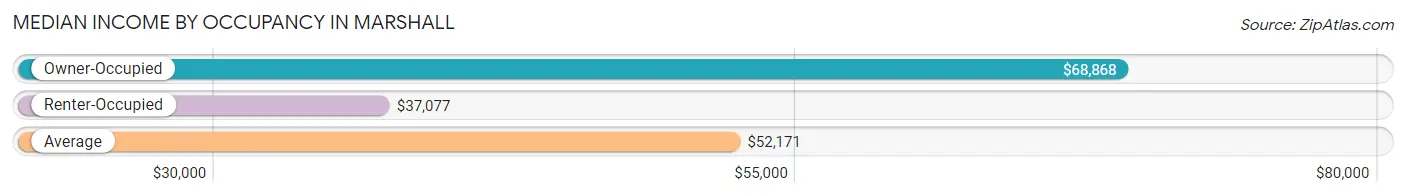
| Occupancy Type | # Households | Median Income |
| Owner-Occupied | 2,980 (68.1%) | $68,868 |
| Renter-Occupied | 1,396 (31.9%) | $37,077 |
| Average | 4,376 (100.0%) | $52,171 |
Occupancy by Householder Income Bracket in Marshall
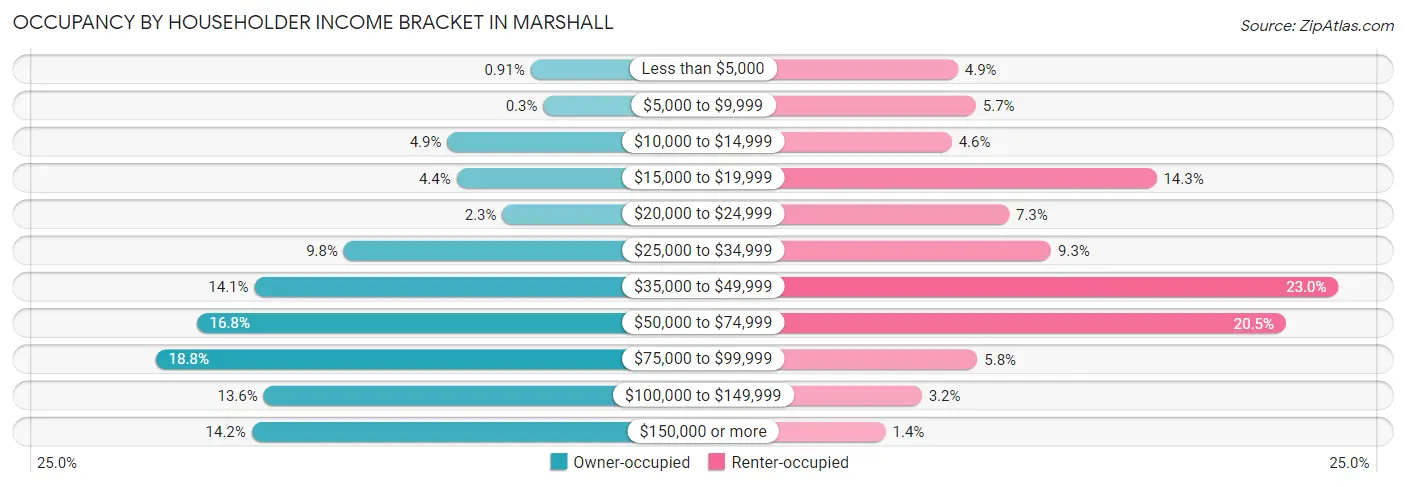
| Income Bracket | Owner-occupied | Renter-occupied |
| Less than $5,000 | 27 (0.9%) | 68 (4.9%) |
| $5,000 to $9,999 | 9 (0.3%) | 80 (5.7%) |
| $10,000 to $14,999 | 145 (4.9%) | 64 (4.6%) |
| $15,000 to $19,999 | 132 (4.4%) | 200 (14.3%) |
| $20,000 to $24,999 | 67 (2.2%) | 102 (7.3%) |
| $25,000 to $34,999 | 292 (9.8%) | 130 (9.3%) |
| $35,000 to $49,999 | 419 (14.1%) | 321 (23.0%) |
| $50,000 to $74,999 | 501 (16.8%) | 286 (20.5%) |
| $75,000 to $99,999 | 559 (18.8%) | 81 (5.8%) |
| $100,000 to $149,999 | 406 (13.6%) | 44 (3.2%) |
| $150,000 or more | 423 (14.2%) | 20 (1.4%) |
| Total | 2,980 (100.0%) | 1,396 (100.0%) |
Monthly Housing Cost Tiers in Marshall
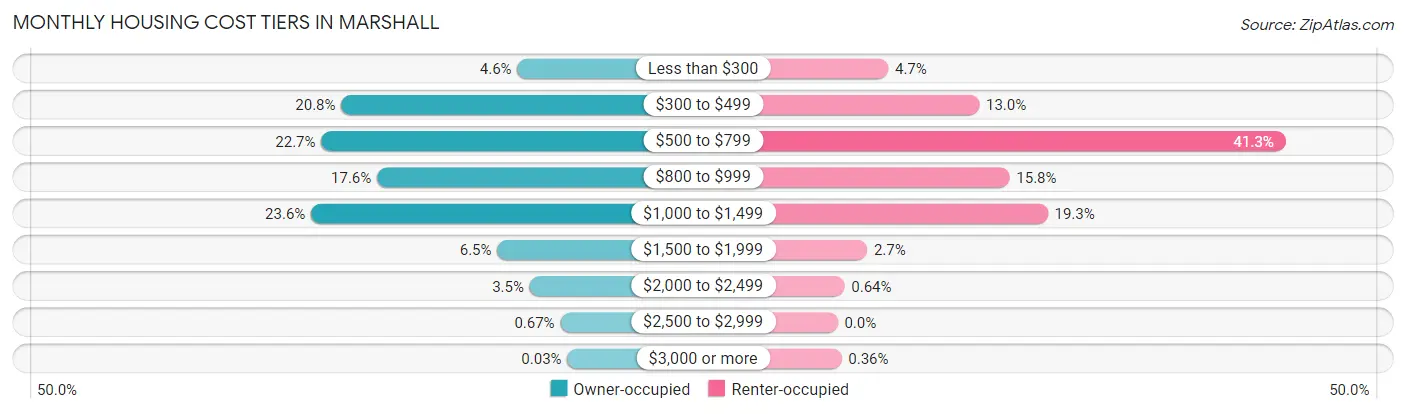
| Monthly Cost | Owner-occupied | Renter-occupied |
| Less than $300 | 138 (4.6%) | 65 (4.7%) |
| $300 to $499 | 621 (20.8%) | 182 (13.0%) |
| $500 to $799 | 676 (22.7%) | 576 (41.3%) |
| $800 to $999 | 523 (17.5%) | 221 (15.8%) |
| $1,000 to $1,499 | 704 (23.6%) | 270 (19.3%) |
| $1,500 to $1,999 | 193 (6.5%) | 38 (2.7%) |
| $2,000 to $2,499 | 104 (3.5%) | 9 (0.6%) |
| $2,500 to $2,999 | 20 (0.7%) | 0 (0.0%) |
| $3,000 or more | 1 (0.0%) | 5 (0.4%) |
| Total | 2,980 (100.0%) | 1,396 (100.0%) |
Physical Housing Characteristics in Marshall
Housing Structures in Marshall
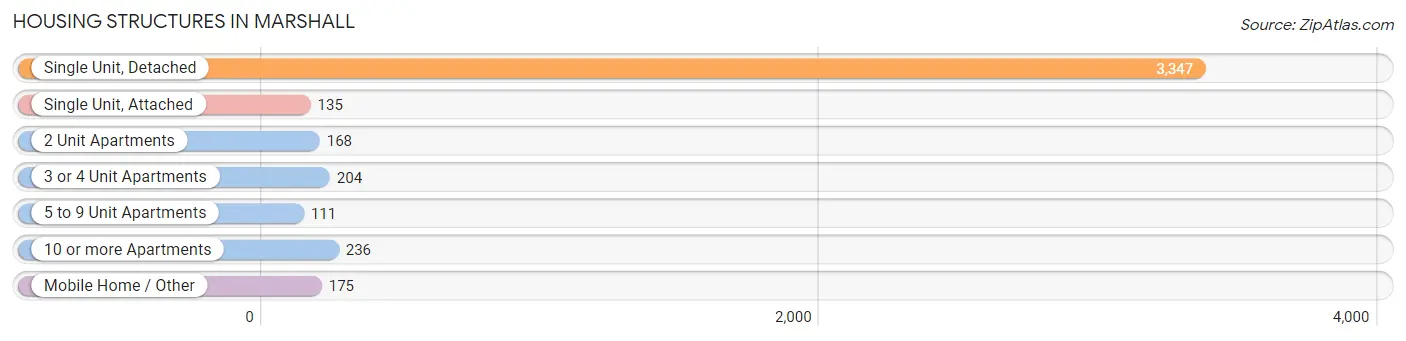
| Structure Type | # Housing Units | % Housing Units |
| Single Unit, Detached | 3,347 | 76.5% |
| Single Unit, Attached | 135 | 3.1% |
| 2 Unit Apartments | 168 | 3.8% |
| 3 or 4 Unit Apartments | 204 | 4.7% |
| 5 to 9 Unit Apartments | 111 | 2.5% |
| 10 or more Apartments | 236 | 5.4% |
| Mobile Home / Other | 175 | 4.0% |
| Total | 4,376 | 100.0% |
Housing Structures by Occupancy in Marshall
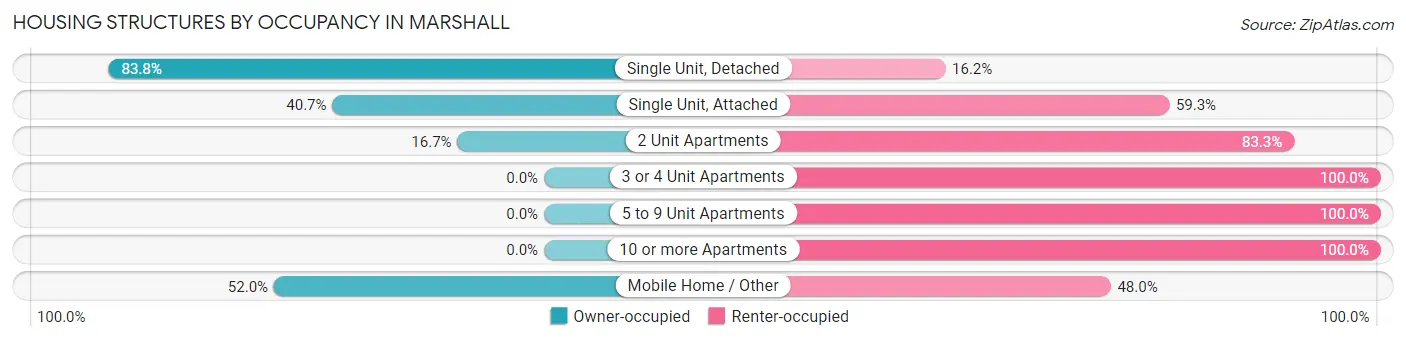
| Structure Type | Owner-occupied | Renter-occupied |
| Single Unit, Detached | 2,806 (83.8%) | 541 (16.2%) |
| Single Unit, Attached | 55 (40.7%) | 80 (59.3%) |
| 2 Unit Apartments | 28 (16.7%) | 140 (83.3%) |
| 3 or 4 Unit Apartments | 0 (0.0%) | 204 (100.0%) |
| 5 to 9 Unit Apartments | 0 (0.0%) | 111 (100.0%) |
| 10 or more Apartments | 0 (0.0%) | 236 (100.0%) |
| Mobile Home / Other | 91 (52.0%) | 84 (48.0%) |
| Total | 2,980 (68.1%) | 1,396 (31.9%) |
Housing Structures by Number of Rooms in Marshall
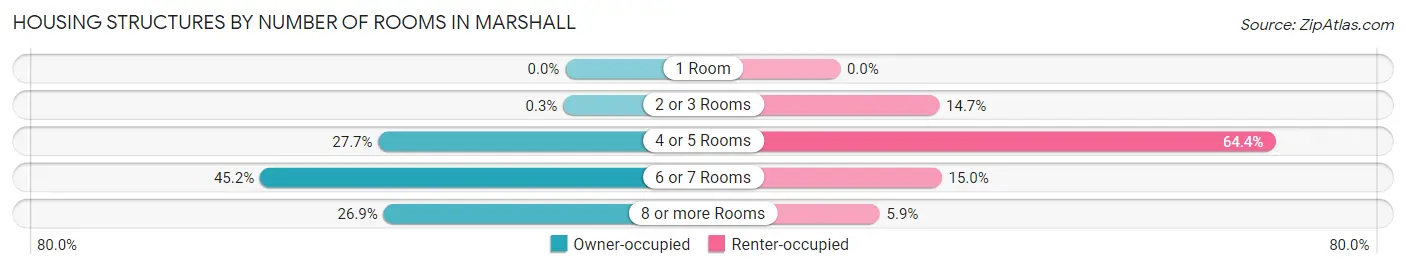
| Number of Rooms | Owner-occupied | Renter-occupied |
| 1 Room | 0 (0.0%) | 0 (0.0%) |
| 2 or 3 Rooms | 9 (0.3%) | 205 (14.7%) |
| 4 or 5 Rooms | 824 (27.7%) | 899 (64.4%) |
| 6 or 7 Rooms | 1,346 (45.2%) | 210 (15.0%) |
| 8 or more Rooms | 801 (26.9%) | 82 (5.9%) |
| Total | 2,980 (100.0%) | 1,396 (100.0%) |
Housing Structure by Heating Type in Marshall
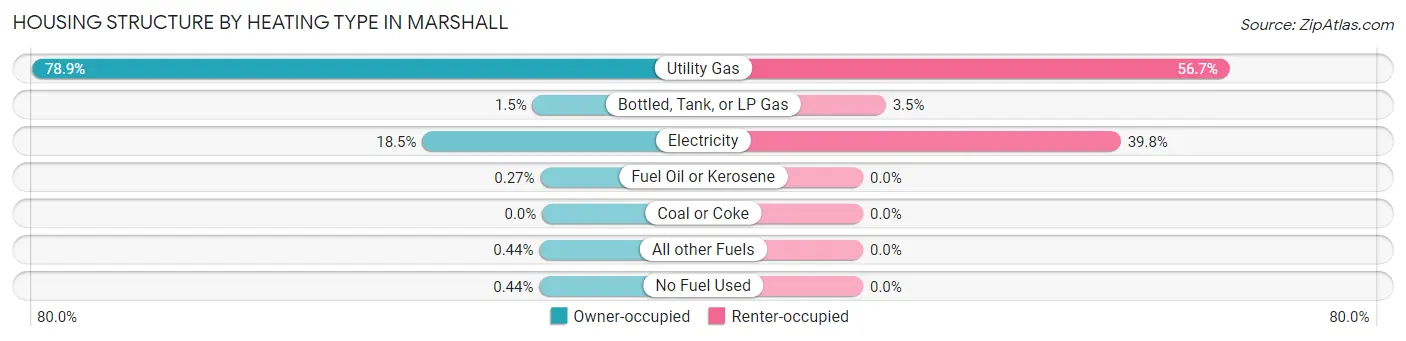
| Heating Type | Owner-occupied | Renter-occupied |
| Utility Gas | 2,350 (78.9%) | 791 (56.7%) |
| Bottled, Tank, or LP Gas | 44 (1.5%) | 49 (3.5%) |
| Electricity | 552 (18.5%) | 556 (39.8%) |
| Fuel Oil or Kerosene | 8 (0.3%) | 0 (0.0%) |
| Coal or Coke | 0 (0.0%) | 0 (0.0%) |
| All other Fuels | 13 (0.4%) | 0 (0.0%) |
| No Fuel Used | 13 (0.4%) | 0 (0.0%) |
| Total | 2,980 (100.0%) | 1,396 (100.0%) |
Household Vehicle Usage in Marshall
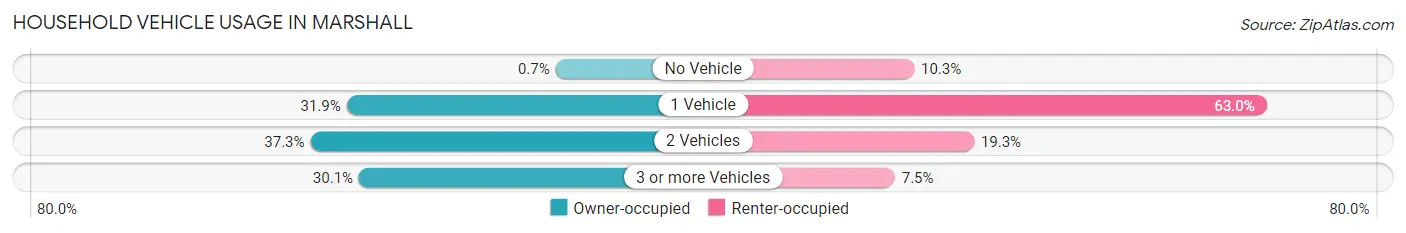
| Vehicles per Household | Owner-occupied | Renter-occupied |
| No Vehicle | 21 (0.7%) | 144 (10.3%) |
| 1 Vehicle | 951 (31.9%) | 879 (63.0%) |
| 2 Vehicles | 1,112 (37.3%) | 269 (19.3%) |
| 3 or more Vehicles | 896 (30.1%) | 104 (7.4%) |
| Total | 2,980 (100.0%) | 1,396 (100.0%) |
Real Estate & Mortgages in Marshall
Real Estate and Mortgage Overview in Marshall
| Characteristic | Without Mortgage | With Mortgage |
| Housing Units | 1,244 | 1,736 |
| Median Property Value | $128,900 | $147,900 |
| Median Household Income | $48,056 | $312 |
| Monthly Housing Costs | $459 | $1 |
| Real Estate Taxes | $1,049 | $1 |
Property Value by Mortgage Status in Marshall
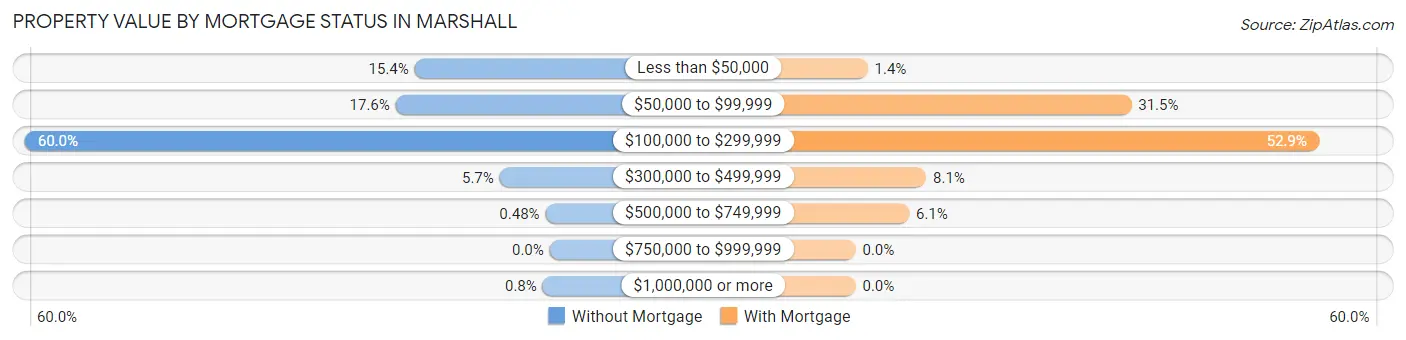
| Property Value | Without Mortgage | With Mortgage |
| Less than $50,000 | 192 (15.4%) | 24 (1.4%) |
| $50,000 to $99,999 | 219 (17.6%) | 547 (31.5%) |
| $100,000 to $299,999 | 746 (60.0%) | 919 (52.9%) |
| $300,000 to $499,999 | 71 (5.7%) | 140 (8.1%) |
| $500,000 to $749,999 | 6 (0.5%) | 106 (6.1%) |
| $750,000 to $999,999 | 0 (0.0%) | 0 (0.0%) |
| $1,000,000 or more | 10 (0.8%) | 0 (0.0%) |
| Total | 1,244 (100.0%) | 1,736 (100.0%) |
Household Income by Mortgage Status in Marshall
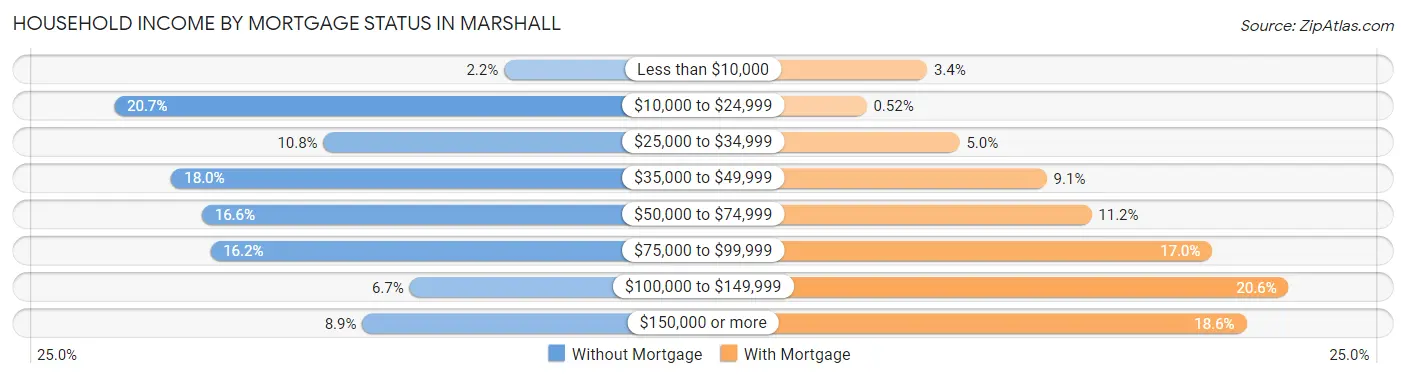
| Household Income | Without Mortgage | With Mortgage |
| Less than $10,000 | 27 (2.2%) | 59 (3.4%) |
| $10,000 to $24,999 | 258 (20.7%) | 9 (0.5%) |
| $25,000 to $34,999 | 134 (10.8%) | 86 (5.0%) |
| $35,000 to $49,999 | 224 (18.0%) | 158 (9.1%) |
| $50,000 to $74,999 | 206 (16.6%) | 195 (11.2%) |
| $75,000 to $99,999 | 201 (16.2%) | 295 (17.0%) |
| $100,000 to $149,999 | 83 (6.7%) | 358 (20.6%) |
| $150,000 or more | 111 (8.9%) | 323 (18.6%) |
| Total | 1,244 (100.0%) | 1,736 (100.0%) |
Property Value to Household Income Ratio in Marshall
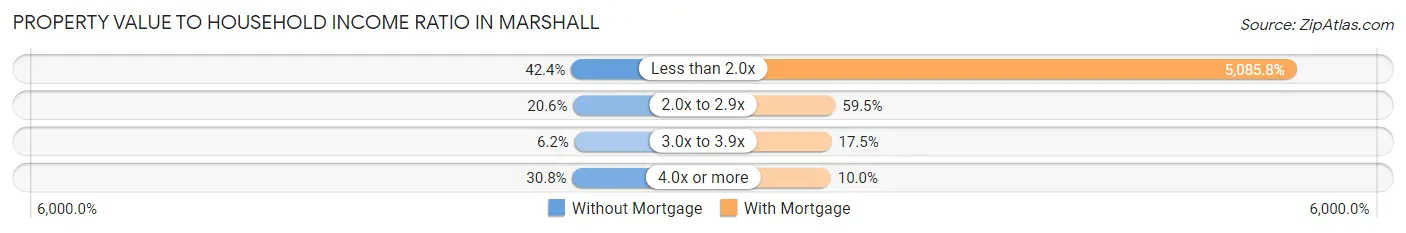
| Value-to-Income Ratio | Without Mortgage | With Mortgage |
| Less than 2.0x | 528 (42.4%) | 88,289 (5,085.8%) |
| 2.0x to 2.9x | 256 (20.6%) | 1,032 (59.5%) |
| 3.0x to 3.9x | 77 (6.2%) | 304 (17.5%) |
| 4.0x or more | 383 (30.8%) | 173 (10.0%) |
| Total | 1,244 (100.0%) | 1,736 (100.0%) |
Real Estate Taxes by Mortgage Status in Marshall
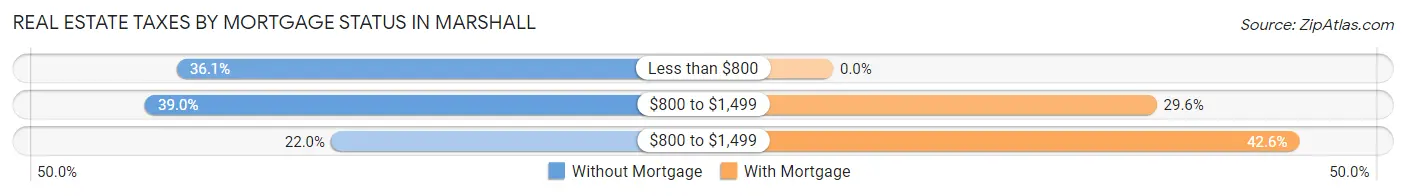
| Property Taxes | Without Mortgage | With Mortgage |
| Less than $800 | 449 (36.1%) | 0 (0.0%) |
| $800 to $1,499 | 485 (39.0%) | 513 (29.5%) |
| $800 to $1,499 | 274 (22.0%) | 739 (42.6%) |
| Total | 1,244 (100.0%) | 1,736 (100.0%) |
Health & Disability in Marshall
Health Insurance Coverage by Age in Marshall
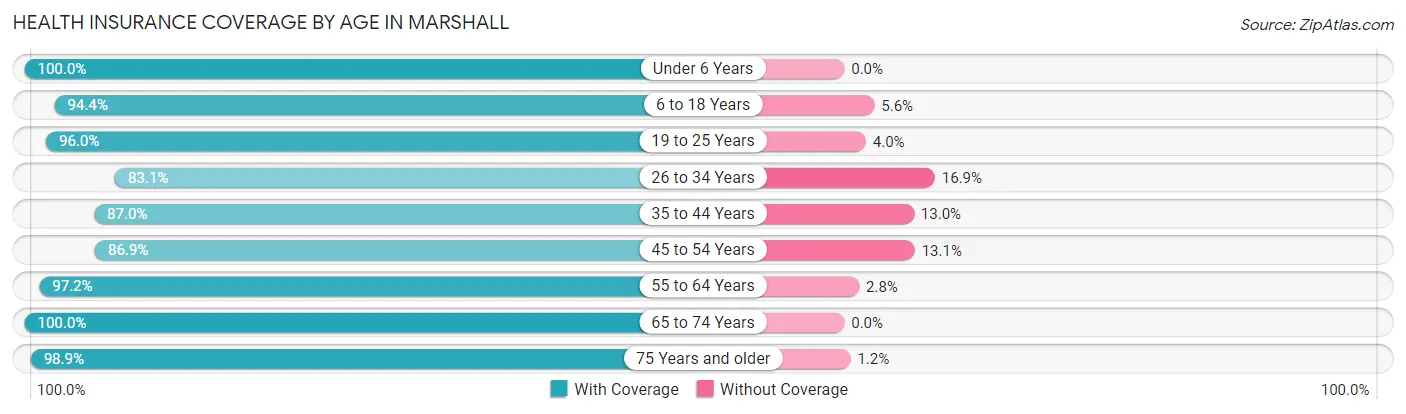
| Age Bracket | With Coverage | Without Coverage |
| Under 6 Years | 816 (100.0%) | 0 (0.0%) |
| 6 to 18 Years | 2,124 (94.4%) | 126 (5.6%) |
| 19 to 25 Years | 2,246 (96.0%) | 94 (4.0%) |
| 26 to 34 Years | 1,476 (83.1%) | 300 (16.9%) |
| 35 to 44 Years | 1,274 (87.0%) | 190 (13.0%) |
| 45 to 54 Years | 1,071 (86.9%) | 162 (13.1%) |
| 55 to 64 Years | 1,549 (97.2%) | 44 (2.8%) |
| 65 to 74 Years | 1,169 (100.0%) | 0 (0.0%) |
| 75 Years and older | 861 (98.9%) | 10 (1.1%) |
| Total | 12,586 (93.1%) | 926 (6.9%) |
Health Insurance Coverage by Citizenship Status in Marshall
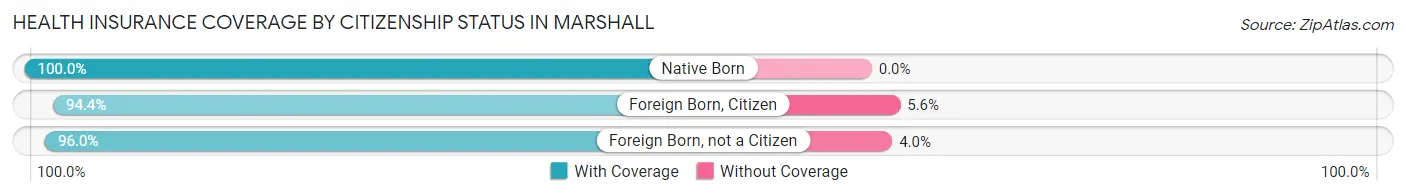
| Citizenship Status | With Coverage | Without Coverage |
| Native Born | 816 (100.0%) | 0 (0.0%) |
| Foreign Born, Citizen | 2,124 (94.4%) | 126 (5.6%) |
| Foreign Born, not a Citizen | 2,246 (96.0%) | 94 (4.0%) |
Health Insurance Coverage by Household Income in Marshall
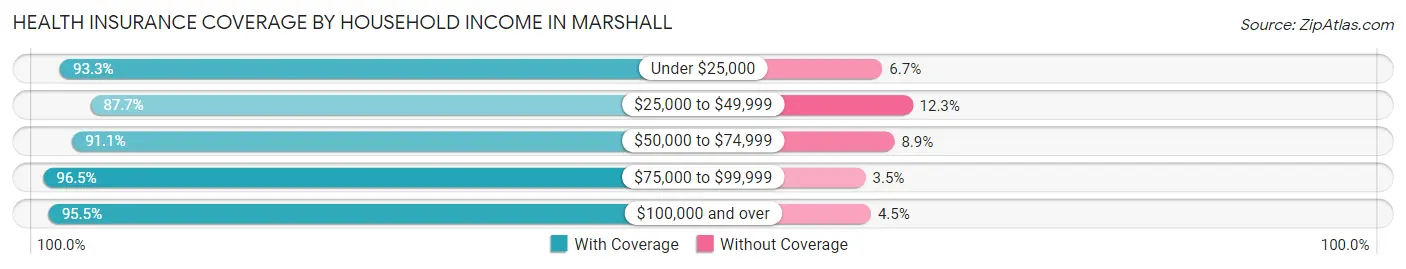
| Household Income | With Coverage | Without Coverage |
| Under $25,000 | 1,554 (93.3%) | 111 (6.7%) |
| $25,000 to $49,999 | 2,148 (87.7%) | 302 (12.3%) |
| $50,000 to $74,999 | 2,101 (91.1%) | 206 (8.9%) |
| $75,000 to $99,999 | 2,383 (96.5%) | 87 (3.5%) |
| $100,000 and over | 3,350 (95.5%) | 159 (4.5%) |
Public vs Private Health Insurance Coverage by Age in Marshall
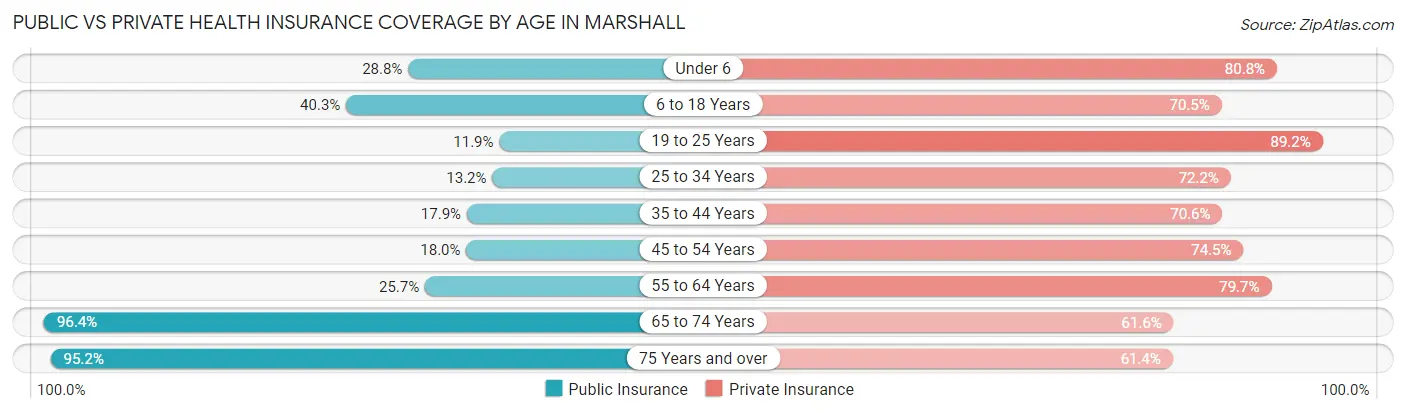
| Age Bracket | Public Insurance | Private Insurance |
| Under 6 | 235 (28.8%) | 659 (80.8%) |
| 6 to 18 Years | 907 (40.3%) | 1,586 (70.5%) |
| 19 to 25 Years | 278 (11.9%) | 2,088 (89.2%) |
| 25 to 34 Years | 234 (13.2%) | 1,282 (72.2%) |
| 35 to 44 Years | 262 (17.9%) | 1,034 (70.6%) |
| 45 to 54 Years | 222 (18.0%) | 919 (74.5%) |
| 55 to 64 Years | 409 (25.7%) | 1,270 (79.7%) |
| 65 to 74 Years | 1,127 (96.4%) | 720 (61.6%) |
| 75 Years and over | 829 (95.2%) | 535 (61.4%) |
| Total | 4,503 (33.3%) | 10,093 (74.7%) |
Disability Status by Sex by Age in Marshall
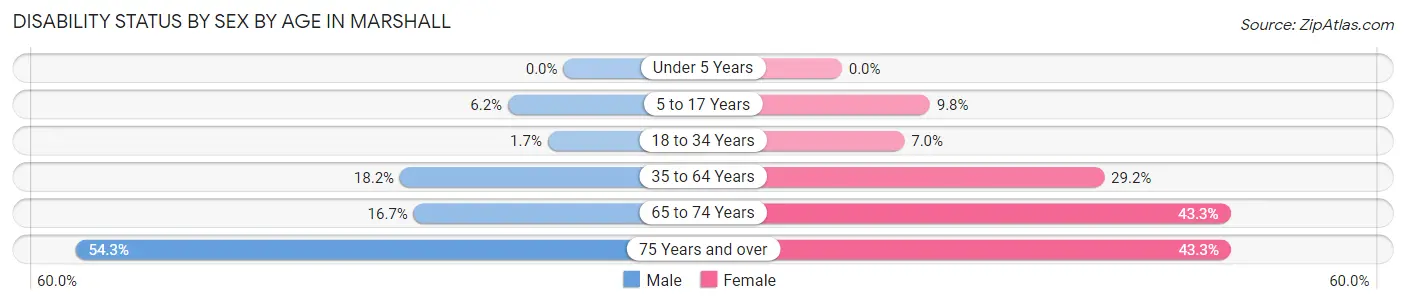
| Age Bracket | Male | Female |
| Under 5 Years | 0 (0.0%) | 0 (0.0%) |
| 5 to 17 Years | 50 (6.2%) | 136 (9.8%) |
| 18 to 34 Years | 40 (1.7%) | 144 (7.0%) |
| 35 to 64 Years | 371 (18.2%) | 658 (29.2%) |
| 65 to 74 Years | 102 (16.7%) | 241 (43.3%) |
| 75 Years and over | 201 (54.3%) | 217 (43.3%) |
Disability Class by Sex by Age in Marshall
Disability Class: Hearing Difficulty
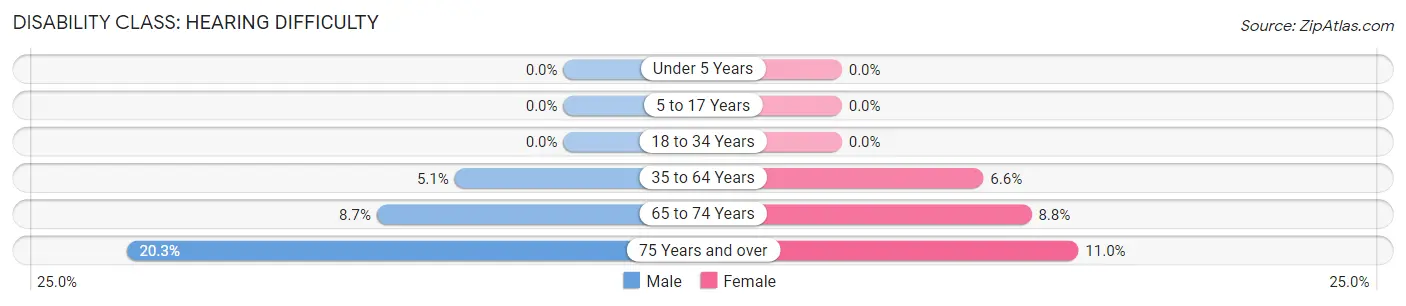
| Age Bracket | Male | Female |
| Under 5 Years | 0 (0.0%) | 0 (0.0%) |
| 5 to 17 Years | 0 (0.0%) | 0 (0.0%) |
| 18 to 34 Years | 0 (0.0%) | 0 (0.0%) |
| 35 to 64 Years | 103 (5.1%) | 148 (6.6%) |
| 65 to 74 Years | 53 (8.7%) | 49 (8.8%) |
| 75 Years and over | 75 (20.3%) | 55 (11.0%) |
Disability Class: Vision Difficulty
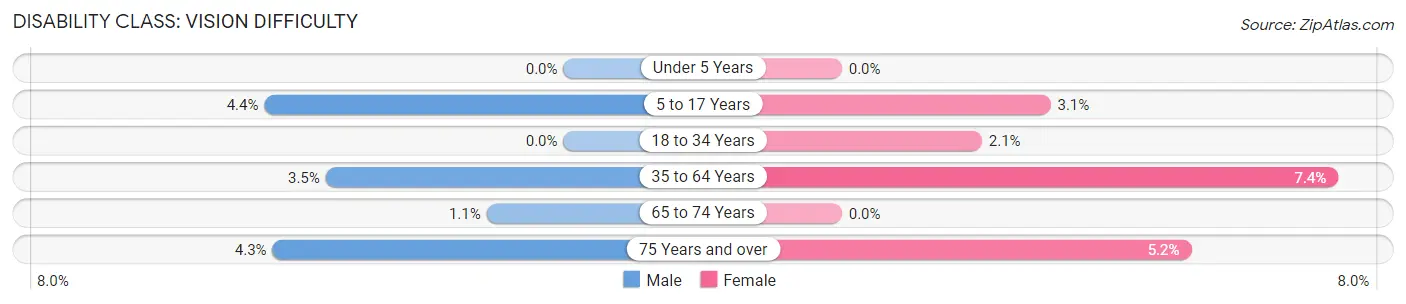
| Age Bracket | Male | Female |
| Under 5 Years | 0 (0.0%) | 0 (0.0%) |
| 5 to 17 Years | 36 (4.4%) | 43 (3.1%) |
| 18 to 34 Years | 0 (0.0%) | 43 (2.1%) |
| 35 to 64 Years | 72 (3.5%) | 166 (7.4%) |
| 65 to 74 Years | 7 (1.1%) | 0 (0.0%) |
| 75 Years and over | 16 (4.3%) | 26 (5.2%) |
Disability Class: Cognitive Difficulty
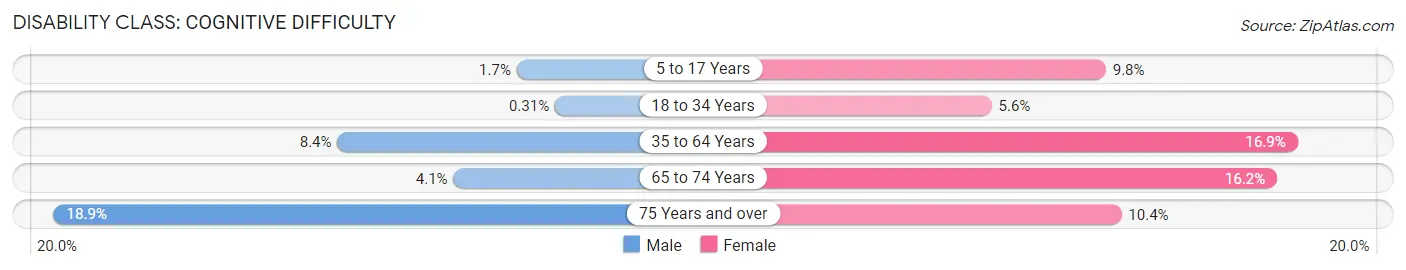
| Age Bracket | Male | Female |
| 5 to 17 Years | 14 (1.7%) | 136 (9.8%) |
| 18 to 34 Years | 7 (0.3%) | 115 (5.6%) |
| 35 to 64 Years | 171 (8.4%) | 381 (16.9%) |
| 65 to 74 Years | 25 (4.1%) | 90 (16.2%) |
| 75 Years and over | 70 (18.9%) | 52 (10.4%) |
Disability Class: Ambulatory Difficulty
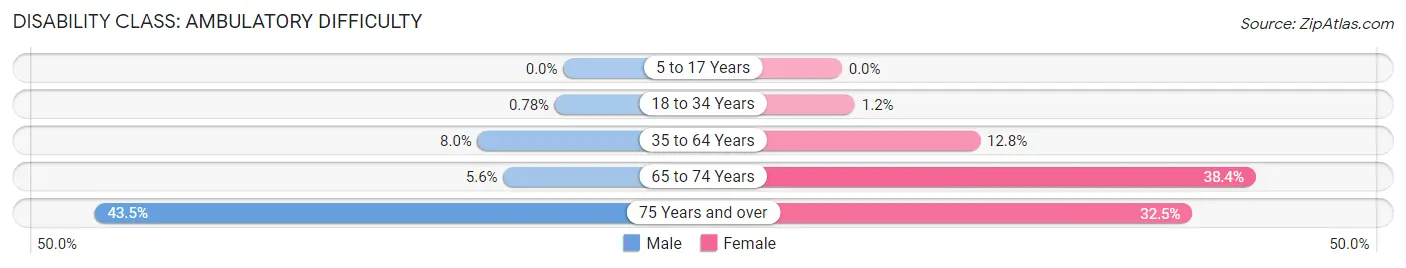
| Age Bracket | Male | Female |
| 5 to 17 Years | 0 (0.0%) | 0 (0.0%) |
| 18 to 34 Years | 18 (0.8%) | 25 (1.2%) |
| 35 to 64 Years | 162 (8.0%) | 289 (12.8%) |
| 65 to 74 Years | 34 (5.6%) | 214 (38.4%) |
| 75 Years and over | 161 (43.5%) | 163 (32.5%) |
Disability Class: Self-Care Difficulty
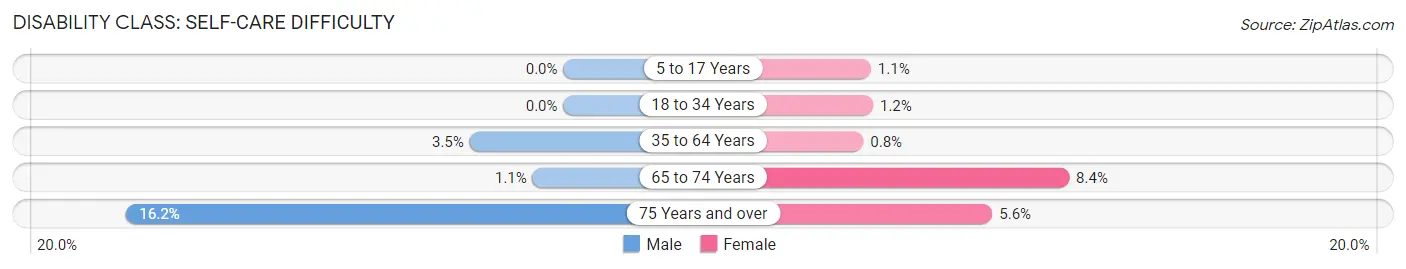
| Age Bracket | Male | Female |
| 5 to 17 Years | 0 (0.0%) | 15 (1.1%) |
| 18 to 34 Years | 0 (0.0%) | 24 (1.2%) |
| 35 to 64 Years | 71 (3.5%) | 18 (0.8%) |
| 65 to 74 Years | 7 (1.1%) | 47 (8.4%) |
| 75 Years and over | 60 (16.2%) | 28 (5.6%) |
Technology Access in Marshall
Computing Device Access in Marshall
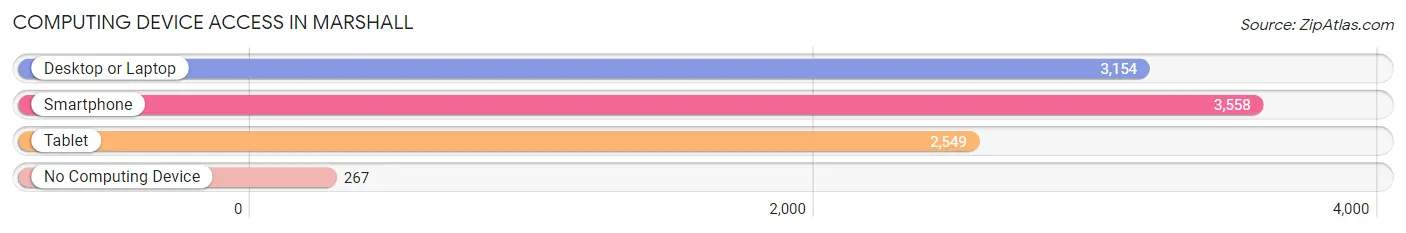
| Device Type | # Households | % Households |
| Desktop or Laptop | 3,154 | 72.1% |
| Smartphone | 3,558 | 81.3% |
| Tablet | 2,549 | 58.3% |
| No Computing Device | 267 | 6.1% |
| Total | 4,376 | 100.0% |
Internet Access in Marshall
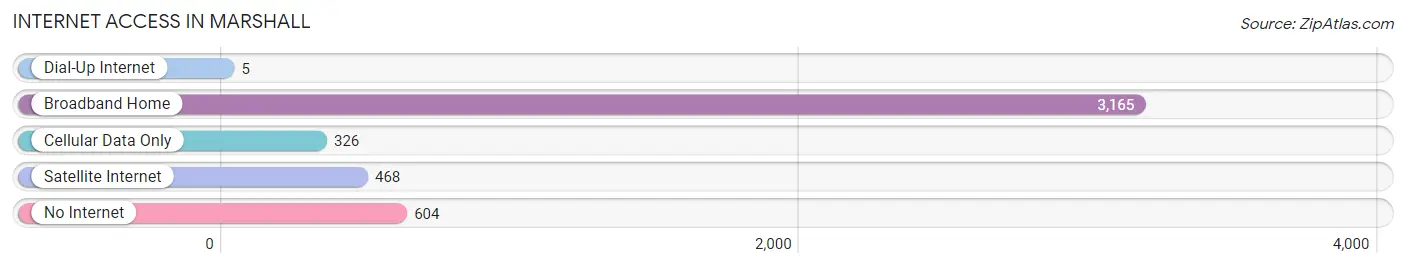
| Internet Type | # Households | % Households |
| Dial-Up Internet | 5 | 0.1% |
| Broadband Home | 3,165 | 72.3% |
| Cellular Data Only | 326 | 7.4% |
| Satellite Internet | 468 | 10.7% |
| No Internet | 604 | 13.8% |
| Total | 4,376 | 100.0% |
Marshall Summary
Marshall, Missouri is a city located in Saline County, Missouri, United States. It is the county seat of Saline County and is located along the Missouri River. The population was 13,065 at the 2010 census.
History
Marshall was founded in 1835 by William Marshall, a settler from Kentucky. The town was originally called Saline City, but was later changed to Marshall in honor of its founder. The town was incorporated in 1839 and became the county seat of Saline County in 1841.
Marshall was a major stop on the Hannibal and St. Joseph Railroad, which connected St. Joseph, Missouri to Hannibal, Missouri. The railroad was completed in 1859 and was the first transcontinental railroad in the United States.
During the Civil War, Marshall was a major supply center for the Union Army. The town was also the site of a major battle in 1862, when Confederate forces attempted to capture the town. The Union forces were able to repel the attack and the town remained in Union hands for the remainder of the war.
Geography
Marshall is located at 39°7′25″N 93°19′17″W (39.123611, -93.321389). According to the United States Census Bureau, the city has a total area of 8.2 square miles (21.2 km2), of which 8.1 square miles (21.0 km2) is land and 0.1 square miles (0.2 km2) is water.
Economy
Marshall is a major agricultural center in the region, with a variety of crops grown in the area. The city is also home to several manufacturing companies, including a large poultry processing plant.
The city is also home to several educational institutions, including Missouri Valley College and the University of Missouri-Columbia.
Demographics
As of the census of 2010, there were 13,065 people, 4,845 households, and 3,092 families residing in the city. The population density was 1,611.2 people per square mile (621.7/km2). There were 5,093 housing units at an average density of 627.3 per square mile (242.2/km2). The racial makeup of the city was 87.2% White, 8.2% African American, 0.3% Native American, 0.7% Asian, 0.1% Pacific Islander, 1.2% from other races, and 2.3% from two or more races. Hispanic or Latino of any race were 3.2% of the population.
There were 4,845 households, out of which 28.7% had children under the age of 18 living with them, 46.2% were married couples living together, 13.7% had a female householder with no husband present, and 35.3% were non-families. 29.7% of all households were made up of individuals, and 12.2% had someone living alone who was 65 years of age or older. The average household size was 2.41 and the average family size was 2.97.
In the city, the population was spread out, with 23.7% under the age of 18, 11.2% from 18 to 24, 25.7% from 25 to 44, 22.7% from 45 to 64, and 16.7% who were 65 years of age or older. The median age was 36 years. For every 100 females, there were 87.7 males. For every 100 females age 18 and over, there were 83.3 males.
The median income for a household in the city was $32,917, and the median income for a family was $41,945. Males had a median income of $30,917 versus $21,917 for females. The per capita income for the city was $17,845. About 11.2% of families and 14.7% of the population were below the poverty line, including 19.2% of those under age 18 and 11.2% of those age 65 or over.
Common Questions
What is Per Capita Income in Marshall?
Per Capita income in Marshall is $24,612.
What is the Median Family Income in Marshall?
Median Family Income in Marshall is $75,481.
What is the Median Household income in Marshall?
Median Household Income in Marshall is $52,171.
What is Income or Wage Gap in Marshall?
Income or Wage Gap in Marshall is 18.1%.
Women in Marshall earn 81.9 cents for every dollar earned by a man.
What is Inequality or Gini Index in Marshall?
Inequality or Gini Index in Marshall is 0.42.
What is the Total Population of Marshall?
Total Population of Marshall is 13,687.
What is the Total Male Population of Marshall?
Total Male Population of Marshall is 6,577.
What is the Total Female Population of Marshall?
Total Female Population of Marshall is 7,110.
What is the Ratio of Males per 100 Females in Marshall?
There are 92.50 Males per 100 Females in Marshall.
What is the Ratio of Females per 100 Males in Marshall?
There are 108.10 Females per 100 Males in Marshall.
What is the Median Population Age in Marshall?
Median Population Age in Marshall is 31.8 Years.
What is the Average Family Size in Marshall
Average Family Size in Marshall is 3.9 People.
What is the Average Household Size in Marshall
Average Household Size in Marshall is 2.8 People.
How Large is the Labor Force in Marshall?
There are 6,507 People in the Labor Forcein in Marshall.
What is the Percentage of People in the Labor Force in Marshall?
58.6% of People are in the Labor Force in Marshall.
What is the Unemployment Rate in Marshall?
Unemployment Rate in Marshall is 2.8%.