Holden, MO Map & Demographics
Holden Map
Holden Overview
$26,032
PER CAPITA INCOME
$67,500
AVG FAMILY INCOME
$58,661
AVG HOUSEHOLD INCOME
36.8%
WAGE / INCOME GAP [ % ]
63.2¢/ $1
WAGE / INCOME GAP [ $ ]
0.38
INEQUALITY / GINI INDEX
1,840
TOTAL POPULATION
904
MALE POPULATION
936
FEMALE POPULATION
96.58
MALES / 100 FEMALES
103.54
FEMALES / 100 MALES
40.2
MEDIAN AGE
2.8
AVG FAMILY SIZE
2.4
AVG HOUSEHOLD SIZE
900
LABOR FORCE [ PEOPLE ]
62.6%
PERCENT IN LABOR FORCE
5.4%
UNEMPLOYMENT RATE
Holden Zip Codes
Holden Area Codes
Income in Holden
Income Overview in Holden
Per Capita Income in Holden is $26,032, while median incomes of families and households are $67,500 and $58,661 respectively.
| Characteristic | Number | Measure |
| Per Capita Income | 1,840 | $26,032 |
| Median Family Income | 534 | $67,500 |
| Mean Family Income | 534 | $72,551 |
| Median Household Income | 757 | $58,661 |
| Mean Household Income | 757 | $62,445 |
| Income Deficit | 534 | $0 |
| Wage / Income Gap (%) | 1,840 | 36.80% |
| Wage / Income Gap ($) | 1,840 | 63.20¢ per $1 |
| Gini / Inequality Index | 1,840 | 0.38 |
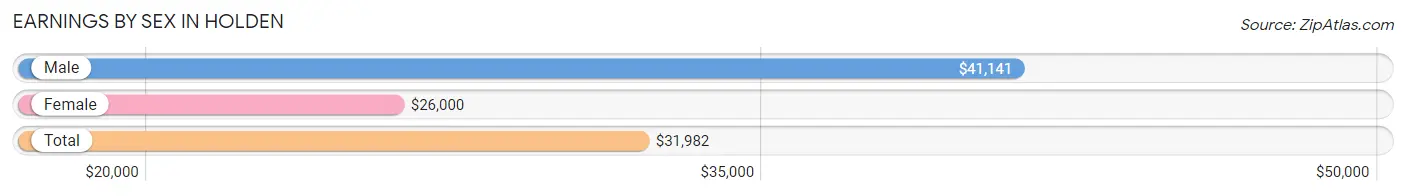
Earnings by Sex in Holden
Average Earnings in Holden are $31,982, $41,141 for men and $26,000 for women, a difference of 36.8%.
| Sex | Number | Average Earnings |
| Male | 497 (54.8%) | $41,141 |
| Female | 410 (45.2%) | $26,000 |
| Total | 907 (100.0%) | $31,982 |
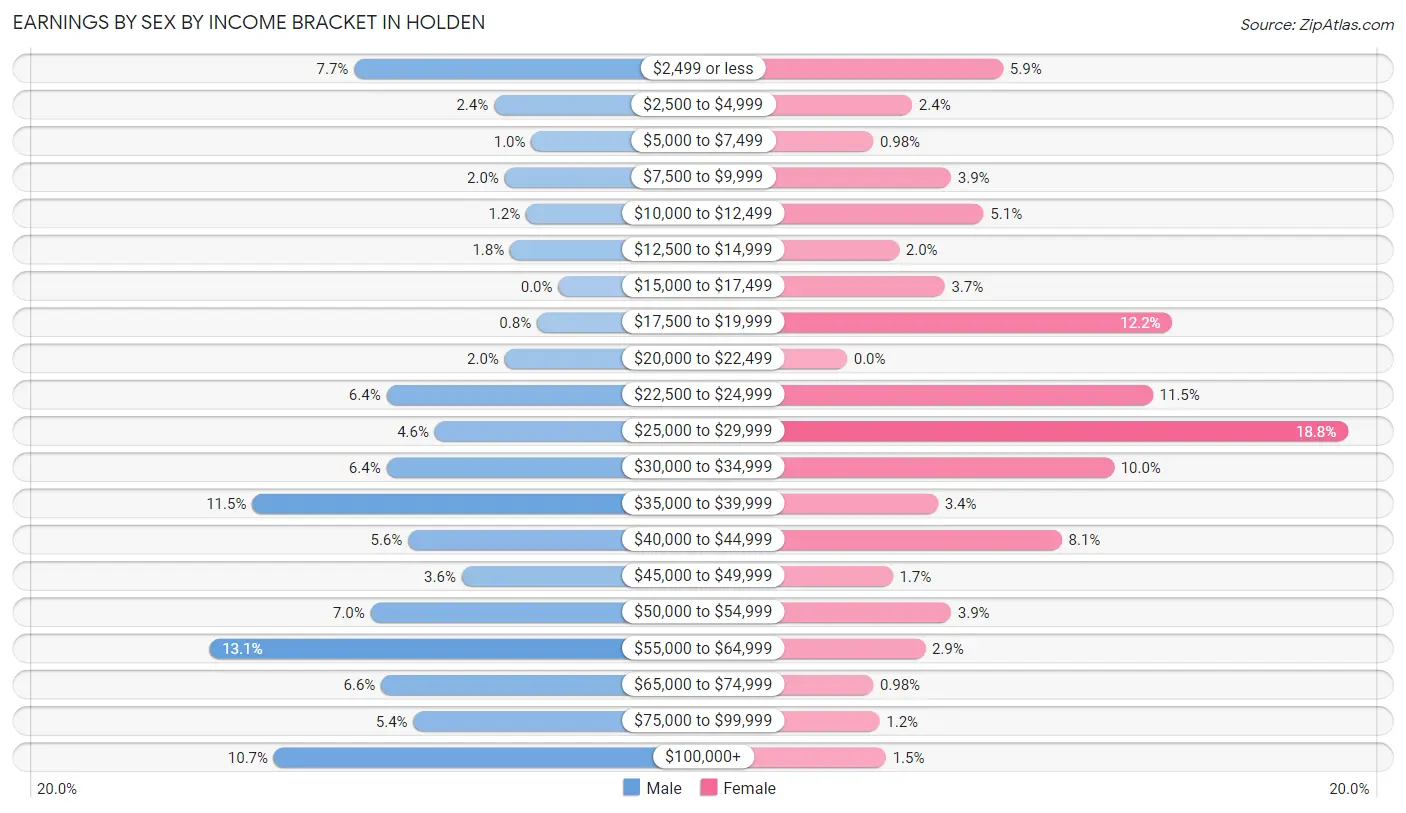
Earnings by Sex by Income Bracket in Holden
The most common earnings brackets in Holden are $55,000 to $64,999 for men (65 | 13.1%) and $25,000 to $29,999 for women (77 | 18.8%).
| Income | Male | Female |
| $2,499 or less | 38 (7.6%) | 24 (5.9%) |
| $2,500 to $4,999 | 12 (2.4%) | 10 (2.4%) |
| $5,000 to $7,499 | 5 (1.0%) | 4 (1.0%) |
| $7,500 to $9,999 | 10 (2.0%) | 16 (3.9%) |
| $10,000 to $12,499 | 6 (1.2%) | 21 (5.1%) |
| $12,500 to $14,999 | 9 (1.8%) | 8 (1.9%) |
| $15,000 to $17,499 | 0 (0.0%) | 15 (3.7%) |
| $17,500 to $19,999 | 4 (0.8%) | 50 (12.2%) |
| $20,000 to $22,499 | 10 (2.0%) | 0 (0.0%) |
| $22,500 to $24,999 | 32 (6.4%) | 47 (11.5%) |
| $25,000 to $29,999 | 23 (4.6%) | 77 (18.8%) |
| $30,000 to $34,999 | 32 (6.4%) | 41 (10.0%) |
| $35,000 to $39,999 | 57 (11.5%) | 14 (3.4%) |
| $40,000 to $44,999 | 28 (5.6%) | 33 (8.1%) |
| $45,000 to $49,999 | 18 (3.6%) | 7 (1.7%) |
| $50,000 to $54,999 | 35 (7.0%) | 16 (3.9%) |
| $55,000 to $64,999 | 65 (13.1%) | 12 (2.9%) |
| $65,000 to $74,999 | 33 (6.6%) | 4 (1.0%) |
| $75,000 to $99,999 | 27 (5.4%) | 5 (1.2%) |
| $100,000+ | 53 (10.7%) | 6 (1.5%) |
| Total | 497 (100.0%) | 410 (100.0%) |
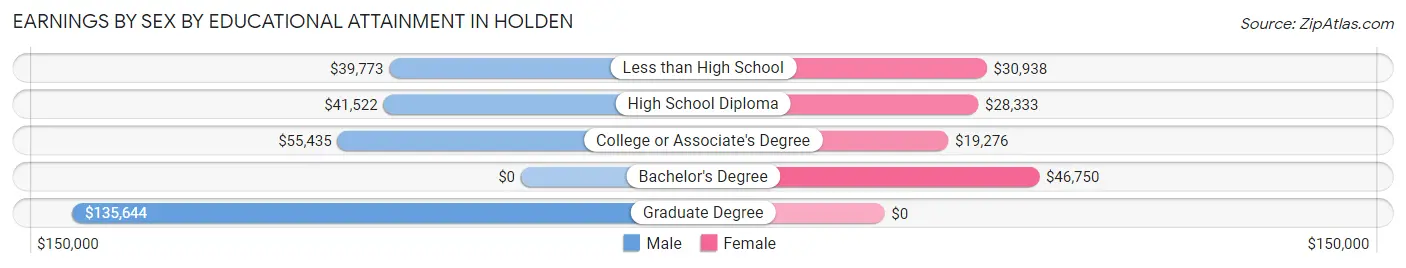
Earnings by Sex by Educational Attainment in Holden
Average earnings in Holden are $47,019 for men and $26,900 for women, a difference of 42.8%. Men with an educational attainment of graduate degree enjoy the highest average annual earnings of $135,644, while those with less than high school education earn the least with $39,773. Women with an educational attainment of bachelor's degree earn the most with the average annual earnings of $46,750, while those with college or associate's degree education have the smallest earnings of $19,276.
| Educational Attainment | Male Income | Female Income |
| Less than High School | $39,773 | $30,938 |
| High School Diploma | $41,522 | $28,333 |
| College or Associate's Degree | $55,435 | $19,276 |
| Bachelor's Degree | - | - |
| Graduate Degree | $135,644 | $0 |
| Total | $47,019 | $26,900 |
Family Income in Holden
Family Income Brackets in Holden
According to the Holden family income data, there are 168 families falling into the $50,000 to $74,999 income range, which is the most common income bracket and makes up 31.5% of all families.
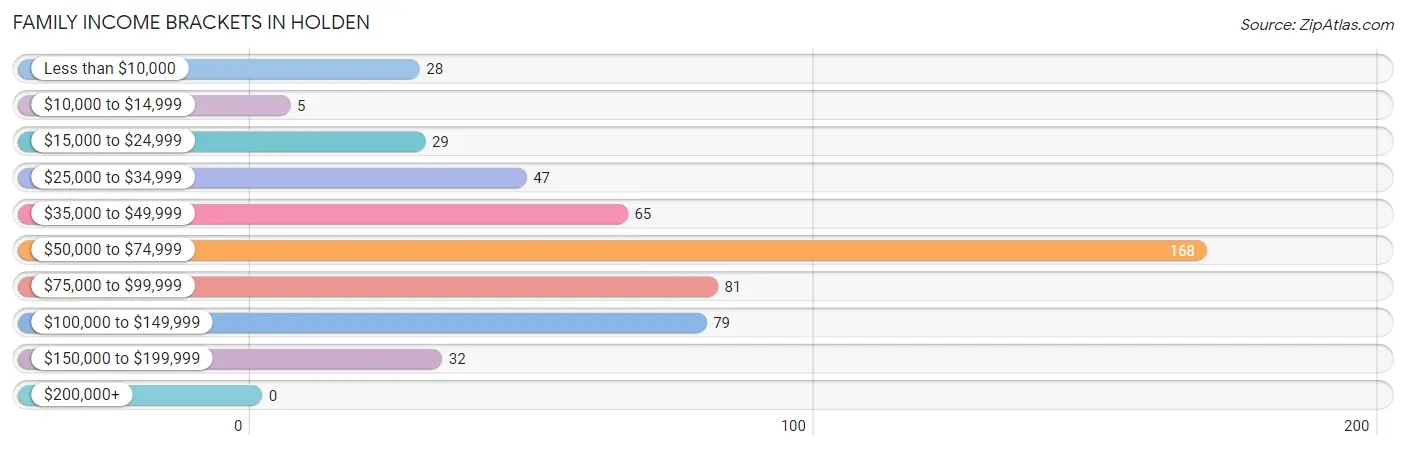
| Income Bracket | # Families | % Families |
| Less than $10,000 | 28 | 5.2% |
| $10,000 to $14,999 | 5 | 0.9% |
| $15,000 to $24,999 | 29 | 5.4% |
| $25,000 to $34,999 | 47 | 8.8% |
| $35,000 to $49,999 | 65 | 12.2% |
| $50,000 to $74,999 | 168 | 31.5% |
| $75,000 to $99,999 | 81 | 15.2% |
| $100,000 to $149,999 | 79 | 14.8% |
| $150,000 to $199,999 | 32 | 6.0% |
| $200,000+ | 0 | 0.0% |
Family Income by Famaliy Size in Holden
4-person families (95 | 17.8%) account for the highest median family income in Holden with $82,750 per family, while 2-person families (247 | 46.3%) have the highest median income of $30,364 per family member.
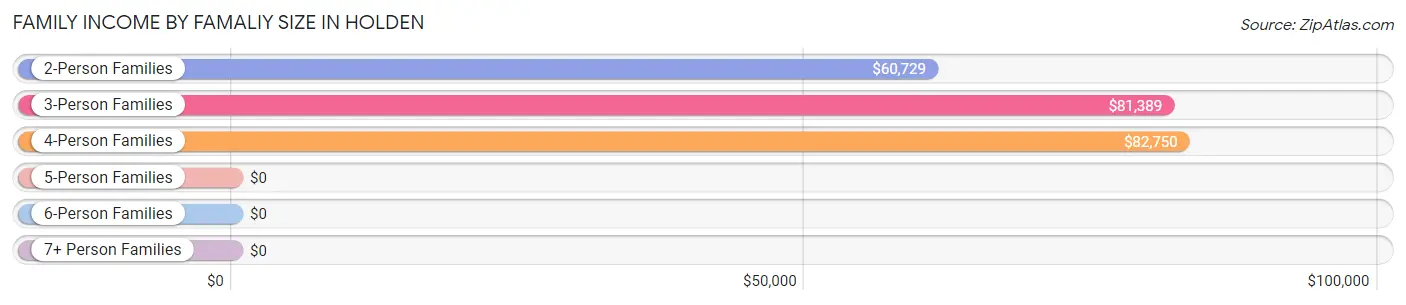
| Income Bracket | # Families | Median Income |
| 2-Person Families | 247 (46.3%) | $60,729 |
| 3-Person Families | 152 (28.5%) | $81,389 |
| 4-Person Families | 95 (17.8%) | $82,750 |
| 5-Person Families | 24 (4.5%) | $0 |
| 6-Person Families | 11 (2.1%) | $0 |
| 7+ Person Families | 5 (0.9%) | $0 |
| Total | 534 (100.0%) | $67,500 |
Family Income by Number of Earners in Holden
The median family income in Holden is $67,500, with families comprising 3+ earners (43) having the highest median family income of $132,083, while families with no earners (81) have the lowest median family income of $40,750, accounting for 8.1% and 15.2% of families, respectively.
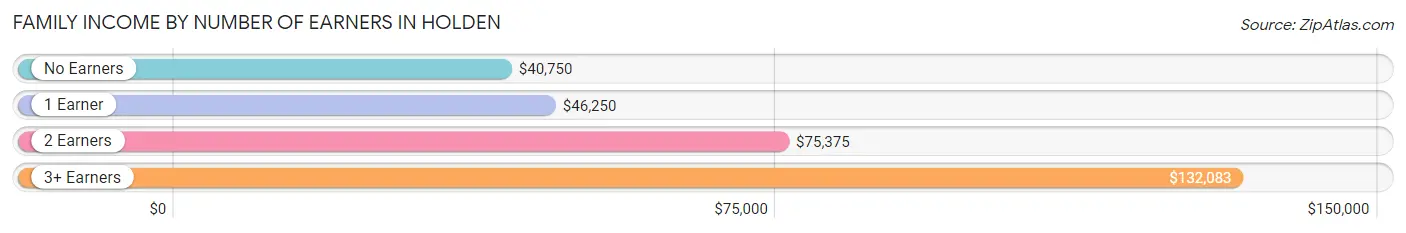
| Number of Earners | # Families | Median Income |
| No Earners | 81 (15.2%) | $40,750 |
| 1 Earner | 217 (40.6%) | $46,250 |
| 2 Earners | 193 (36.1%) | $75,375 |
| 3+ Earners | 43 (8.1%) | $132,083 |
| Total | 534 (100.0%) | $67,500 |
Household Income in Holden
Household Income Brackets in Holden
With 215 households falling in the category, the $50,000 to $74,999 income range is the most frequent in Holden, accounting for 28.4% of all households.
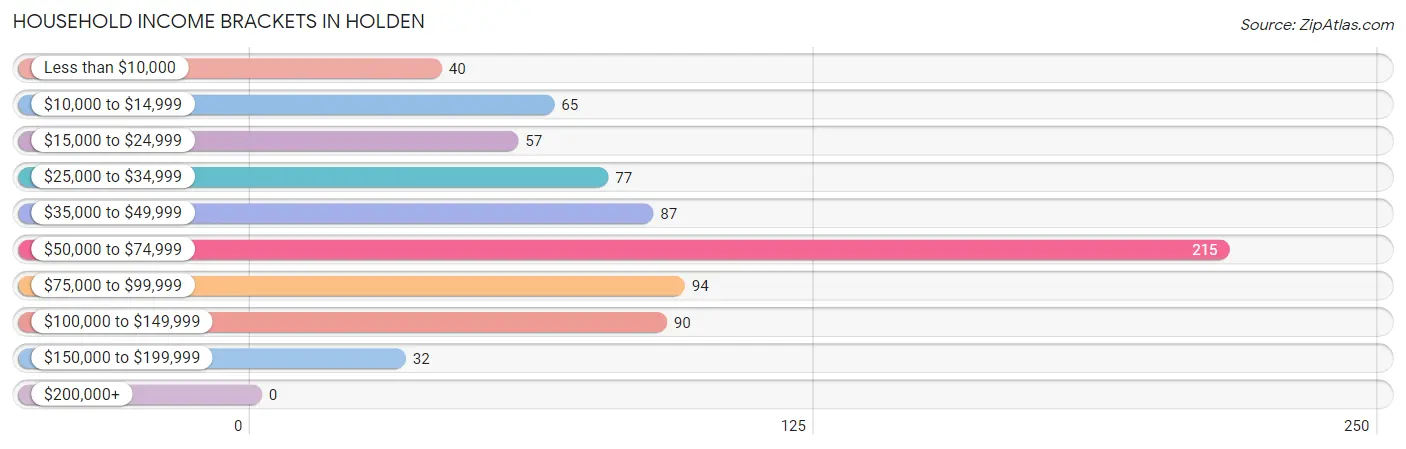
| Income Bracket | # Households | % Households |
| Less than $10,000 | 40 | 5.3% |
| $10,000 to $14,999 | 65 | 8.6% |
| $15,000 to $24,999 | 57 | 7.5% |
| $25,000 to $34,999 | 77 | 10.2% |
| $35,000 to $49,999 | 87 | 11.5% |
| $50,000 to $74,999 | 215 | 28.4% |
| $75,000 to $99,999 | 94 | 12.4% |
| $100,000 to $149,999 | 90 | 11.9% |
| $150,000 to $199,999 | 32 | 4.2% |
| $200,000+ | 0 | 0.0% |
Household Income by Householder Age in Holden
The median household income in Holden is $58,661, with the highest median household income of $65,208 found in the 45 to 64 years age bracket for the primary householder. A total of 295 households (39.0%) fall into this category. Meanwhile, the 15 to 24 years age bracket for the primary householder has the lowest median household income of $0, with 22 households (2.9%) in this group.
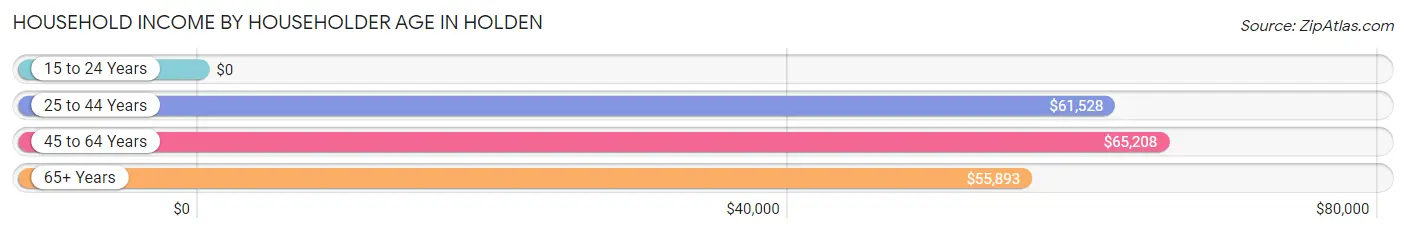
| Income Bracket | # Households | Median Income |
| 15 to 24 Years | 22 (2.9%) | $0 |
| 25 to 44 Years | 243 (32.1%) | $61,528 |
| 45 to 64 Years | 295 (39.0%) | $65,208 |
| 65+ Years | 197 (26.0%) | $55,893 |
| Total | 757 (100.0%) | $58,661 |
Poverty in Holden
Income Below Poverty by Sex and Age in Holden
With 11.6% poverty level for males and 14.6% for females among the residents of Holden, 15 year old males and 45 to 54 year old females are the most vulnerable to poverty, with 5 males (45.5%) and 32 females (27.4%) in their respective age groups living below the poverty level.
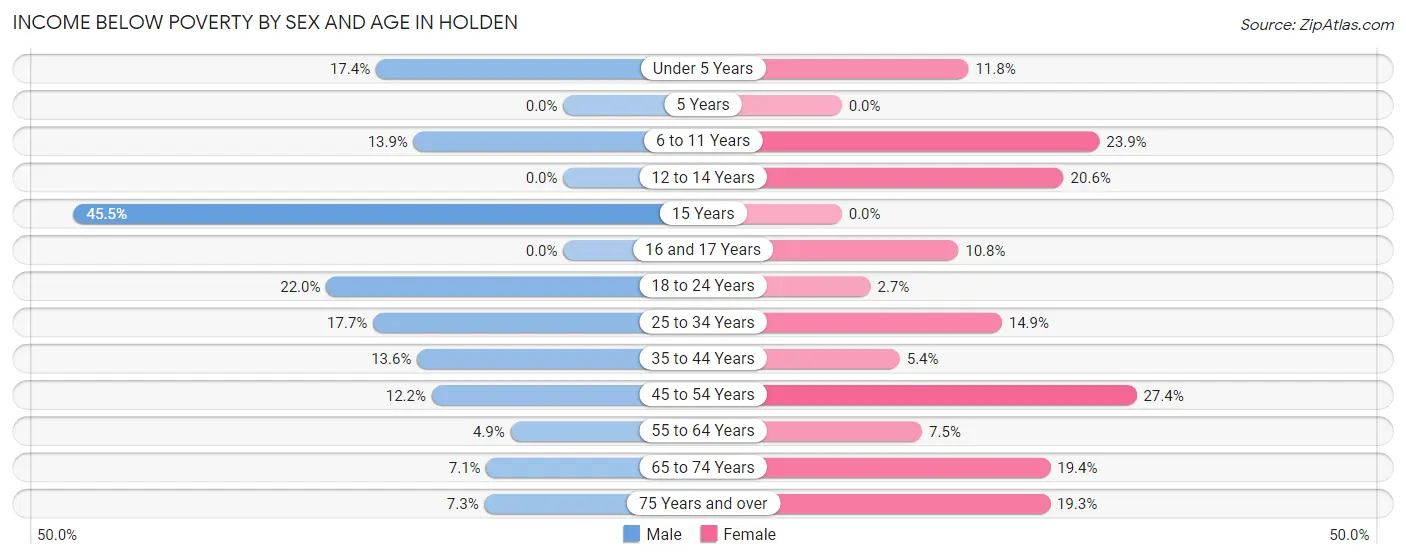
| Age Bracket | Male | Female |
| Under 5 Years | 8 (17.4%) | 6 (11.8%) |
| 5 Years | 0 (0.0%) | 0 (0.0%) |
| 6 to 11 Years | 10 (13.9%) | 22 (23.9%) |
| 12 to 14 Years | 0 (0.0%) | 7 (20.6%) |
| 15 Years | 5 (45.5%) | 0 (0.0%) |
| 16 and 17 Years | 0 (0.0%) | 4 (10.8%) |
| 18 to 24 Years | 11 (22.0%) | 2 (2.7%) |
| 25 to 34 Years | 24 (17.6%) | 15 (14.8%) |
| 35 to 44 Years | 16 (13.6%) | 5 (5.4%) |
| 45 to 54 Years | 16 (12.2%) | 32 (27.4%) |
| 55 to 64 Years | 5 (4.9%) | 10 (7.5%) |
| 65 to 74 Years | 5 (7.1%) | 12 (19.4%) |
| 75 Years and over | 3 (7.3%) | 17 (19.3%) |
| Total | 103 (11.6%) | 132 (14.6%) |
Income Above Poverty by Sex and Age in Holden
According to the poverty statistics in Holden, males aged 5 years and females aged 5 years are the age groups that are most secure financially, with 100.0% of males and 100.0% of females in these age groups living above the poverty line.
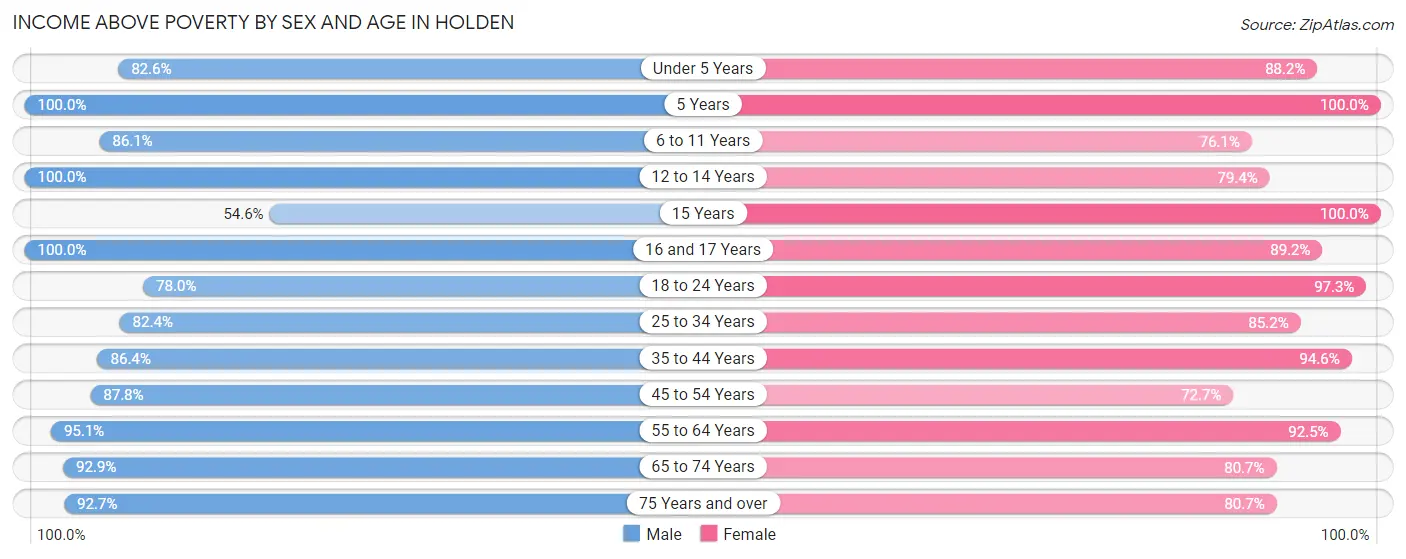
| Age Bracket | Male | Female |
| Under 5 Years | 38 (82.6%) | 45 (88.2%) |
| 5 Years | 19 (100.0%) | 5 (100.0%) |
| 6 to 11 Years | 62 (86.1%) | 70 (76.1%) |
| 12 to 14 Years | 60 (100.0%) | 27 (79.4%) |
| 15 Years | 6 (54.5%) | 13 (100.0%) |
| 16 and 17 Years | 29 (100.0%) | 33 (89.2%) |
| 18 to 24 Years | 39 (78.0%) | 73 (97.3%) |
| 25 to 34 Years | 112 (82.4%) | 86 (85.2%) |
| 35 to 44 Years | 102 (86.4%) | 88 (94.6%) |
| 45 to 54 Years | 115 (87.8%) | 85 (72.7%) |
| 55 to 64 Years | 97 (95.1%) | 124 (92.5%) |
| 65 to 74 Years | 65 (92.9%) | 50 (80.6%) |
| 75 Years and over | 38 (92.7%) | 71 (80.7%) |
| Total | 782 (88.4%) | 770 (85.4%) |
Income Below Poverty Among Married-Couple Families in Holden
The poverty statistics for married-couple families in Holden show that 6.4% or 22 of the total 344 families live below the poverty line. Families with 5 or more children have the highest poverty rate of 100.0%, comprising of 5 families. On the other hand, families with no children have the lowest poverty rate of 0.0%, which includes 0 families.
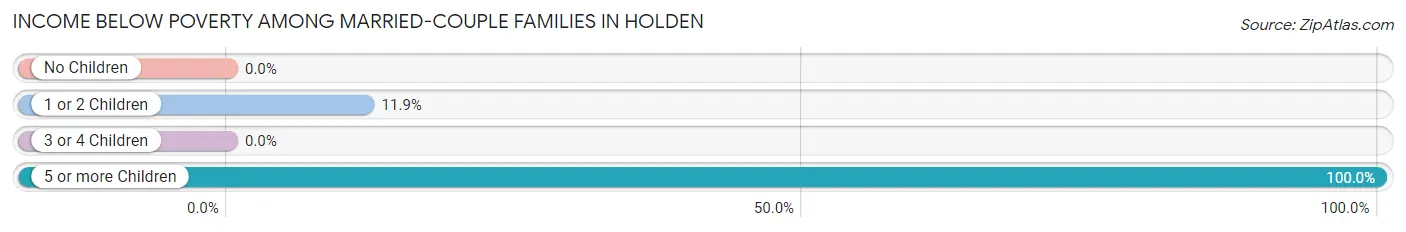
| Children | Above Poverty | Below Poverty |
| No Children | 179 (100.0%) | 0 (0.0%) |
| 1 or 2 Children | 126 (88.1%) | 17 (11.9%) |
| 3 or 4 Children | 17 (100.0%) | 0 (0.0%) |
| 5 or more Children | 0 (0.0%) | 5 (100.0%) |
| Total | 322 (93.6%) | 22 (6.4%) |
Income Below Poverty Among Single-Parent Households in Holden
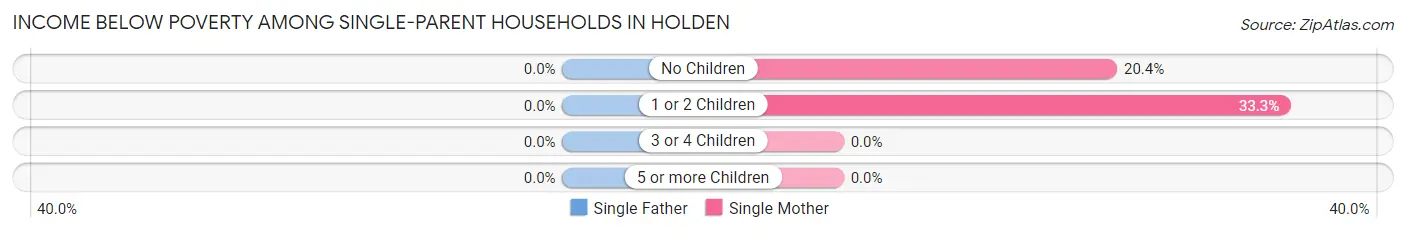
| Children | Single Father | Single Mother |
| No Children | 0 (0.0%) | 11 (20.4%) |
| 1 or 2 Children | 0 (0.0%) | 17 (33.3%) |
| 3 or 4 Children | 0 (0.0%) | 0 (0.0%) |
| 5 or more Children | 0 (0.0%) | 0 (0.0%) |
| Total | 0 (0.0%) | 28 (24.8%) |
Income Below Poverty Among Married-Couple vs Single-Parent Households in Holden
The poverty data for Holden shows that 22 of the married-couple family households (6.4%) and 28 of the single-parent households (14.7%) are living below the poverty level. Within the married-couple family households, those with 5 or more children have the highest poverty rate, with 5 households (100.0%) falling below the poverty line. Among the single-parent households, those with no children have the highest poverty rate, with 11 household (18.3%) living below poverty.
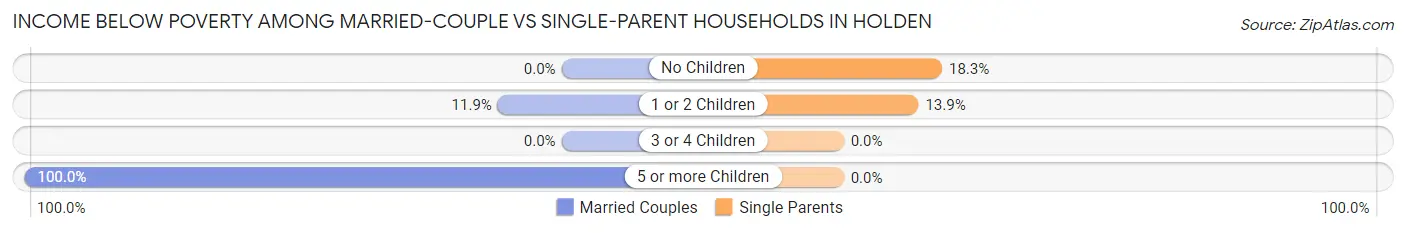
| Children | Married-Couple Families | Single-Parent Households |
| No Children | 0 (0.0%) | 11 (18.3%) |
| 1 or 2 Children | 17 (11.9%) | 17 (13.9%) |
| 3 or 4 Children | 0 (0.0%) | 0 (0.0%) |
| 5 or more Children | 5 (100.0%) | 0 (0.0%) |
| Total | 22 (6.4%) | 28 (14.7%) |
Race in Holden
The most populous races in Holden are White / Caucasian (1,658 | 90.1%), Hispanic or Latino (122 | 6.6%), and Some other Race (89 | 4.8%).
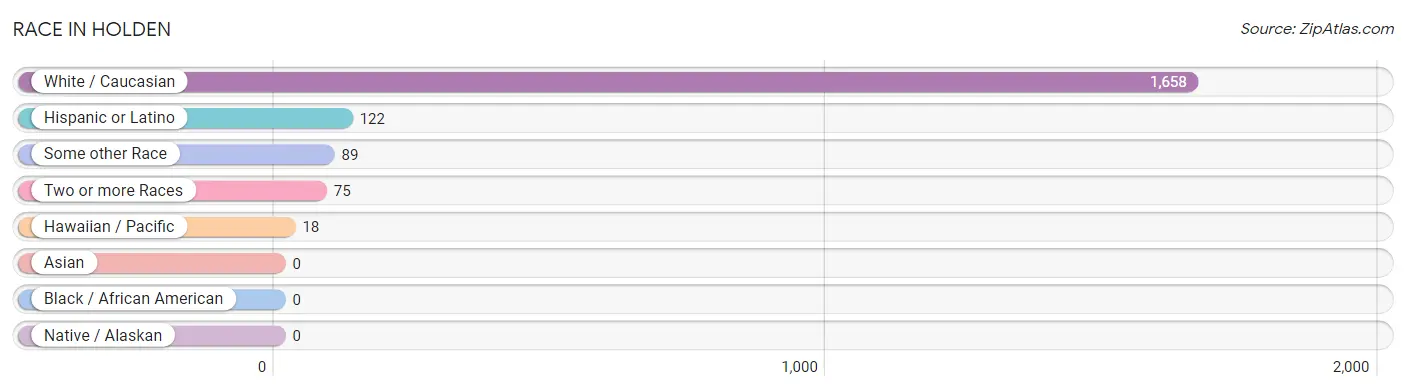
| Race | # Population | % Population |
| Asian | 0 | 0.0% |
| Black / African American | 0 | 0.0% |
| Hawaiian / Pacific | 18 | 1.0% |
| Hispanic or Latino | 122 | 6.6% |
| Native / Alaskan | 0 | 0.0% |
| White / Caucasian | 1,658 | 90.1% |
| Two or more Races | 75 | 4.1% |
| Some other Race | 89 | 4.8% |
| Total | 1,840 | 100.0% |
Ancestry in Holden
The most populous ancestries reported in Holden are German (443 | 24.1%), Irish (240 | 13.0%), English (239 | 13.0%), American (128 | 7.0%), and Mexican (100 | 5.4%), together accounting for 62.5% of all Holden residents.
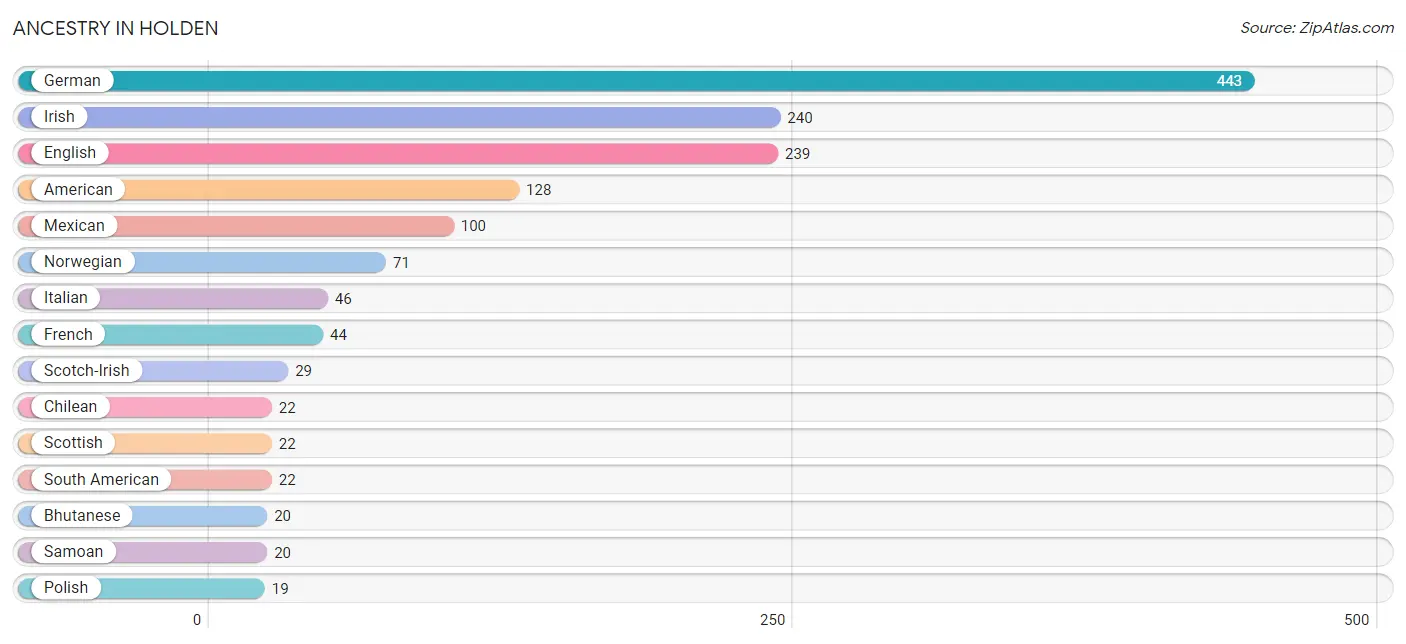
| Ancestry | # Population | % Population |
| American | 128 | 7.0% |
| Belgian | 2 | 0.1% |
| Bhutanese | 20 | 1.1% |
| Blackfeet | 7 | 0.4% |
| British | 5 | 0.3% |
| Celtic | 5 | 0.3% |
| Cherokee | 8 | 0.4% |
| Chilean | 22 | 1.2% |
| Croatian | 3 | 0.2% |
| Czech | 4 | 0.2% |
| Dutch | 18 | 1.0% |
| English | 239 | 13.0% |
| European | 11 | 0.6% |
| French | 44 | 2.4% |
| French Canadian | 6 | 0.3% |
| German | 443 | 24.1% |
| Irish | 240 | 13.0% |
| Italian | 46 | 2.5% |
| Latvian | 4 | 0.2% |
| Mexican | 100 | 5.4% |
| Navajo | 4 | 0.2% |
| Norwegian | 71 | 3.9% |
| Polish | 19 | 1.0% |
| Portuguese | 6 | 0.3% |
| Samoan | 20 | 1.1% |
| Scotch-Irish | 29 | 1.6% |
| Scottish | 22 | 1.2% |
| South American | 22 | 1.2% |
| Swedish | 11 | 0.6% |
| Swiss | 6 | 0.3% | View All 30 Rows |
Immigrants in Holden
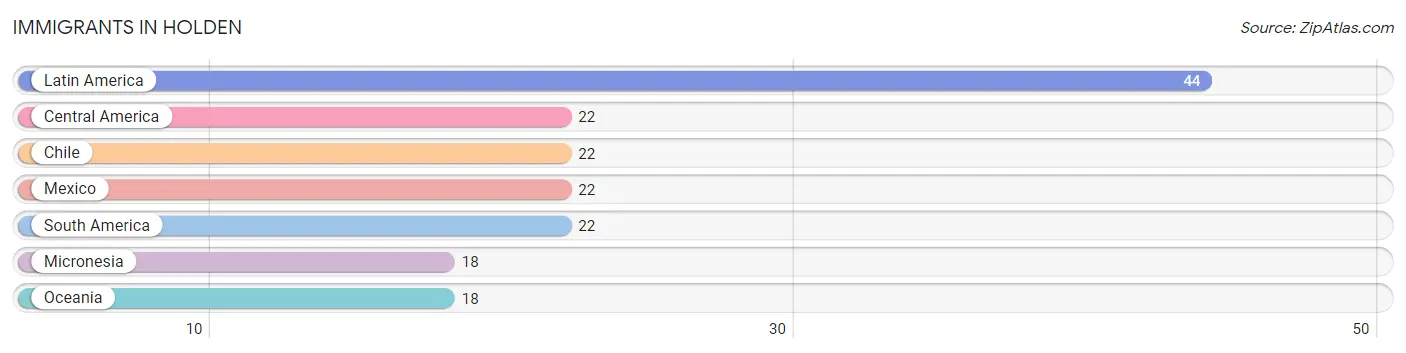
The most numerous immigrant groups reported in Holden came from Latin America (44 | 2.4%), Central America (22 | 1.2%), Chile (22 | 1.2%), Mexico (22 | 1.2%), and South America (22 | 1.2%), together accounting for 7.2% of all Holden residents.
| Immigration Origin | # Population | % Population |
| Central America | 22 | 1.2% |
| Chile | 22 | 1.2% |
| Latin America | 44 | 2.4% |
| Mexico | 22 | 1.2% |
| Micronesia | 18 | 1.0% |
| Oceania | 18 | 1.0% |
| South America | 22 | 1.2% | View All 7 Rows |
Sex and Age in Holden
Sex and Age in Holden
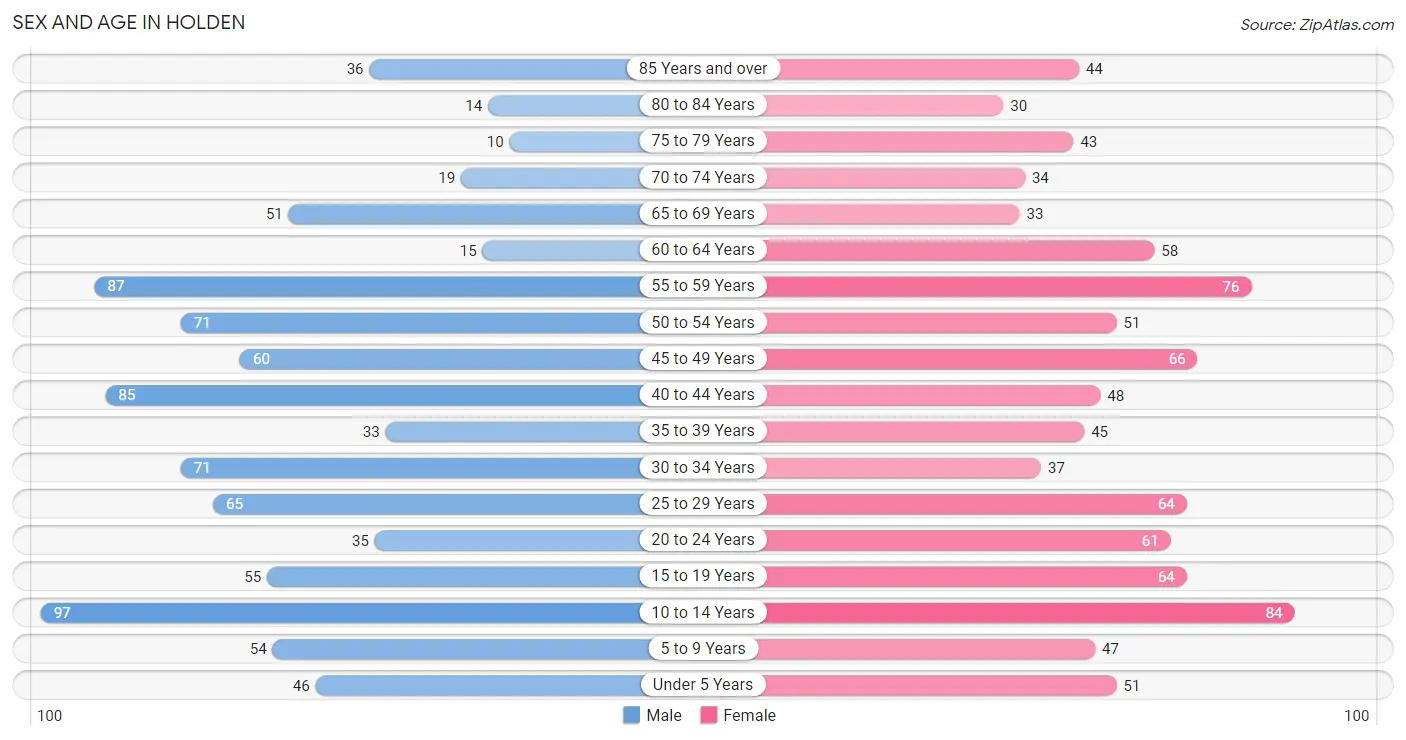
The most populous age groups in Holden are 10 to 14 Years (97 | 10.7%) for men and 10 to 14 Years (84 | 9.0%) for women.
| Age Bracket | Male | Female |
| Under 5 Years | 46 (5.1%) | 51 (5.4%) |
| 5 to 9 Years | 54 (6.0%) | 47 (5.0%) |
| 10 to 14 Years | 97 (10.7%) | 84 (9.0%) |
| 15 to 19 Years | 55 (6.1%) | 64 (6.8%) |
| 20 to 24 Years | 35 (3.9%) | 61 (6.5%) |
| 25 to 29 Years | 65 (7.2%) | 64 (6.8%) |
| 30 to 34 Years | 71 (7.9%) | 37 (4.0%) |
| 35 to 39 Years | 33 (3.6%) | 45 (4.8%) |
| 40 to 44 Years | 85 (9.4%) | 48 (5.1%) |
| 45 to 49 Years | 60 (6.6%) | 66 (7.0%) |
| 50 to 54 Years | 71 (7.9%) | 51 (5.4%) |
| 55 to 59 Years | 87 (9.6%) | 76 (8.1%) |
| 60 to 64 Years | 15 (1.7%) | 58 (6.2%) |
| 65 to 69 Years | 51 (5.6%) | 33 (3.5%) |
| 70 to 74 Years | 19 (2.1%) | 34 (3.6%) |
| 75 to 79 Years | 10 (1.1%) | 43 (4.6%) |
| 80 to 84 Years | 14 (1.5%) | 30 (3.2%) |
| 85 Years and over | 36 (4.0%) | 44 (4.7%) |
| Total | 904 (100.0%) | 936 (100.0%) |
Families and Households in Holden
Median Family Size in Holden
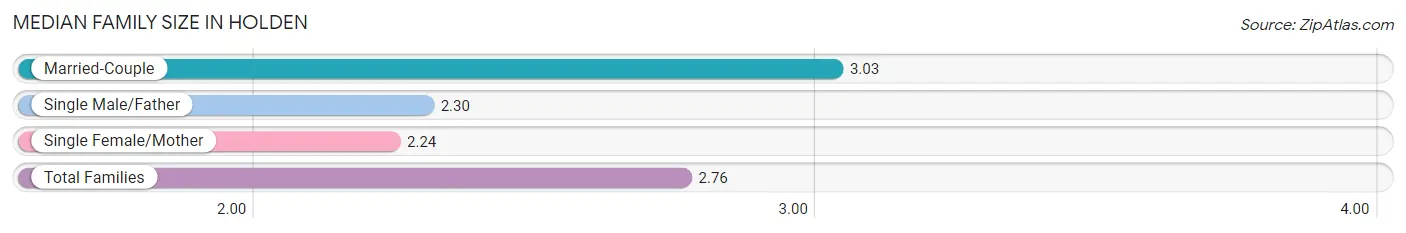
The median family size in Holden is 2.76 persons per family, with married-couple families (344 | 64.4%) accounting for the largest median family size of 3.03 persons per family. On the other hand, single female/mother families (113 | 21.2%) represent the smallest median family size with 2.24 persons per family.
| Family Type | # Families | Family Size |
| Married-Couple | 344 (64.4%) | 3.03 |
| Single Male/Father | 77 (14.4%) | 2.30 |
| Single Female/Mother | 113 (21.2%) | 2.24 |
| Total Families | 534 (100.0%) | 2.76 |
Median Household Size in Holden
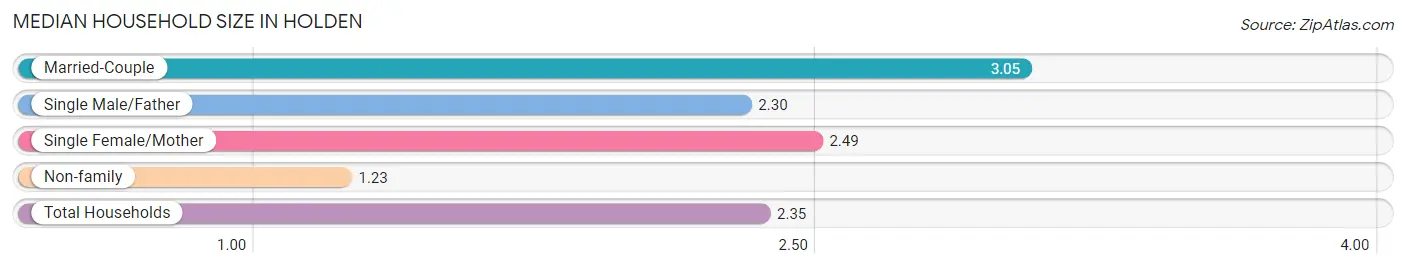
The median household size in Holden is 2.35 persons per household, with married-couple households (344 | 45.4%) accounting for the largest median household size of 3.05 persons per household. non-family households (223 | 29.5%) represent the smallest median household size with 1.23 persons per household.
| Household Type | # Households | Household Size |
| Married-Couple | 344 (45.4%) | 3.05 |
| Single Male/Father | 77 (10.2%) | 2.30 |
| Single Female/Mother | 113 (14.9%) | 2.49 |
| Non-family | 223 (29.5%) | 1.23 |
| Total Households | 757 (100.0%) | 2.35 |
Household Size by Marriage Status in Holden
Out of a total of 757 households in Holden, 534 (70.5%) are family households, while 223 (29.5%) are nonfamily households. The most numerous type of family households are 2-person households, comprising 230, and the most common type of nonfamily households are 1-person households, comprising 169.
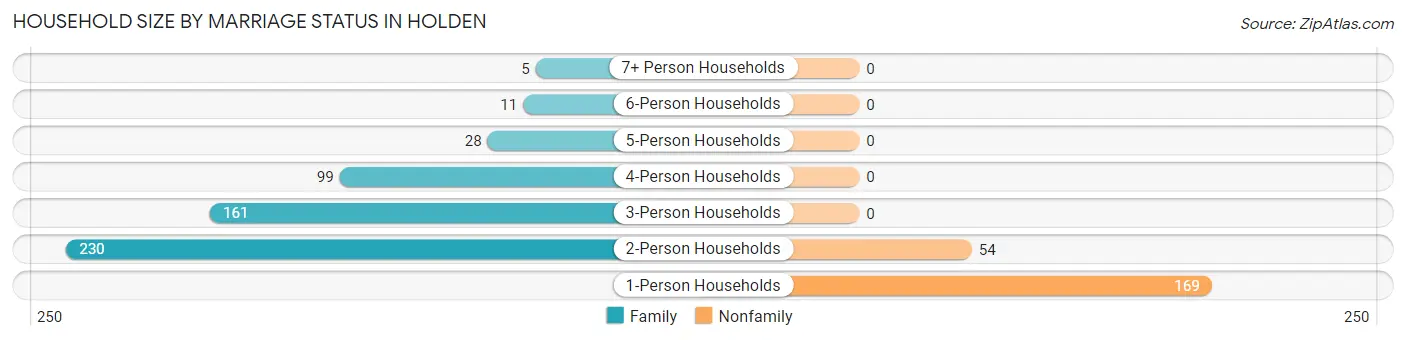
| Household Size | Family Households | Nonfamily Households |
| 1-Person Households | - | 169 (22.3%) |
| 2-Person Households | 230 (30.4%) | 54 (7.1%) |
| 3-Person Households | 161 (21.3%) | 0 (0.0%) |
| 4-Person Households | 99 (13.1%) | 0 (0.0%) |
| 5-Person Households | 28 (3.7%) | 0 (0.0%) |
| 6-Person Households | 11 (1.5%) | 0 (0.0%) |
| 7+ Person Households | 5 (0.7%) | 0 (0.0%) |
| Total | 534 (70.5%) | 223 (29.5%) |
Female Fertility in Holden
Fertility by Age in Holden
Average fertility rate in Holden is 38.0 births per 1,000 women. Women in the age bracket of 20 to 34 years have the highest fertility rate with 80.0 births per 1,000 women. Women in the age bracket of 20 to 34 years acount for 86.7% of all women with births.
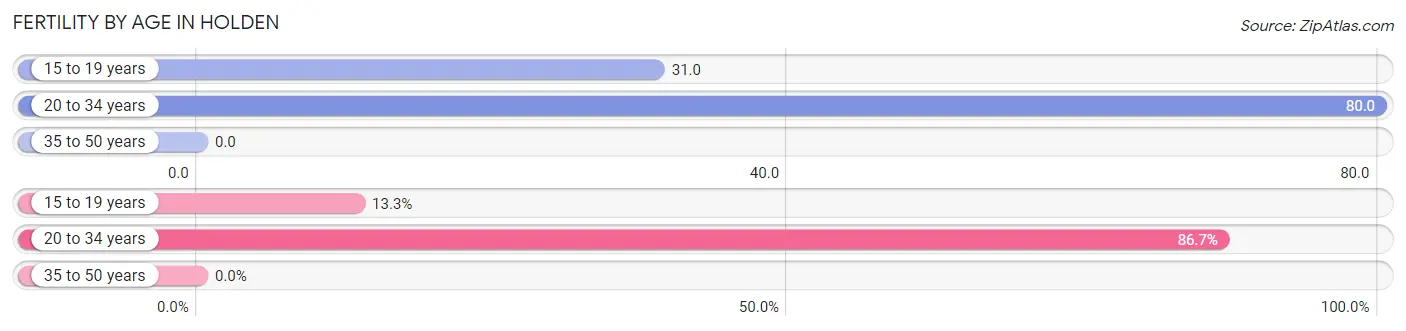
| Age Bracket | Women with Births | Births / 1,000 Women |
| 15 to 19 years | 2 (13.3%) | 31.0 |
| 20 to 34 years | 13 (86.7%) | 80.0 |
| 35 to 50 years | 0 (0.0%) | 0.0 |
| Total | 15 (100.0%) | 38.0 |
Fertility by Age by Marriage Status in Holden
86.7% of women with births (15) in Holden are married. The highest percentage of unmarried women with births falls into 15 to 19 years age bracket with 100.0% of them unmarried at the time of birth, while the lowest percentage of unmarried women with births belong to 20 to 34 years age bracket with 0.0% of them unmarried.
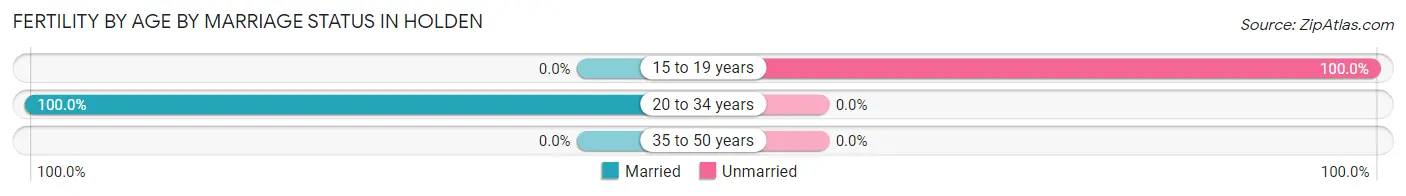
| Age Bracket | Married | Unmarried |
| 15 to 19 years | 0 (0.0%) | 2 (100.0%) |
| 20 to 34 years | 13 (100.0%) | 0 (0.0%) |
| 35 to 50 years | 0 (0.0%) | 0 (0.0%) |
| Total | 13 (86.7%) | 2 (13.3%) |
Fertility by Education in Holden
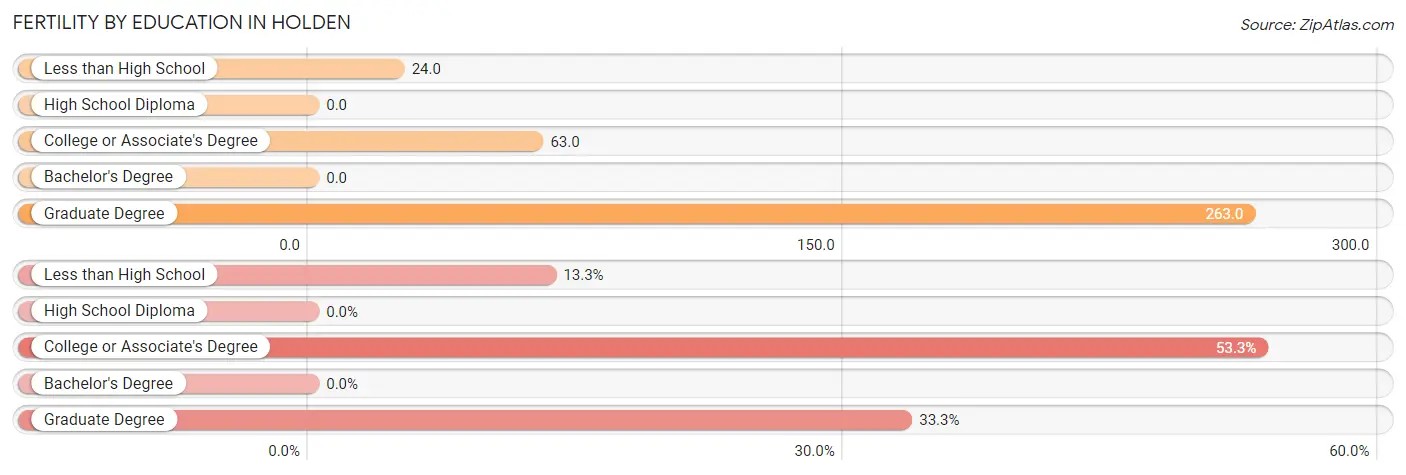
| Educational Attainment | Women with Births | Births / 1,000 Women |
| Less than High School | 2 (13.3%) | 24.0 |
| High School Diploma | 0 (0.0%) | 0.0 |
| College or Associate's Degree | 8 (53.3%) | 63.0 |
| Bachelor's Degree | 0 (0.0%) | 0.0 |
| Graduate Degree | 5 (33.3%) | 263.0 |
| Total | 15 (100.0%) | 38.0 |
Fertility by Education by Marriage Status in Holden
13.3% of women with births in Holden are unmarried. Women with the educational attainment of college or associate's degree are most likely to be married with 100.0% of them married at childbirth, while women with the educational attainment of less than high school are least likely to be married with 100.0% of them unmarried at childbirth.
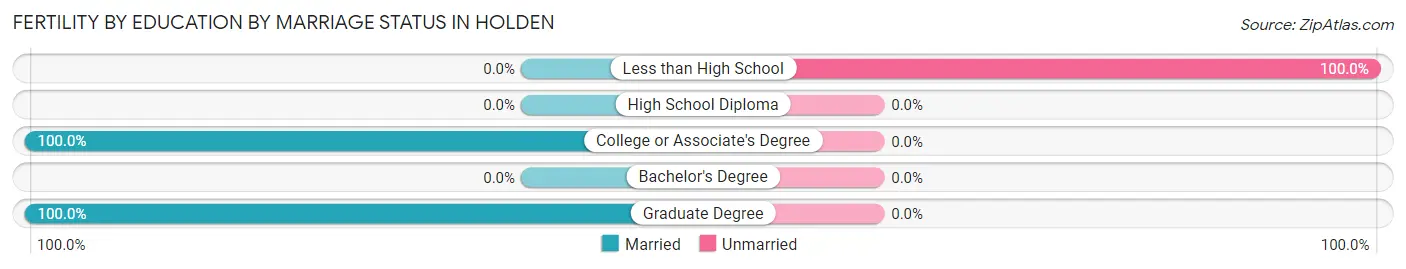
| Educational Attainment | Married | Unmarried |
| Less than High School | 0 (0.0%) | 2 (100.0%) |
| High School Diploma | 0 (0.0%) | 0 (0.0%) |
| College or Associate's Degree | 8 (100.0%) | 0 (0.0%) |
| Bachelor's Degree | 0 (0.0%) | 0 (0.0%) |
| Graduate Degree | 5 (100.0%) | 0 (0.0%) |
| Total | 13 (86.7%) | 2 (13.3%) |
Employment Characteristics in Holden
Employment by Class of Employer in Holden
Among the 845 employed individuals in Holden, private company employees (611 | 72.3%), local government employees (66 | 7.8%), and self-employed (not incorporated) (49 | 5.8%) make up the most common classes of employment.
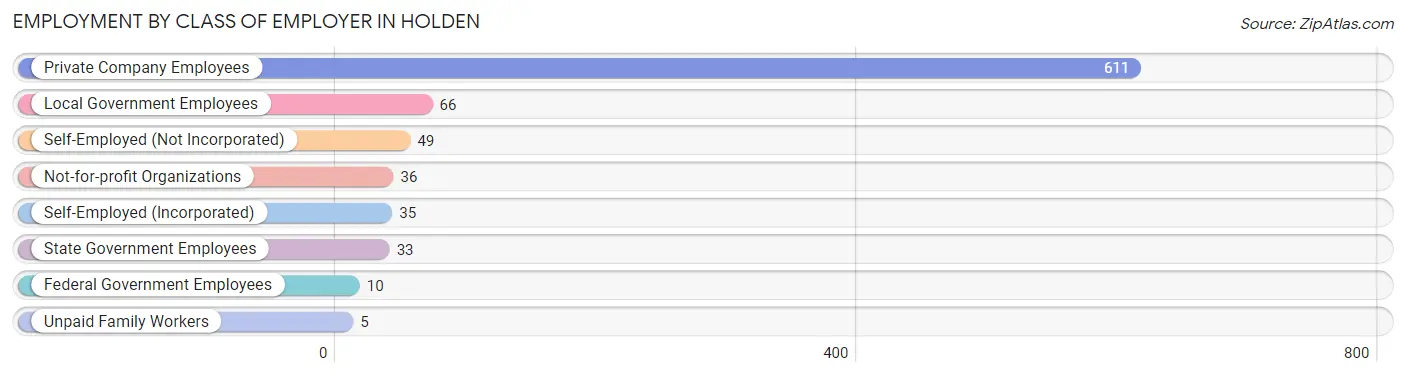
| Employer Class | # Employees | % Employees |
| Private Company Employees | 611 | 72.3% |
| Self-Employed (Incorporated) | 35 | 4.1% |
| Self-Employed (Not Incorporated) | 49 | 5.8% |
| Not-for-profit Organizations | 36 | 4.3% |
| Local Government Employees | 66 | 7.8% |
| State Government Employees | 33 | 3.9% |
| Federal Government Employees | 10 | 1.2% |
| Unpaid Family Workers | 5 | 0.6% |
| Total | 845 | 100.0% |
Employment Status by Age in Holden
According to the labor force statistics for Holden, out of the total population over 16 years of age (1,437), 62.6% or 900 individuals are in the labor force, with 5.4% or 49 of them unemployed. The age group with the highest labor force participation rate is 20 to 24 years, with 94.8% or 91 individuals in the labor force. Within the labor force, the 16 to 19 years age range has the highest percentage of unemployed individuals, with 27.5% or 11 of them being unemployed.
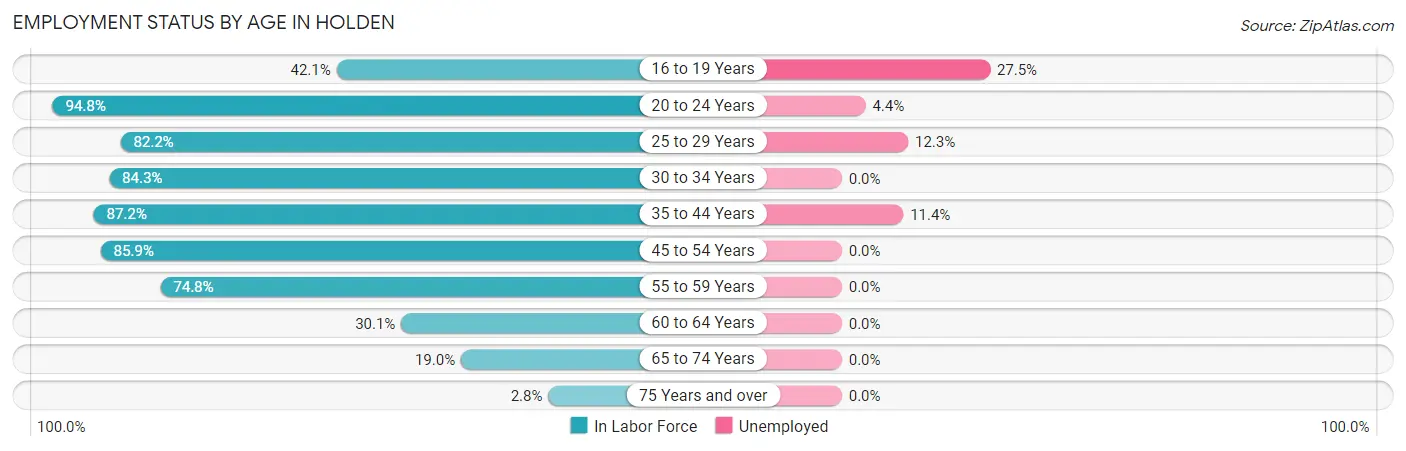
| Age Bracket | In Labor Force | Unemployed |
| 16 to 19 Years | 40 (42.1%) | 11 (27.5%) |
| 20 to 24 Years | 91 (94.8%) | 4 (4.4%) |
| 25 to 29 Years | 106 (82.2%) | 13 (12.3%) |
| 30 to 34 Years | 91 (84.3%) | 0 (0.0%) |
| 35 to 44 Years | 184 (87.2%) | 21 (11.4%) |
| 45 to 54 Years | 213 (85.9%) | 0 (0.0%) |
| 55 to 59 Years | 122 (74.8%) | 0 (0.0%) |
| 60 to 64 Years | 22 (30.1%) | 0 (0.0%) |
| 65 to 74 Years | 26 (19.0%) | 0 (0.0%) |
| 75 Years and over | 5 (2.8%) | 0 (0.0%) |
| Total | 900 (62.6%) | 49 (5.4%) |
Employment Status by Educational Attainment in Holden
According to labor force statistics for Holden, 79.2% of individuals (738) out of the total population between 25 and 64 years of age (932) are in the labor force, with 4.6% or 34 of them being unemployed. The group with the highest labor force participation rate are those with the educational attainment of bachelor's degree or higher, with 89.3% or 117 individuals in the labor force. Within the labor force, individuals with less than high school education have the highest percentage of unemployment, with 8.6% or 5 of them being unemployed.
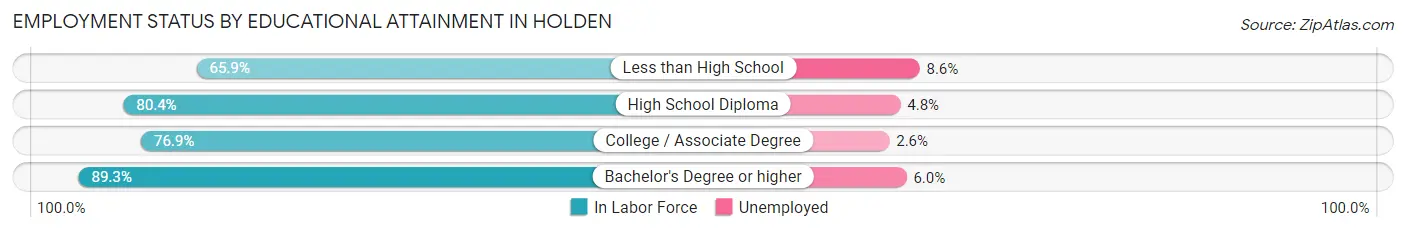
| Educational Attainment | In Labor Force | Unemployed |
| Less than High School | 58 (65.9%) | 8 (8.6%) |
| High School Diploma | 333 (80.4%) | 20 (4.8%) |
| College / Associate Degree | 230 (76.9%) | 8 (2.6%) |
| Bachelor's Degree or higher | 117 (89.3%) | 8 (6.0%) |
| Total | 738 (79.2%) | 43 (4.6%) |
Employment Occupations by Sex in Holden
Management, Business, Science and Arts Occupations
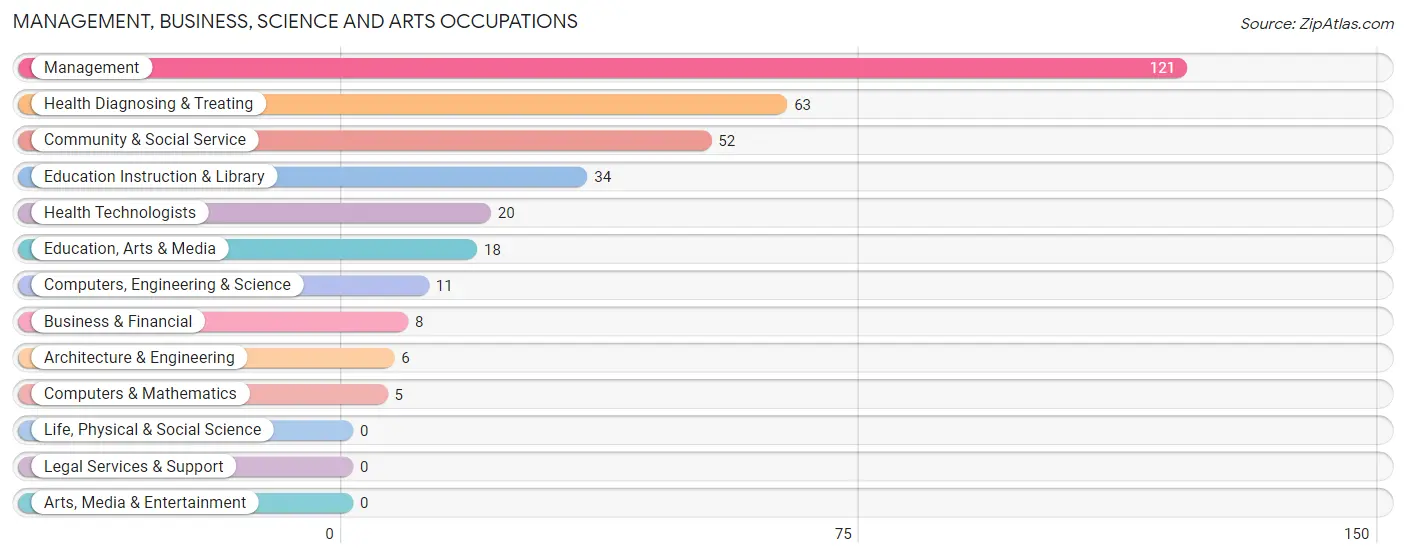
The most common Management, Business, Science and Arts occupations in Holden are Management (121 | 14.2%), Health Diagnosing & Treating (63 | 7.4%), Community & Social Service (52 | 6.1%), Education Instruction & Library (34 | 4.0%), and Health Technologists (20 | 2.4%).
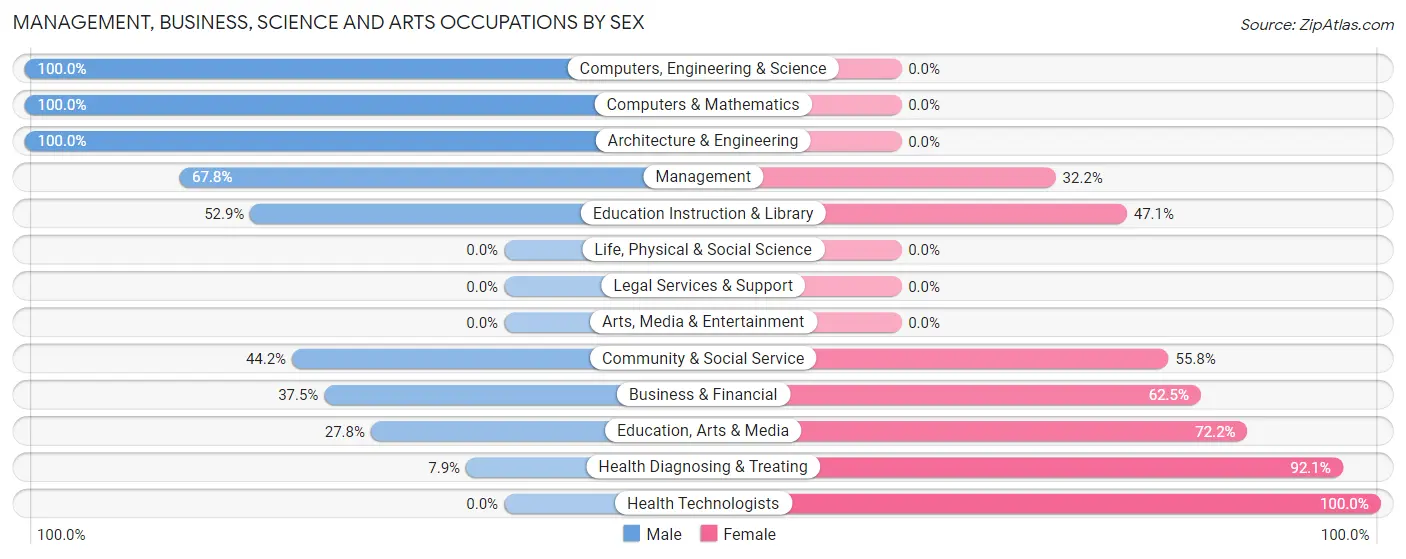
Management, Business, Science and Arts Occupations by Sex
Within the Management, Business, Science and Arts occupations in Holden, the most male-oriented occupations are Computers, Engineering & Science (100.0%), Computers & Mathematics (100.0%), and Architecture & Engineering (100.0%), while the most female-oriented occupations are Health Technologists (100.0%), Health Diagnosing & Treating (92.1%), and Education, Arts & Media (72.2%).
| Occupation | Male | Female |
| Management | 82 (67.8%) | 39 (32.2%) |
| Business & Financial | 3 (37.5%) | 5 (62.5%) |
| Computers, Engineering & Science | 11 (100.0%) | 0 (0.0%) |
| Computers & Mathematics | 5 (100.0%) | 0 (0.0%) |
| Architecture & Engineering | 6 (100.0%) | 0 (0.0%) |
| Life, Physical & Social Science | 0 (0.0%) | 0 (0.0%) |
| Community & Social Service | 23 (44.2%) | 29 (55.8%) |
| Education, Arts & Media | 5 (27.8%) | 13 (72.2%) |
| Legal Services & Support | 0 (0.0%) | 0 (0.0%) |
| Education Instruction & Library | 18 (52.9%) | 16 (47.1%) |
| Arts, Media & Entertainment | 0 (0.0%) | 0 (0.0%) |
| Health Diagnosing & Treating | 5 (7.9%) | 58 (92.1%) |
| Health Technologists | 0 (0.0%) | 20 (100.0%) |
| Total (Category) | 124 (48.6%) | 131 (51.4%) |
| Total (Overall) | 465 (54.6%) | 386 (45.4%) |
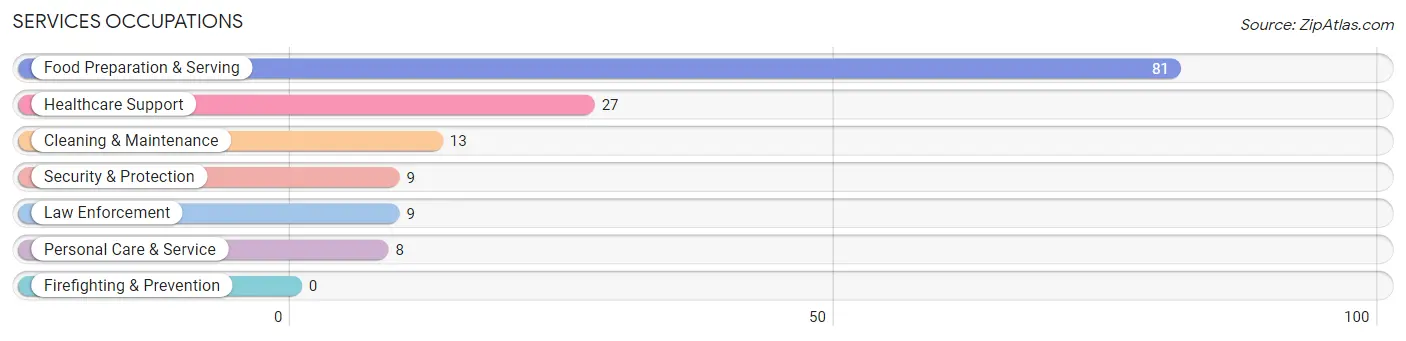
Services Occupations
The most common Services occupations in Holden are Food Preparation & Serving (81 | 9.5%), Healthcare Support (27 | 3.2%), Cleaning & Maintenance (13 | 1.5%), Security & Protection (9 | 1.1%), and Law Enforcement (9 | 1.1%).
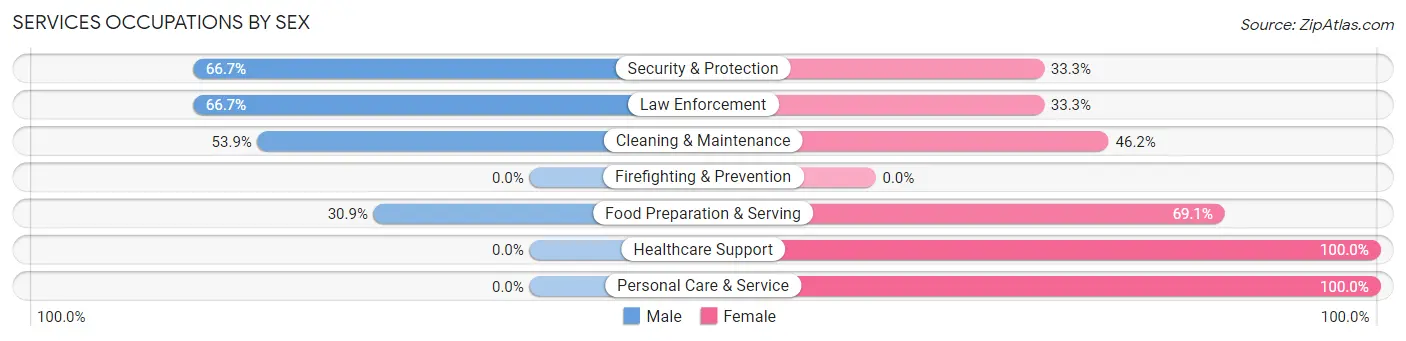
Services Occupations by Sex
Within the Services occupations in Holden, the most male-oriented occupations are Security & Protection (66.7%), Law Enforcement (66.7%), and Cleaning & Maintenance (53.8%), while the most female-oriented occupations are Healthcare Support (100.0%), Personal Care & Service (100.0%), and Food Preparation & Serving (69.1%).
| Occupation | Male | Female |
| Healthcare Support | 0 (0.0%) | 27 (100.0%) |
| Security & Protection | 6 (66.7%) | 3 (33.3%) |
| Firefighting & Prevention | 0 (0.0%) | 0 (0.0%) |
| Law Enforcement | 6 (66.7%) | 3 (33.3%) |
| Food Preparation & Serving | 25 (30.9%) | 56 (69.1%) |
| Cleaning & Maintenance | 7 (53.8%) | 6 (46.2%) |
| Personal Care & Service | 0 (0.0%) | 8 (100.0%) |
| Total (Category) | 38 (27.5%) | 100 (72.5%) |
| Total (Overall) | 465 (54.6%) | 386 (45.4%) |
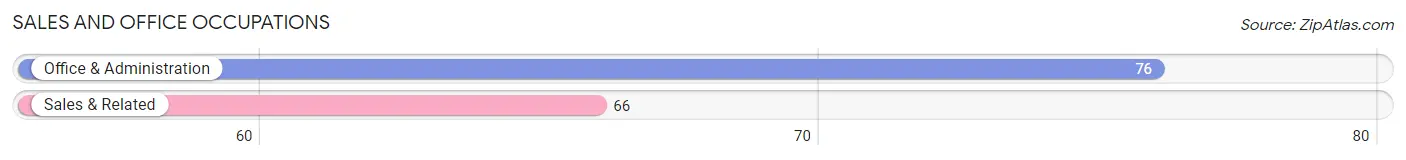
Sales and Office Occupations
The most common Sales and Office occupations in Holden are Office & Administration (76 | 8.9%), and Sales & Related (66 | 7.8%).
Sales and Office Occupations by Sex
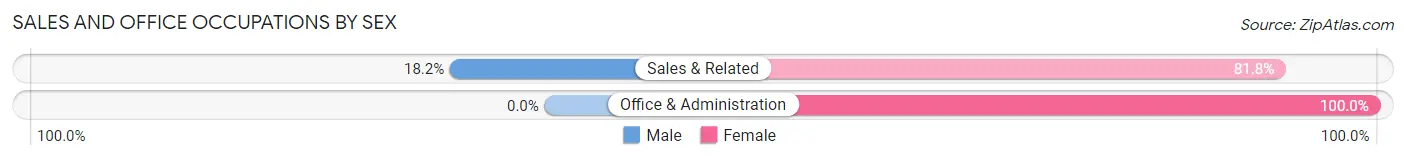
| Occupation | Male | Female |
| Sales & Related | 12 (18.2%) | 54 (81.8%) |
| Office & Administration | 0 (0.0%) | 76 (100.0%) |
| Total (Category) | 12 (8.5%) | 130 (91.5%) |
| Total (Overall) | 465 (54.6%) | 386 (45.4%) |
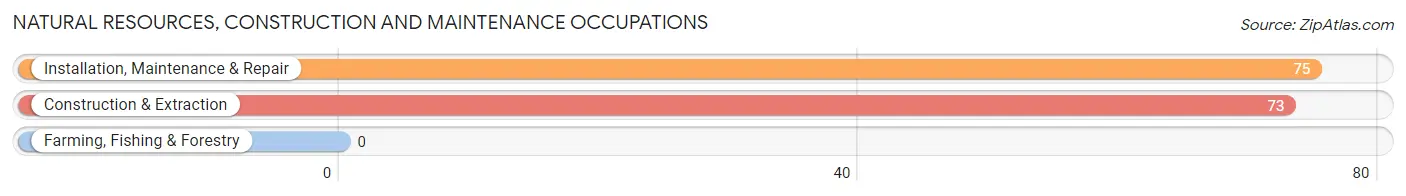
Natural Resources, Construction and Maintenance Occupations
The most common Natural Resources, Construction and Maintenance occupations in Holden are Installation, Maintenance & Repair (75 | 8.8%), and Construction & Extraction (73 | 8.6%).
Natural Resources, Construction and Maintenance Occupations by Sex
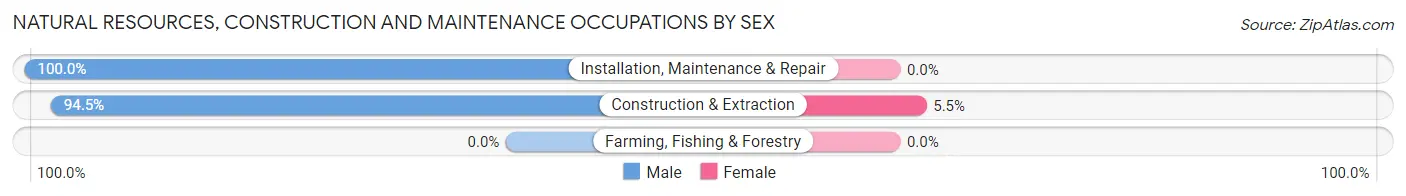
| Occupation | Male | Female |
| Farming, Fishing & Forestry | 0 (0.0%) | 0 (0.0%) |
| Construction & Extraction | 69 (94.5%) | 4 (5.5%) |
| Installation, Maintenance & Repair | 75 (100.0%) | 0 (0.0%) |
| Total (Category) | 144 (97.3%) | 4 (2.7%) |
| Total (Overall) | 465 (54.6%) | 386 (45.4%) |
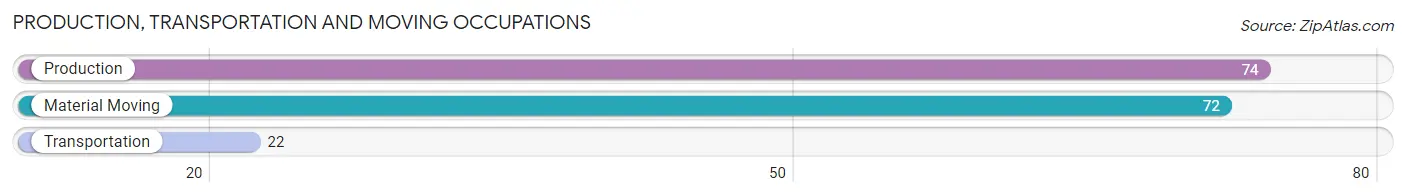
Production, Transportation and Moving Occupations
The most common Production, Transportation and Moving occupations in Holden are Production (74 | 8.7%), Material Moving (72 | 8.5%), and Transportation (22 | 2.6%).
Production, Transportation and Moving Occupations by Sex
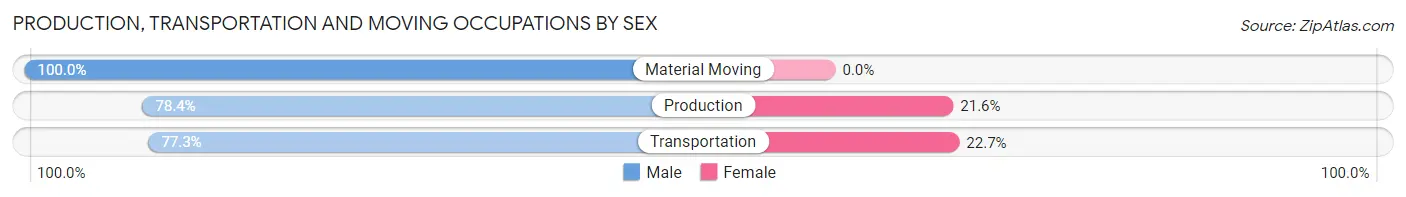
| Occupation | Male | Female |
| Production | 58 (78.4%) | 16 (21.6%) |
| Transportation | 17 (77.3%) | 5 (22.7%) |
| Material Moving | 72 (100.0%) | 0 (0.0%) |
| Total (Category) | 147 (87.5%) | 21 (12.5%) |
| Total (Overall) | 465 (54.6%) | 386 (45.4%) |
Employment Industries by Sex in Holden
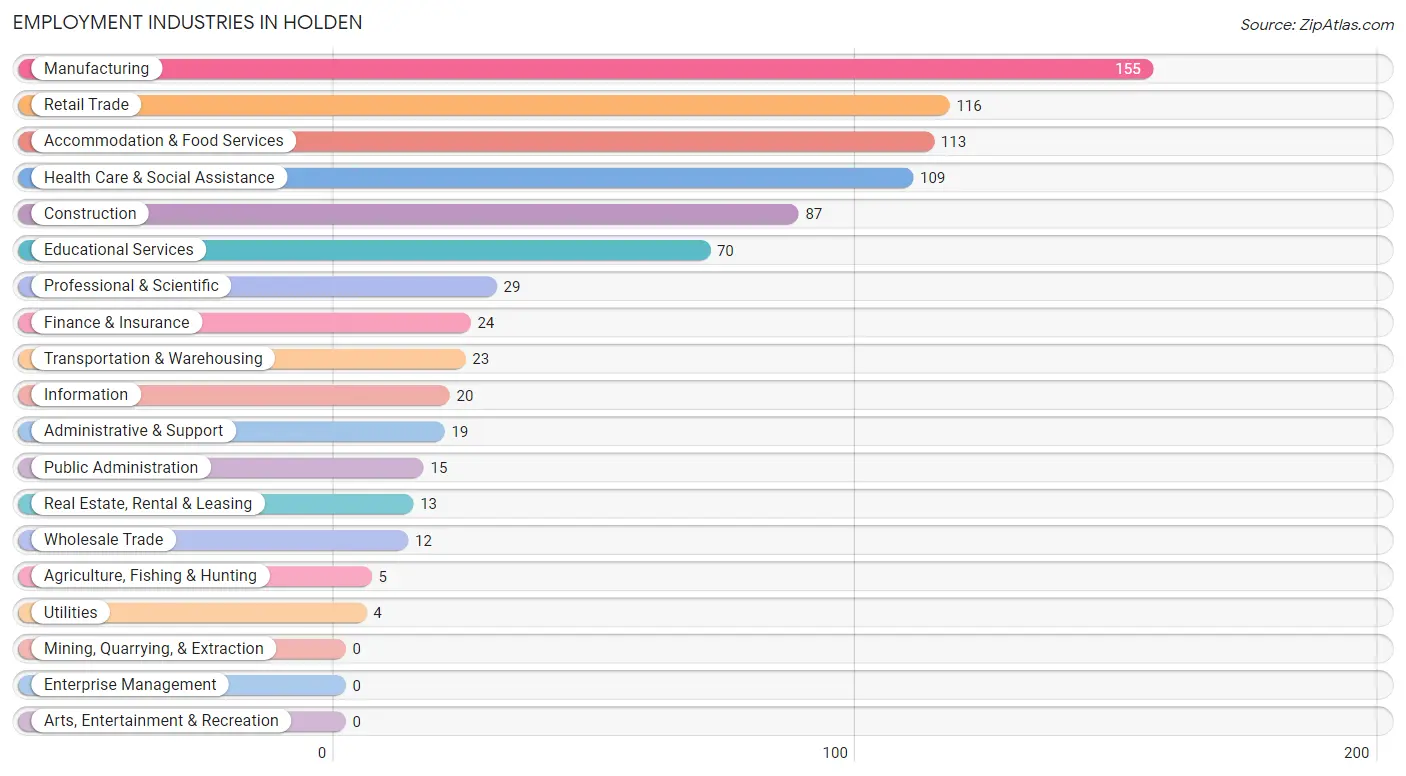
Employment Industries in Holden
The major employment industries in Holden include Manufacturing (155 | 18.2%), Retail Trade (116 | 13.6%), Accommodation & Food Services (113 | 13.3%), Health Care & Social Assistance (109 | 12.8%), and Construction (87 | 10.2%).
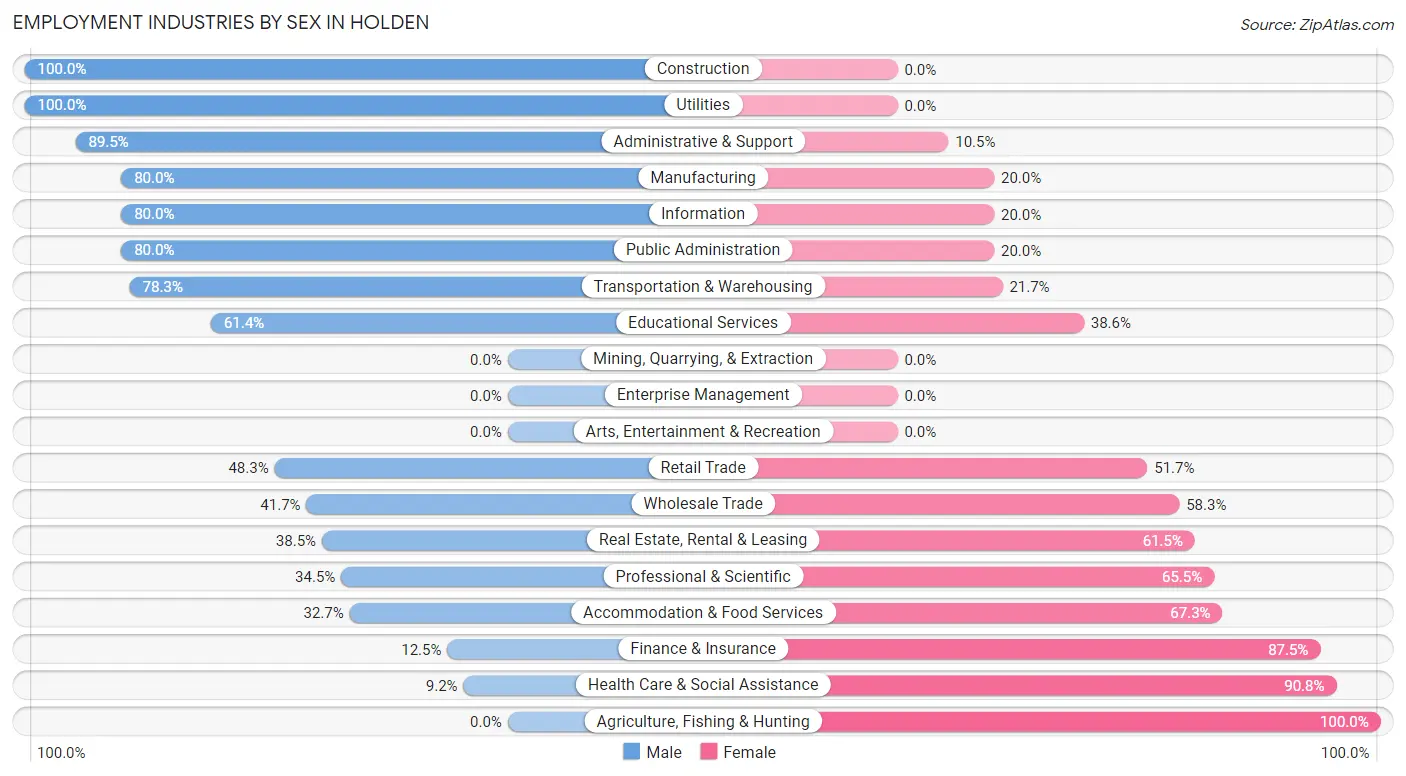
Employment Industries by Sex in Holden
The Holden industries that see more men than women are Construction (100.0%), Utilities (100.0%), and Administrative & Support (89.5%), whereas the industries that tend to have a higher number of women are Agriculture, Fishing & Hunting (100.0%), Health Care & Social Assistance (90.8%), and Finance & Insurance (87.5%).
| Industry | Male | Female |
| Agriculture, Fishing & Hunting | 0 (0.0%) | 5 (100.0%) |
| Mining, Quarrying, & Extraction | 0 (0.0%) | 0 (0.0%) |
| Construction | 87 (100.0%) | 0 (0.0%) |
| Manufacturing | 124 (80.0%) | 31 (20.0%) |
| Wholesale Trade | 5 (41.7%) | 7 (58.3%) |
| Retail Trade | 56 (48.3%) | 60 (51.7%) |
| Transportation & Warehousing | 18 (78.3%) | 5 (21.7%) |
| Utilities | 4 (100.0%) | 0 (0.0%) |
| Information | 16 (80.0%) | 4 (20.0%) |
| Finance & Insurance | 3 (12.5%) | 21 (87.5%) |
| Real Estate, Rental & Leasing | 5 (38.5%) | 8 (61.5%) |
| Professional & Scientific | 10 (34.5%) | 19 (65.5%) |
| Enterprise Management | 0 (0.0%) | 0 (0.0%) |
| Administrative & Support | 17 (89.5%) | 2 (10.5%) |
| Educational Services | 43 (61.4%) | 27 (38.6%) |
| Health Care & Social Assistance | 10 (9.2%) | 99 (90.8%) |
| Arts, Entertainment & Recreation | 0 (0.0%) | 0 (0.0%) |
| Accommodation & Food Services | 37 (32.7%) | 76 (67.3%) |
| Public Administration | 12 (80.0%) | 3 (20.0%) |
| Total | 465 (54.6%) | 386 (45.4%) |
Education in Holden
School Enrollment in Holden
The most common levels of schooling among the 419 students in Holden are middle school (150 | 35.8%), high school (113 | 27.0%), and elementary school (68 | 16.2%).
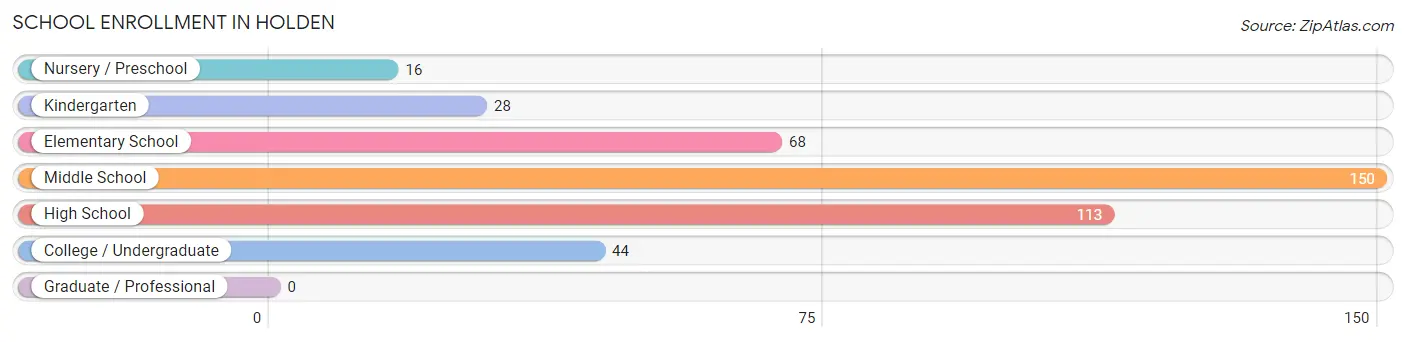
| School Level | # Students | % Students |
| Nursery / Preschool | 16 | 3.8% |
| Kindergarten | 28 | 6.7% |
| Elementary School | 68 | 16.2% |
| Middle School | 150 | 35.8% |
| High School | 113 | 27.0% |
| College / Undergraduate | 44 | 10.5% |
| Graduate / Professional | 0 | 0.0% |
| Total | 419 | 100.0% |
School Enrollment by Age by Funding Source in Holden
Out of a total of 419 students who are enrolled in schools in Holden, 38 (9.1%) attend a private institution, while the remaining 381 (90.9%) are enrolled in public schools. The age group of 35 years and over has the highest likelihood of being enrolled in private schools, with 5 (31.2% in the age bracket) enrolled. Conversely, the age group of 3 to 4 year olds has the lowest likelihood of being enrolled in a private school, with 10 (100.0% in the age bracket) attending a public institution.
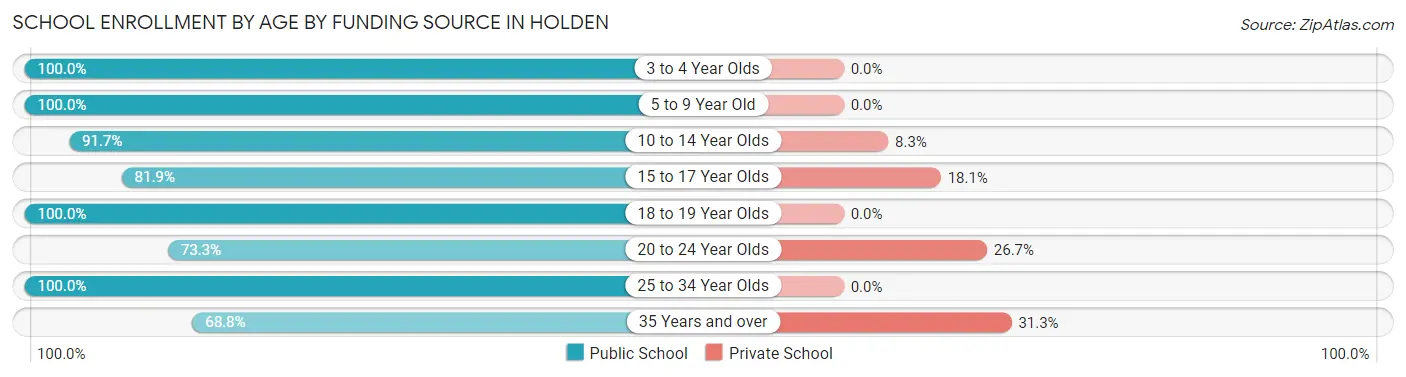
| Age Bracket | Public School | Private School |
| 3 to 4 Year Olds | 10 (100.0%) | 0 (0.0%) |
| 5 to 9 Year Old | 90 (100.0%) | 0 (0.0%) |
| 10 to 14 Year Olds | 155 (91.7%) | 14 (8.3%) |
| 15 to 17 Year Olds | 68 (81.9%) | 15 (18.1%) |
| 18 to 19 Year Olds | 19 (100.0%) | 0 (0.0%) |
| 20 to 24 Year Olds | 11 (73.3%) | 4 (26.7%) |
| 25 to 34 Year Olds | 17 (100.0%) | 0 (0.0%) |
| 35 Years and over | 11 (68.8%) | 5 (31.2%) |
| Total | 381 (90.9%) | 38 (9.1%) |
Educational Attainment by Field of Study in Holden
Education (74 | 36.6%), science & technology (43 | 21.3%), business (34 | 16.8%), arts & humanities (23 | 11.4%), and bio, nature & agricultural (6 | 3.0%) are the most common fields of study among 202 individuals in Holden who have obtained a bachelor's degree or higher.
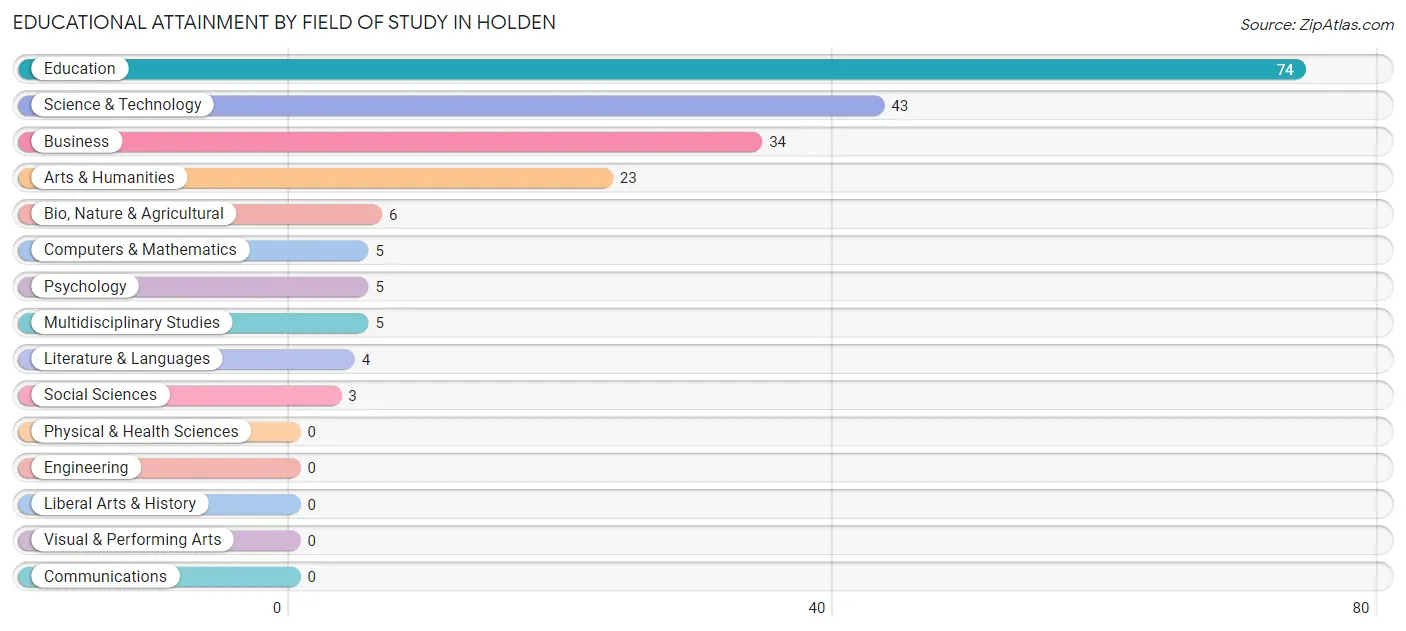
| Field of Study | # Graduates | % Graduates |
| Computers & Mathematics | 5 | 2.5% |
| Bio, Nature & Agricultural | 6 | 3.0% |
| Physical & Health Sciences | 0 | 0.0% |
| Psychology | 5 | 2.5% |
| Social Sciences | 3 | 1.5% |
| Engineering | 0 | 0.0% |
| Multidisciplinary Studies | 5 | 2.5% |
| Science & Technology | 43 | 21.3% |
| Business | 34 | 16.8% |
| Education | 74 | 36.6% |
| Literature & Languages | 4 | 2.0% |
| Liberal Arts & History | 0 | 0.0% |
| Visual & Performing Arts | 0 | 0.0% |
| Communications | 0 | 0.0% |
| Arts & Humanities | 23 | 11.4% |
| Total | 202 | 100.0% |
Transportation & Commute in Holden
Vehicle Availability by Sex in Holden
The most prevalent vehicle ownership categories in Holden are males with 2 vehicles (212, accounting for 46.2%) and females with 2 vehicles (150, making up 55.2%).
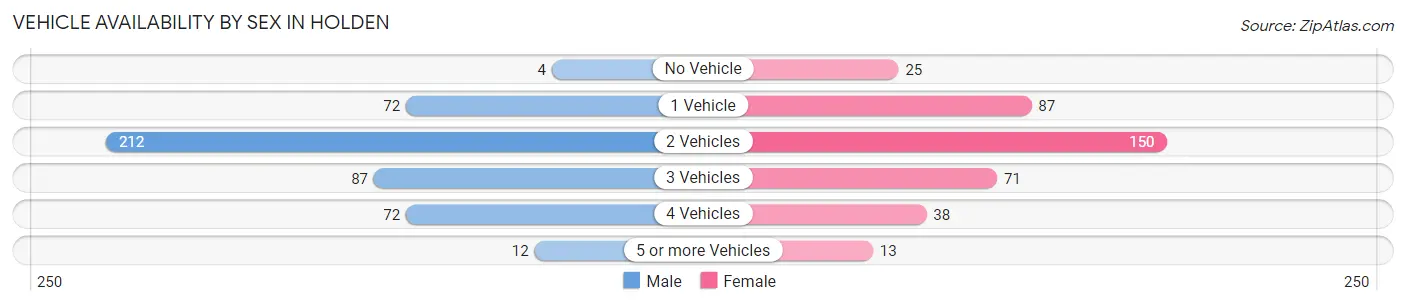
| Vehicles Available | Male | Female |
| No Vehicle | 4 (0.9%) | 25 (6.5%) |
| 1 Vehicle | 72 (15.7%) | 87 (22.7%) |
| 2 Vehicles | 212 (46.2%) | 150 (39.1%) |
| 3 Vehicles | 87 (19.0%) | 71 (18.5%) |
| 4 Vehicles | 72 (15.7%) | 38 (9.9%) |
| 5 or more Vehicles | 12 (2.6%) | 13 (3.4%) |
| Total | 459 (100.0%) | 384 (100.0%) |
Commute Time in Holden
The most frequently occuring commute durations in Holden are 45 to 59 minutes (165 commuters, 20.1%), 60 to 89 minutes (108 commuters, 13.2%), and 5 to 9 minutes (107 commuters, 13.1%).
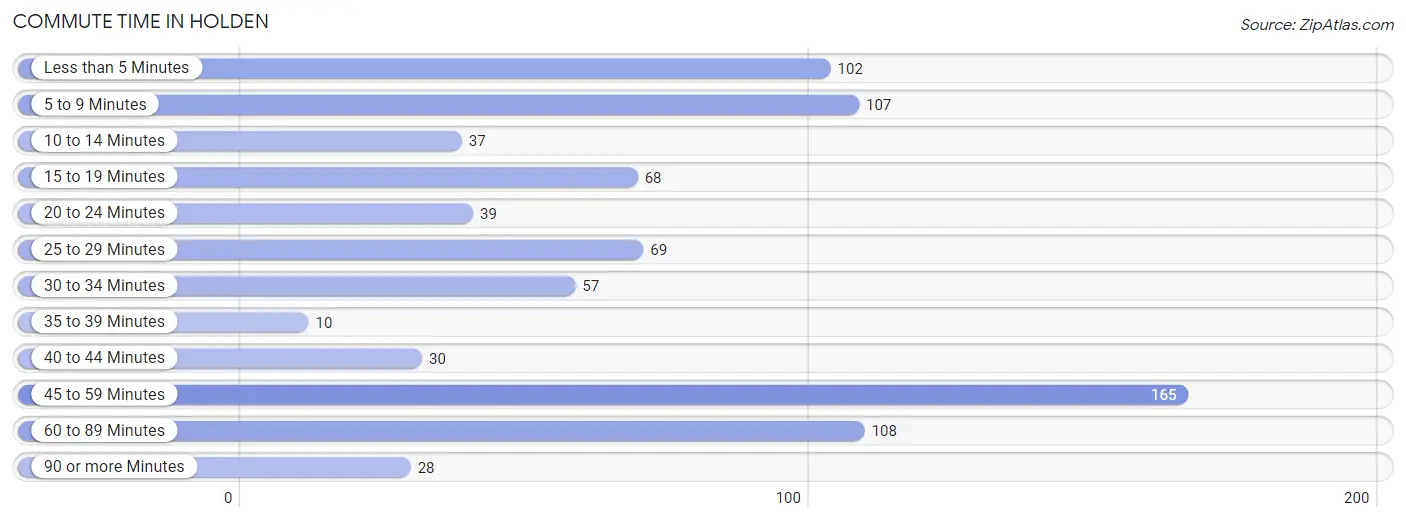
| Commute Time | # Commuters | % Commuters |
| Less than 5 Minutes | 102 | 12.4% |
| 5 to 9 Minutes | 107 | 13.1% |
| 10 to 14 Minutes | 37 | 4.5% |
| 15 to 19 Minutes | 68 | 8.3% |
| 20 to 24 Minutes | 39 | 4.8% |
| 25 to 29 Minutes | 69 | 8.4% |
| 30 to 34 Minutes | 57 | 7.0% |
| 35 to 39 Minutes | 10 | 1.2% |
| 40 to 44 Minutes | 30 | 3.7% |
| 45 to 59 Minutes | 165 | 20.1% |
| 60 to 89 Minutes | 108 | 13.2% |
| 90 or more Minutes | 28 | 3.4% |
Commute Time by Sex in Holden
The most common commute times in Holden are 45 to 59 minutes (119 commuters, 26.2%) for males and 5 to 9 minutes (81 commuters, 22.1%) for females.
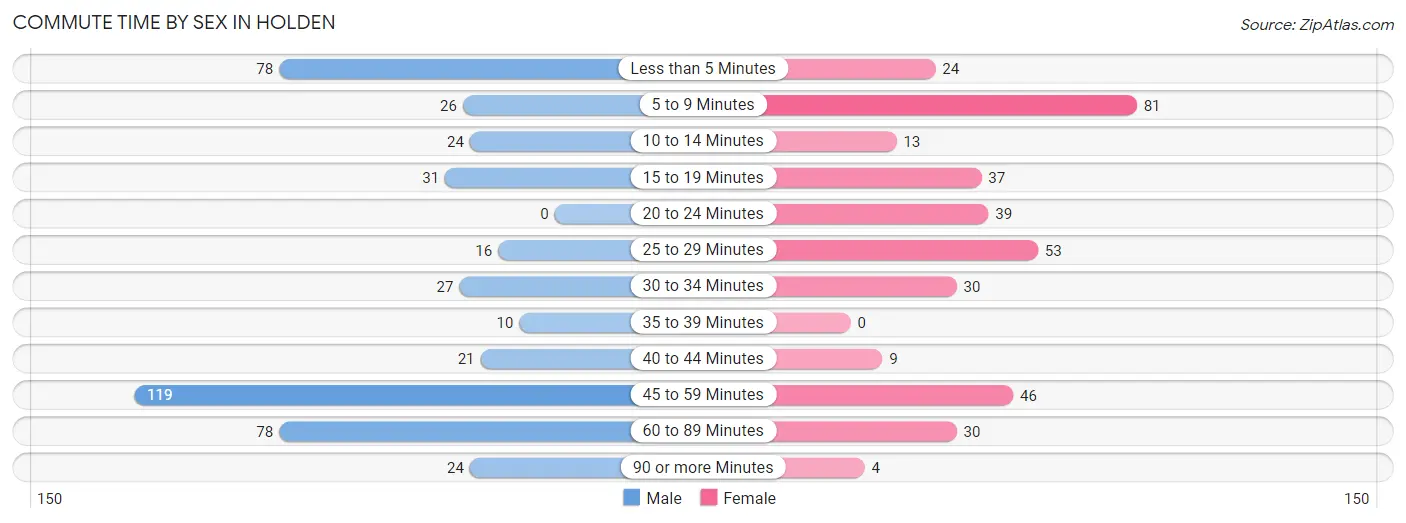
| Commute Time | Male | Female |
| Less than 5 Minutes | 78 (17.2%) | 24 (6.6%) |
| 5 to 9 Minutes | 26 (5.7%) | 81 (22.1%) |
| 10 to 14 Minutes | 24 (5.3%) | 13 (3.5%) |
| 15 to 19 Minutes | 31 (6.8%) | 37 (10.1%) |
| 20 to 24 Minutes | 0 (0.0%) | 39 (10.7%) |
| 25 to 29 Minutes | 16 (3.5%) | 53 (14.5%) |
| 30 to 34 Minutes | 27 (5.9%) | 30 (8.2%) |
| 35 to 39 Minutes | 10 (2.2%) | 0 (0.0%) |
| 40 to 44 Minutes | 21 (4.6%) | 9 (2.5%) |
| 45 to 59 Minutes | 119 (26.2%) | 46 (12.6%) |
| 60 to 89 Minutes | 78 (17.2%) | 30 (8.2%) |
| 90 or more Minutes | 24 (5.3%) | 4 (1.1%) |
Time of Departure to Work by Sex in Holden
The most frequent times of departure to work in Holden are 6:00 AM to 6:29 AM (103, 22.7%) for males and 12:00 PM to 3:59 PM (88, 24.0%) for females.
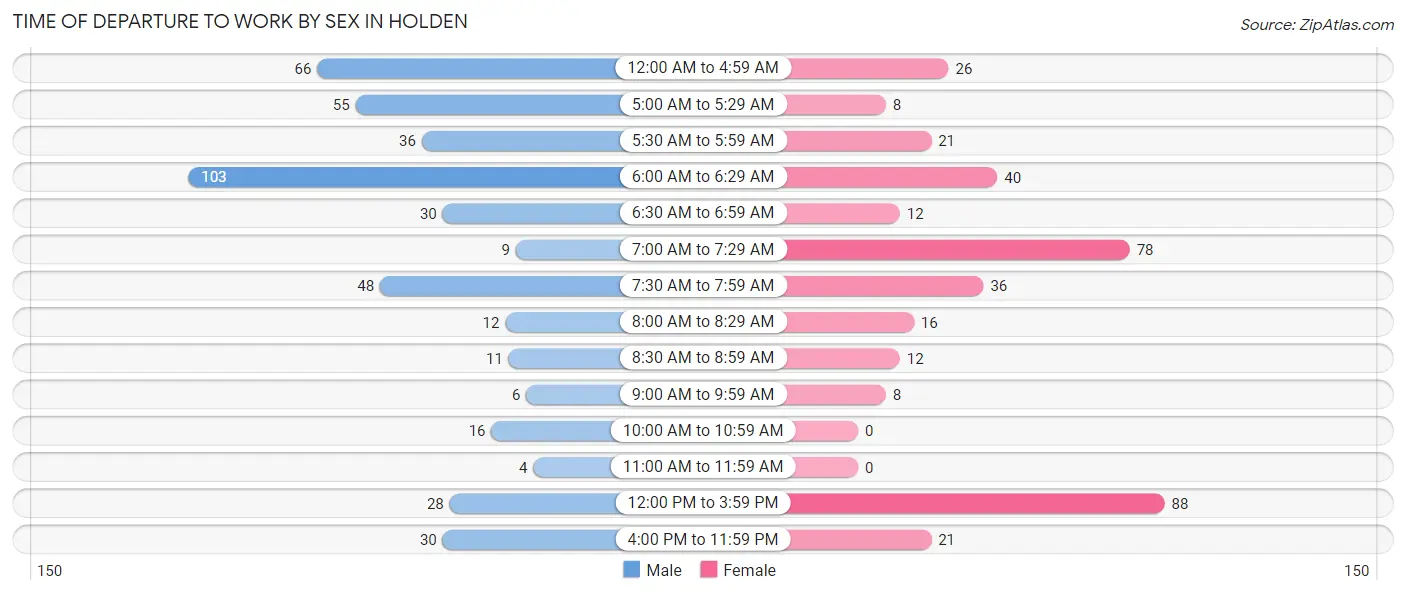
| Time of Departure | Male | Female |
| 12:00 AM to 4:59 AM | 66 (14.5%) | 26 (7.1%) |
| 5:00 AM to 5:29 AM | 55 (12.1%) | 8 (2.2%) |
| 5:30 AM to 5:59 AM | 36 (7.9%) | 21 (5.7%) |
| 6:00 AM to 6:29 AM | 103 (22.7%) | 40 (10.9%) |
| 6:30 AM to 6:59 AM | 30 (6.6%) | 12 (3.3%) |
| 7:00 AM to 7:29 AM | 9 (2.0%) | 78 (21.3%) |
| 7:30 AM to 7:59 AM | 48 (10.6%) | 36 (9.8%) |
| 8:00 AM to 8:29 AM | 12 (2.6%) | 16 (4.4%) |
| 8:30 AM to 8:59 AM | 11 (2.4%) | 12 (3.3%) |
| 9:00 AM to 9:59 AM | 6 (1.3%) | 8 (2.2%) |
| 10:00 AM to 10:59 AM | 16 (3.5%) | 0 (0.0%) |
| 11:00 AM to 11:59 AM | 4 (0.9%) | 0 (0.0%) |
| 12:00 PM to 3:59 PM | 28 (6.2%) | 88 (24.0%) |
| 4:00 PM to 11:59 PM | 30 (6.6%) | 21 (5.7%) |
| Total | 454 (100.0%) | 366 (100.0%) |
Housing Occupancy in Holden
Occupancy by Ownership in Holden
Of the total 757 dwellings in Holden, owner-occupied units account for 425 (56.1%), while renter-occupied units make up 332 (43.9%).
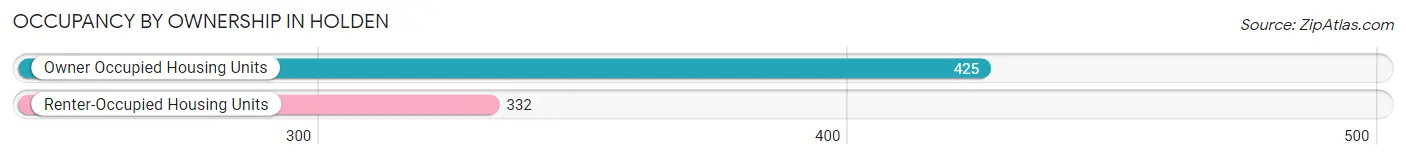
| Occupancy | # Housing Units | % Housing Units |
| Owner Occupied Housing Units | 425 | 56.1% |
| Renter-Occupied Housing Units | 332 | 43.9% |
| Total Occupied Housing Units | 757 | 100.0% |
Occupancy by Household Size in Holden
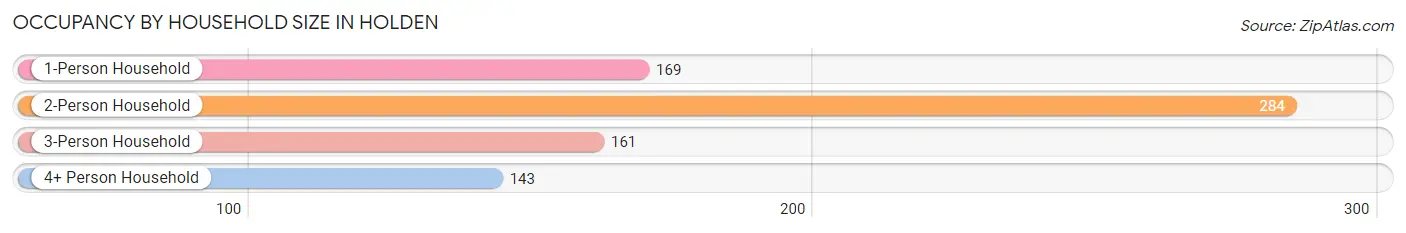
| Household Size | # Housing Units | % Housing Units |
| 1-Person Household | 169 | 22.3% |
| 2-Person Household | 284 | 37.5% |
| 3-Person Household | 161 | 21.3% |
| 4+ Person Household | 143 | 18.9% |
| Total Housing Units | 757 | 100.0% |
Occupancy by Ownership by Household Size in Holden
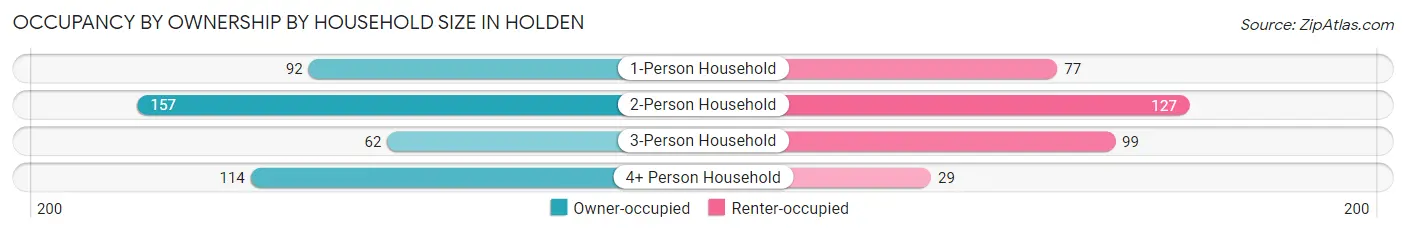
| Household Size | Owner-occupied | Renter-occupied |
| 1-Person Household | 92 (54.4%) | 77 (45.6%) |
| 2-Person Household | 157 (55.3%) | 127 (44.7%) |
| 3-Person Household | 62 (38.5%) | 99 (61.5%) |
| 4+ Person Household | 114 (79.7%) | 29 (20.3%) |
| Total Housing Units | 425 (56.1%) | 332 (43.9%) |
Occupancy by Educational Attainment in Holden
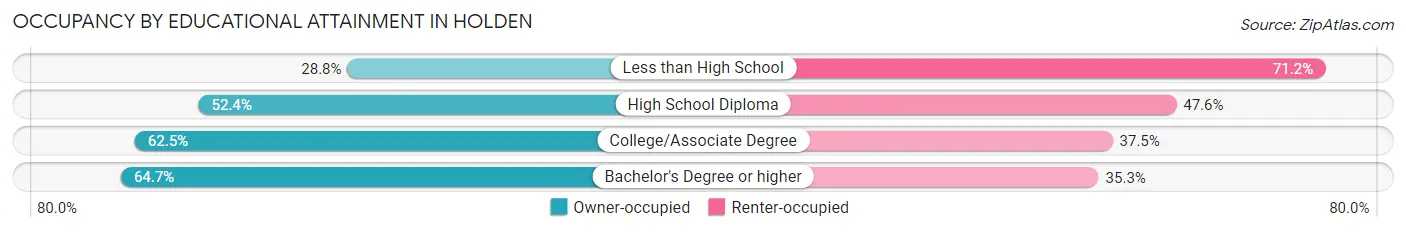
| Household Size | Owner-occupied | Renter-occupied |
| Less than High School | 17 (28.8%) | 42 (71.2%) |
| High School Diploma | 164 (52.4%) | 149 (47.6%) |
| College/Associate Degree | 145 (62.5%) | 87 (37.5%) |
| Bachelor's Degree or higher | 99 (64.7%) | 54 (35.3%) |
Occupancy by Age of Householder in Holden
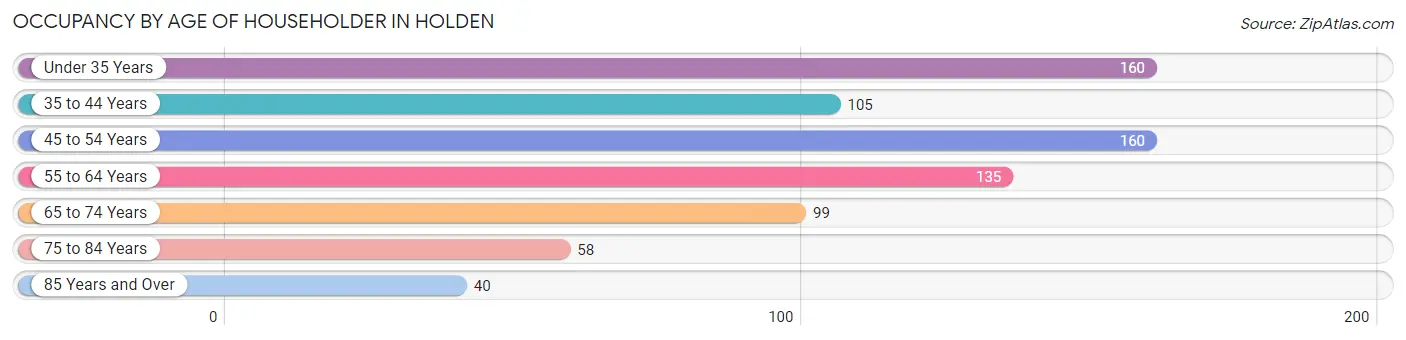
| Age Bracket | # Households | % Households |
| Under 35 Years | 160 | 21.1% |
| 35 to 44 Years | 105 | 13.9% |
| 45 to 54 Years | 160 | 21.1% |
| 55 to 64 Years | 135 | 17.8% |
| 65 to 74 Years | 99 | 13.1% |
| 75 to 84 Years | 58 | 7.7% |
| 85 Years and Over | 40 | 5.3% |
| Total | 757 | 100.0% |
Housing Finances in Holden
Median Income by Occupancy in Holden
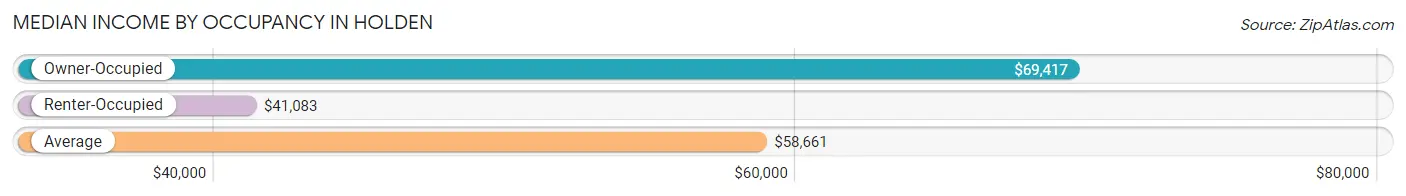
| Occupancy Type | # Households | Median Income |
| Owner-Occupied | 425 (56.1%) | $69,417 |
| Renter-Occupied | 332 (43.9%) | $41,083 |
| Average | 757 (100.0%) | $58,661 |
Occupancy by Householder Income Bracket in Holden
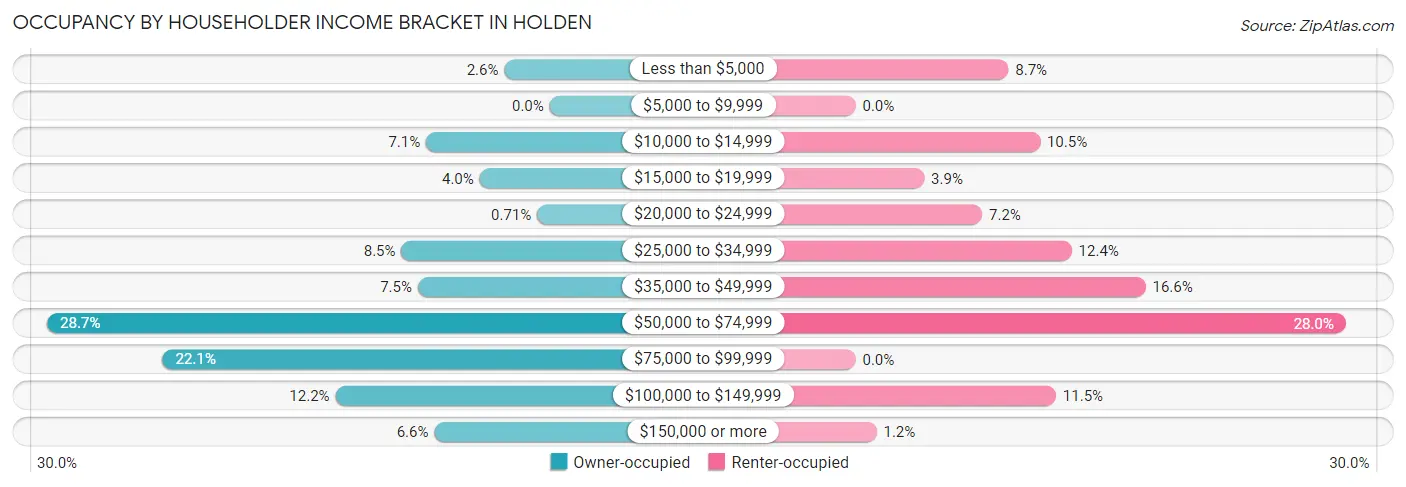
| Income Bracket | Owner-occupied | Renter-occupied |
| Less than $5,000 | 11 (2.6%) | 29 (8.7%) |
| $5,000 to $9,999 | 0 (0.0%) | 0 (0.0%) |
| $10,000 to $14,999 | 30 (7.1%) | 35 (10.5%) |
| $15,000 to $19,999 | 17 (4.0%) | 13 (3.9%) |
| $20,000 to $24,999 | 3 (0.7%) | 24 (7.2%) |
| $25,000 to $34,999 | 36 (8.5%) | 41 (12.3%) |
| $35,000 to $49,999 | 32 (7.5%) | 55 (16.6%) |
| $50,000 to $74,999 | 122 (28.7%) | 93 (28.0%) |
| $75,000 to $99,999 | 94 (22.1%) | 0 (0.0%) |
| $100,000 to $149,999 | 52 (12.2%) | 38 (11.5%) |
| $150,000 or more | 28 (6.6%) | 4 (1.2%) |
| Total | 425 (100.0%) | 332 (100.0%) |
Monthly Housing Cost Tiers in Holden
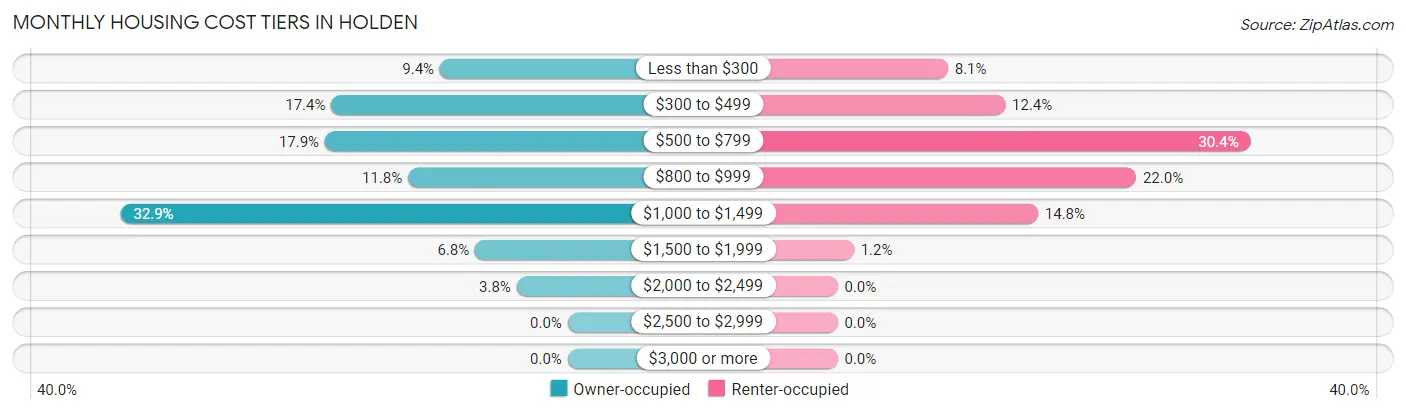
| Monthly Cost | Owner-occupied | Renter-occupied |
| Less than $300 | 40 (9.4%) | 27 (8.1%) |
| $300 to $499 | 74 (17.4%) | 41 (12.3%) |
| $500 to $799 | 76 (17.9%) | 101 (30.4%) |
| $800 to $999 | 50 (11.8%) | 73 (22.0%) |
| $1,000 to $1,499 | 140 (32.9%) | 49 (14.8%) |
| $1,500 to $1,999 | 29 (6.8%) | 4 (1.2%) |
| $2,000 to $2,499 | 16 (3.8%) | 0 (0.0%) |
| $2,500 to $2,999 | 0 (0.0%) | 0 (0.0%) |
| $3,000 or more | 0 (0.0%) | 0 (0.0%) |
| Total | 425 (100.0%) | 332 (100.0%) |
Physical Housing Characteristics in Holden
Housing Structures in Holden
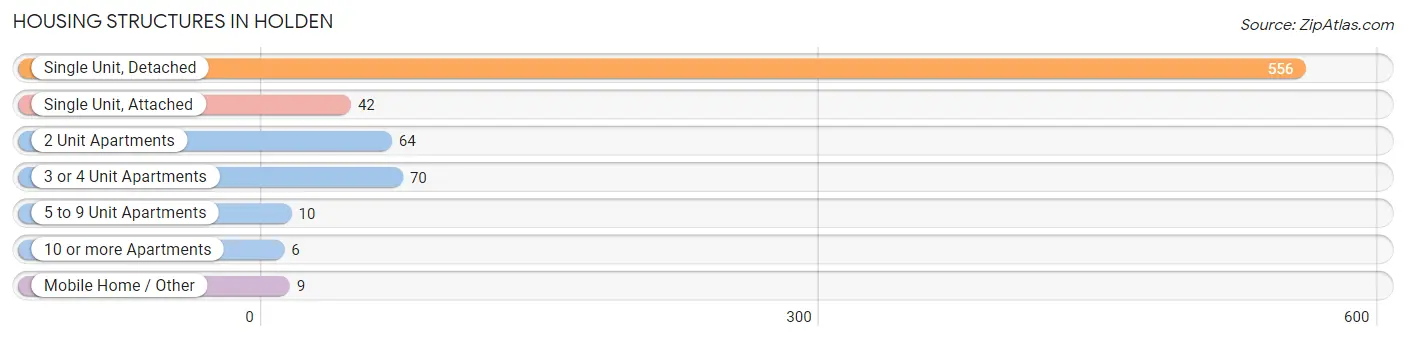
| Structure Type | # Housing Units | % Housing Units |
| Single Unit, Detached | 556 | 73.5% |
| Single Unit, Attached | 42 | 5.6% |
| 2 Unit Apartments | 64 | 8.5% |
| 3 or 4 Unit Apartments | 70 | 9.2% |
| 5 to 9 Unit Apartments | 10 | 1.3% |
| 10 or more Apartments | 6 | 0.8% |
| Mobile Home / Other | 9 | 1.2% |
| Total | 757 | 100.0% |
Housing Structures by Occupancy in Holden
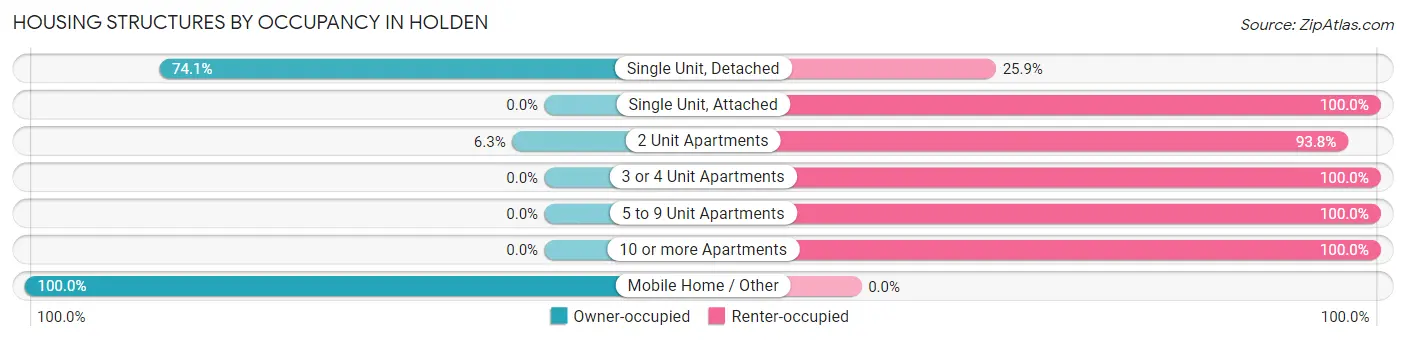
| Structure Type | Owner-occupied | Renter-occupied |
| Single Unit, Detached | 412 (74.1%) | 144 (25.9%) |
| Single Unit, Attached | 0 (0.0%) | 42 (100.0%) |
| 2 Unit Apartments | 4 (6.2%) | 60 (93.8%) |
| 3 or 4 Unit Apartments | 0 (0.0%) | 70 (100.0%) |
| 5 to 9 Unit Apartments | 0 (0.0%) | 10 (100.0%) |
| 10 or more Apartments | 0 (0.0%) | 6 (100.0%) |
| Mobile Home / Other | 9 (100.0%) | 0 (0.0%) |
| Total | 425 (56.1%) | 332 (43.9%) |
Housing Structures by Number of Rooms in Holden
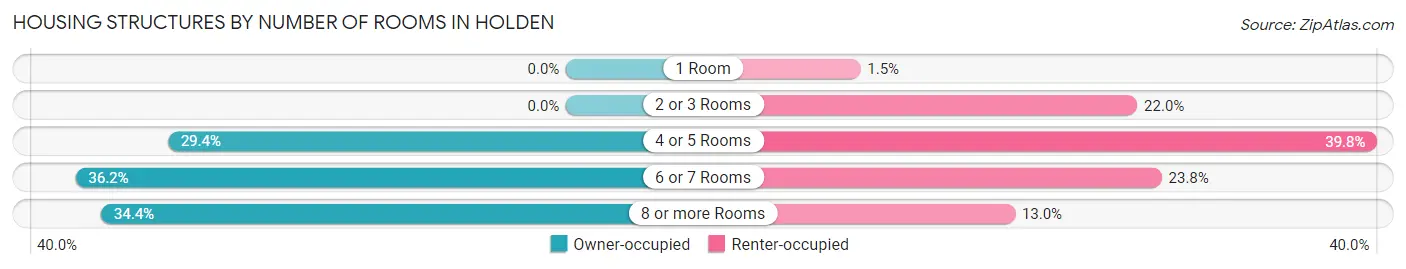
| Number of Rooms | Owner-occupied | Renter-occupied |
| 1 Room | 0 (0.0%) | 5 (1.5%) |
| 2 or 3 Rooms | 0 (0.0%) | 73 (22.0%) |
| 4 or 5 Rooms | 125 (29.4%) | 132 (39.8%) |
| 6 or 7 Rooms | 154 (36.2%) | 79 (23.8%) |
| 8 or more Rooms | 146 (34.4%) | 43 (13.0%) |
| Total | 425 (100.0%) | 332 (100.0%) |
Housing Structure by Heating Type in Holden
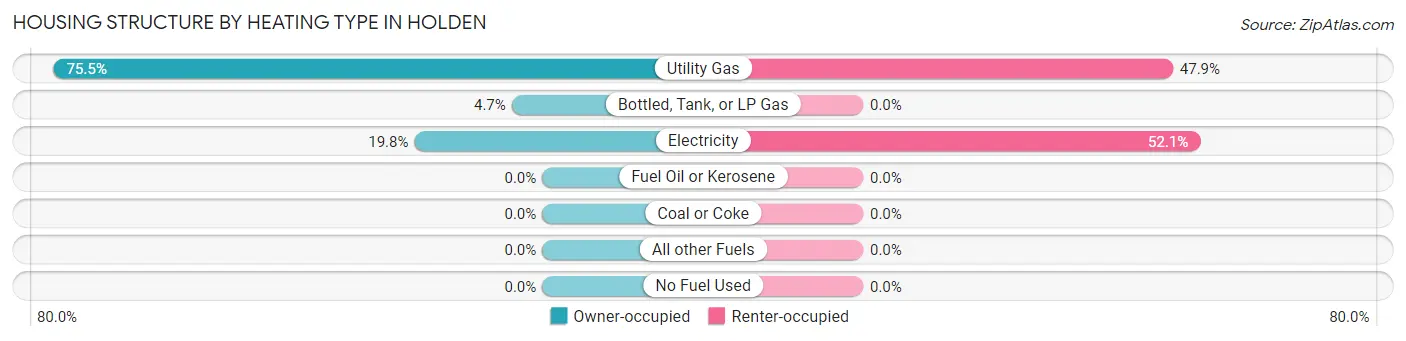
| Heating Type | Owner-occupied | Renter-occupied |
| Utility Gas | 321 (75.5%) | 159 (47.9%) |
| Bottled, Tank, or LP Gas | 20 (4.7%) | 0 (0.0%) |
| Electricity | 84 (19.8%) | 173 (52.1%) |
| Fuel Oil or Kerosene | 0 (0.0%) | 0 (0.0%) |
| Coal or Coke | 0 (0.0%) | 0 (0.0%) |
| All other Fuels | 0 (0.0%) | 0 (0.0%) |
| No Fuel Used | 0 (0.0%) | 0 (0.0%) |
| Total | 425 (100.0%) | 332 (100.0%) |
Household Vehicle Usage in Holden
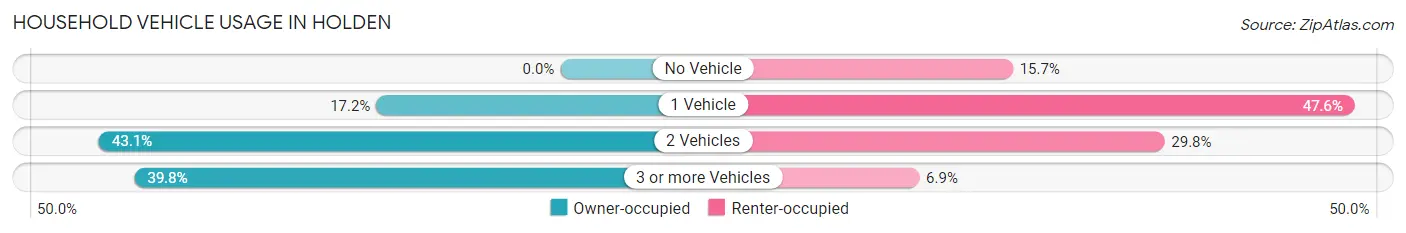
| Vehicles per Household | Owner-occupied | Renter-occupied |
| No Vehicle | 0 (0.0%) | 52 (15.7%) |
| 1 Vehicle | 73 (17.2%) | 158 (47.6%) |
| 2 Vehicles | 183 (43.1%) | 99 (29.8%) |
| 3 or more Vehicles | 169 (39.8%) | 23 (6.9%) |
| Total | 425 (100.0%) | 332 (100.0%) |
Real Estate & Mortgages in Holden
Real Estate and Mortgage Overview in Holden
| Characteristic | Without Mortgage | With Mortgage |
| Housing Units | 172 | 253 |
| Median Property Value | $116,400 | $136,200 |
| Median Household Income | $63,000 | $16 |
| Monthly Housing Costs | $439 | $0 |
| Real Estate Taxes | $1,109 | $10 |
Property Value by Mortgage Status in Holden
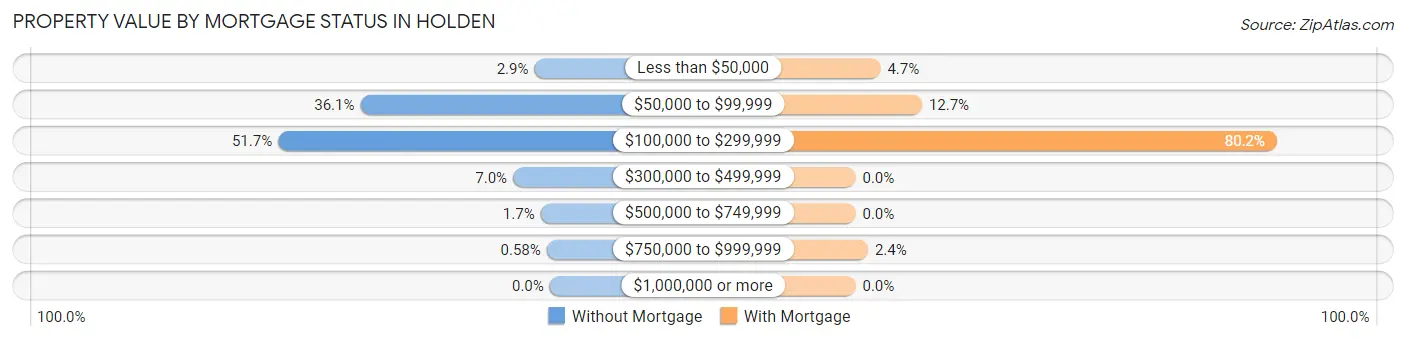
| Property Value | Without Mortgage | With Mortgage |
| Less than $50,000 | 5 (2.9%) | 12 (4.7%) |
| $50,000 to $99,999 | 62 (36.0%) | 32 (12.7%) |
| $100,000 to $299,999 | 89 (51.7%) | 203 (80.2%) |
| $300,000 to $499,999 | 12 (7.0%) | 0 (0.0%) |
| $500,000 to $749,999 | 3 (1.7%) | 0 (0.0%) |
| $750,000 to $999,999 | 1 (0.6%) | 6 (2.4%) |
| $1,000,000 or more | 0 (0.0%) | 0 (0.0%) |
| Total | 172 (100.0%) | 253 (100.0%) |
Household Income by Mortgage Status in Holden
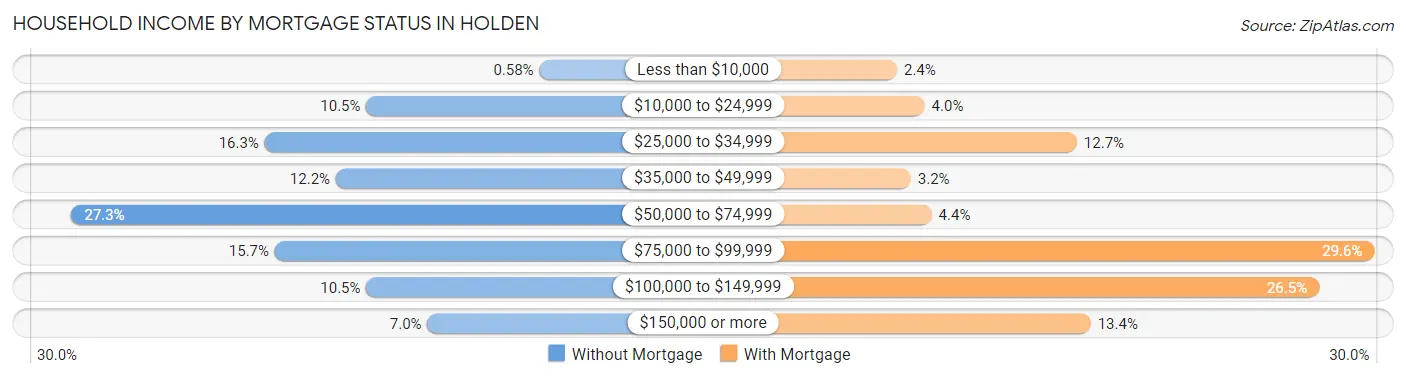
| Household Income | Without Mortgage | With Mortgage |
| Less than $10,000 | 1 (0.6%) | 6 (2.4%) |
| $10,000 to $24,999 | 18 (10.5%) | 10 (4.0%) |
| $25,000 to $34,999 | 28 (16.3%) | 32 (12.7%) |
| $35,000 to $49,999 | 21 (12.2%) | 8 (3.2%) |
| $50,000 to $74,999 | 47 (27.3%) | 11 (4.3%) |
| $75,000 to $99,999 | 27 (15.7%) | 75 (29.6%) |
| $100,000 to $149,999 | 18 (10.5%) | 67 (26.5%) |
| $150,000 or more | 12 (7.0%) | 34 (13.4%) |
| Total | 172 (100.0%) | 253 (100.0%) |
Property Value to Household Income Ratio in Holden
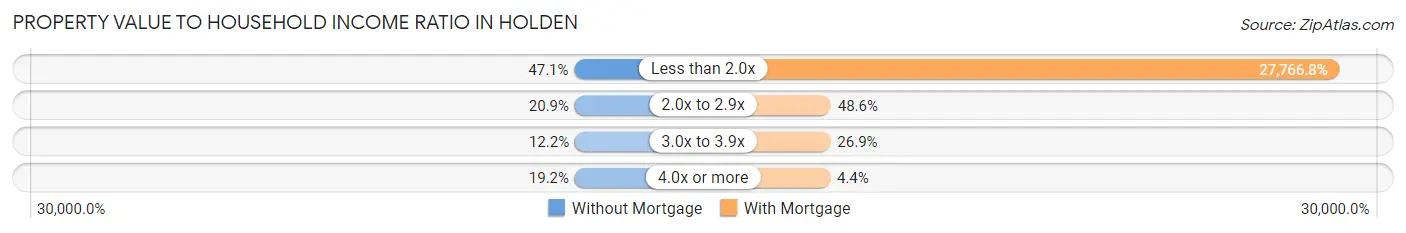
| Value-to-Income Ratio | Without Mortgage | With Mortgage |
| Less than 2.0x | 81 (47.1%) | 70,250 (27,766.8%) |
| 2.0x to 2.9x | 36 (20.9%) | 123 (48.6%) |
| 3.0x to 3.9x | 21 (12.2%) | 68 (26.9%) |
| 4.0x or more | 33 (19.2%) | 11 (4.3%) |
| Total | 172 (100.0%) | 253 (100.0%) |
Real Estate Taxes by Mortgage Status in Holden
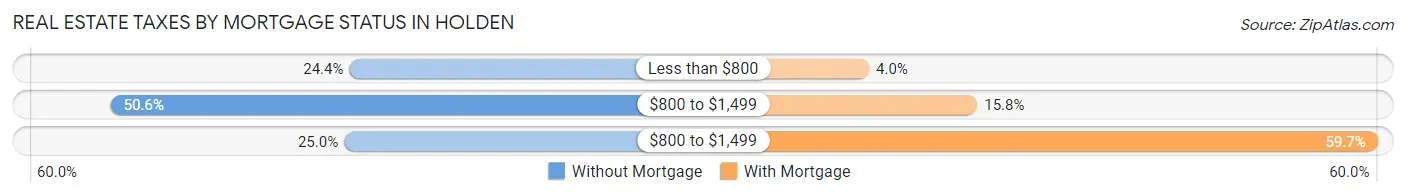
| Property Taxes | Without Mortgage | With Mortgage |
| Less than $800 | 42 (24.4%) | 10 (4.0%) |
| $800 to $1,499 | 87 (50.6%) | 40 (15.8%) |
| $800 to $1,499 | 43 (25.0%) | 151 (59.7%) |
| Total | 172 (100.0%) | 253 (100.0%) |
Health & Disability in Holden
Health Insurance Coverage by Age in Holden
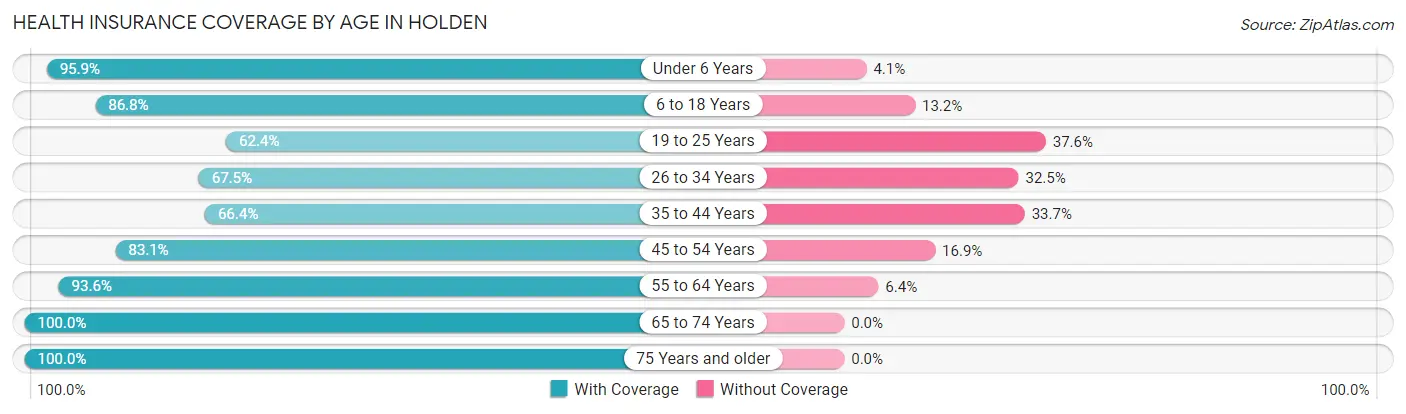
| Age Bracket | With Coverage | Without Coverage |
| Under 6 Years | 116 (95.9%) | 5 (4.1%) |
| 6 to 18 Years | 316 (86.8%) | 48 (13.2%) |
| 19 to 25 Years | 93 (62.4%) | 56 (37.6%) |
| 26 to 34 Years | 133 (67.5%) | 64 (32.5%) |
| 35 to 44 Years | 140 (66.3%) | 71 (33.7%) |
| 45 to 54 Years | 206 (83.1%) | 42 (16.9%) |
| 55 to 64 Years | 221 (93.6%) | 15 (6.4%) |
| 65 to 74 Years | 132 (100.0%) | 0 (0.0%) |
| 75 Years and older | 129 (100.0%) | 0 (0.0%) |
| Total | 1,486 (83.2%) | 301 (16.8%) |
Health Insurance Coverage by Citizenship Status in Holden
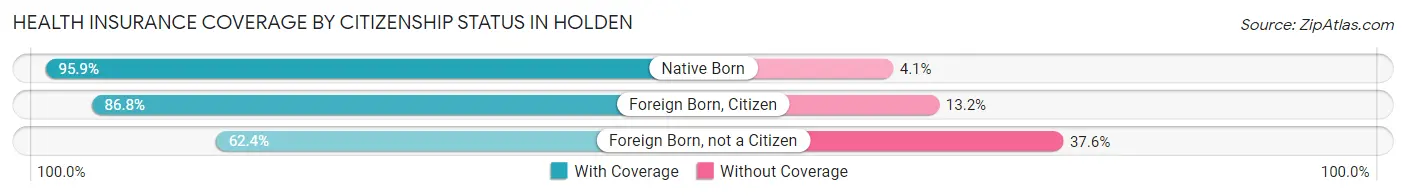
| Citizenship Status | With Coverage | Without Coverage |
| Native Born | 116 (95.9%) | 5 (4.1%) |
| Foreign Born, Citizen | 316 (86.8%) | 48 (13.2%) |
| Foreign Born, not a Citizen | 93 (62.4%) | 56 (37.6%) |
Health Insurance Coverage by Household Income in Holden
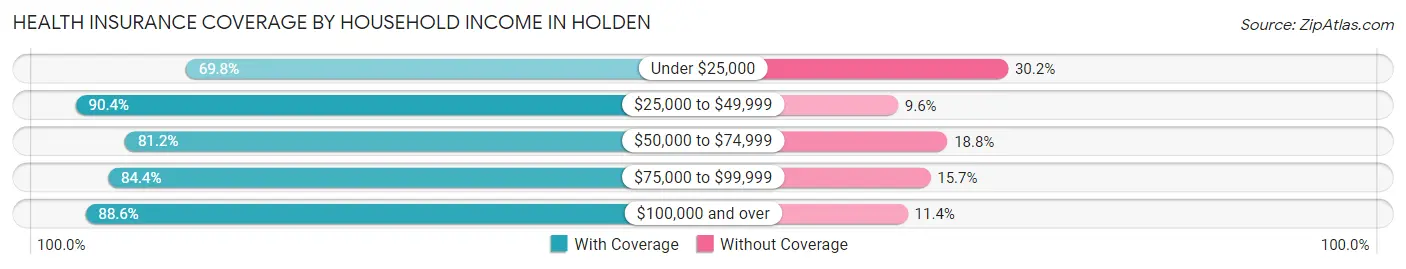
| Household Income | With Coverage | Without Coverage |
| Under $25,000 | 178 (69.8%) | 77 (30.2%) |
| $25,000 to $49,999 | 340 (90.4%) | 36 (9.6%) |
| $50,000 to $74,999 | 436 (81.2%) | 101 (18.8%) |
| $75,000 to $99,999 | 221 (84.4%) | 41 (15.7%) |
| $100,000 and over | 311 (88.6%) | 40 (11.4%) |
Public vs Private Health Insurance Coverage by Age in Holden
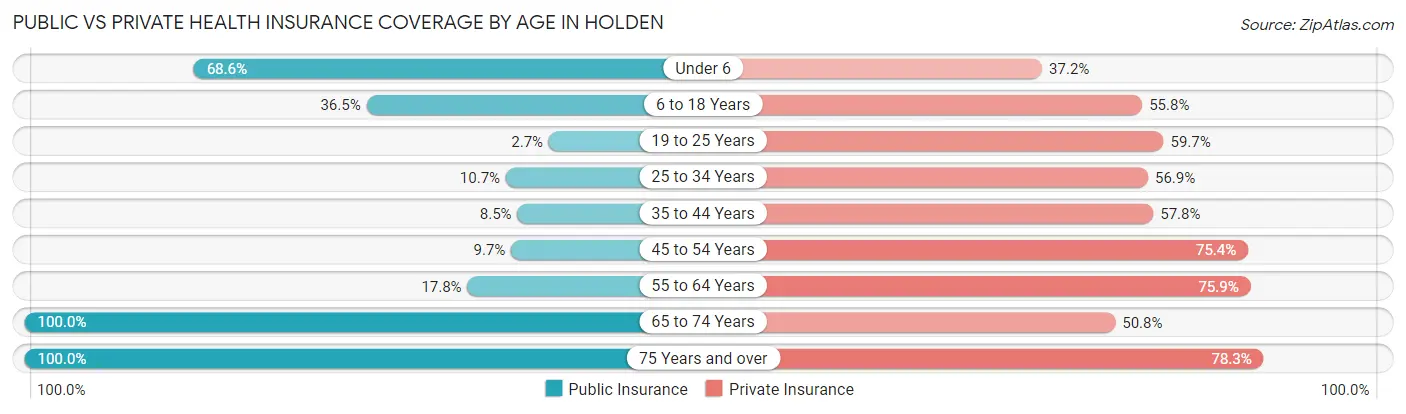
| Age Bracket | Public Insurance | Private Insurance |
| Under 6 | 83 (68.6%) | 45 (37.2%) |
| 6 to 18 Years | 133 (36.5%) | 203 (55.8%) |
| 19 to 25 Years | 4 (2.7%) | 89 (59.7%) |
| 25 to 34 Years | 21 (10.7%) | 112 (56.9%) |
| 35 to 44 Years | 18 (8.5%) | 122 (57.8%) |
| 45 to 54 Years | 24 (9.7%) | 187 (75.4%) |
| 55 to 64 Years | 42 (17.8%) | 179 (75.8%) |
| 65 to 74 Years | 132 (100.0%) | 67 (50.8%) |
| 75 Years and over | 129 (100.0%) | 101 (78.3%) |
| Total | 586 (32.8%) | 1,105 (61.8%) |
Disability Status by Sex by Age in Holden
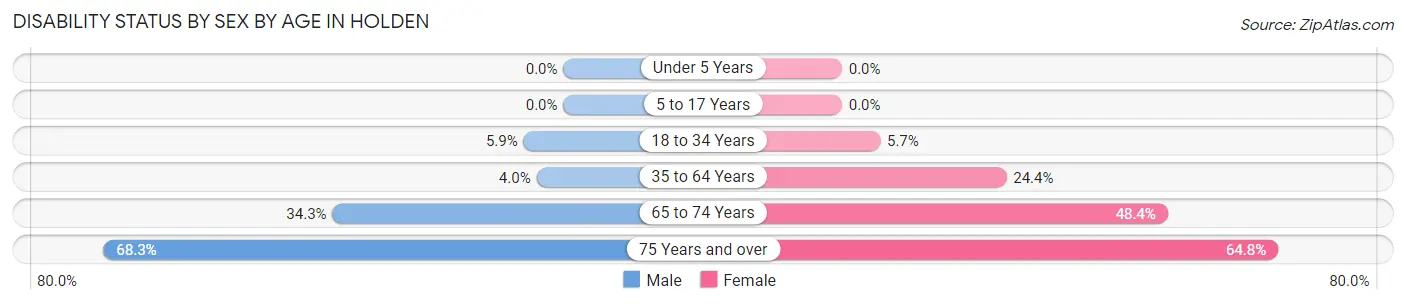
| Age Bracket | Male | Female |
| Under 5 Years | 0 (0.0%) | 0 (0.0%) |
| 5 to 17 Years | 0 (0.0%) | 0 (0.0%) |
| 18 to 34 Years | 11 (5.9%) | 10 (5.7%) |
| 35 to 64 Years | 14 (4.0%) | 84 (24.4%) |
| 65 to 74 Years | 24 (34.3%) | 30 (48.4%) |
| 75 Years and over | 28 (68.3%) | 57 (64.8%) |
Disability Class by Sex by Age in Holden
Disability Class: Hearing Difficulty
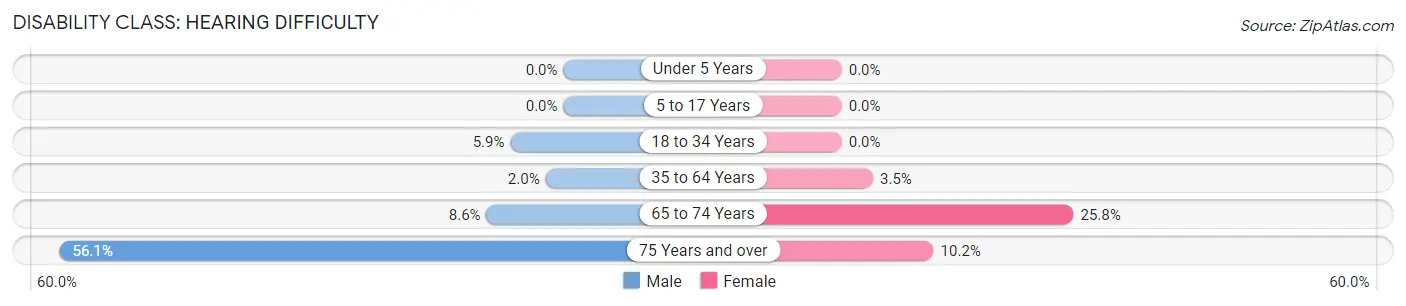
| Age Bracket | Male | Female |
| Under 5 Years | 0 (0.0%) | 0 (0.0%) |
| 5 to 17 Years | 0 (0.0%) | 0 (0.0%) |
| 18 to 34 Years | 11 (5.9%) | 0 (0.0%) |
| 35 to 64 Years | 7 (2.0%) | 12 (3.5%) |
| 65 to 74 Years | 6 (8.6%) | 16 (25.8%) |
| 75 Years and over | 23 (56.1%) | 9 (10.2%) |
Disability Class: Vision Difficulty
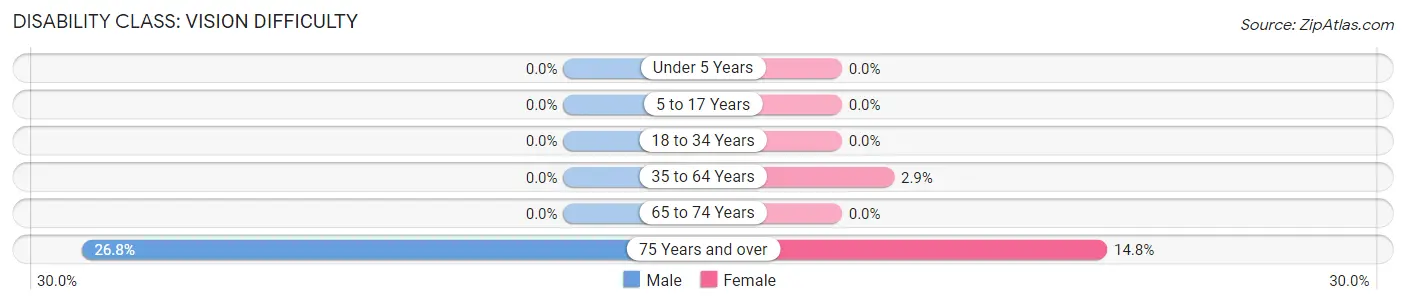
| Age Bracket | Male | Female |
| Under 5 Years | 0 (0.0%) | 0 (0.0%) |
| 5 to 17 Years | 0 (0.0%) | 0 (0.0%) |
| 18 to 34 Years | 0 (0.0%) | 0 (0.0%) |
| 35 to 64 Years | 0 (0.0%) | 10 (2.9%) |
| 65 to 74 Years | 0 (0.0%) | 0 (0.0%) |
| 75 Years and over | 11 (26.8%) | 13 (14.8%) |
Disability Class: Cognitive Difficulty
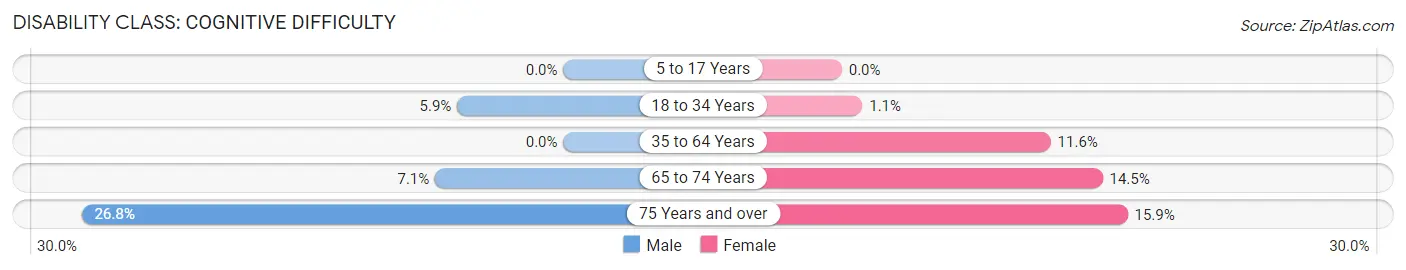
| Age Bracket | Male | Female |
| 5 to 17 Years | 0 (0.0%) | 0 (0.0%) |
| 18 to 34 Years | 11 (5.9%) | 2 (1.1%) |
| 35 to 64 Years | 0 (0.0%) | 40 (11.6%) |
| 65 to 74 Years | 5 (7.1%) | 9 (14.5%) |
| 75 Years and over | 11 (26.8%) | 14 (15.9%) |
Disability Class: Ambulatory Difficulty
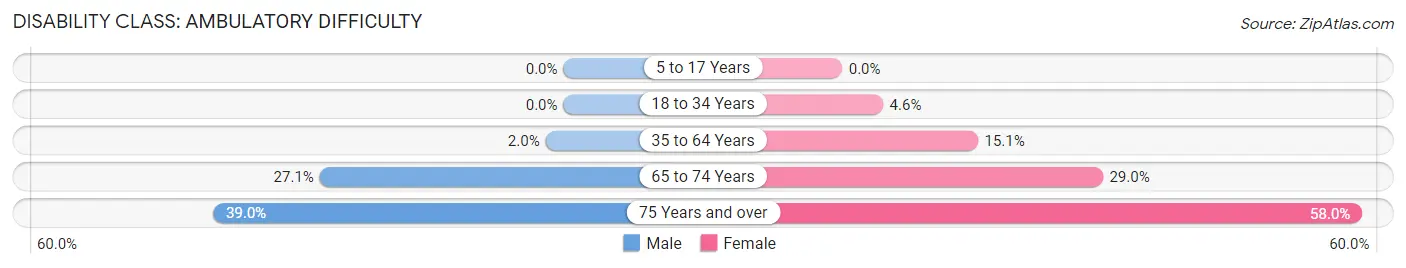
| Age Bracket | Male | Female |
| 5 to 17 Years | 0 (0.0%) | 0 (0.0%) |
| 18 to 34 Years | 0 (0.0%) | 8 (4.5%) |
| 35 to 64 Years | 7 (2.0%) | 52 (15.1%) |
| 65 to 74 Years | 19 (27.1%) | 18 (29.0%) |
| 75 Years and over | 16 (39.0%) | 51 (58.0%) |
Disability Class: Self-Care Difficulty
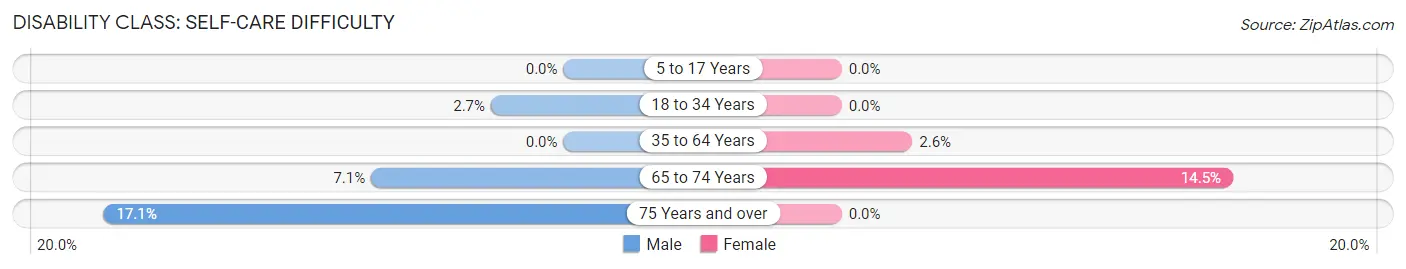
| Age Bracket | Male | Female |
| 5 to 17 Years | 0 (0.0%) | 0 (0.0%) |
| 18 to 34 Years | 5 (2.7%) | 0 (0.0%) |
| 35 to 64 Years | 0 (0.0%) | 9 (2.6%) |
| 65 to 74 Years | 5 (7.1%) | 9 (14.5%) |
| 75 Years and over | 7 (17.1%) | 0 (0.0%) |
Technology Access in Holden
Computing Device Access in Holden
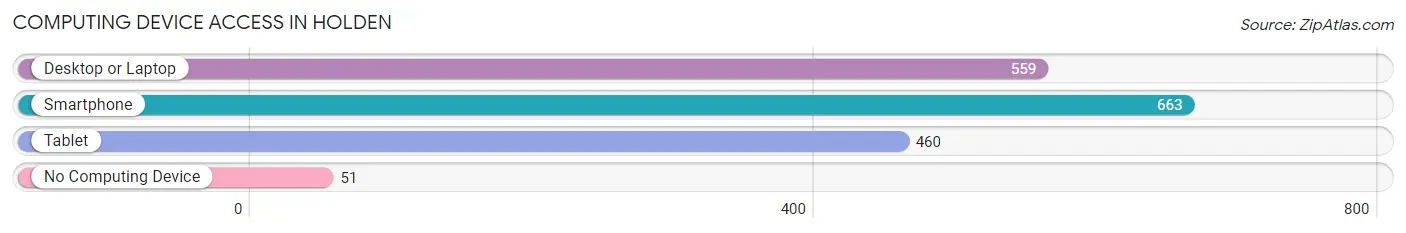
| Device Type | # Households | % Households |
| Desktop or Laptop | 559 | 73.8% |
| Smartphone | 663 | 87.6% |
| Tablet | 460 | 60.8% |
| No Computing Device | 51 | 6.7% |
| Total | 757 | 100.0% |
Internet Access in Holden
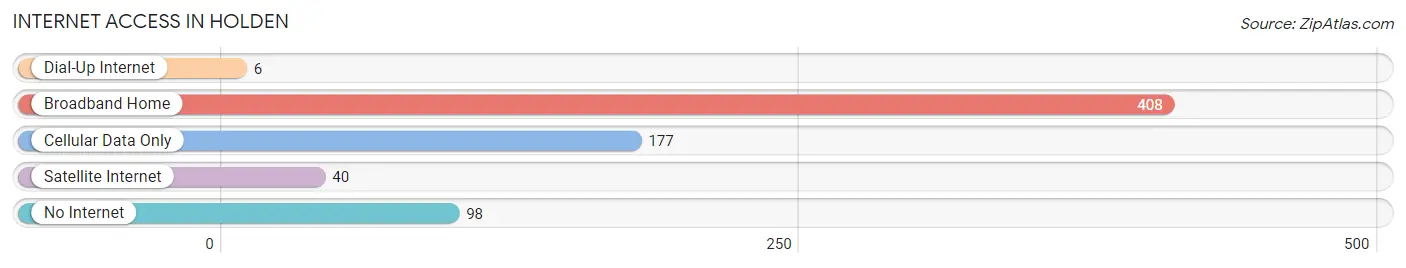
| Internet Type | # Households | % Households |
| Dial-Up Internet | 6 | 0.8% |
| Broadband Home | 408 | 53.9% |
| Cellular Data Only | 177 | 23.4% |
| Satellite Internet | 40 | 5.3% |
| No Internet | 98 | 13.0% |
| Total | 757 | 100.0% |
Holden Summary
Holden, Missouri is a small city located in Johnson County, Missouri. It is situated in the western part of the state, approximately 40 miles east of Kansas City. The city has a population of approximately 2,500 people and is part of the Kansas City metropolitan area.
History
Holden was founded in 1858 by a group of settlers from Kentucky. The city was named after William Holden, a prominent local businessman. The city was incorporated in 1872 and has remained a small, rural community ever since.
The city was an important stop on the Missouri Pacific Railroad, which ran through the city until the late 1960s. The railroad was a major source of employment for the city and helped to spur economic growth.
Geography
Holden is located in the western part of Johnson County, Missouri. It is situated in the Ozark Plateau region of the state, which is characterized by rolling hills and forests. The city is located approximately 40 miles east of Kansas City and is part of the Kansas City metropolitan area.
The city is situated along the Holden Creek, which is a tributary of the Osage River. The city is also located near several other small towns, including Kingsville, Knob Noster, and Warrensburg.
Economy
The economy of Holden is largely based on agriculture and manufacturing. The city is home to several small businesses, including a feed mill, a lumber yard, and a furniture factory. The city also has a small retail sector, with several small stores and restaurants.
The city is also home to several large employers, including a manufacturing plant and a distribution center. The city is also home to a large state prison, which provides employment for many of the city's residents.
Demographics
As of the 2010 census, the population of Holden was 2,500. The racial makeup of the city was 95.2% White, 0.8% African American, 0.4% Native American, 0.4% Asian, 0.2% Pacific Islander, and 2.8% from other races. Hispanic or Latino of any race were 3.2% of the population.
The median household income in Holden was $37,500, and the median family income was $45,000. The per capita income for the city was $18,000. About 11.2% of families and 14.2% of the population were below the poverty line, including 18.2% of those under age 18 and 8.2% of those age 65 or over.
Holden is a small, rural city with a long history and a strong sense of community. The city has a diverse economy and a diverse population, and is a great place to live and work.
Common Questions
What is Per Capita Income in Holden?
Per Capita income in Holden is $26,032.
What is the Median Family Income in Holden?
Median Family Income in Holden is $67,500.
What is the Median Household income in Holden?
Median Household Income in Holden is $58,661.
What is Income or Wage Gap in Holden?
Income or Wage Gap in Holden is 36.8%.
Women in Holden earn 63.2 cents for every dollar earned by a man.
What is Inequality or Gini Index in Holden?
Inequality or Gini Index in Holden is 0.38.
What is the Total Population of Holden?
Total Population of Holden is 1,840.
What is the Total Male Population of Holden?
Total Male Population of Holden is 904.
What is the Total Female Population of Holden?
Total Female Population of Holden is 936.
What is the Ratio of Males per 100 Females in Holden?
There are 96.58 Males per 100 Females in Holden.
What is the Ratio of Females per 100 Males in Holden?
There are 103.54 Females per 100 Males in Holden.
What is the Median Population Age in Holden?
Median Population Age in Holden is 40.2 Years.
What is the Average Family Size in Holden
Average Family Size in Holden is 2.8 People.
What is the Average Household Size in Holden
Average Household Size in Holden is 2.4 People.
How Large is the Labor Force in Holden?
There are 900 People in the Labor Forcein in Holden.
What is the Percentage of People in the Labor Force in Holden?
62.6% of People are in the Labor Force in Holden.
What is the Unemployment Rate in Holden?
Unemployment Rate in Holden is 5.4%.