Cities with the Highest Percentage of Households With Three or more Vehicles in Missouri
RELATED REPORTS & OPTIONS
Households with 3 or more Cars
Missouri
Compare Cities
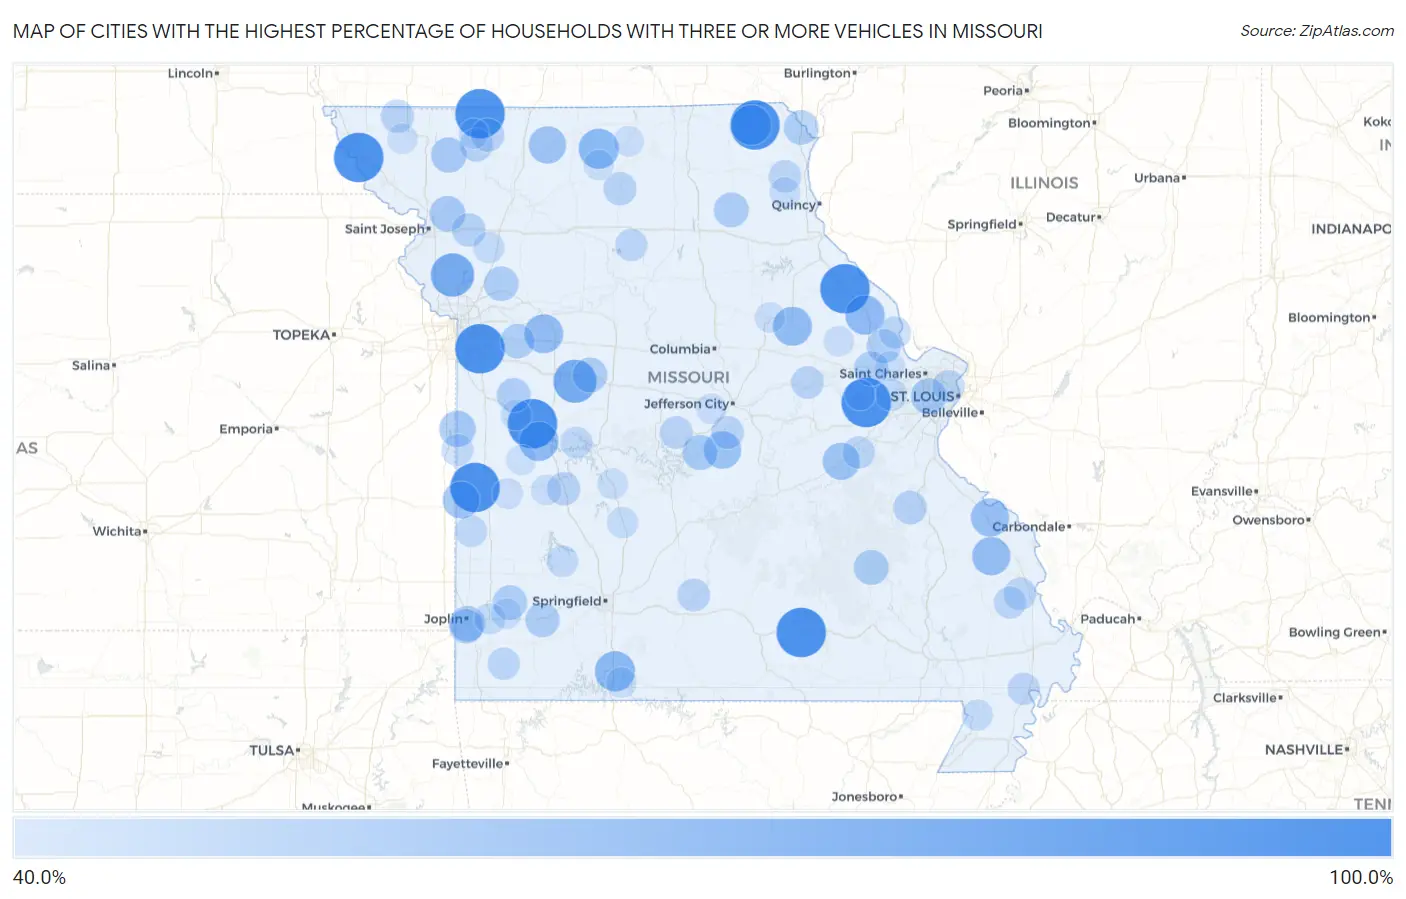
Map of Cities with the Highest Percentage of Households With Three or more Vehicles in Missouri
0.0%
100.0%
Cities with the Highest Percentage of Households With Three or more Vehicles in Missouri
| City | Housholds With 3+ Cars | vs State | vs National | |
| 1. | Vibbard | 100.0% | 29.8%(+70.2)#1 | 29.0%(+71.0)#30 |
| 2. | Montier | 100.0% | 29.8%(+70.2)#2 | 29.0%(+71.0)#193 |
| 3. | Unity Village | 100.0% | 29.8%(+70.2)#3 | 29.0%(+71.0)#205 |
| 4. | Grovespring | 100.0% | 29.8%(+70.2)#4 | 29.0%(+71.0)#211 |
| 5. | Broseley | 100.0% | 29.8%(+70.2)#5 | 29.0%(+71.0)#220 |
| 6. | Hartwell | 100.0% | 29.8%(+70.2)#6 | 29.0%(+71.0)#226 |
| 7. | Buell | 100.0% | 29.8%(+70.2)#7 | 29.0%(+71.0)#297 |
| 8. | Tarrants | 100.0% | 29.8%(+70.2)#8 | 29.0%(+71.0)#336 |
| 9. | Irena | 100.0% | 29.8%(+70.2)#9 | 29.0%(+71.0)#360 |
| 10. | Granger | 100.0% | 29.8%(+70.2)#10 | 29.0%(+71.0)#369 |
| 11. | Metz | 100.0% | 29.8%(+70.2)#11 | 29.0%(+71.0)#373 |
| 12. | Three Creeks | 100.0% | 29.8%(+70.2)#12 | 29.0%(+71.0)#382 |
| 13. | Corning | 100.0% | 29.8%(+70.2)#13 | 29.0%(+71.0)#386 |
| 14. | Ridgely | 83.3% | 29.8%(+53.5)#14 | 29.0%(+54.3)#513 |
| 15. | Whiteman Afb | 82.8% | 29.8%(+53.0)#15 | 29.0%(+53.8)#527 |
| 16. | Saverton | 76.0% | 29.8%(+46.2)#16 | 29.0%(+47.0)#702 |
| 17. | Bull Creek | 75.0% | 29.8%(+45.2)#17 | 29.0%(+46.0)#723 |
| 18. | Denton | 75.0% | 29.8%(+45.2)#18 | 29.0%(+46.0)#731 |
| 19. | Harris | 75.0% | 29.8%(+45.2)#19 | 29.0%(+46.0)#738 |
| 20. | Arbela | 75.0% | 29.8%(+45.2)#20 | 29.0%(+46.0)#745 |
| 21. | Whiteside | 72.7% | 29.8%(+42.9)#21 | 29.0%(+43.7)#812 |
| 22. | La Due | 72.7% | 29.8%(+42.9)#22 | 29.0%(+43.7)#815 |
| 23. | Martinsburg | 72.1% | 29.8%(+42.3)#23 | 29.0%(+43.1)#827 |
| 24. | Mayview | 71.2% | 29.8%(+41.4)#24 | 29.0%(+42.2)#855 |
| 25. | Sedgewickville | 70.0% | 29.8%(+40.2)#25 | 29.0%(+41.0)#892 |
| 26. | Brewer | 69.6% | 29.8%(+39.8)#26 | 29.0%(+40.6)#907 |
| 27. | St Elizabeth | 68.0% | 29.8%(+38.2)#27 | 29.0%(+39.0)#989 |
| 28. | Mount Moriah | 67.3% | 29.8%(+37.5)#28 | 29.0%(+38.3)#1,026 |
| 29. | Richards | 66.7% | 29.8%(+36.9)#29 | 29.0%(+37.7)#1,060 |
| 30. | St Cloud | 66.7% | 29.8%(+36.9)#30 | 29.0%(+37.7)#1,091 |
| 31. | Tebbetts | 65.4% | 29.8%(+35.6)#31 | 29.0%(+36.4)#1,156 |
| 32. | Merwin | 64.7% | 29.8%(+34.9)#32 | 29.0%(+35.7)#1,209 |
| 33. | Country Life Acres | 63.6% | 29.8%(+33.8)#33 | 29.0%(+34.6)#1,278 |
| 34. | Millersville | 63.3% | 29.8%(+33.5)#34 | 29.0%(+34.3)#1,297 |
| 35. | Cosby | 63.0% | 29.8%(+33.2)#35 | 29.0%(+34.0)#1,326 |
| 36. | Shawneetown | 63.0% | 29.8%(+33.2)#36 | 29.0%(+34.0)#1,327 |
| 37. | Dennis Acres | 62.5% | 29.8%(+32.7)#37 | 29.0%(+33.5)#1,366 |
| 38. | Clyde | 62.5% | 29.8%(+32.7)#38 | 29.0%(+33.5)#1,370 |
| 39. | Tuscumbia | 61.8% | 29.8%(+32.0)#39 | 29.0%(+32.8)#1,437 |
| 40. | Aurora Springs | 61.5% | 29.8%(+31.7)#40 | 29.0%(+32.5)#1,456 |
| 41. | La Monte | 61.1% | 29.8%(+31.3)#41 | 29.0%(+32.1)#1,499 |
| 42. | Centerville | 61.1% | 29.8%(+31.3)#42 | 29.0%(+32.1)#1,505 |
| 43. | Leonard | 60.9% | 29.8%(+31.1)#43 | 29.0%(+31.9)#1,535 |
| 44. | St Francisville | 60.6% | 29.8%(+30.8)#44 | 29.0%(+31.6)#1,559 |
| 45. | Excelsior Estates | 60.5% | 29.8%(+30.7)#45 | 29.0%(+31.5)#1,565 |
| 46. | Bates City | 60.0% | 29.8%(+30.2)#46 | 29.0%(+31.0)#1,618 |
| 47. | Avilla | 60.0% | 29.8%(+30.2)#47 | 29.0%(+31.0)#1,633 |
| 48. | Hoberg | 60.0% | 29.8%(+30.2)#48 | 29.0%(+31.0)#1,639 |
| 49. | Cliff Village | 60.0% | 29.8%(+30.2)#49 | 29.0%(+31.0)#1,642 |
| 50. | Foristell | 59.9% | 29.8%(+30.1)#50 | 29.0%(+30.9)#1,652 |
| 51. | Fountain N Lakes | 59.3% | 29.8%(+29.5)#51 | 29.0%(+30.3)#1,719 |
| 52. | La Tour | 59.1% | 29.8%(+29.3)#52 | 29.0%(+30.1)#1,748 |
| 53. | Frankclay | 57.8% | 29.8%(+28.0)#53 | 29.0%(+28.8)#1,903 |
| 54. | Stewartsville | 57.5% | 29.8%(+27.7)#54 | 29.0%(+28.5)#1,936 |
| 55. | Shakertowne | 57.4% | 29.8%(+27.6)#55 | 29.0%(+28.4)#1,944 |
| 56. | Elmo | 57.1% | 29.8%(+27.3)#56 | 29.0%(+28.1)#1,972 |
| 57. | Gentry | 57.1% | 29.8%(+27.3)#57 | 29.0%(+28.1)#1,979 |
| 58. | Vista | 57.1% | 29.8%(+27.3)#58 | 29.0%(+28.1)#1,986 |
| 59. | Denver | 57.1% | 29.8%(+27.3)#59 | 29.0%(+28.1)#1,989 |
| 60. | Browning | 56.7% | 29.8%(+26.9)#60 | 29.0%(+27.7)#2,047 |
| 61. | Hartville | 56.1% | 29.8%(+26.3)#61 | 29.0%(+27.1)#2,129 |
| 62. | St Thomas | 55.8% | 29.8%(+26.0)#62 | 29.0%(+26.8)#2,180 |
| 63. | Barnett | 55.8% | 29.8%(+26.0)#63 | 29.0%(+26.8)#2,183 |
| 64. | Rhineland | 55.6% | 29.8%(+25.8)#64 | 29.0%(+26.6)#2,209 |
| 65. | Dutchtown | 55.2% | 29.8%(+25.4)#65 | 29.0%(+26.2)#2,280 |
| 66. | Monticello | 54.8% | 29.8%(+25.0)#66 | 29.0%(+25.8)#2,337 |
| 67. | Miramiguoa Park | 54.8% | 29.8%(+25.0)#67 | 29.0%(+25.8)#2,339 |
| 68. | Delta | 54.5% | 29.8%(+24.7)#68 | 29.0%(+25.5)#2,371 |
| 69. | Stella | 54.5% | 29.8%(+24.7)#69 | 29.0%(+25.5)#2,375 |
| 70. | Rothville | 54.5% | 29.8%(+24.7)#70 | 29.0%(+25.5)#2,388 |
| 71. | Lilbourn | 54.3% | 29.8%(+24.5)#71 | 29.0%(+25.3)#2,408 |
| 72. | Pine Lawn | 54.1% | 29.8%(+24.3)#72 | 29.0%(+25.1)#2,444 |
| 73. | Foley | 54.1% | 29.8%(+24.3)#73 | 29.0%(+25.1)#2,460 |
| 74. | Amoret | 53.8% | 29.8%(+24.0)#74 | 29.0%(+24.8)#2,501 |
| 75. | Bronaugh | 53.6% | 29.8%(+23.8)#75 | 29.0%(+24.6)#2,551 |
| 76. | Tightwad | 53.6% | 29.8%(+23.8)#76 | 29.0%(+24.6)#2,552 |
| 77. | Defiance | 52.9% | 29.8%(+23.1)#77 | 29.0%(+23.9)#2,705 |
| 78. | Dadeville | 52.5% | 29.8%(+22.7)#78 | 29.0%(+23.5)#2,781 |
| 79. | Turney | 52.2% | 29.8%(+22.4)#79 | 29.0%(+23.2)#2,855 |
| 80. | Louisburg | 51.7% | 29.8%(+21.9)#80 | 29.0%(+22.7)#2,953 |
| 81. | Fidelity | 51.5% | 29.8%(+21.7)#81 | 29.0%(+22.5)#2,988 |
| 82. | Holcomb | 51.4% | 29.8%(+21.6)#82 | 29.0%(+22.4)#3,005 |
| 83. | Creighton | 51.0% | 29.8%(+21.2)#83 | 29.0%(+22.0)#3,074 |
| 84. | Cross Timbers | 50.7% | 29.8%(+20.9)#84 | 29.0%(+21.7)#3,135 |
| 85. | Ewing | 50.6% | 29.8%(+20.8)#85 | 29.0%(+21.6)#3,154 |
| 86. | Marthasville | 50.0% | 29.8%(+20.2)#86 | 29.0%(+21.0)#3,244 |
| 87. | Lohman | 50.0% | 29.8%(+20.2)#87 | 29.0%(+21.0)#3,292 |
| 88. | Reeds | 50.0% | 29.8%(+20.2)#88 | 29.0%(+21.0)#3,298 |
| 89. | Roscoe | 50.0% | 29.8%(+20.2)#89 | 29.0%(+21.0)#3,332 |
| 90. | Kirbyville | 50.0% | 29.8%(+20.2)#90 | 29.0%(+21.0)#3,339 |
| 91. | Vandiver | 50.0% | 29.8%(+20.2)#91 | 29.0%(+21.0)#3,340 |
| 92. | Truxton | 50.0% | 29.8%(+20.2)#92 | 29.0%(+21.0)#3,376 |
| 93. | Middle Grove | 50.0% | 29.8%(+20.2)#93 | 29.0%(+21.0)#3,382 |
| 94. | Worth | 50.0% | 29.8%(+20.2)#94 | 29.0%(+21.0)#3,384 |
| 95. | Osgood | 50.0% | 29.8%(+20.2)#95 | 29.0%(+21.0)#3,389 |
| 96. | Pollock | 50.0% | 29.8%(+20.2)#96 | 29.0%(+21.0)#3,406 |
| 97. | Quitman | 50.0% | 29.8%(+20.2)#97 | 29.0%(+21.0)#3,412 |
| 98. | Harwood | 50.0% | 29.8%(+20.2)#98 | 29.0%(+21.0)#3,423 |
| 99. | Josephville | 49.5% | 29.8%(+19.7)#99 | 29.0%(+20.5)#3,502 |
| 100. | Appleton City | 49.2% | 29.8%(+19.4)#100 | 29.0%(+20.2)#3,560 |
Common Questions
What are the Top 10 Cities with the Highest Percentage of Households With Three or more Vehicles in Missouri?
Top 10 Cities with the Highest Percentage of Households With Three or more Vehicles in Missouri are:
#1
100.0%
#2
100.0%
#3
100.0%
#4
100.0%
#5
100.0%
#6
100.0%
#7
100.0%
#8
100.0%
#9
100.0%
#10
83.3%
What city has the Highest Percentage of Households With Three or more Vehicles in Missouri?
Montier has the Highest Percentage of Households With Three or more Vehicles in Missouri with 100.0%.
What is the Percentage of Households With Three or more Vehicles in the State of Missouri?
Percentage of Households With Three or more Vehicles in Missouri is 29.8%.
What is the Percentage of Households With Three or more Vehicles in the United States?
Percentage of Households With Three or more Vehicles in the United States is 29.0%.