Wright City, MO Map & Demographics
Wright City Map
Wright City Overview
$29,328
PER CAPITA INCOME
$80,938
AVG FAMILY INCOME
$74,904
AVG HOUSEHOLD INCOME
39.9%
WAGE / INCOME GAP [ % ]
60.1¢/ $1
WAGE / INCOME GAP [ $ ]
0.32
INEQUALITY / GINI INDEX
4,828
TOTAL POPULATION
2,780
MALE POPULATION
2,048
FEMALE POPULATION
135.74
MALES / 100 FEMALES
73.67
FEMALES / 100 MALES
36.4
MEDIAN AGE
3.2
AVG FAMILY SIZE
2.9
AVG HOUSEHOLD SIZE
2,457
LABOR FORCE [ PEOPLE ]
65.9%
PERCENT IN LABOR FORCE
6.6%
UNEMPLOYMENT RATE
Wright City Zip Codes
Wright City Area Codes
Income in Wright City
Income Overview in Wright City
Per Capita Income in Wright City is $29,328, while median incomes of families and households are $80,938 and $74,904 respectively.
| Characteristic | Number | Measure |
| Per Capita Income | 4,828 | $29,328 |
| Median Family Income | 1,235 | $80,938 |
| Mean Family Income | 1,235 | $82,599 |
| Median Household Income | 1,687 | $74,904 |
| Mean Household Income | 1,687 | $78,061 |
| Income Deficit | 1,235 | $0 |
| Wage / Income Gap (%) | 4,828 | 39.90% |
| Wage / Income Gap ($) | 4,828 | 60.10¢ per $1 |
| Gini / Inequality Index | 4,828 | 0.32 |
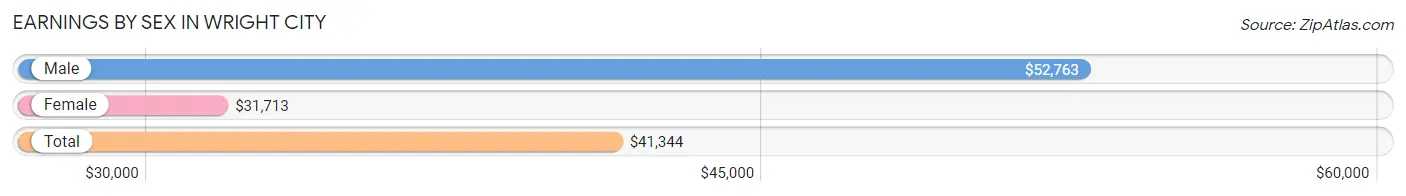
Earnings by Sex in Wright City
Average Earnings in Wright City are $41,344, $52,763 for men and $31,713 for women, a difference of 39.9%.
| Sex | Number | Average Earnings |
| Male | 1,376 (56.4%) | $52,763 |
| Female | 1,066 (43.6%) | $31,713 |
| Total | 2,442 (100.0%) | $41,344 |
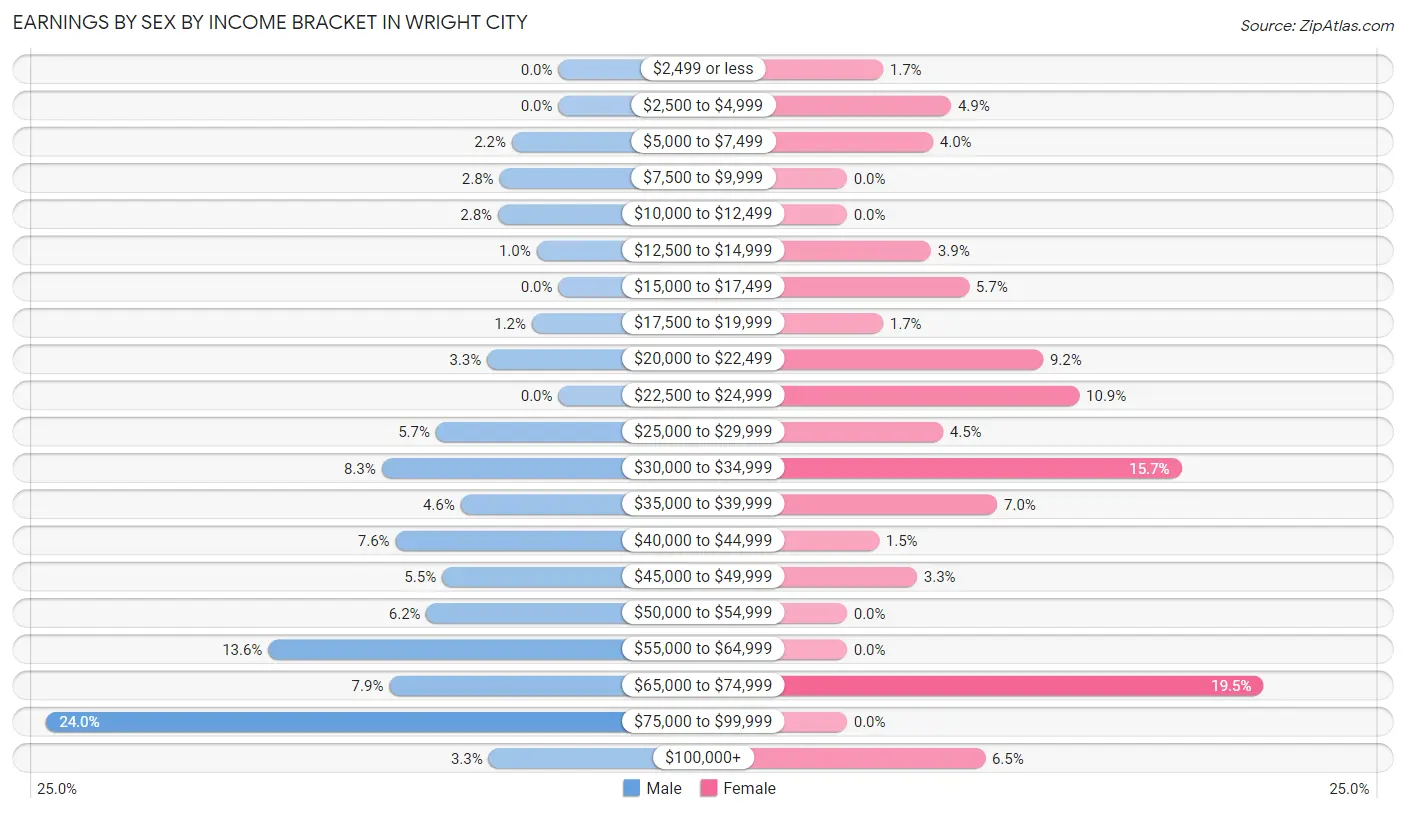
Earnings by Sex by Income Bracket in Wright City
The most common earnings brackets in Wright City are $75,000 to $99,999 for men (330 | 24.0%) and $65,000 to $74,999 for women (208 | 19.5%).
| Income | Male | Female |
| $2,499 or less | 0 (0.0%) | 18 (1.7%) |
| $2,500 to $4,999 | 0 (0.0%) | 52 (4.9%) |
| $5,000 to $7,499 | 30 (2.2%) | 43 (4.0%) |
| $7,500 to $9,999 | 38 (2.8%) | 0 (0.0%) |
| $10,000 to $12,499 | 39 (2.8%) | 0 (0.0%) |
| $12,500 to $14,999 | 14 (1.0%) | 42 (3.9%) |
| $15,000 to $17,499 | 0 (0.0%) | 61 (5.7%) |
| $17,500 to $19,999 | 17 (1.2%) | 18 (1.7%) |
| $20,000 to $22,499 | 46 (3.3%) | 98 (9.2%) |
| $22,500 to $24,999 | 0 (0.0%) | 116 (10.9%) |
| $25,000 to $29,999 | 79 (5.7%) | 48 (4.5%) |
| $30,000 to $34,999 | 114 (8.3%) | 167 (15.7%) |
| $35,000 to $39,999 | 63 (4.6%) | 75 (7.0%) |
| $40,000 to $44,999 | 105 (7.6%) | 16 (1.5%) |
| $45,000 to $49,999 | 75 (5.4%) | 35 (3.3%) |
| $50,000 to $54,999 | 85 (6.2%) | 0 (0.0%) |
| $55,000 to $64,999 | 187 (13.6%) | 0 (0.0%) |
| $65,000 to $74,999 | 109 (7.9%) | 208 (19.5%) |
| $75,000 to $99,999 | 330 (24.0%) | 0 (0.0%) |
| $100,000+ | 45 (3.3%) | 69 (6.5%) |
| Total | 1,376 (100.0%) | 1,066 (100.0%) |
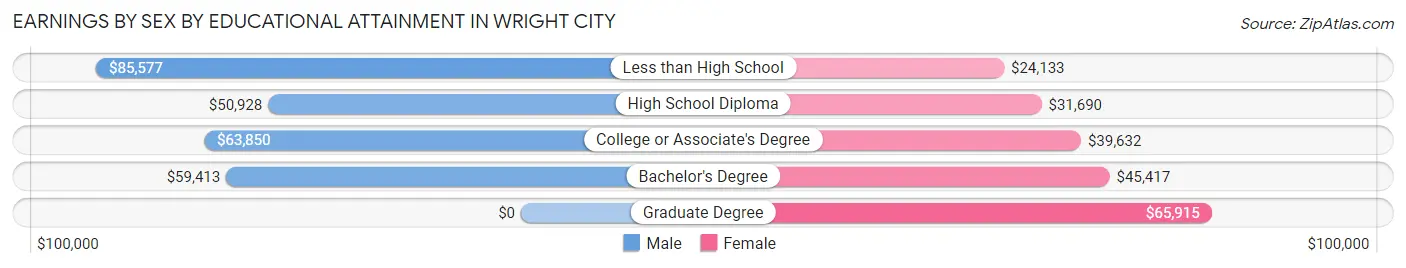
Earnings by Sex by Educational Attainment in Wright City
Average earnings in Wright City are $58,277 for men and $34,336 for women, a difference of 41.1%. Men with an educational attainment of less than high school enjoy the highest average annual earnings of $85,577, while those with high school diploma education earn the least with $50,928. Women with an educational attainment of graduate degree earn the most with the average annual earnings of $65,915, while those with less than high school education have the smallest earnings of $24,133.
| Educational Attainment | Male Income | Female Income |
| Less than High School | $85,577 | $24,133 |
| High School Diploma | $50,928 | $31,690 |
| College or Associate's Degree | $63,850 | $39,632 |
| Bachelor's Degree | $59,413 | $45,417 |
| Graduate Degree | - | - |
| Total | $58,277 | $34,336 |
Family Income in Wright City
Family Income Brackets in Wright City
According to the Wright City family income data, there are 353 families falling into the $100,000 to $149,999 income range, which is the most common income bracket and makes up 28.6% of all families.
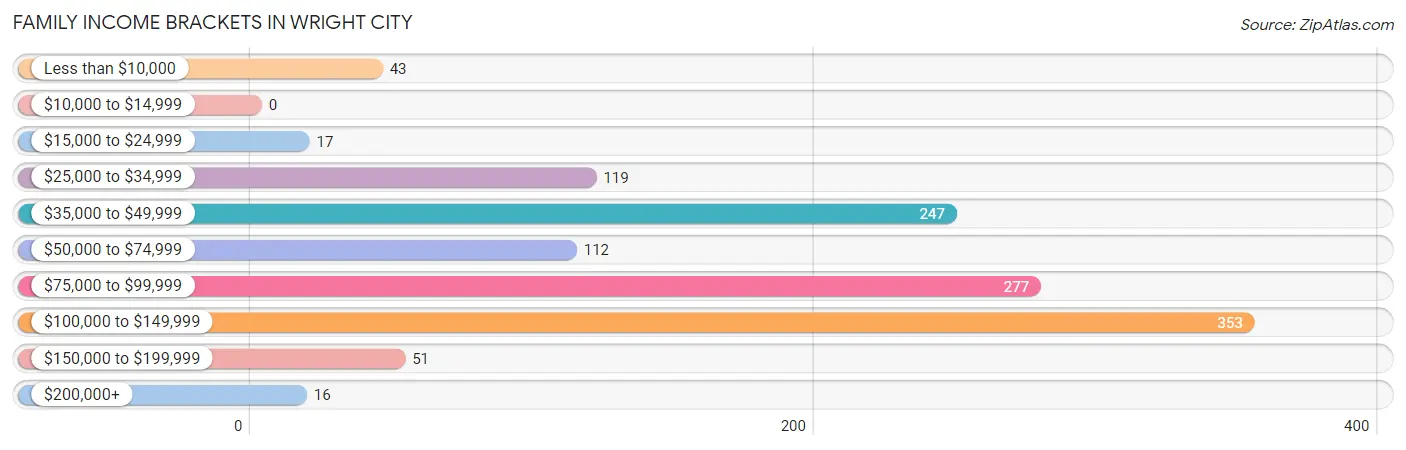
| Income Bracket | # Families | % Families |
| Less than $10,000 | 43 | 3.5% |
| $10,000 to $14,999 | 0 | 0.0% |
| $15,000 to $24,999 | 17 | 1.4% |
| $25,000 to $34,999 | 119 | 9.6% |
| $35,000 to $49,999 | 247 | 20.0% |
| $50,000 to $74,999 | 112 | 9.1% |
| $75,000 to $99,999 | 277 | 22.4% |
| $100,000 to $149,999 | 353 | 28.6% |
| $150,000 to $199,999 | 51 | 4.1% |
| $200,000+ | 16 | 1.3% |
Family Income by Famaliy Size in Wright City
4-person families (221 | 17.9%) account for the highest median family income in Wright City with $118,839 per family, while 2-person families (655 | 53.0%) have the highest median income of $39,219 per family member.
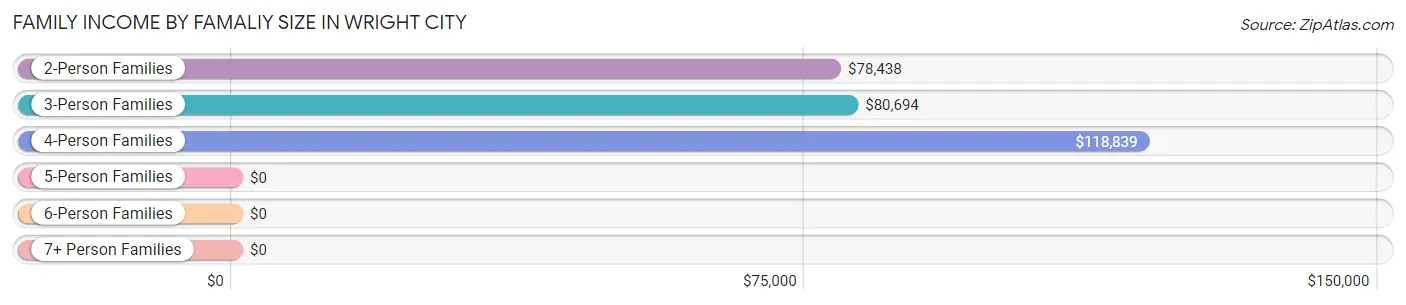
| Income Bracket | # Families | Median Income |
| 2-Person Families | 655 (53.0%) | $78,438 |
| 3-Person Families | 142 (11.5%) | $80,694 |
| 4-Person Families | 221 (17.9%) | $118,839 |
| 5-Person Families | 131 (10.6%) | $0 |
| 6-Person Families | 69 (5.6%) | $0 |
| 7+ Person Families | 17 (1.4%) | $0 |
| Total | 1,235 (100.0%) | $80,938 |
Family Income by Number of Earners in Wright City
The median family income in Wright City is $80,938, with families comprising 3+ earners (74) having the highest median family income of $107,750, while families with no earners (150) have the lowest median family income of $29,643, accounting for 6.0% and 12.1% of families, respectively.
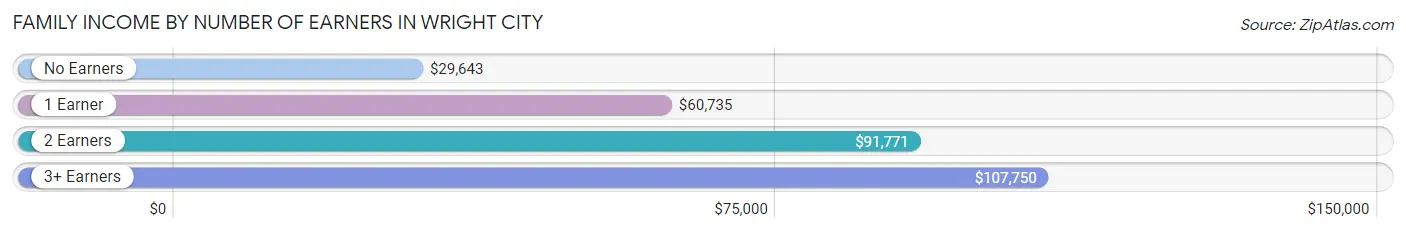
| Number of Earners | # Families | Median Income |
| No Earners | 150 (12.1%) | $29,643 |
| 1 Earner | 554 (44.9%) | $60,735 |
| 2 Earners | 457 (37.0%) | $91,771 |
| 3+ Earners | 74 (6.0%) | $107,750 |
| Total | 1,235 (100.0%) | $80,938 |
Household Income in Wright City
Household Income Brackets in Wright City
With 474 households falling in the category, the $100,000 to $149,999 income range is the most frequent in Wright City, accounting for 28.1% of all households.
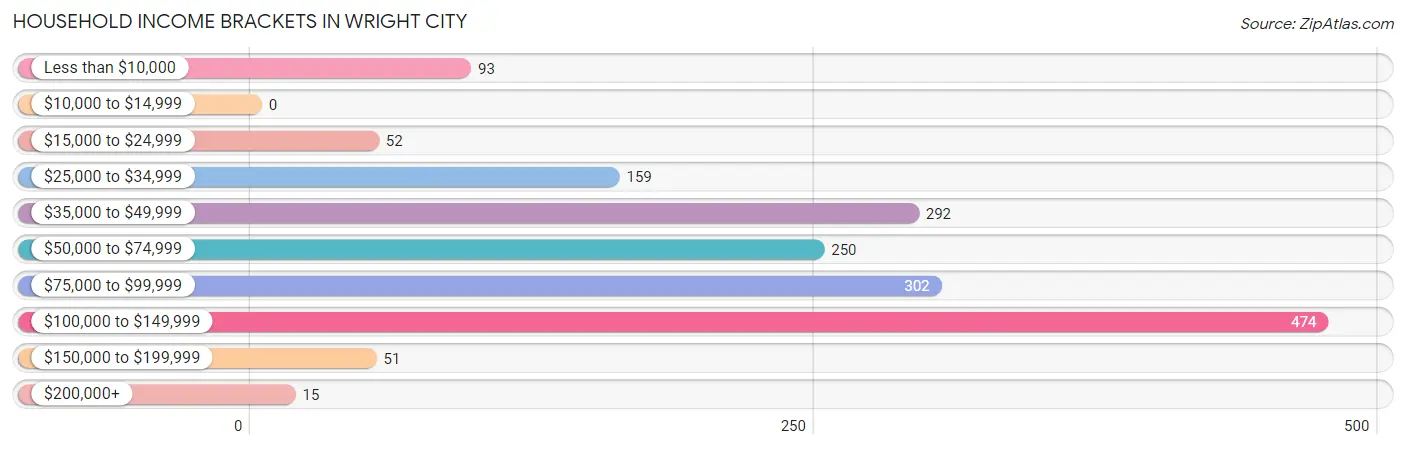
| Income Bracket | # Households | % Households |
| Less than $10,000 | 93 | 5.5% |
| $10,000 to $14,999 | 0 | 0.0% |
| $15,000 to $24,999 | 52 | 3.1% |
| $25,000 to $34,999 | 159 | 9.4% |
| $35,000 to $49,999 | 292 | 17.3% |
| $50,000 to $74,999 | 250 | 14.8% |
| $75,000 to $99,999 | 302 | 17.9% |
| $100,000 to $149,999 | 474 | 28.1% |
| $150,000 to $199,999 | 51 | 3.0% |
| $200,000+ | 15 | 0.9% |
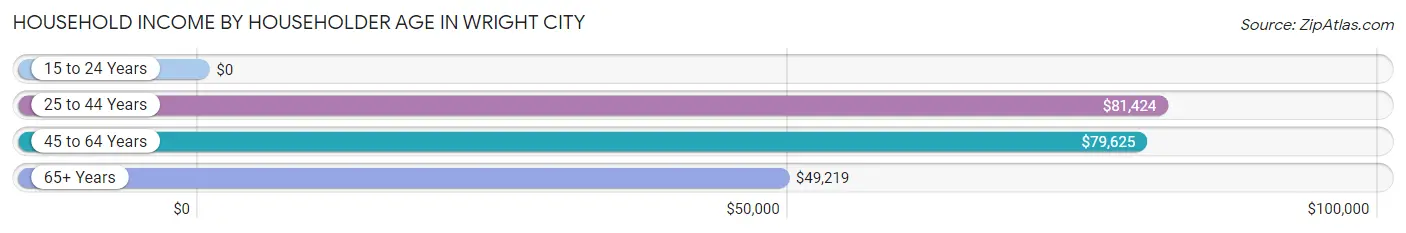
Household Income by Householder Age in Wright City
The median household income in Wright City is $74,904, with the highest median household income of $81,424 found in the 25 to 44 years age bracket for the primary householder. A total of 647 households (38.4%) fall into this category. Meanwhile, the 15 to 24 years age bracket for the primary householder has the lowest median household income of $0, with 49 households (2.9%) in this group.
| Income Bracket | # Households | Median Income |
| 15 to 24 Years | 49 (2.9%) | $0 |
| 25 to 44 Years | 647 (38.4%) | $81,424 |
| 45 to 64 Years | 538 (31.9%) | $79,625 |
| 65+ Years | 453 (26.9%) | $49,219 |
| Total | 1,687 (100.0%) | $74,904 |
Poverty in Wright City
Income Below Poverty by Sex and Age in Wright City
With 7.0% poverty level for males and 13.0% for females among the residents of Wright City, under 5 year old males and 12 to 14 year old females are the most vulnerable to poverty, with 84 males (59.6%) and 53 females (67.1%) in their respective age groups living below the poverty level.
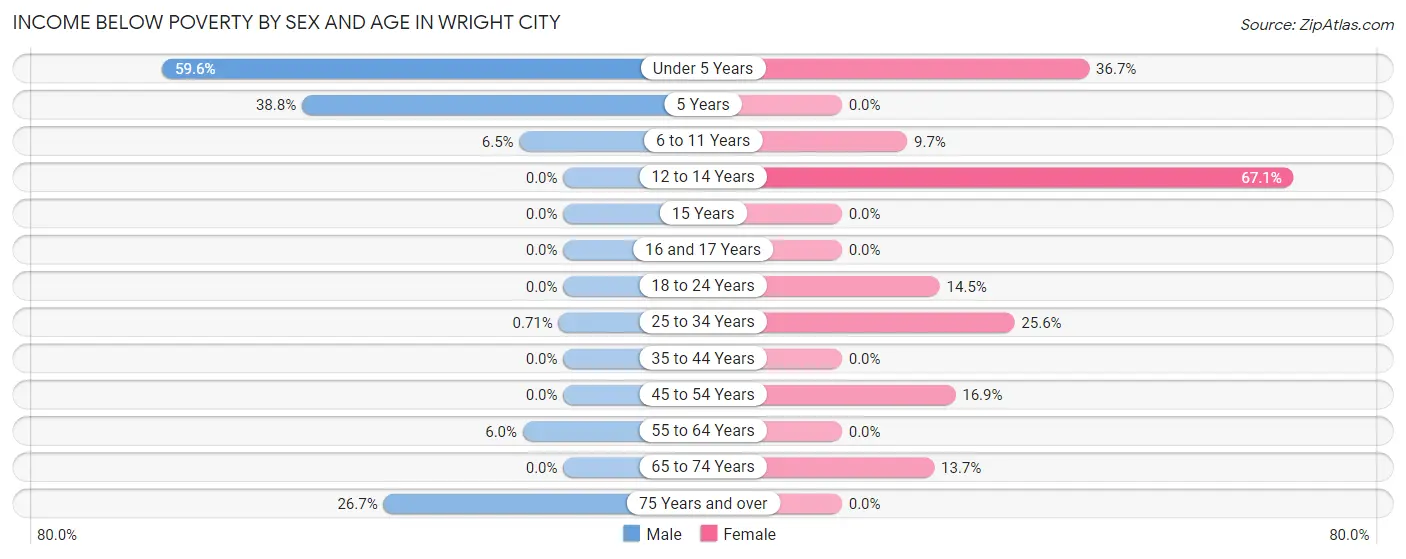
| Age Bracket | Male | Female |
| Under 5 Years | 84 (59.6%) | 18 (36.7%) |
| 5 Years | 26 (38.8%) | 0 (0.0%) |
| 6 to 11 Years | 18 (6.5%) | 26 (9.7%) |
| 12 to 14 Years | 0 (0.0%) | 53 (67.1%) |
| 15 Years | 0 (0.0%) | 0 (0.0%) |
| 16 and 17 Years | 0 (0.0%) | 0 (0.0%) |
| 18 to 24 Years | 0 (0.0%) | 34 (14.5%) |
| 25 to 34 Years | 3 (0.7%) | 81 (25.6%) |
| 35 to 44 Years | 0 (0.0%) | 0 (0.0%) |
| 45 to 54 Years | 0 (0.0%) | 30 (16.9%) |
| 55 to 64 Years | 20 (6.0%) | 0 (0.0%) |
| 65 to 74 Years | 0 (0.0%) | 24 (13.7%) |
| 75 Years and over | 43 (26.7%) | 0 (0.0%) |
| Total | 194 (7.0%) | 266 (13.0%) |
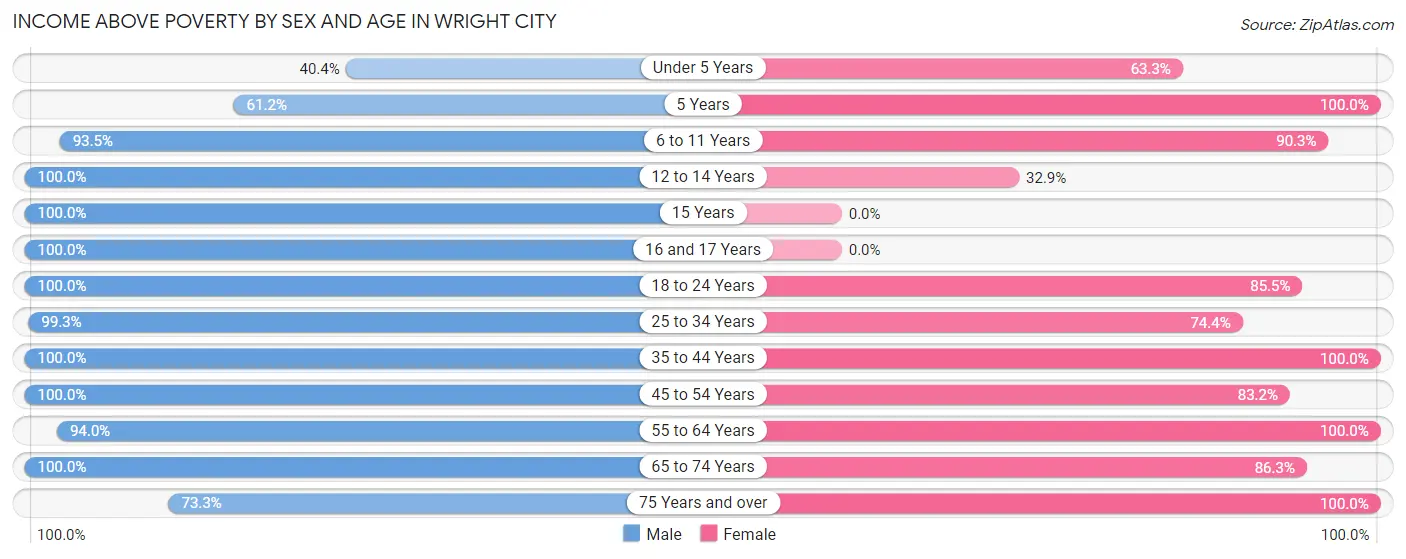
Income Above Poverty by Sex and Age in Wright City
According to the poverty statistics in Wright City, males aged 12 to 14 years and females aged 5 years are the age groups that are most secure financially, with 100.0% of males and 100.0% of females in these age groups living above the poverty line.
| Age Bracket | Male | Female |
| Under 5 Years | 57 (40.4%) | 31 (63.3%) |
| 5 Years | 41 (61.2%) | 27 (100.0%) |
| 6 to 11 Years | 258 (93.5%) | 242 (90.3%) |
| 12 to 14 Years | 169 (100.0%) | 26 (32.9%) |
| 15 Years | 23 (100.0%) | 0 (0.0%) |
| 16 and 17 Years | 79 (100.0%) | 0 (0.0%) |
| 18 to 24 Years | 163 (100.0%) | 200 (85.5%) |
| 25 to 34 Years | 417 (99.3%) | 235 (74.4%) |
| 35 to 44 Years | 444 (100.0%) | 324 (100.0%) |
| 45 to 54 Years | 310 (100.0%) | 148 (83.2%) |
| 55 to 64 Years | 313 (94.0%) | 257 (100.0%) |
| 65 to 74 Years | 194 (100.0%) | 151 (86.3%) |
| 75 Years and over | 118 (73.3%) | 141 (100.0%) |
| Total | 2,586 (93.0%) | 1,782 (87.0%) |
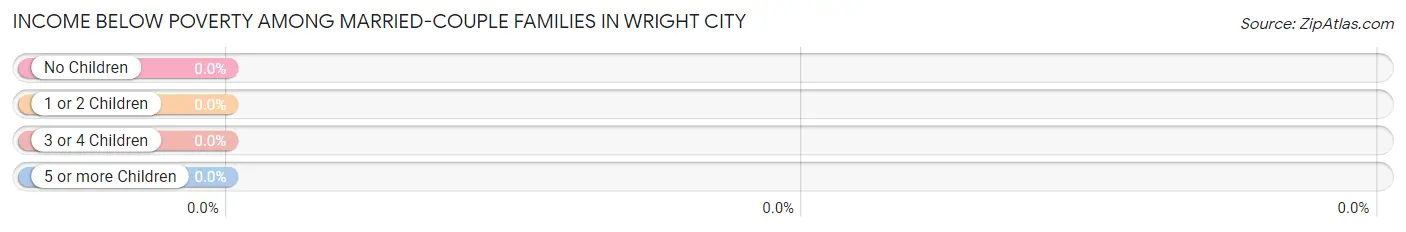
Income Below Poverty Among Married-Couple Families in Wright City
| Children | Above Poverty | Below Poverty |
| No Children | 498 (100.0%) | 0 (0.0%) |
| 1 or 2 Children | 210 (100.0%) | 0 (0.0%) |
| 3 or 4 Children | 157 (100.0%) | 0 (0.0%) |
| 5 or more Children | 17 (100.0%) | 0 (0.0%) |
| Total | 882 (100.0%) | 0 (0.0%) |
Income Below Poverty Among Single-Parent Households in Wright City
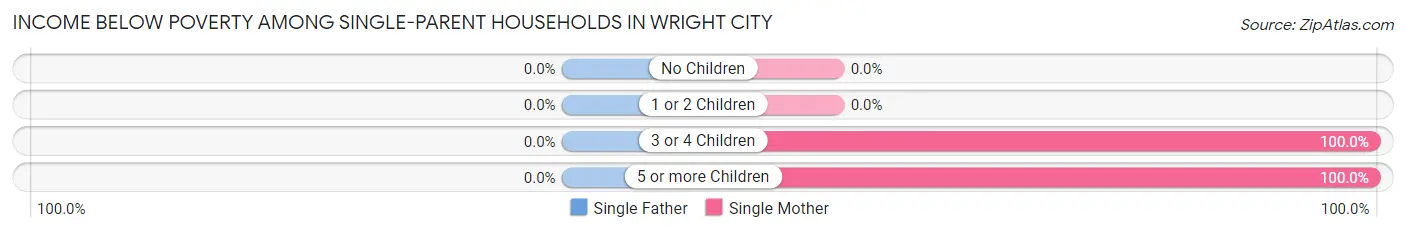
| Children | Single Father | Single Mother |
| No Children | 0 (0.0%) | 0 (0.0%) |
| 1 or 2 Children | 0 (0.0%) | 0 (0.0%) |
| 3 or 4 Children | 0 (0.0%) | 14 (100.0%) |
| 5 or more Children | 0 (0.0%) | 29 (100.0%) |
| Total | 0 (0.0%) | 43 (25.4%) |
Income Below Poverty Among Married-Couple vs Single-Parent Households in Wright City
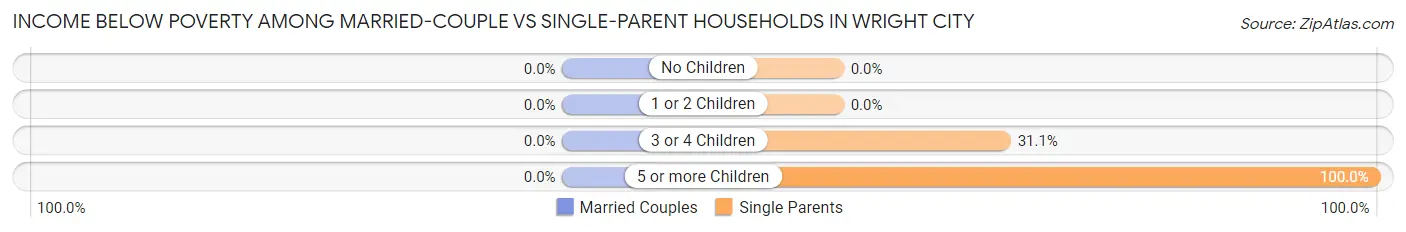
| Children | Married-Couple Families | Single-Parent Households |
| No Children | 0 (0.0%) | 0 (0.0%) |
| 1 or 2 Children | 0 (0.0%) | 0 (0.0%) |
| 3 or 4 Children | 0 (0.0%) | 14 (31.1%) |
| 5 or more Children | 0 (0.0%) | 29 (100.0%) |
| Total | 0 (0.0%) | 43 (12.2%) |
Race in Wright City
The most populous races in Wright City are White / Caucasian (3,698 | 76.6%), Hispanic or Latino (509 | 10.5%), and Two or more Races (488 | 10.1%).
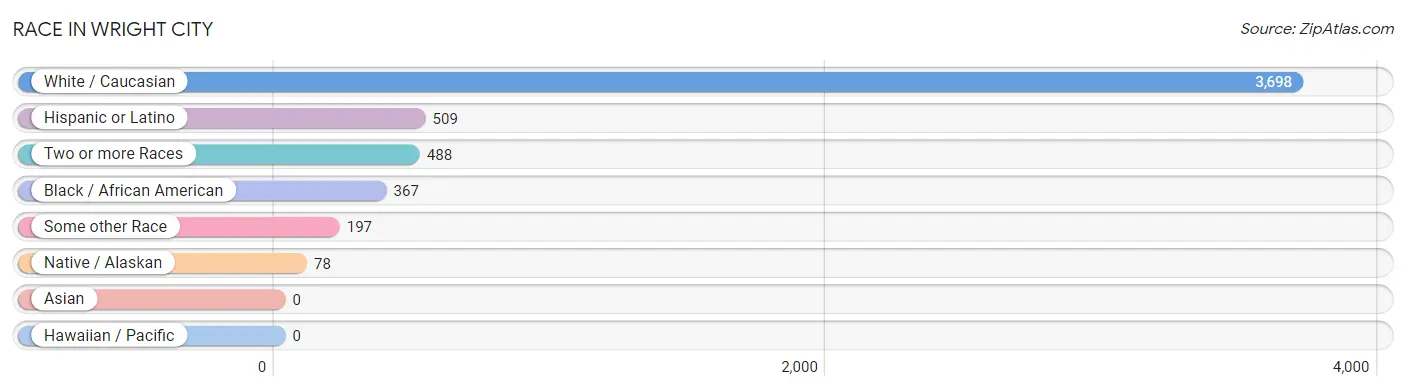
| Race | # Population | % Population |
| Asian | 0 | 0.0% |
| Black / African American | 367 | 7.6% |
| Hawaiian / Pacific | 0 | 0.0% |
| Hispanic or Latino | 509 | 10.5% |
| Native / Alaskan | 78 | 1.6% |
| White / Caucasian | 3,698 | 76.6% |
| Two or more Races | 488 | 10.1% |
| Some other Race | 197 | 4.1% |
| Total | 4,828 | 100.0% |
Ancestry in Wright City
The most populous ancestries reported in Wright City are German (960 | 19.9%), Irish (649 | 13.4%), English (473 | 9.8%), French (338 | 7.0%), and Italian (303 | 6.3%), together accounting for 56.4% of all Wright City residents.
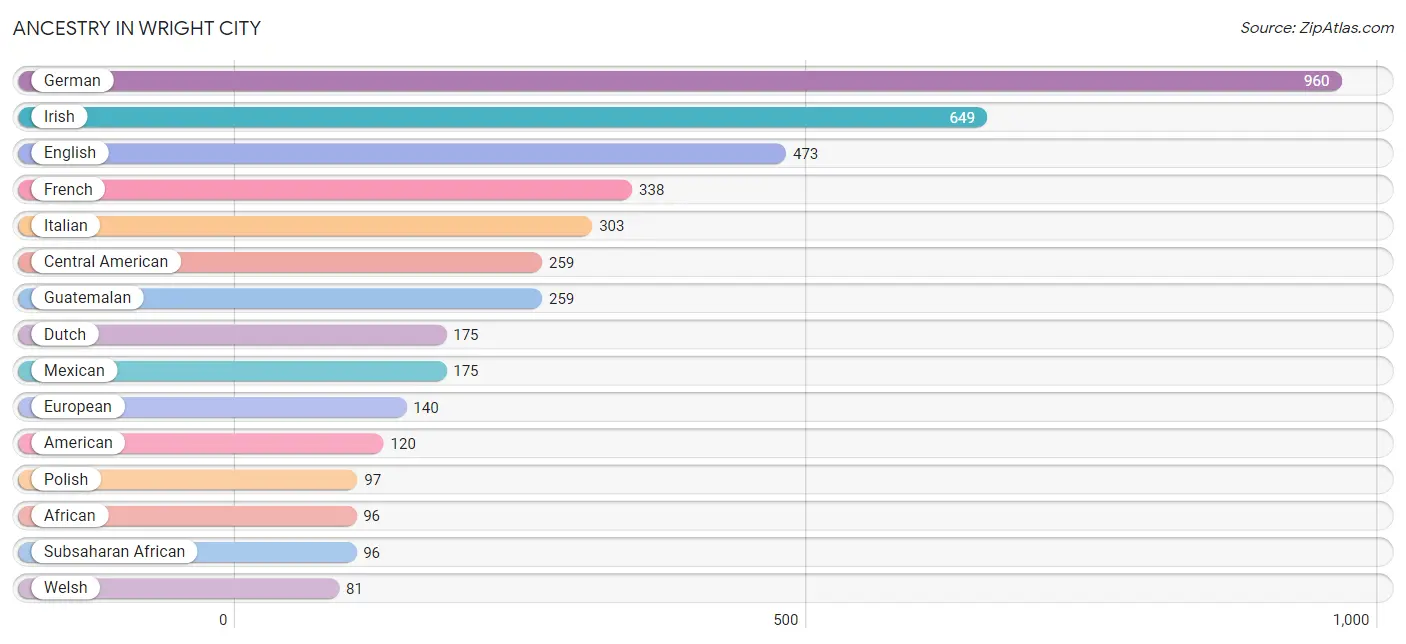
| Ancestry | # Population | % Population |
| African | 96 | 2.0% |
| American | 120 | 2.5% |
| Brazilian | 32 | 0.7% |
| Central American | 259 | 5.4% |
| Central American Indian | 53 | 1.1% |
| Cherokee | 19 | 0.4% |
| Choctaw | 11 | 0.2% |
| Czech | 18 | 0.4% |
| Dutch | 175 | 3.6% |
| Eastern European | 28 | 0.6% |
| English | 473 | 9.8% |
| European | 140 | 2.9% |
| French | 338 | 7.0% |
| German | 960 | 19.9% |
| Guatemalan | 259 | 5.4% |
| Hungarian | 47 | 1.0% |
| Irish | 649 | 13.4% |
| Italian | 303 | 6.3% |
| Mexican | 175 | 3.6% |
| Mexican American Indian | 69 | 1.4% |
| Polish | 97 | 2.0% |
| Puerto Rican | 75 | 1.5% |
| Scotch-Irish | 75 | 1.5% |
| Scottish | 44 | 0.9% |
| Subsaharan African | 96 | 2.0% |
| Swedish | 17 | 0.4% |
| Swiss | 46 | 0.9% |
| Welsh | 81 | 1.7% | View All 28 Rows |
Immigrants in Wright City
The most numerous immigrant groups reported in Wright City came from Latin America (209 | 4.3%), Central America (177 | 3.7%), Guatemala (152 | 3.2%), Brazil (32 | 0.7%), and South America (32 | 0.7%), together accounting for 12.5% of all Wright City residents.
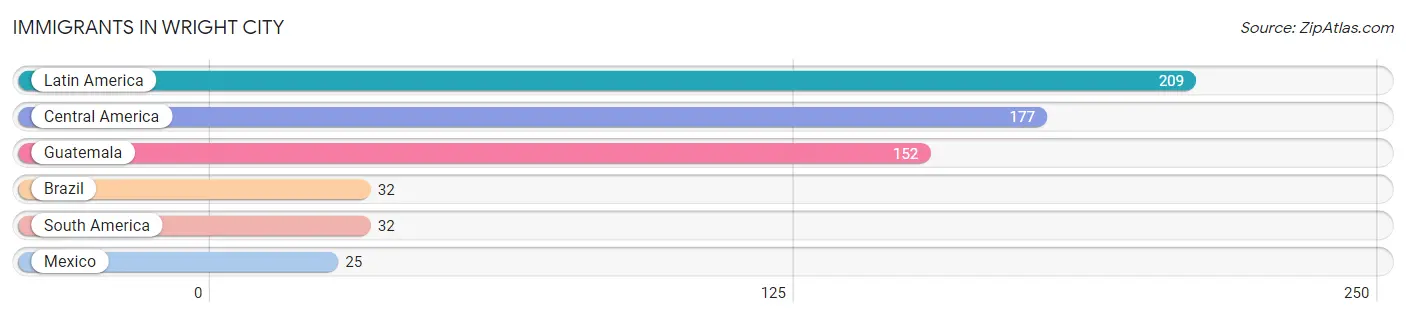
| Immigration Origin | # Population | % Population |
| Brazil | 32 | 0.7% |
| Central America | 177 | 3.7% |
| Guatemala | 152 | 3.2% |
| Latin America | 209 | 4.3% |
| Mexico | 25 | 0.5% |
| South America | 32 | 0.7% | View All 6 Rows |
Sex and Age in Wright City
Sex and Age in Wright City
The most populous age groups in Wright City are 60 to 64 Years (294 | 10.6%) for men and 40 to 44 Years (233 | 11.4%) for women.
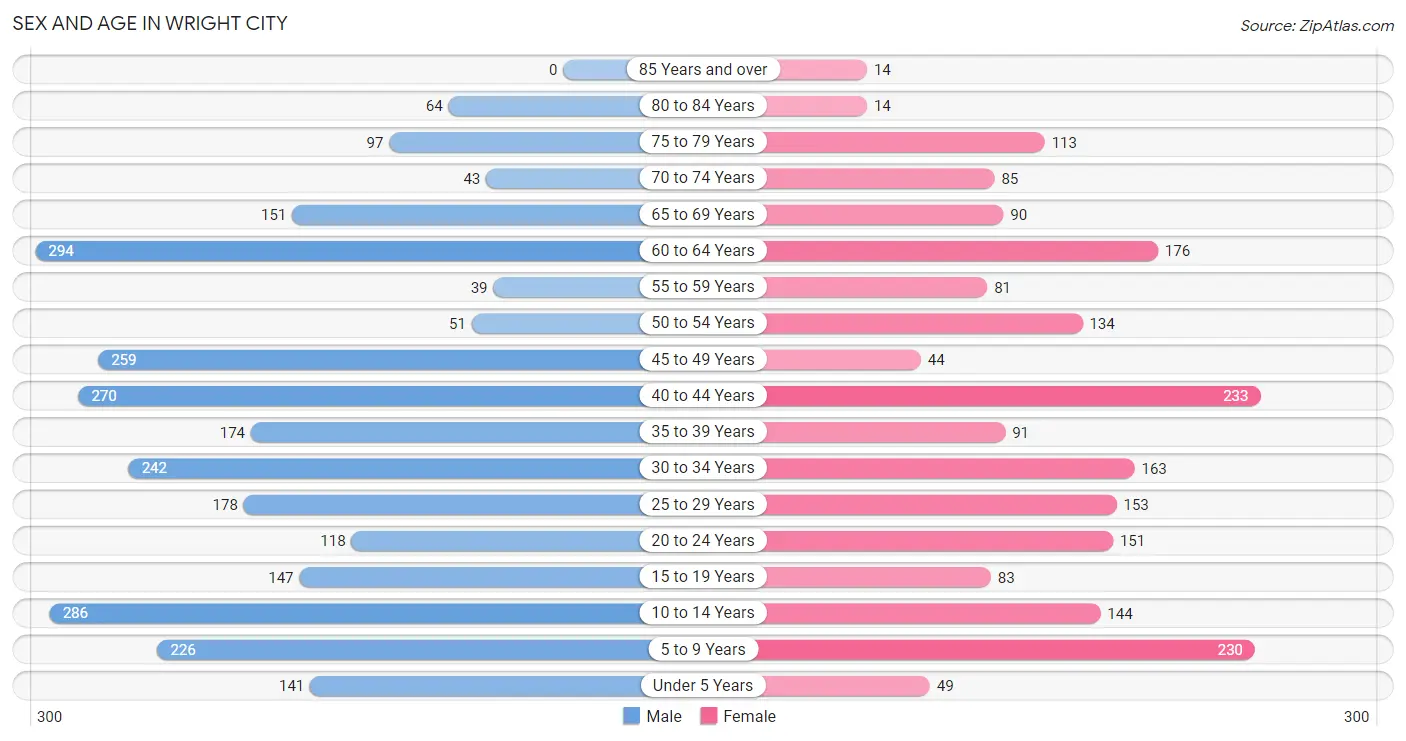
| Age Bracket | Male | Female |
| Under 5 Years | 141 (5.1%) | 49 (2.4%) |
| 5 to 9 Years | 226 (8.1%) | 230 (11.2%) |
| 10 to 14 Years | 286 (10.3%) | 144 (7.0%) |
| 15 to 19 Years | 147 (5.3%) | 83 (4.1%) |
| 20 to 24 Years | 118 (4.2%) | 151 (7.4%) |
| 25 to 29 Years | 178 (6.4%) | 153 (7.5%) |
| 30 to 34 Years | 242 (8.7%) | 163 (8.0%) |
| 35 to 39 Years | 174 (6.3%) | 91 (4.4%) |
| 40 to 44 Years | 270 (9.7%) | 233 (11.4%) |
| 45 to 49 Years | 259 (9.3%) | 44 (2.1%) |
| 50 to 54 Years | 51 (1.8%) | 134 (6.5%) |
| 55 to 59 Years | 39 (1.4%) | 81 (4.0%) |
| 60 to 64 Years | 294 (10.6%) | 176 (8.6%) |
| 65 to 69 Years | 151 (5.4%) | 90 (4.4%) |
| 70 to 74 Years | 43 (1.5%) | 85 (4.2%) |
| 75 to 79 Years | 97 (3.5%) | 113 (5.5%) |
| 80 to 84 Years | 64 (2.3%) | 14 (0.7%) |
| 85 Years and over | 0 (0.0%) | 14 (0.7%) |
| Total | 2,780 (100.0%) | 2,048 (100.0%) |
Families and Households in Wright City
Median Family Size in Wright City
The median family size in Wright City is 3.25 persons per family, with single female/mother families (169 | 13.7%) accounting for the largest median family size of 3.66 persons per family. On the other hand, single male/father families (184 | 14.9%) represent the smallest median family size with 2.63 persons per family.
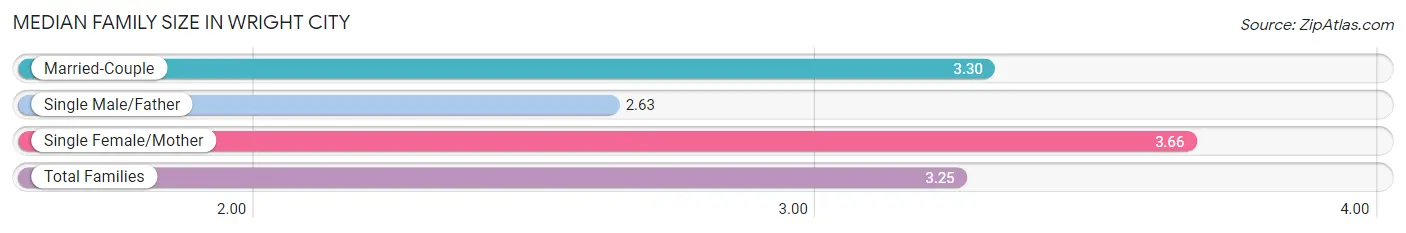
| Family Type | # Families | Family Size |
| Married-Couple | 882 (71.4%) | 3.30 |
| Single Male/Father | 184 (14.9%) | 2.63 |
| Single Female/Mother | 169 (13.7%) | 3.66 |
| Total Families | 1,235 (100.0%) | 3.25 |
Median Household Size in Wright City
The median household size in Wright City is 2.86 persons per household, with single female/mother households (169 | 10.0%) accounting for the largest median household size of 3.88 persons per household. non-family households (452 | 26.8%) represent the smallest median household size with 1.61 persons per household.
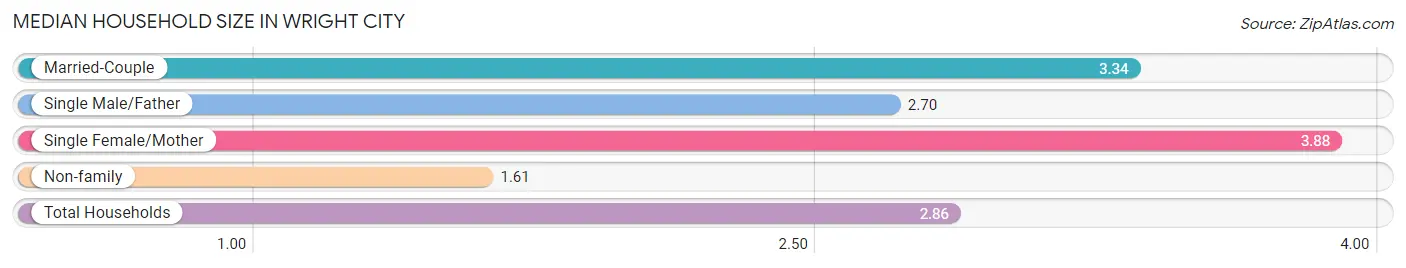
| Household Type | # Households | Household Size |
| Married-Couple | 882 (52.3%) | 3.34 |
| Single Male/Father | 184 (10.9%) | 2.70 |
| Single Female/Mother | 169 (10.0%) | 3.88 |
| Non-family | 452 (26.8%) | 1.61 |
| Total Households | 1,687 (100.0%) | 2.86 |
Household Size by Marriage Status in Wright City
Out of a total of 1,687 households in Wright City, 1,235 (73.2%) are family households, while 452 (26.8%) are nonfamily households. The most numerous type of family households are 2-person households, comprising 650, and the most common type of nonfamily households are 1-person households, comprising 311.
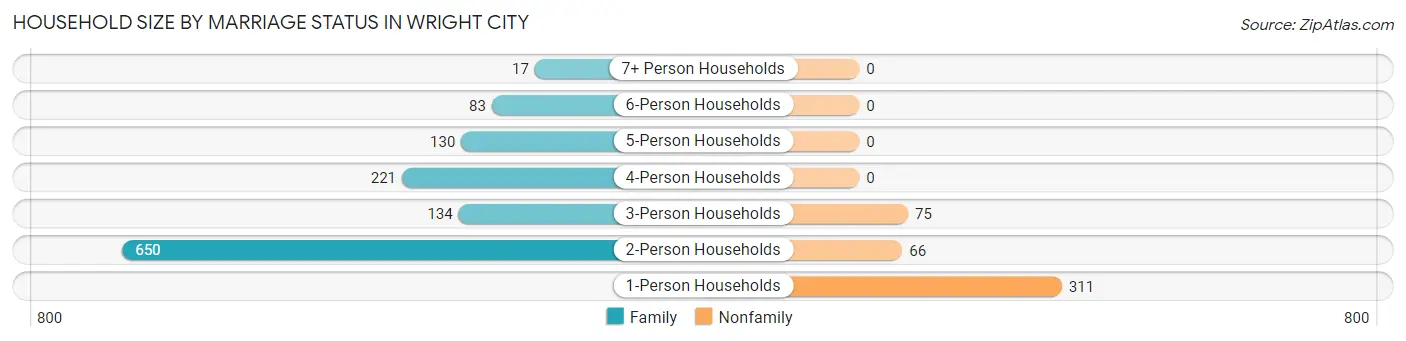
| Household Size | Family Households | Nonfamily Households |
| 1-Person Households | - | 311 (18.4%) |
| 2-Person Households | 650 (38.5%) | 66 (3.9%) |
| 3-Person Households | 134 (7.9%) | 75 (4.4%) |
| 4-Person Households | 221 (13.1%) | 0 (0.0%) |
| 5-Person Households | 130 (7.7%) | 0 (0.0%) |
| 6-Person Households | 83 (4.9%) | 0 (0.0%) |
| 7+ Person Households | 17 (1.0%) | 0 (0.0%) |
| Total | 1,235 (73.2%) | 452 (26.8%) |
Female Fertility in Wright City
Fertility by Age in Wright City
Average fertility rate in Wright City is 96.0 births per 1,000 women. Women in the age bracket of 35 to 50 years have the highest fertility rate with 117.0 births per 1,000 women. Women in the age bracket of 20 to 34 years acount for 51.1% of all women with births.
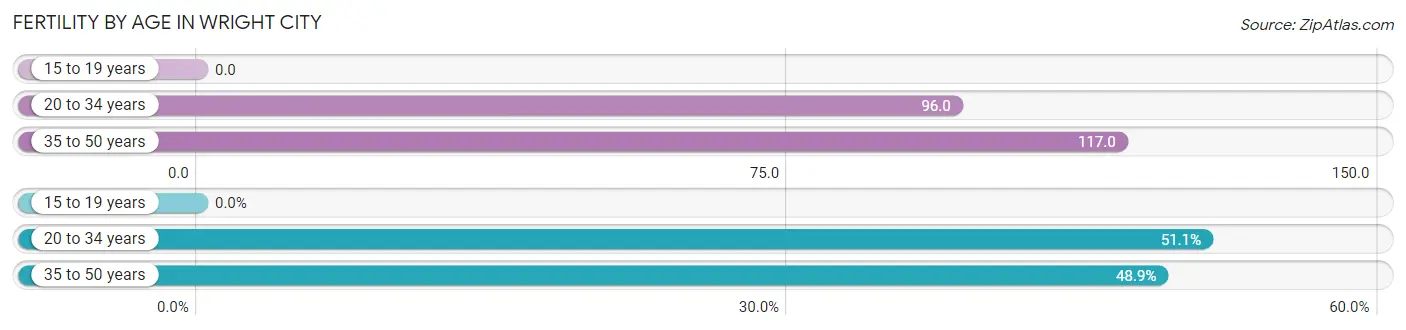
| Age Bracket | Women with Births | Births / 1,000 Women |
| 15 to 19 years | 0 (0.0%) | 0.0 |
| 20 to 34 years | 45 (51.1%) | 96.0 |
| 35 to 50 years | 43 (48.9%) | 117.0 |
| Total | 88 (100.0%) | 96.0 |
Fertility by Age by Marriage Status in Wright City
67.0% of women with births (88) in Wright City are married. The highest percentage of unmarried women with births falls into 20 to 34 years age bracket with 64.4% of them unmarried at the time of birth, while the lowest percentage of unmarried women with births belong to 35 to 50 years age bracket with 0.0% of them unmarried.
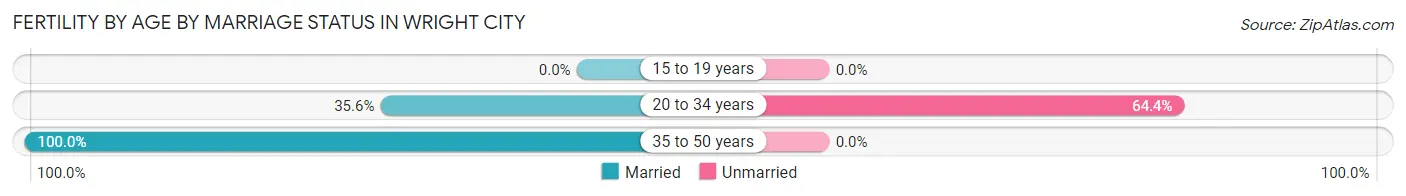
| Age Bracket | Married | Unmarried |
| 15 to 19 years | 0 (0.0%) | 0 (0.0%) |
| 20 to 34 years | 16 (35.6%) | 29 (64.4%) |
| 35 to 50 years | 43 (100.0%) | 0 (0.0%) |
| Total | 59 (67.0%) | 29 (33.0%) |
Fertility by Education in Wright City
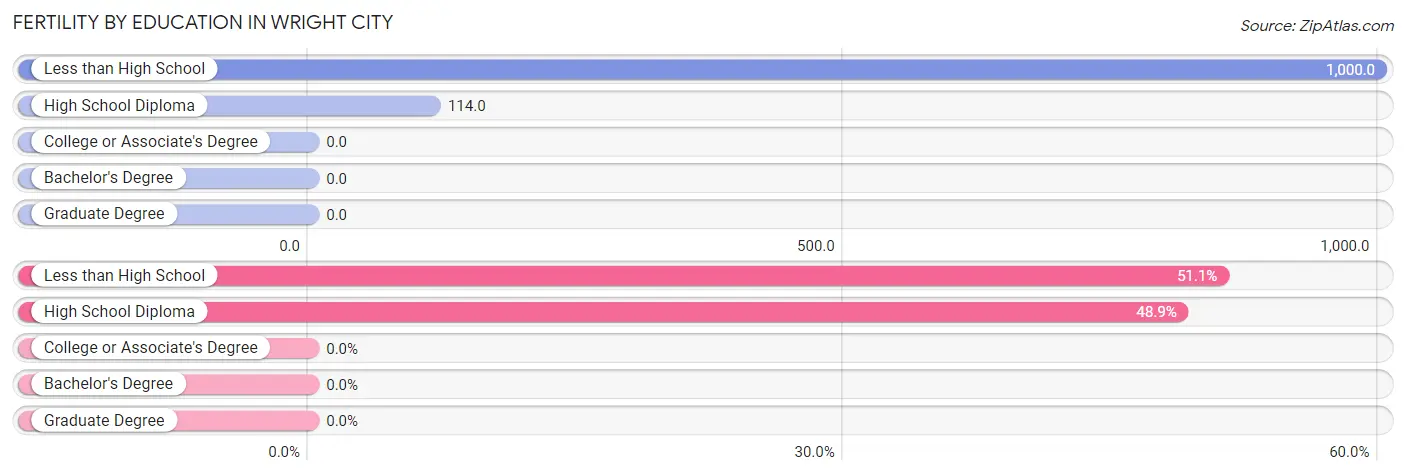
| Educational Attainment | Women with Births | Births / 1,000 Women |
| Less than High School | 45 (51.1%) | 1,000.0 |
| High School Diploma | 43 (48.9%) | 114.0 |
| College or Associate's Degree | 0 (0.0%) | 0.0 |
| Bachelor's Degree | 0 (0.0%) | 0.0 |
| Graduate Degree | 0 (0.0%) | 0.0 |
| Total | 88 (100.0%) | 96.0 |
Fertility by Education by Marriage Status in Wright City
33.0% of women with births in Wright City are unmarried. Women with the educational attainment of high school diploma are most likely to be married with 100.0% of them married at childbirth, while women with the educational attainment of less than high school are least likely to be married with 64.4% of them unmarried at childbirth.
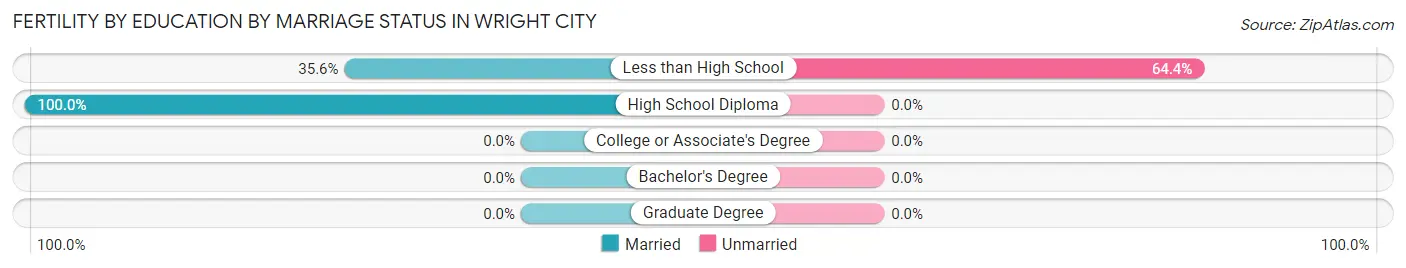
| Educational Attainment | Married | Unmarried |
| Less than High School | 16 (35.6%) | 29 (64.4%) |
| High School Diploma | 43 (100.0%) | 0 (0.0%) |
| College or Associate's Degree | 0 (0.0%) | 0 (0.0%) |
| Bachelor's Degree | 0 (0.0%) | 0 (0.0%) |
| Graduate Degree | 0 (0.0%) | 0 (0.0%) |
| Total | 59 (67.0%) | 29 (33.0%) |
Employment Characteristics in Wright City
Employment by Class of Employer in Wright City
Among the 2,295 employed individuals in Wright City, private company employees (1,698 | 74.0%), not-for-profit organizations (262 | 11.4%), and local government employees (109 | 4.8%) make up the most common classes of employment.
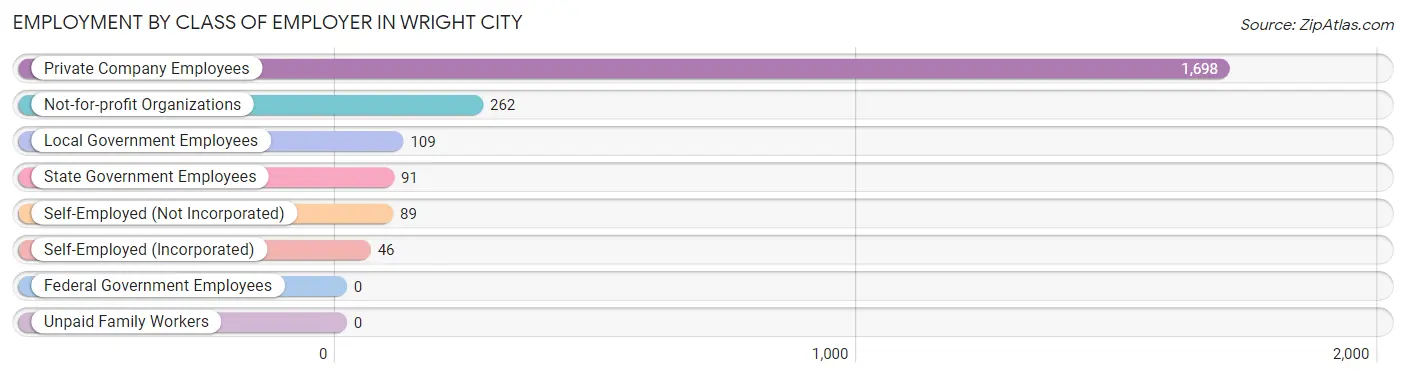
| Employer Class | # Employees | % Employees |
| Private Company Employees | 1,698 | 74.0% |
| Self-Employed (Incorporated) | 46 | 2.0% |
| Self-Employed (Not Incorporated) | 89 | 3.9% |
| Not-for-profit Organizations | 262 | 11.4% |
| Local Government Employees | 109 | 4.8% |
| State Government Employees | 91 | 4.0% |
| Federal Government Employees | 0 | 0.0% |
| Unpaid Family Workers | 0 | 0.0% |
| Total | 2,295 | 100.0% |
Employment Status by Age in Wright City
According to the labor force statistics for Wright City, out of the total population over 16 years of age (3,729), 65.9% or 2,457 individuals are in the labor force, with 6.6% or 162 of them unemployed. The age group with the highest labor force participation rate is 30 to 34 years, with 91.9% or 372 individuals in the labor force. Within the labor force, the 65 to 74 years age range has the highest percentage of unemployed individuals, with 40.5% or 47 of them being unemployed.
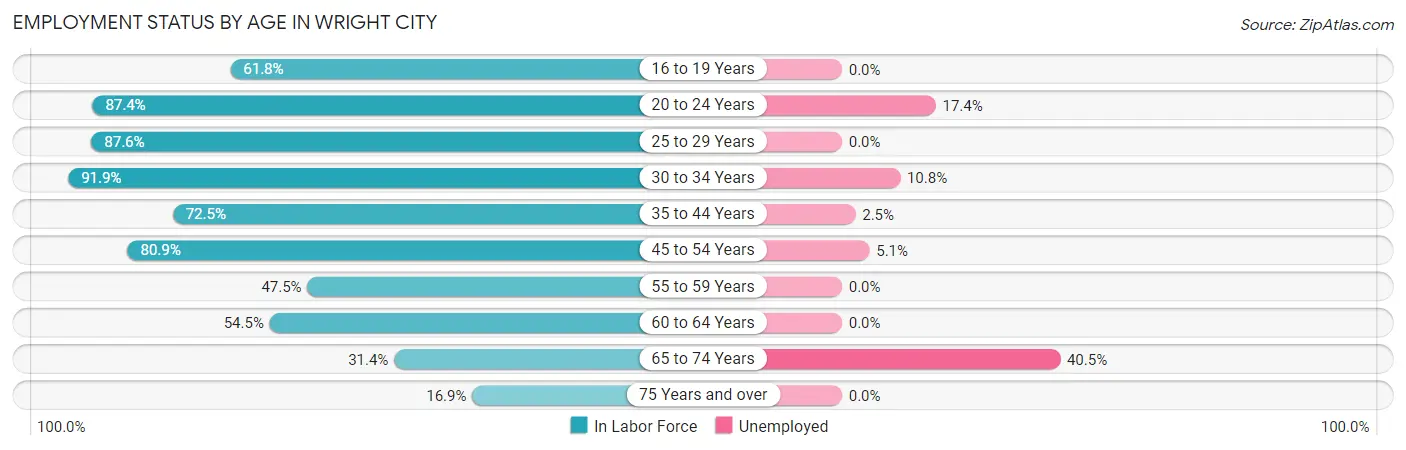
| Age Bracket | In Labor Force | Unemployed |
| 16 to 19 Years | 128 (61.8%) | 0 (0.0%) |
| 20 to 24 Years | 235 (87.4%) | 41 (17.4%) |
| 25 to 29 Years | 290 (87.6%) | 0 (0.0%) |
| 30 to 34 Years | 372 (91.9%) | 40 (10.8%) |
| 35 to 44 Years | 557 (72.5%) | 14 (2.5%) |
| 45 to 54 Years | 395 (80.9%) | 20 (5.1%) |
| 55 to 59 Years | 57 (47.5%) | 0 (0.0%) |
| 60 to 64 Years | 256 (54.5%) | 0 (0.0%) |
| 65 to 74 Years | 116 (31.4%) | 47 (40.5%) |
| 75 Years and over | 51 (16.9%) | 0 (0.0%) |
| Total | 2,457 (65.9%) | 162 (6.6%) |
Employment Status by Educational Attainment in Wright City
According to labor force statistics for Wright City, 74.6% of individuals (1,926) out of the total population between 25 and 64 years of age (2,582) are in the labor force, with 3.8% or 73 of them being unemployed. The group with the highest labor force participation rate are those with the educational attainment of bachelor's degree or higher, with 79.8% or 403 individuals in the labor force. Within the labor force, individuals with less than high school education have the highest percentage of unemployment, with 16.6% or 60 of them being unemployed.
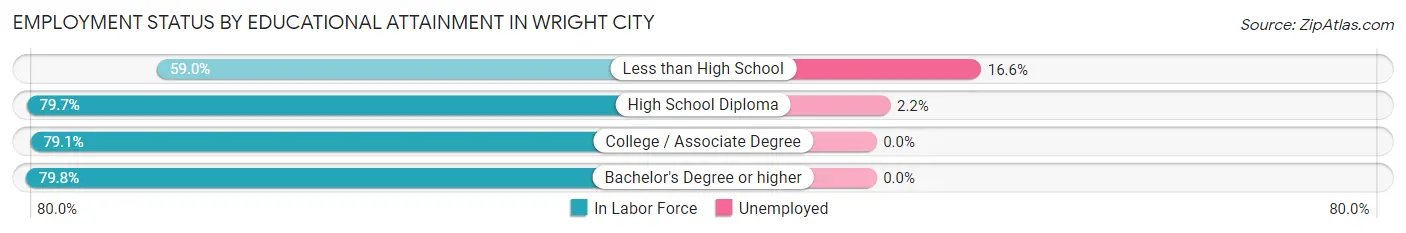
| Educational Attainment | In Labor Force | Unemployed |
| Less than High School | 362 (59.0%) | 102 (16.6%) |
| High School Diploma | 633 (79.7%) | 17 (2.2%) |
| College / Associate Degree | 529 (79.1%) | 0 (0.0%) |
| Bachelor's Degree or higher | 403 (79.8%) | 0 (0.0%) |
| Total | 1,926 (74.6%) | 98 (3.8%) |
Employment Occupations by Sex in Wright City
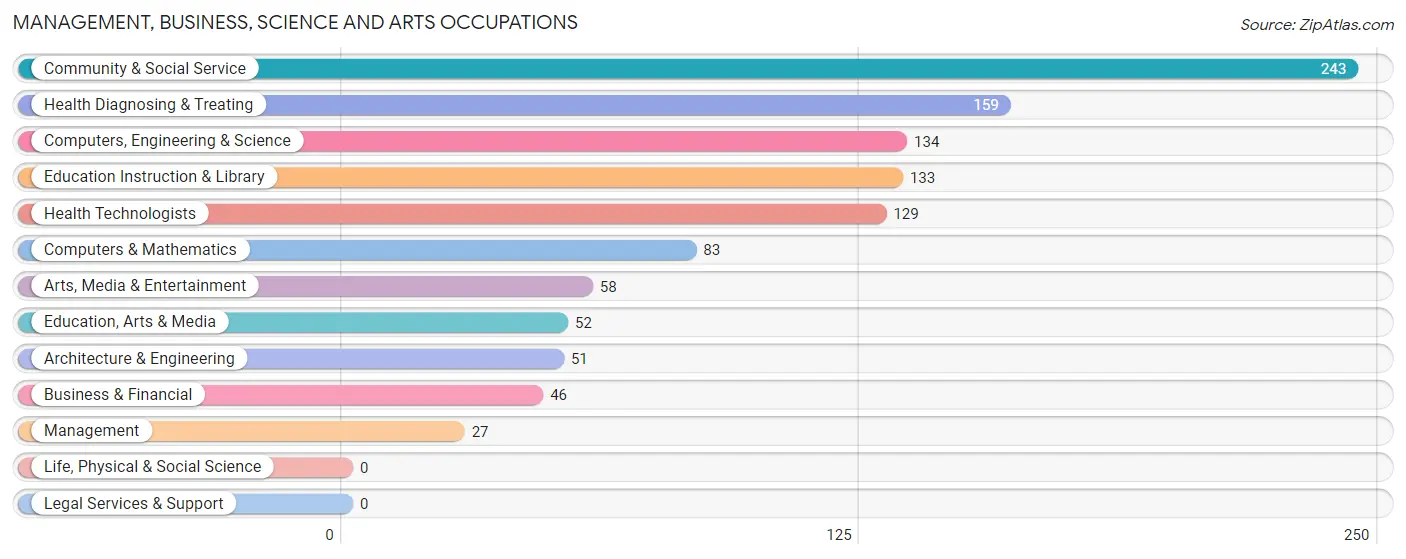
Management, Business, Science and Arts Occupations
The most common Management, Business, Science and Arts occupations in Wright City are Community & Social Service (243 | 10.6%), Health Diagnosing & Treating (159 | 6.9%), Computers, Engineering & Science (134 | 5.8%), Education Instruction & Library (133 | 5.8%), and Health Technologists (129 | 5.6%).
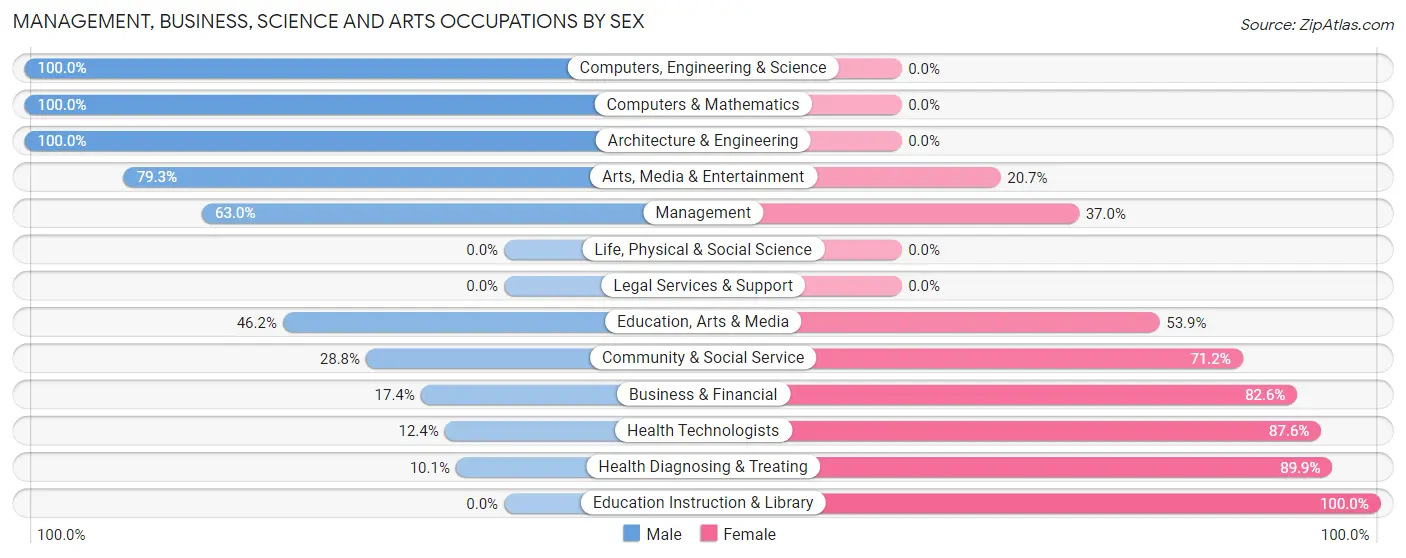
Management, Business, Science and Arts Occupations by Sex
Within the Management, Business, Science and Arts occupations in Wright City, the most male-oriented occupations are Computers, Engineering & Science (100.0%), Computers & Mathematics (100.0%), and Architecture & Engineering (100.0%), while the most female-oriented occupations are Education Instruction & Library (100.0%), Health Diagnosing & Treating (89.9%), and Health Technologists (87.6%).
| Occupation | Male | Female |
| Management | 17 (63.0%) | 10 (37.0%) |
| Business & Financial | 8 (17.4%) | 38 (82.6%) |
| Computers, Engineering & Science | 134 (100.0%) | 0 (0.0%) |
| Computers & Mathematics | 83 (100.0%) | 0 (0.0%) |
| Architecture & Engineering | 51 (100.0%) | 0 (0.0%) |
| Life, Physical & Social Science | 0 (0.0%) | 0 (0.0%) |
| Community & Social Service | 70 (28.8%) | 173 (71.2%) |
| Education, Arts & Media | 24 (46.2%) | 28 (53.8%) |
| Legal Services & Support | 0 (0.0%) | 0 (0.0%) |
| Education Instruction & Library | 0 (0.0%) | 133 (100.0%) |
| Arts, Media & Entertainment | 46 (79.3%) | 12 (20.7%) |
| Health Diagnosing & Treating | 16 (10.1%) | 143 (89.9%) |
| Health Technologists | 16 (12.4%) | 113 (87.6%) |
| Total (Category) | 245 (40.2%) | 364 (59.8%) |
| Total (Overall) | 1,310 (57.1%) | 985 (42.9%) |
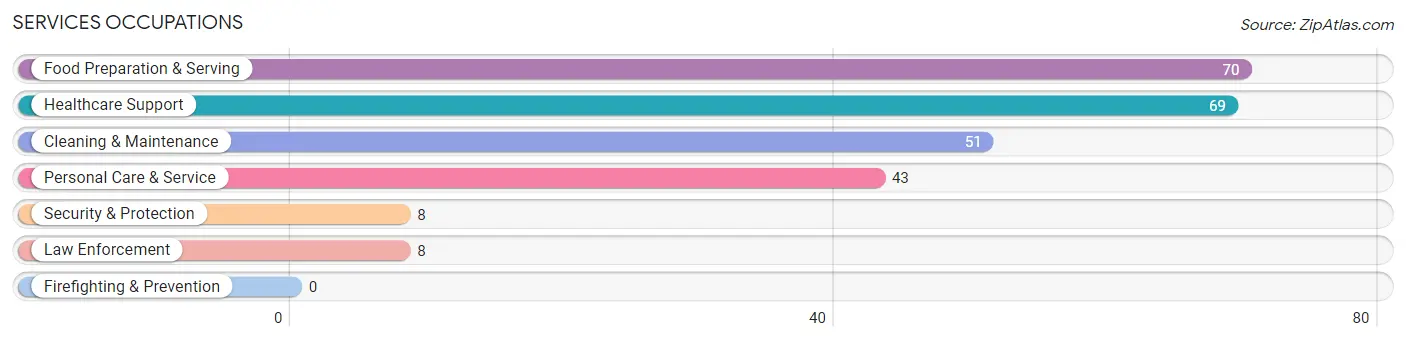
Services Occupations
The most common Services occupations in Wright City are Food Preparation & Serving (70 | 3.0%), Healthcare Support (69 | 3.0%), Cleaning & Maintenance (51 | 2.2%), Personal Care & Service (43 | 1.9%), and Security & Protection (8 | 0.4%).
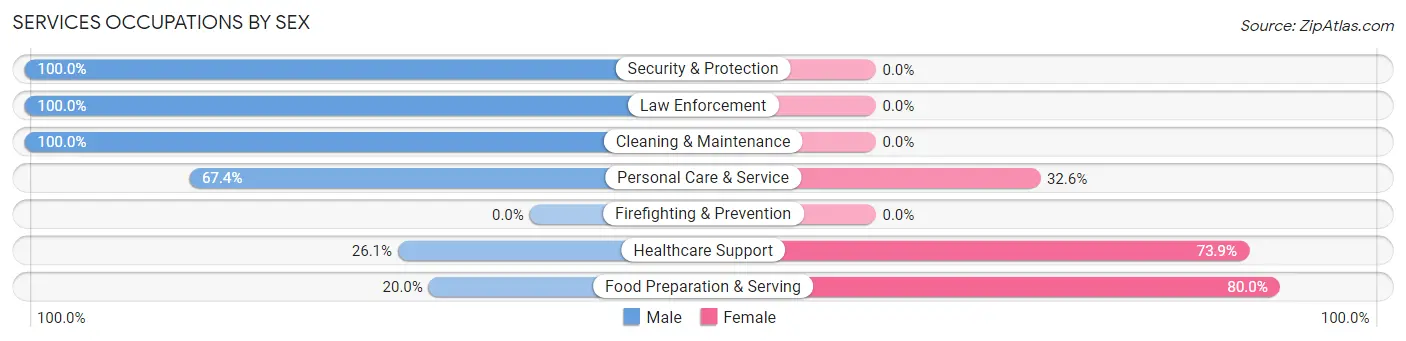
Services Occupations by Sex
Within the Services occupations in Wright City, the most male-oriented occupations are Security & Protection (100.0%), Law Enforcement (100.0%), and Cleaning & Maintenance (100.0%), while the most female-oriented occupations are Food Preparation & Serving (80.0%), Healthcare Support (73.9%), and Personal Care & Service (32.6%).
| Occupation | Male | Female |
| Healthcare Support | 18 (26.1%) | 51 (73.9%) |
| Security & Protection | 8 (100.0%) | 0 (0.0%) |
| Firefighting & Prevention | 0 (0.0%) | 0 (0.0%) |
| Law Enforcement | 8 (100.0%) | 0 (0.0%) |
| Food Preparation & Serving | 14 (20.0%) | 56 (80.0%) |
| Cleaning & Maintenance | 51 (100.0%) | 0 (0.0%) |
| Personal Care & Service | 29 (67.4%) | 14 (32.6%) |
| Total (Category) | 120 (49.8%) | 121 (50.2%) |
| Total (Overall) | 1,310 (57.1%) | 985 (42.9%) |
Sales and Office Occupations
The most common Sales and Office occupations in Wright City are Office & Administration (240 | 10.5%), and Sales & Related (221 | 9.6%).
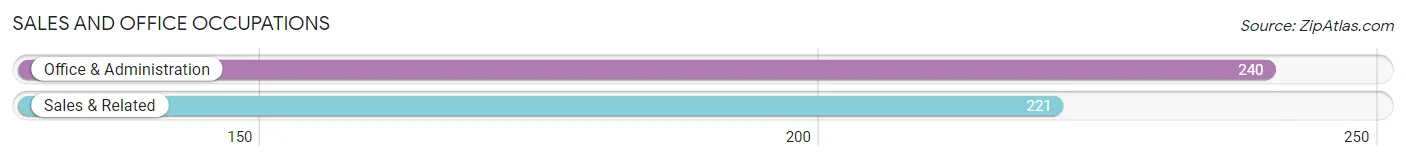
Sales and Office Occupations by Sex
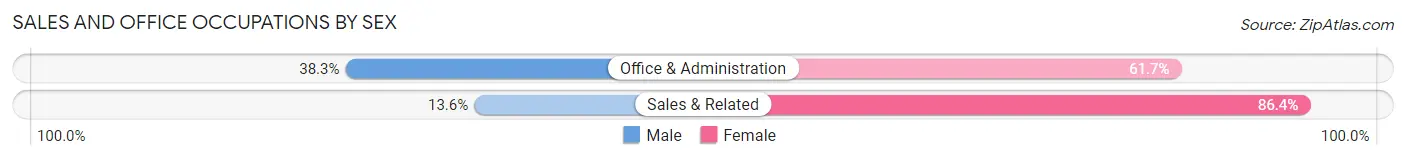
| Occupation | Male | Female |
| Sales & Related | 30 (13.6%) | 191 (86.4%) |
| Office & Administration | 92 (38.3%) | 148 (61.7%) |
| Total (Category) | 122 (26.5%) | 339 (73.5%) |
| Total (Overall) | 1,310 (57.1%) | 985 (42.9%) |
Natural Resources, Construction and Maintenance Occupations
The most common Natural Resources, Construction and Maintenance occupations in Wright City are Installation, Maintenance & Repair (214 | 9.3%), and Construction & Extraction (200 | 8.7%).
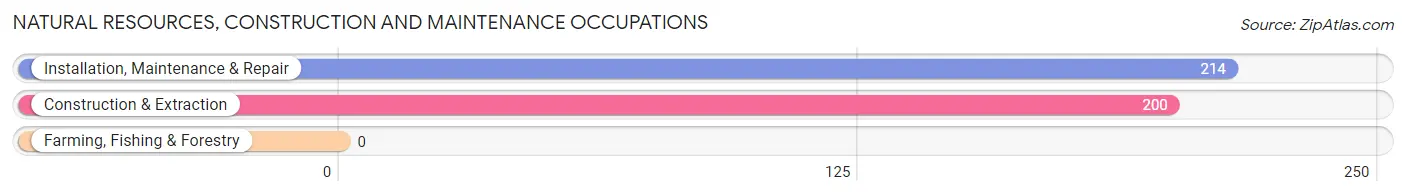
Natural Resources, Construction and Maintenance Occupations by Sex
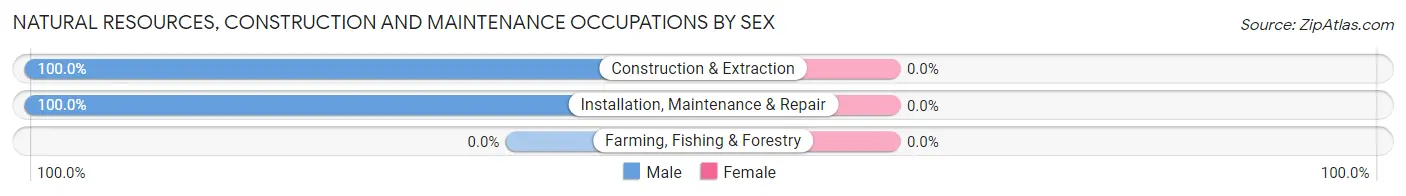
| Occupation | Male | Female |
| Farming, Fishing & Forestry | 0 (0.0%) | 0 (0.0%) |
| Construction & Extraction | 200 (100.0%) | 0 (0.0%) |
| Installation, Maintenance & Repair | 214 (100.0%) | 0 (0.0%) |
| Total (Category) | 414 (100.0%) | 0 (0.0%) |
| Total (Overall) | 1,310 (57.1%) | 985 (42.9%) |
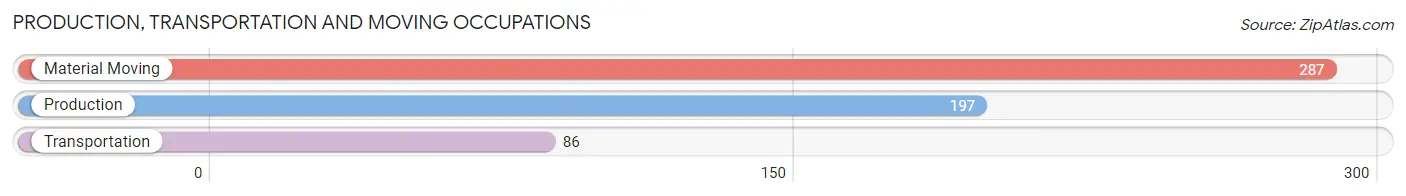
Production, Transportation and Moving Occupations
The most common Production, Transportation and Moving occupations in Wright City are Material Moving (287 | 12.5%), Production (197 | 8.6%), and Transportation (86 | 3.7%).
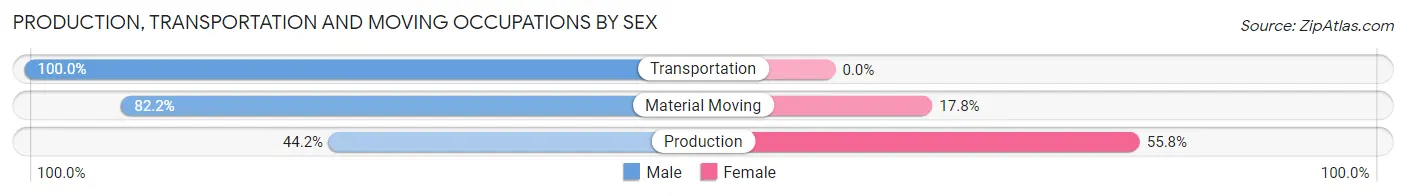
Production, Transportation and Moving Occupations by Sex
| Occupation | Male | Female |
| Production | 87 (44.2%) | 110 (55.8%) |
| Transportation | 86 (100.0%) | 0 (0.0%) |
| Material Moving | 236 (82.2%) | 51 (17.8%) |
| Total (Category) | 409 (71.8%) | 161 (28.2%) |
| Total (Overall) | 1,310 (57.1%) | 985 (42.9%) |
Employment Industries by Sex in Wright City
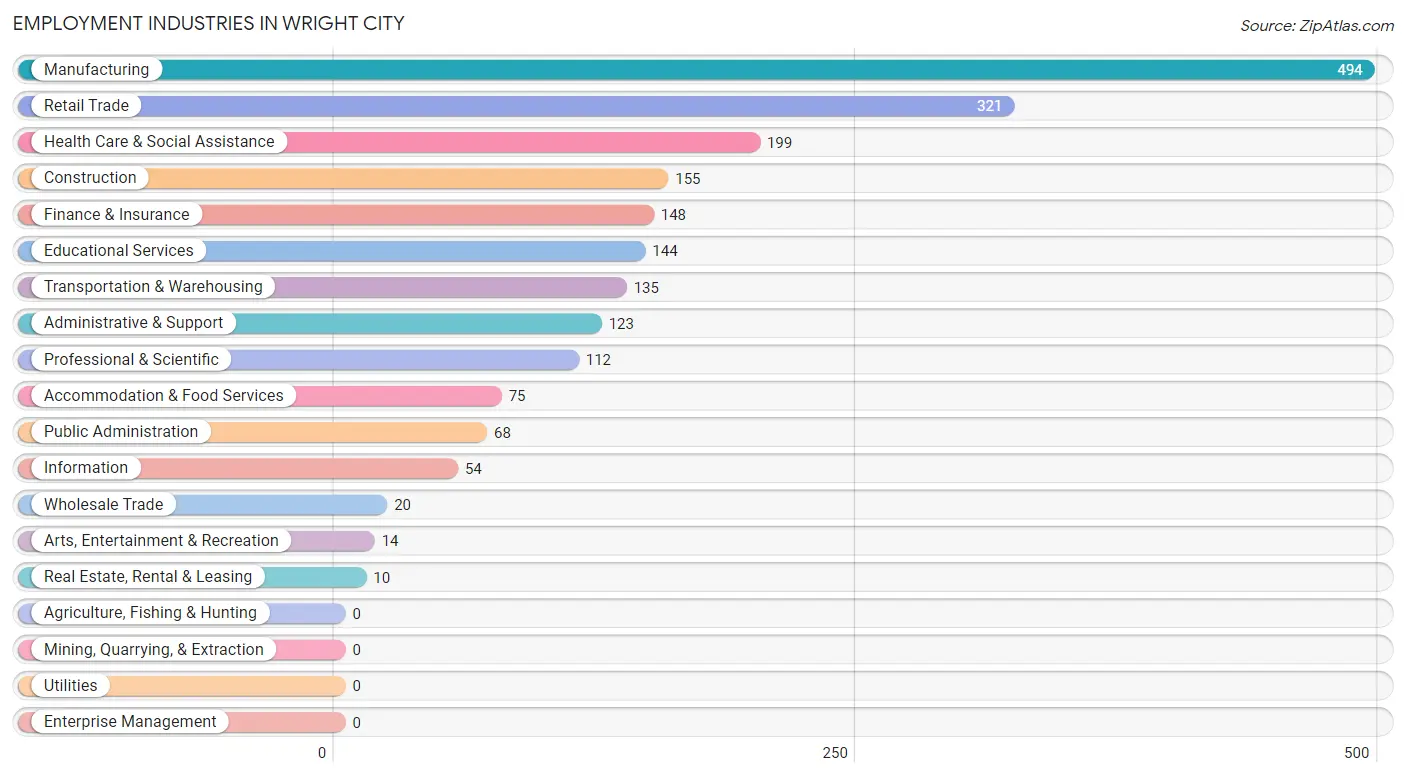
Employment Industries in Wright City
The major employment industries in Wright City include Manufacturing (494 | 21.5%), Retail Trade (321 | 14.0%), Health Care & Social Assistance (199 | 8.7%), Construction (155 | 6.8%), and Finance & Insurance (148 | 6.5%).
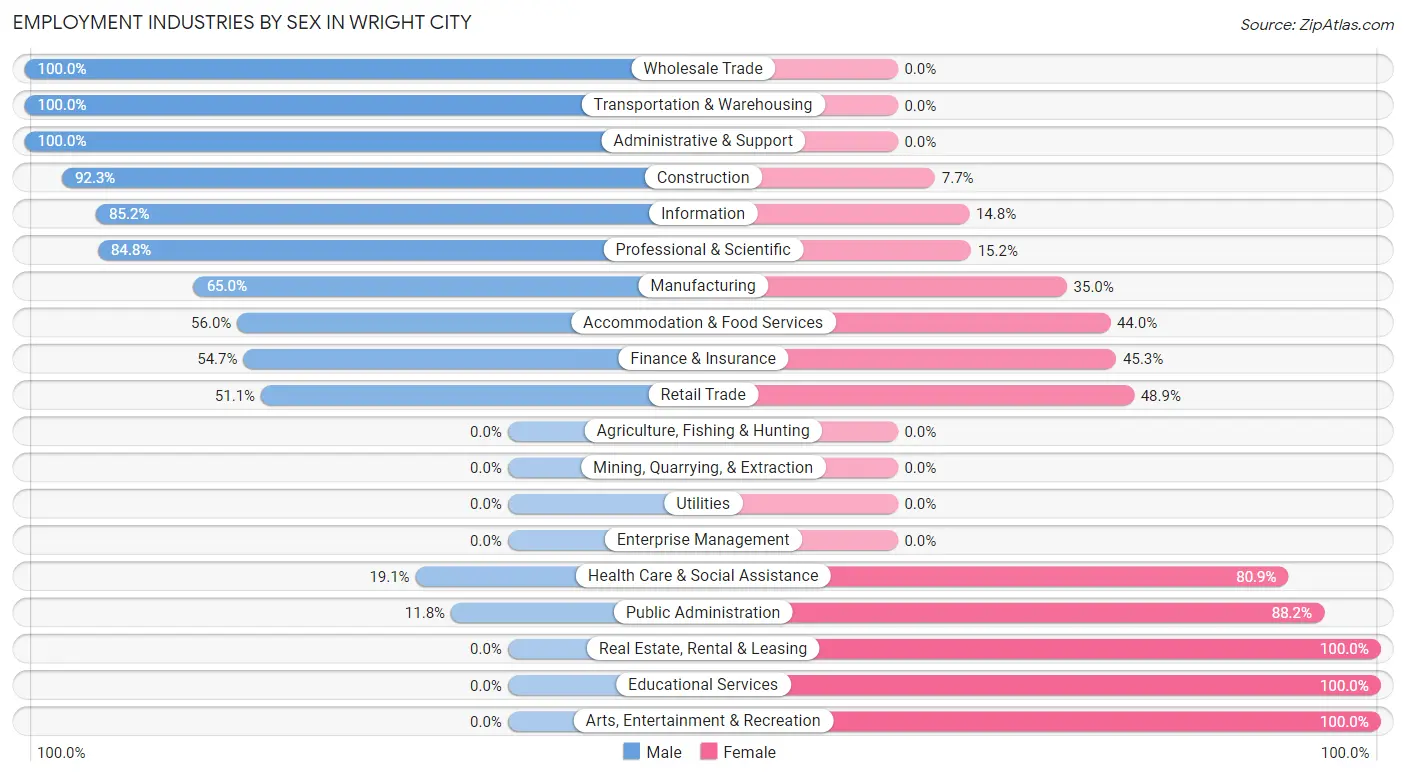
Employment Industries by Sex in Wright City
The Wright City industries that see more men than women are Wholesale Trade (100.0%), Transportation & Warehousing (100.0%), and Administrative & Support (100.0%), whereas the industries that tend to have a higher number of women are Real Estate, Rental & Leasing (100.0%), Educational Services (100.0%), and Arts, Entertainment & Recreation (100.0%).
| Industry | Male | Female |
| Agriculture, Fishing & Hunting | 0 (0.0%) | 0 (0.0%) |
| Mining, Quarrying, & Extraction | 0 (0.0%) | 0 (0.0%) |
| Construction | 143 (92.3%) | 12 (7.7%) |
| Manufacturing | 321 (65.0%) | 173 (35.0%) |
| Wholesale Trade | 20 (100.0%) | 0 (0.0%) |
| Retail Trade | 164 (51.1%) | 157 (48.9%) |
| Transportation & Warehousing | 135 (100.0%) | 0 (0.0%) |
| Utilities | 0 (0.0%) | 0 (0.0%) |
| Information | 46 (85.2%) | 8 (14.8%) |
| Finance & Insurance | 81 (54.7%) | 67 (45.3%) |
| Real Estate, Rental & Leasing | 0 (0.0%) | 10 (100.0%) |
| Professional & Scientific | 95 (84.8%) | 17 (15.2%) |
| Enterprise Management | 0 (0.0%) | 0 (0.0%) |
| Administrative & Support | 123 (100.0%) | 0 (0.0%) |
| Educational Services | 0 (0.0%) | 144 (100.0%) |
| Health Care & Social Assistance | 38 (19.1%) | 161 (80.9%) |
| Arts, Entertainment & Recreation | 0 (0.0%) | 14 (100.0%) |
| Accommodation & Food Services | 42 (56.0%) | 33 (44.0%) |
| Public Administration | 8 (11.8%) | 60 (88.2%) |
| Total | 1,310 (57.1%) | 985 (42.9%) |
Education in Wright City
School Enrollment in Wright City
The most common levels of schooling among the 1,068 students in Wright City are middle school (390 | 36.5%), elementary school (289 | 27.1%), and high school (128 | 12.0%).
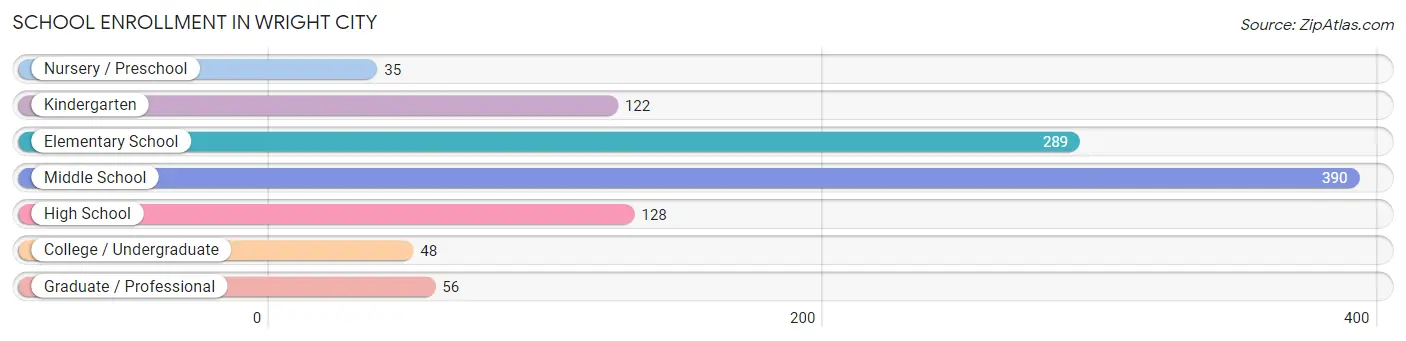
| School Level | # Students | % Students |
| Nursery / Preschool | 35 | 3.3% |
| Kindergarten | 122 | 11.4% |
| Elementary School | 289 | 27.1% |
| Middle School | 390 | 36.5% |
| High School | 128 | 12.0% |
| College / Undergraduate | 48 | 4.5% |
| Graduate / Professional | 56 | 5.2% |
| Total | 1,068 | 100.0% |
School Enrollment by Age by Funding Source in Wright City
Out of a total of 1,068 students who are enrolled in schools in Wright City, 139 (13.0%) attend a private institution, while the remaining 929 (87.0%) are enrolled in public schools. The age group of 10 to 14 year olds has the highest likelihood of being enrolled in private schools, with 78 (18.1% in the age bracket) enrolled. Conversely, the age group of 3 to 4 year olds has the lowest likelihood of being enrolled in a private school, with 35 (100.0% in the age bracket) attending a public institution.
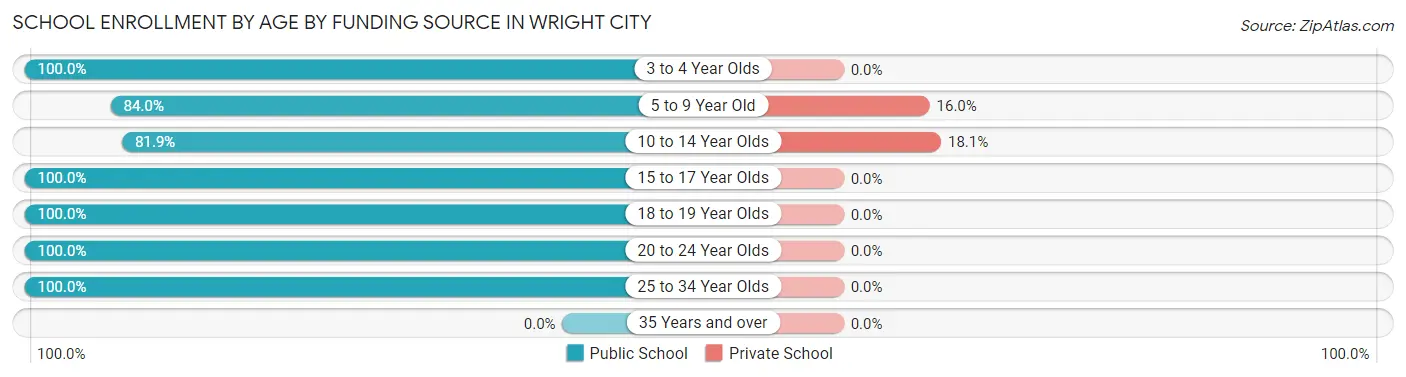
| Age Bracket | Public School | Private School |
| 3 to 4 Year Olds | 35 (100.0%) | 0 (0.0%) |
| 5 to 9 Year Old | 320 (84.0%) | 61 (16.0%) |
| 10 to 14 Year Olds | 352 (81.9%) | 78 (18.1%) |
| 15 to 17 Year Olds | 102 (100.0%) | 0 (0.0%) |
| 18 to 19 Year Olds | 16 (100.0%) | 0 (0.0%) |
| 20 to 24 Year Olds | 73 (100.0%) | 0 (0.0%) |
| 25 to 34 Year Olds | 31 (100.0%) | 0 (0.0%) |
| 35 Years and over | 0 (0.0%) | 0 (0.0%) |
| Total | 929 (87.0%) | 139 (13.0%) |
Educational Attainment by Field of Study in Wright City
Education (141 | 23.7%), science & technology (90 | 15.1%), engineering (82 | 13.8%), visual & performing arts (70 | 11.8%), and business (58 | 9.8%) are the most common fields of study among 594 individuals in Wright City who have obtained a bachelor's degree or higher.
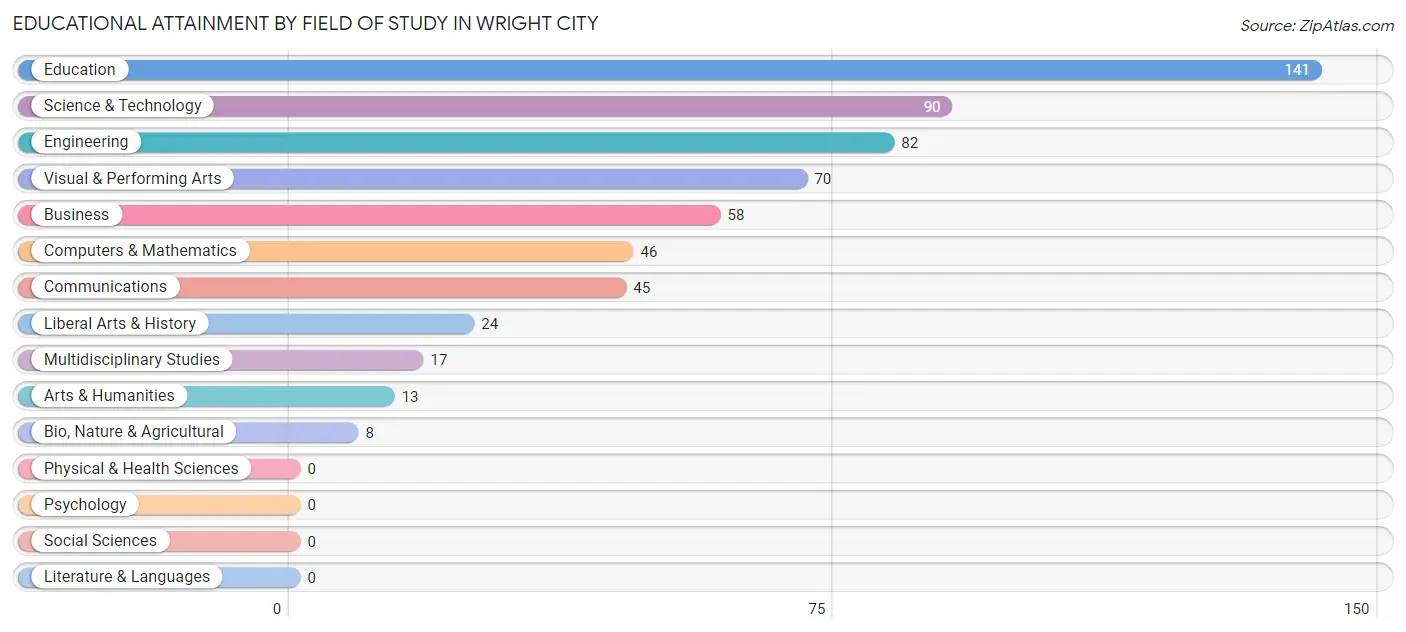
| Field of Study | # Graduates | % Graduates |
| Computers & Mathematics | 46 | 7.7% |
| Bio, Nature & Agricultural | 8 | 1.3% |
| Physical & Health Sciences | 0 | 0.0% |
| Psychology | 0 | 0.0% |
| Social Sciences | 0 | 0.0% |
| Engineering | 82 | 13.8% |
| Multidisciplinary Studies | 17 | 2.9% |
| Science & Technology | 90 | 15.1% |
| Business | 58 | 9.8% |
| Education | 141 | 23.7% |
| Literature & Languages | 0 | 0.0% |
| Liberal Arts & History | 24 | 4.0% |
| Visual & Performing Arts | 70 | 11.8% |
| Communications | 45 | 7.6% |
| Arts & Humanities | 13 | 2.2% |
| Total | 594 | 100.0% |
Transportation & Commute in Wright City
Vehicle Availability by Sex in Wright City
The most prevalent vehicle ownership categories in Wright City are males with 2 vehicles (620, accounting for 47.3%) and females with 2 vehicles (508, making up 62.9%).
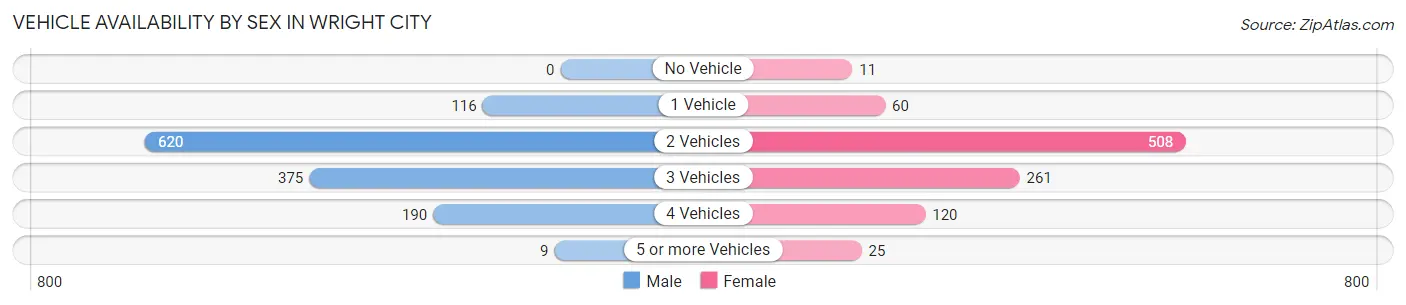
| Vehicles Available | Male | Female |
| No Vehicle | 0 (0.0%) | 11 (1.1%) |
| 1 Vehicle | 116 (8.8%) | 60 (6.1%) |
| 2 Vehicles | 620 (47.3%) | 508 (51.6%) |
| 3 Vehicles | 375 (28.6%) | 261 (26.5%) |
| 4 Vehicles | 190 (14.5%) | 120 (12.2%) |
| 5 or more Vehicles | 9 (0.7%) | 25 (2.5%) |
| Total | 1,310 (100.0%) | 985 (100.0%) |
Commute Time in Wright City
The most frequently occuring commute durations in Wright City are 20 to 24 minutes (412 commuters, 19.1%), 15 to 19 minutes (343 commuters, 15.9%), and 45 to 59 minutes (309 commuters, 14.3%).
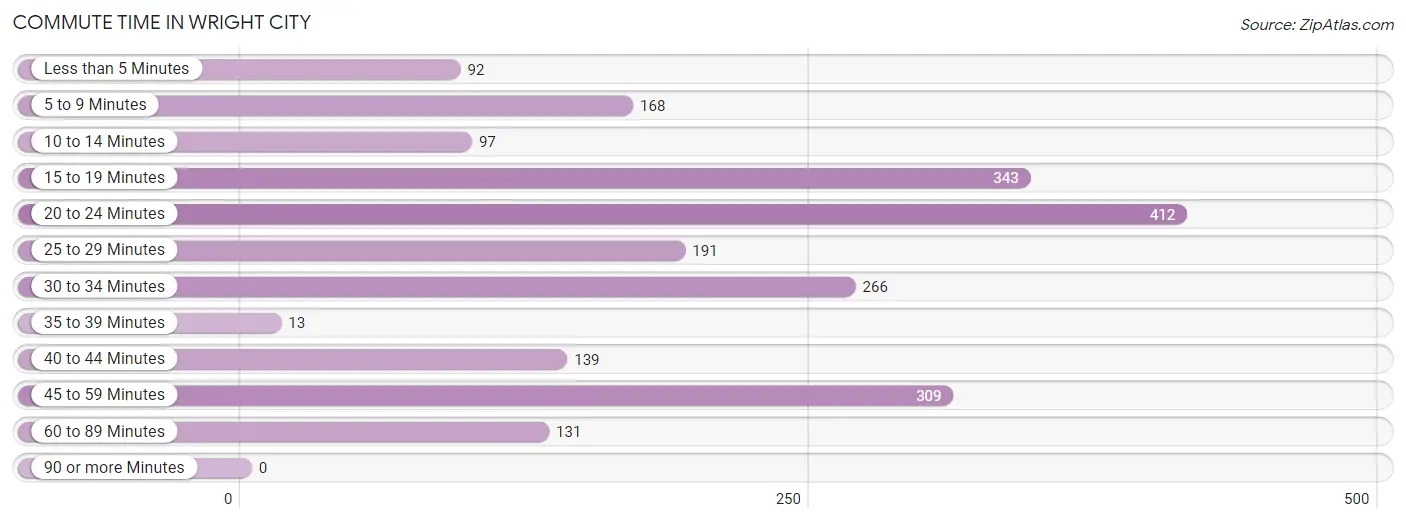
| Commute Time | # Commuters | % Commuters |
| Less than 5 Minutes | 92 | 4.3% |
| 5 to 9 Minutes | 168 | 7.8% |
| 10 to 14 Minutes | 97 | 4.5% |
| 15 to 19 Minutes | 343 | 15.9% |
| 20 to 24 Minutes | 412 | 19.1% |
| 25 to 29 Minutes | 191 | 8.8% |
| 30 to 34 Minutes | 266 | 12.3% |
| 35 to 39 Minutes | 13 | 0.6% |
| 40 to 44 Minutes | 139 | 6.4% |
| 45 to 59 Minutes | 309 | 14.3% |
| 60 to 89 Minutes | 131 | 6.1% |
| 90 or more Minutes | 0 | 0.0% |
Commute Time by Sex in Wright City
The most common commute times in Wright City are 20 to 24 minutes (266 commuters, 20.7%) for males and 15 to 19 minutes (178 commuters, 20.3%) for females.
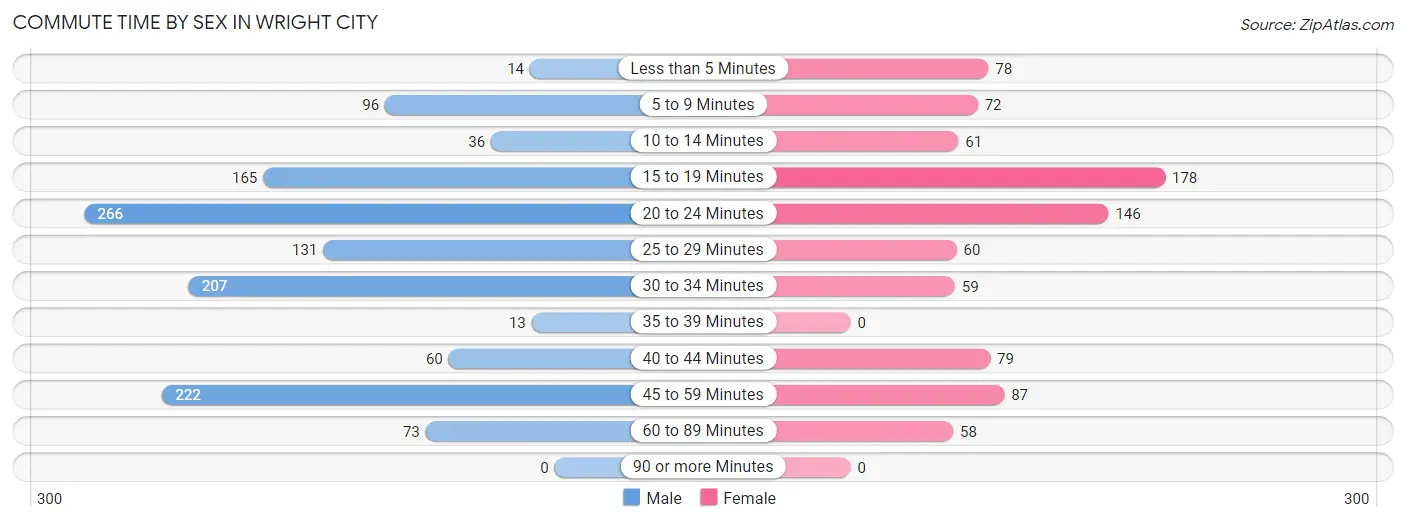
| Commute Time | Male | Female |
| Less than 5 Minutes | 14 (1.1%) | 78 (8.9%) |
| 5 to 9 Minutes | 96 (7.5%) | 72 (8.2%) |
| 10 to 14 Minutes | 36 (2.8%) | 61 (7.0%) |
| 15 to 19 Minutes | 165 (12.9%) | 178 (20.3%) |
| 20 to 24 Minutes | 266 (20.7%) | 146 (16.6%) |
| 25 to 29 Minutes | 131 (10.2%) | 60 (6.8%) |
| 30 to 34 Minutes | 207 (16.1%) | 59 (6.7%) |
| 35 to 39 Minutes | 13 (1.0%) | 0 (0.0%) |
| 40 to 44 Minutes | 60 (4.7%) | 79 (9.0%) |
| 45 to 59 Minutes | 222 (17.3%) | 87 (9.9%) |
| 60 to 89 Minutes | 73 (5.7%) | 58 (6.6%) |
| 90 or more Minutes | 0 (0.0%) | 0 (0.0%) |
Time of Departure to Work by Sex in Wright City
The most frequent times of departure to work in Wright City are 5:30 AM to 5:59 AM (244, 19.0%) for males and 7:00 AM to 7:29 AM (164, 18.7%) for females.
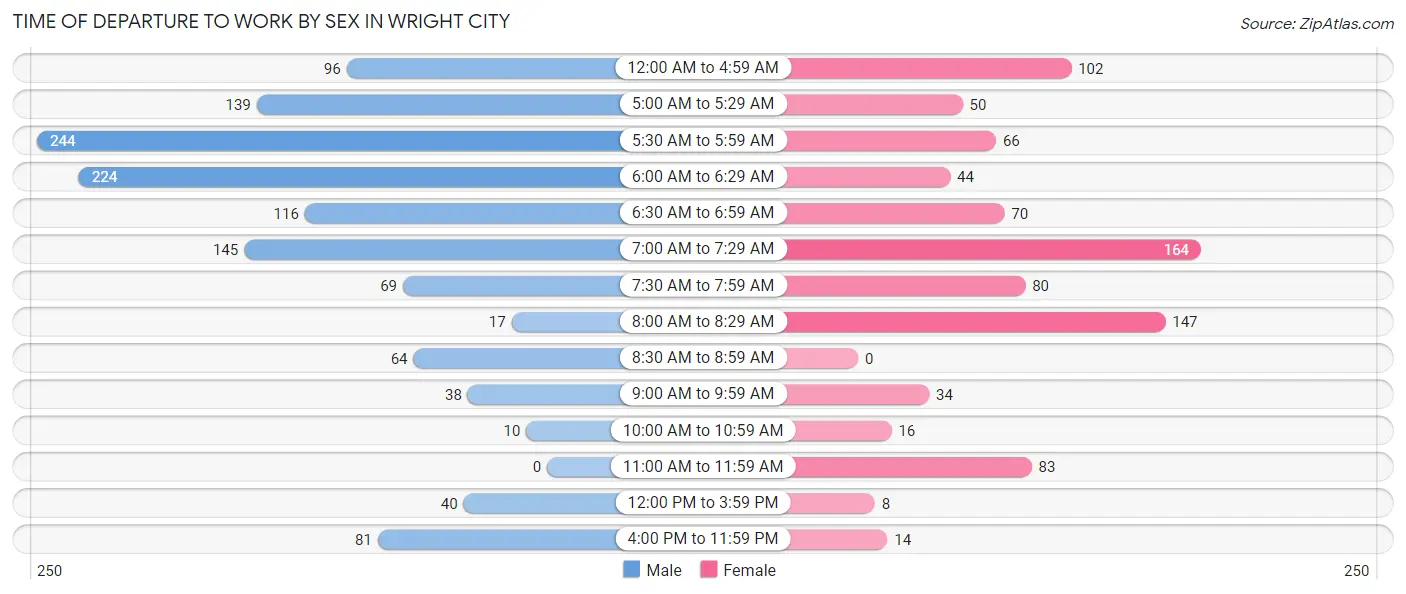
| Time of Departure | Male | Female |
| 12:00 AM to 4:59 AM | 96 (7.5%) | 102 (11.6%) |
| 5:00 AM to 5:29 AM | 139 (10.8%) | 50 (5.7%) |
| 5:30 AM to 5:59 AM | 244 (19.0%) | 66 (7.5%) |
| 6:00 AM to 6:29 AM | 224 (17.5%) | 44 (5.0%) |
| 6:30 AM to 6:59 AM | 116 (9.0%) | 70 (8.0%) |
| 7:00 AM to 7:29 AM | 145 (11.3%) | 164 (18.7%) |
| 7:30 AM to 7:59 AM | 69 (5.4%) | 80 (9.1%) |
| 8:00 AM to 8:29 AM | 17 (1.3%) | 147 (16.7%) |
| 8:30 AM to 8:59 AM | 64 (5.0%) | 0 (0.0%) |
| 9:00 AM to 9:59 AM | 38 (3.0%) | 34 (3.9%) |
| 10:00 AM to 10:59 AM | 10 (0.8%) | 16 (1.8%) |
| 11:00 AM to 11:59 AM | 0 (0.0%) | 83 (9.5%) |
| 12:00 PM to 3:59 PM | 40 (3.1%) | 8 (0.9%) |
| 4:00 PM to 11:59 PM | 81 (6.3%) | 14 (1.6%) |
| Total | 1,283 (100.0%) | 878 (100.0%) |
Housing Occupancy in Wright City
Occupancy by Ownership in Wright City
Of the total 1,687 dwellings in Wright City, owner-occupied units account for 1,307 (77.5%), while renter-occupied units make up 380 (22.5%).
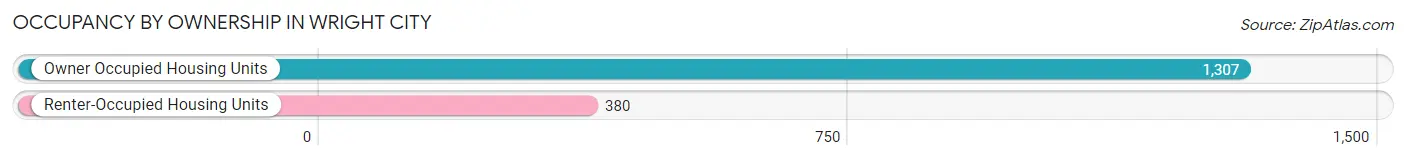
| Occupancy | # Housing Units | % Housing Units |
| Owner Occupied Housing Units | 1,307 | 77.5% |
| Renter-Occupied Housing Units | 380 | 22.5% |
| Total Occupied Housing Units | 1,687 | 100.0% |
Occupancy by Household Size in Wright City
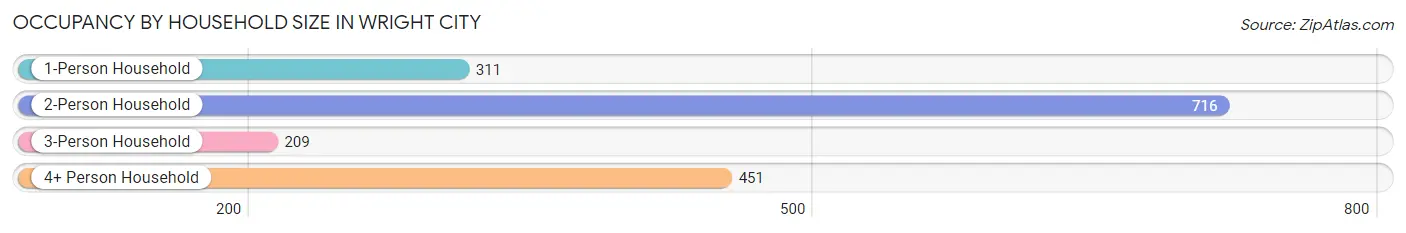
| Household Size | # Housing Units | % Housing Units |
| 1-Person Household | 311 | 18.4% |
| 2-Person Household | 716 | 42.4% |
| 3-Person Household | 209 | 12.4% |
| 4+ Person Household | 451 | 26.7% |
| Total Housing Units | 1,687 | 100.0% |
Occupancy by Ownership by Household Size in Wright City
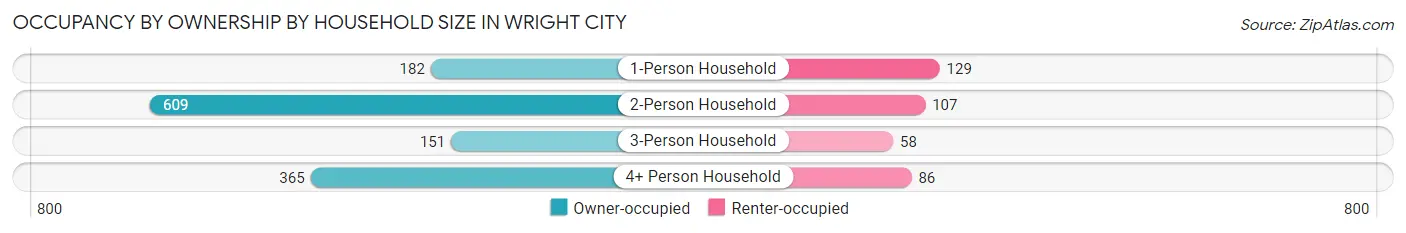
| Household Size | Owner-occupied | Renter-occupied |
| 1-Person Household | 182 (58.5%) | 129 (41.5%) |
| 2-Person Household | 609 (85.1%) | 107 (14.9%) |
| 3-Person Household | 151 (72.3%) | 58 (27.8%) |
| 4+ Person Household | 365 (80.9%) | 86 (19.1%) |
| Total Housing Units | 1,307 (77.5%) | 380 (22.5%) |
Occupancy by Educational Attainment in Wright City
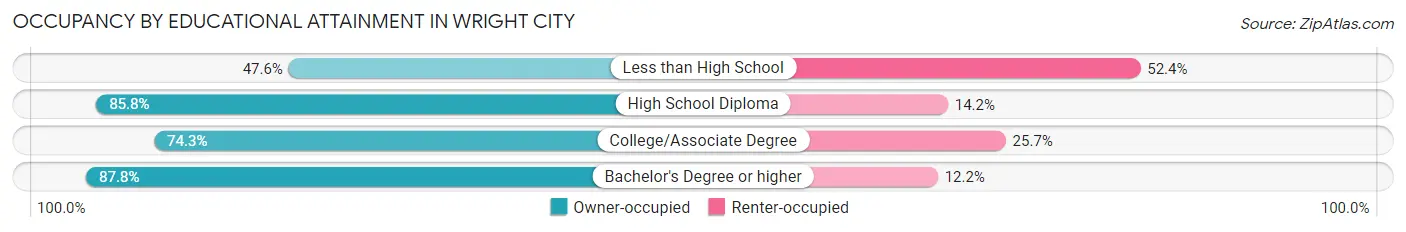
| Household Size | Owner-occupied | Renter-occupied |
| Less than High School | 111 (47.6%) | 122 (52.4%) |
| High School Diploma | 441 (85.8%) | 73 (14.2%) |
| College/Associate Degree | 388 (74.3%) | 134 (25.7%) |
| Bachelor's Degree or higher | 367 (87.8%) | 51 (12.2%) |
Occupancy by Age of Householder in Wright City
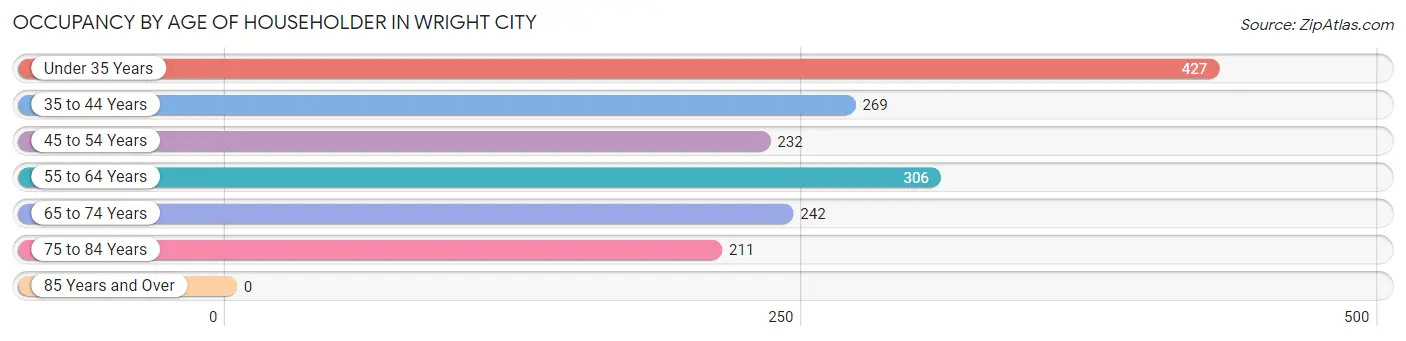
| Age Bracket | # Households | % Households |
| Under 35 Years | 427 | 25.3% |
| 35 to 44 Years | 269 | 16.0% |
| 45 to 54 Years | 232 | 13.8% |
| 55 to 64 Years | 306 | 18.1% |
| 65 to 74 Years | 242 | 14.3% |
| 75 to 84 Years | 211 | 12.5% |
| 85 Years and Over | 0 | 0.0% |
| Total | 1,687 | 100.0% |
Housing Finances in Wright City
Median Income by Occupancy in Wright City
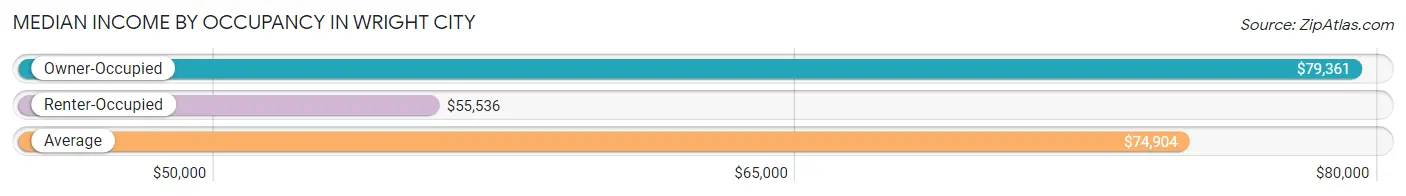
| Occupancy Type | # Households | Median Income |
| Owner-Occupied | 1,307 (77.5%) | $79,361 |
| Renter-Occupied | 380 (22.5%) | $55,536 |
| Average | 1,687 (100.0%) | $74,904 |
Occupancy by Householder Income Bracket in Wright City
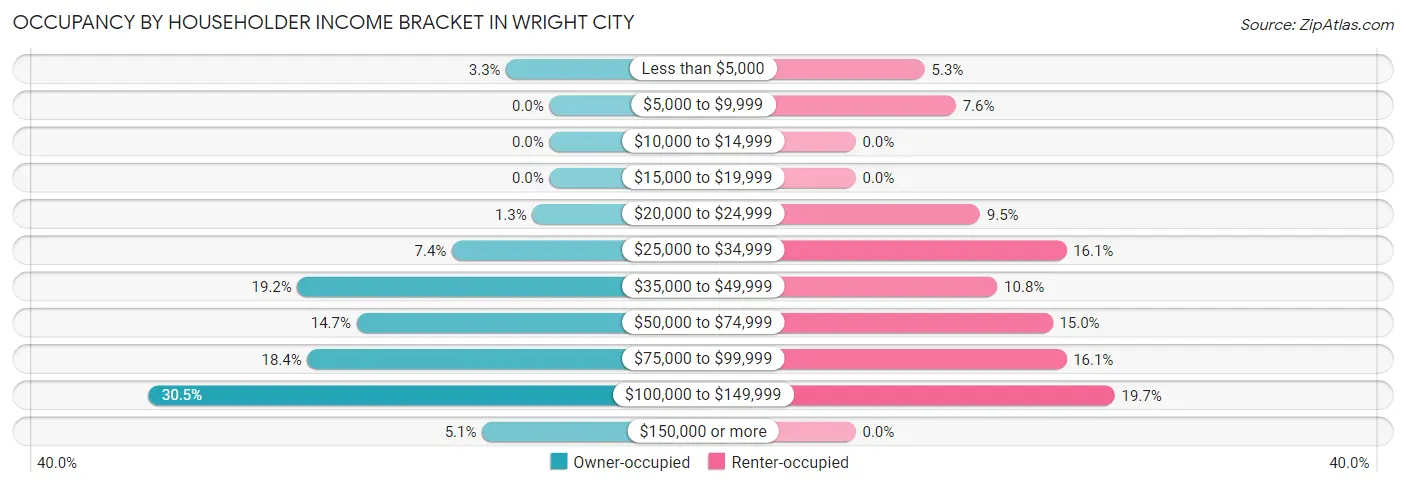
| Income Bracket | Owner-occupied | Renter-occupied |
| Less than $5,000 | 43 (3.3%) | 20 (5.3%) |
| $5,000 to $9,999 | 0 (0.0%) | 29 (7.6%) |
| $10,000 to $14,999 | 0 (0.0%) | 0 (0.0%) |
| $15,000 to $19,999 | 0 (0.0%) | 0 (0.0%) |
| $20,000 to $24,999 | 17 (1.3%) | 36 (9.5%) |
| $25,000 to $34,999 | 97 (7.4%) | 61 (16.1%) |
| $35,000 to $49,999 | 251 (19.2%) | 41 (10.8%) |
| $50,000 to $74,999 | 192 (14.7%) | 57 (15.0%) |
| $75,000 to $99,999 | 241 (18.4%) | 61 (16.1%) |
| $100,000 to $149,999 | 399 (30.5%) | 75 (19.7%) |
| $150,000 or more | 67 (5.1%) | 0 (0.0%) |
| Total | 1,307 (100.0%) | 380 (100.0%) |
Monthly Housing Cost Tiers in Wright City
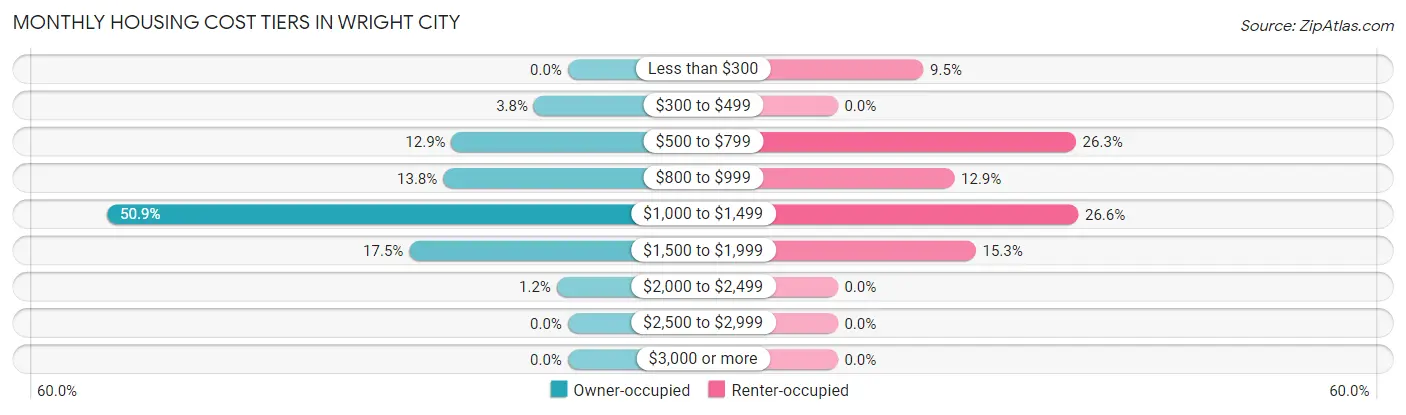
| Monthly Cost | Owner-occupied | Renter-occupied |
| Less than $300 | 0 (0.0%) | 36 (9.5%) |
| $300 to $499 | 49 (3.7%) | 0 (0.0%) |
| $500 to $799 | 168 (12.9%) | 100 (26.3%) |
| $800 to $999 | 180 (13.8%) | 49 (12.9%) |
| $1,000 to $1,499 | 665 (50.9%) | 101 (26.6%) |
| $1,500 to $1,999 | 229 (17.5%) | 58 (15.3%) |
| $2,000 to $2,499 | 16 (1.2%) | 0 (0.0%) |
| $2,500 to $2,999 | 0 (0.0%) | 0 (0.0%) |
| $3,000 or more | 0 (0.0%) | 0 (0.0%) |
| Total | 1,307 (100.0%) | 380 (100.0%) |
Physical Housing Characteristics in Wright City
Housing Structures in Wright City
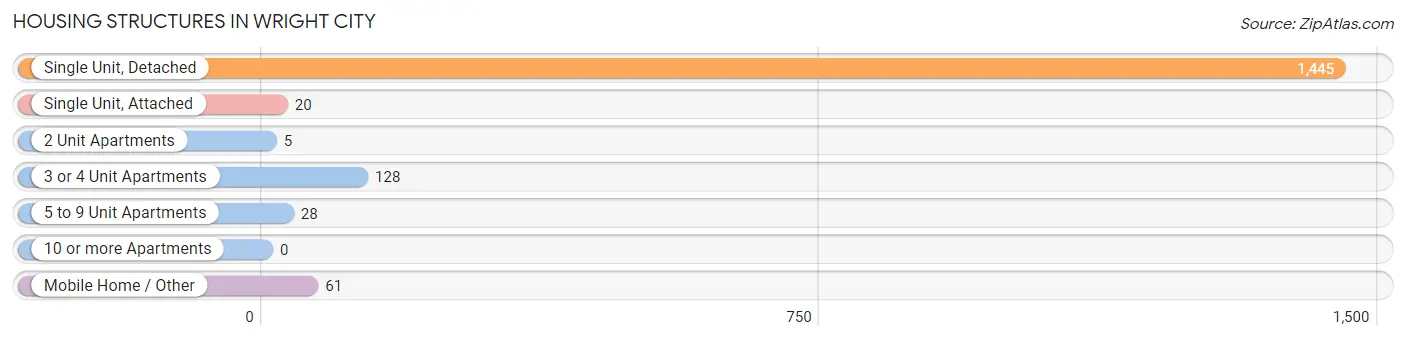
| Structure Type | # Housing Units | % Housing Units |
| Single Unit, Detached | 1,445 | 85.7% |
| Single Unit, Attached | 20 | 1.2% |
| 2 Unit Apartments | 5 | 0.3% |
| 3 or 4 Unit Apartments | 128 | 7.6% |
| 5 to 9 Unit Apartments | 28 | 1.7% |
| 10 or more Apartments | 0 | 0.0% |
| Mobile Home / Other | 61 | 3.6% |
| Total | 1,687 | 100.0% |
Housing Structures by Occupancy in Wright City
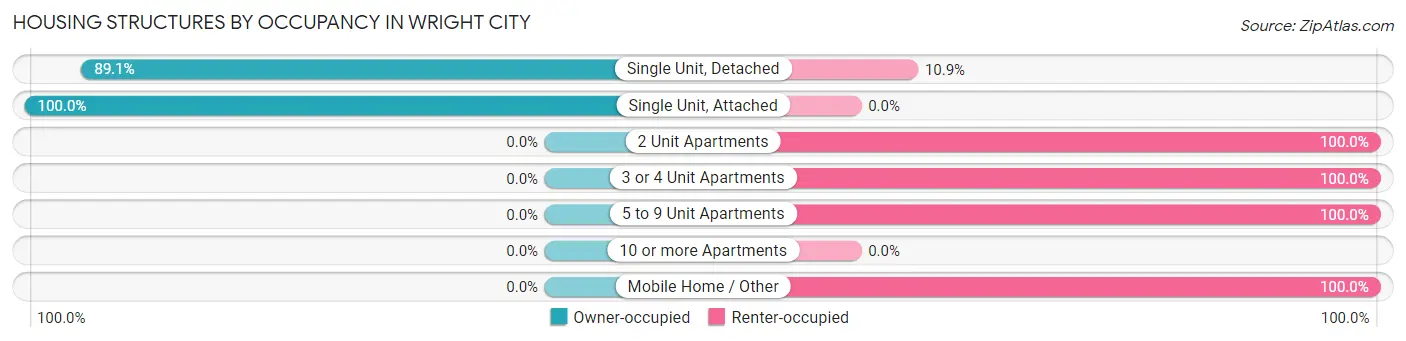
| Structure Type | Owner-occupied | Renter-occupied |
| Single Unit, Detached | 1,287 (89.1%) | 158 (10.9%) |
| Single Unit, Attached | 20 (100.0%) | 0 (0.0%) |
| 2 Unit Apartments | 0 (0.0%) | 5 (100.0%) |
| 3 or 4 Unit Apartments | 0 (0.0%) | 128 (100.0%) |
| 5 to 9 Unit Apartments | 0 (0.0%) | 28 (100.0%) |
| 10 or more Apartments | 0 (0.0%) | 0 (0.0%) |
| Mobile Home / Other | 0 (0.0%) | 61 (100.0%) |
| Total | 1,307 (77.5%) | 380 (22.5%) |
Housing Structures by Number of Rooms in Wright City
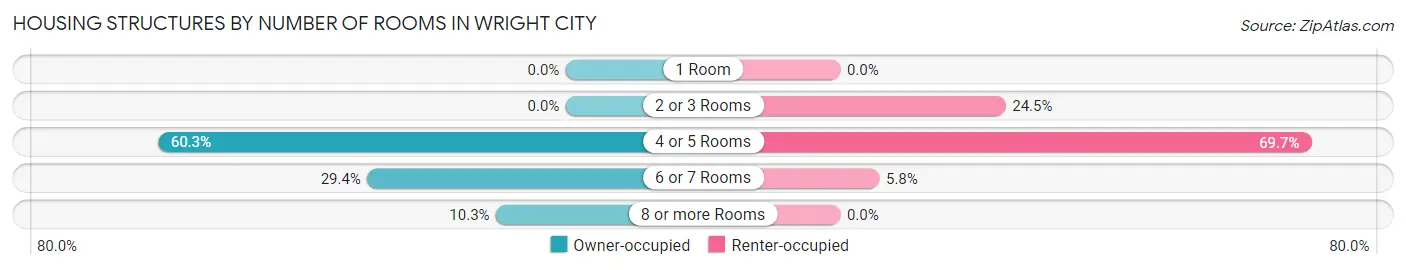
| Number of Rooms | Owner-occupied | Renter-occupied |
| 1 Room | 0 (0.0%) | 0 (0.0%) |
| 2 or 3 Rooms | 0 (0.0%) | 93 (24.5%) |
| 4 or 5 Rooms | 788 (60.3%) | 265 (69.7%) |
| 6 or 7 Rooms | 384 (29.4%) | 22 (5.8%) |
| 8 or more Rooms | 135 (10.3%) | 0 (0.0%) |
| Total | 1,307 (100.0%) | 380 (100.0%) |
Housing Structure by Heating Type in Wright City
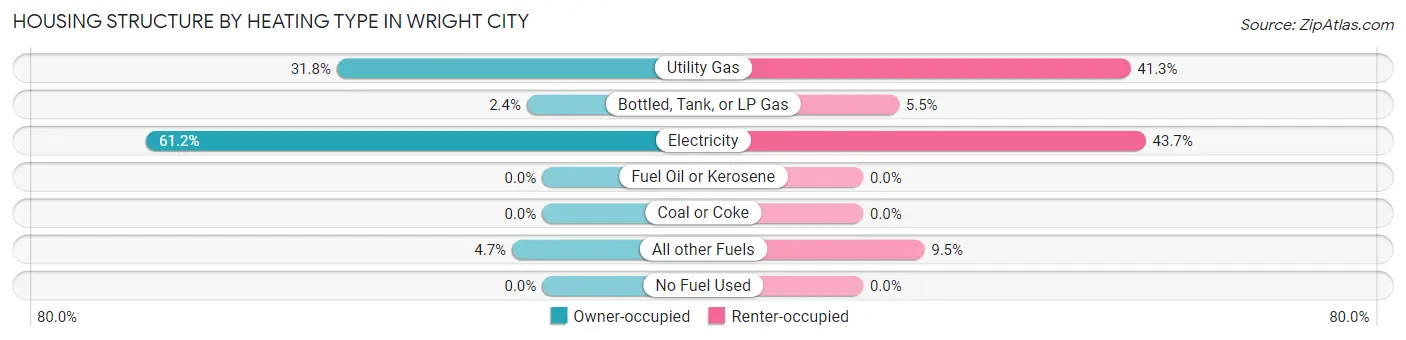
| Heating Type | Owner-occupied | Renter-occupied |
| Utility Gas | 415 (31.8%) | 157 (41.3%) |
| Bottled, Tank, or LP Gas | 31 (2.4%) | 21 (5.5%) |
| Electricity | 800 (61.2%) | 166 (43.7%) |
| Fuel Oil or Kerosene | 0 (0.0%) | 0 (0.0%) |
| Coal or Coke | 0 (0.0%) | 0 (0.0%) |
| All other Fuels | 61 (4.7%) | 36 (9.5%) |
| No Fuel Used | 0 (0.0%) | 0 (0.0%) |
| Total | 1,307 (100.0%) | 380 (100.0%) |
Household Vehicle Usage in Wright City
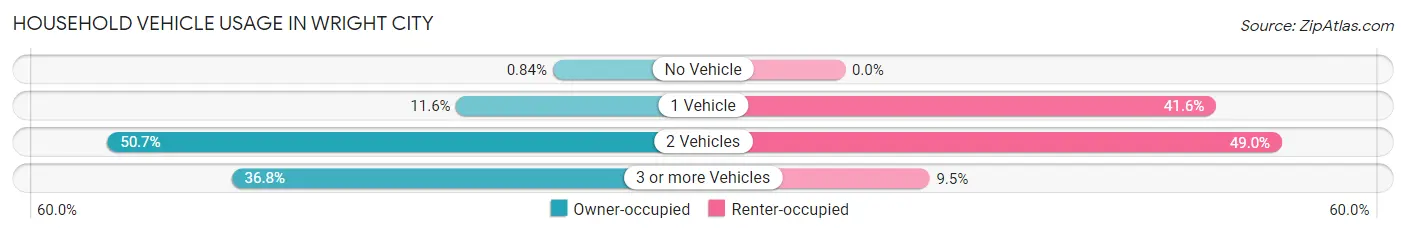
| Vehicles per Household | Owner-occupied | Renter-occupied |
| No Vehicle | 11 (0.8%) | 0 (0.0%) |
| 1 Vehicle | 152 (11.6%) | 158 (41.6%) |
| 2 Vehicles | 663 (50.7%) | 186 (48.9%) |
| 3 or more Vehicles | 481 (36.8%) | 36 (9.5%) |
| Total | 1,307 (100.0%) | 380 (100.0%) |
Real Estate & Mortgages in Wright City
Real Estate and Mortgage Overview in Wright City
| Characteristic | Without Mortgage | With Mortgage |
| Housing Units | 208 | 1,099 |
| Median Property Value | $171,500 | $200,800 |
| Median Household Income | $55,081 | $67 |
| Monthly Housing Costs | $545 | $0 |
| Real Estate Taxes | $2,028 | $33 |
Property Value by Mortgage Status in Wright City
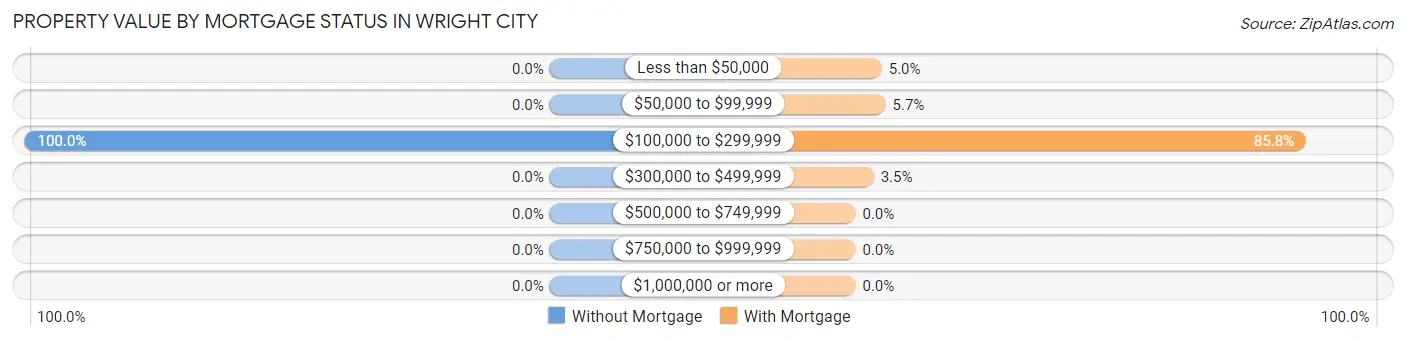
| Property Value | Without Mortgage | With Mortgage |
| Less than $50,000 | 0 (0.0%) | 55 (5.0%) |
| $50,000 to $99,999 | 0 (0.0%) | 63 (5.7%) |
| $100,000 to $299,999 | 208 (100.0%) | 943 (85.8%) |
| $300,000 to $499,999 | 0 (0.0%) | 38 (3.5%) |
| $500,000 to $749,999 | 0 (0.0%) | 0 (0.0%) |
| $750,000 to $999,999 | 0 (0.0%) | 0 (0.0%) |
| $1,000,000 or more | 0 (0.0%) | 0 (0.0%) |
| Total | 208 (100.0%) | 1,099 (100.0%) |
Household Income by Mortgage Status in Wright City
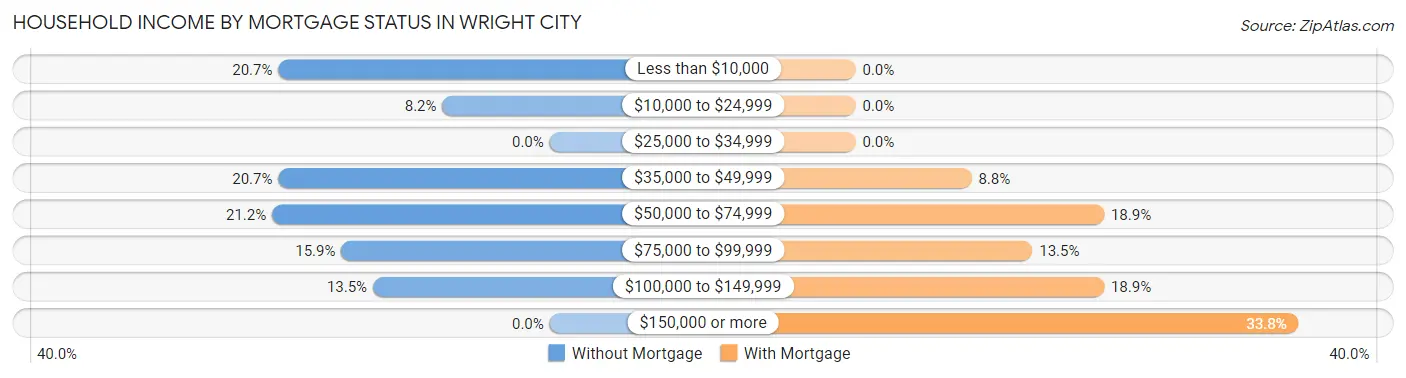
| Household Income | Without Mortgage | With Mortgage |
| Less than $10,000 | 43 (20.7%) | 0 (0.0%) |
| $10,000 to $24,999 | 17 (8.2%) | 0 (0.0%) |
| $25,000 to $34,999 | 0 (0.0%) | 0 (0.0%) |
| $35,000 to $49,999 | 43 (20.7%) | 97 (8.8%) |
| $50,000 to $74,999 | 44 (21.1%) | 208 (18.9%) |
| $75,000 to $99,999 | 33 (15.9%) | 148 (13.5%) |
| $100,000 to $149,999 | 28 (13.5%) | 208 (18.9%) |
| $150,000 or more | 0 (0.0%) | 371 (33.8%) |
| Total | 208 (100.0%) | 1,099 (100.0%) |
Property Value to Household Income Ratio in Wright City
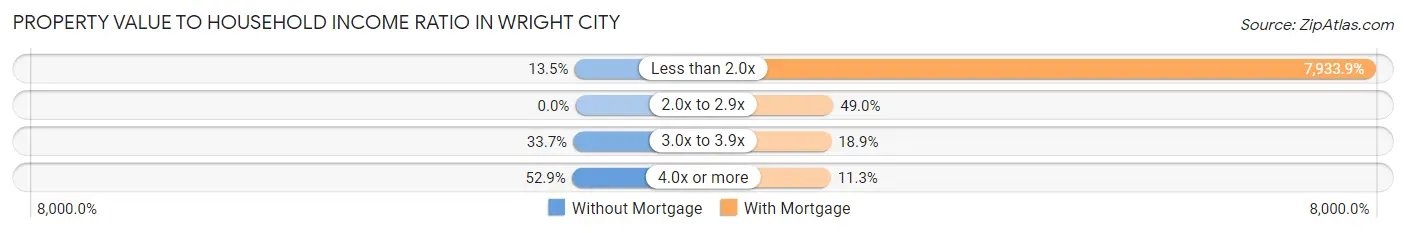
| Value-to-Income Ratio | Without Mortgage | With Mortgage |
| Less than 2.0x | 28 (13.5%) | 87,193 (7,933.8%) |
| 2.0x to 2.9x | 0 (0.0%) | 538 (48.9%) |
| 3.0x to 3.9x | 70 (33.7%) | 208 (18.9%) |
| 4.0x or more | 110 (52.9%) | 124 (11.3%) |
| Total | 208 (100.0%) | 1,099 (100.0%) |
Real Estate Taxes by Mortgage Status in Wright City
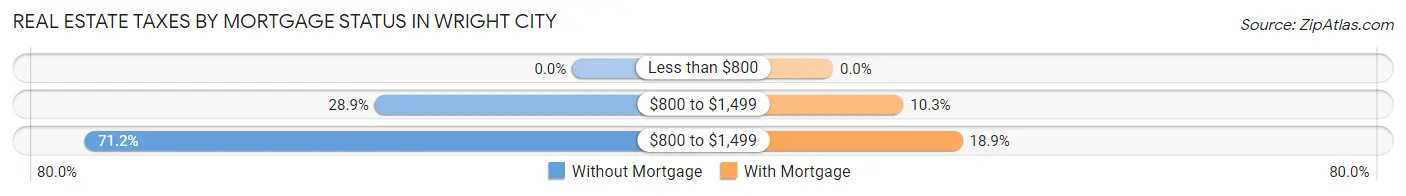
| Property Taxes | Without Mortgage | With Mortgage |
| Less than $800 | 0 (0.0%) | 0 (0.0%) |
| $800 to $1,499 | 60 (28.8%) | 113 (10.3%) |
| $800 to $1,499 | 148 (71.2%) | 208 (18.9%) |
| Total | 208 (100.0%) | 1,099 (100.0%) |
Health & Disability in Wright City
Health Insurance Coverage by Age in Wright City
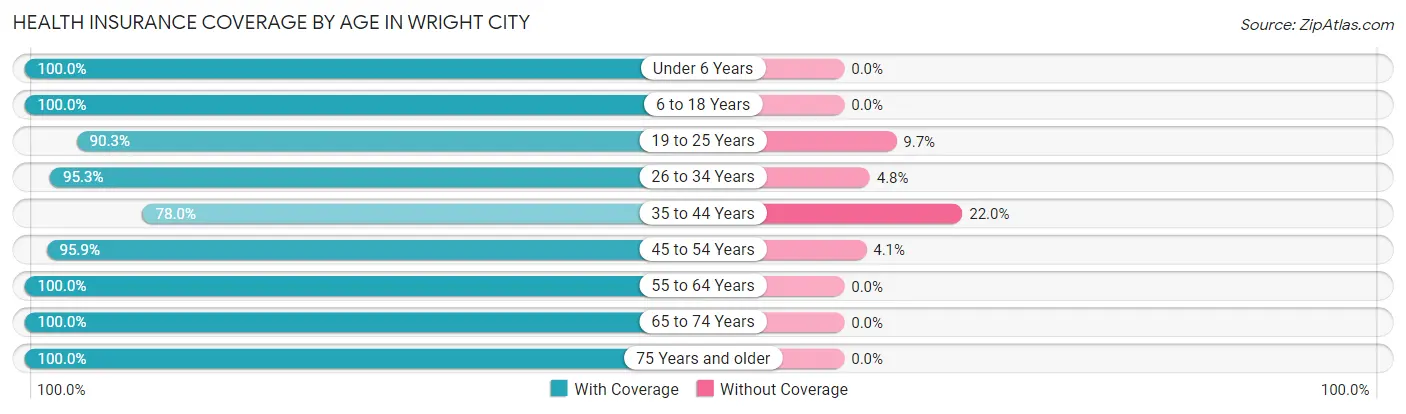
| Age Bracket | With Coverage | Without Coverage |
| Under 6 Years | 284 (100.0%) | 0 (0.0%) |
| 6 to 18 Years | 910 (100.0%) | 0 (0.0%) |
| 19 to 25 Years | 419 (90.3%) | 45 (9.7%) |
| 26 to 34 Years | 622 (95.3%) | 31 (4.8%) |
| 35 to 44 Years | 599 (78.0%) | 169 (22.0%) |
| 45 to 54 Years | 468 (95.9%) | 20 (4.1%) |
| 55 to 64 Years | 590 (100.0%) | 0 (0.0%) |
| 65 to 74 Years | 369 (100.0%) | 0 (0.0%) |
| 75 Years and older | 302 (100.0%) | 0 (0.0%) |
| Total | 4,563 (94.5%) | 265 (5.5%) |
Health Insurance Coverage by Citizenship Status in Wright City
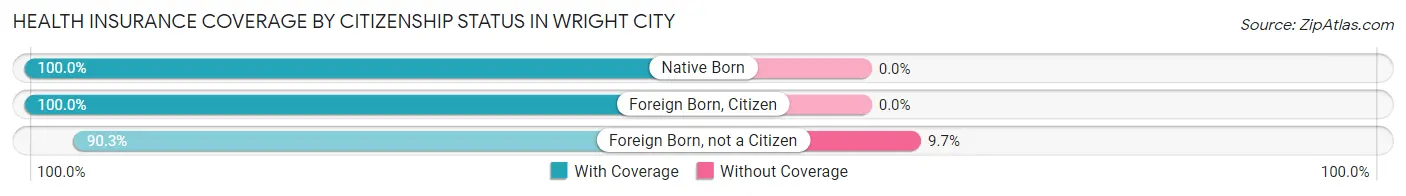
| Citizenship Status | With Coverage | Without Coverage |
| Native Born | 284 (100.0%) | 0 (0.0%) |
| Foreign Born, Citizen | 910 (100.0%) | 0 (0.0%) |
| Foreign Born, not a Citizen | 419 (90.3%) | 45 (9.7%) |
Health Insurance Coverage by Household Income in Wright City
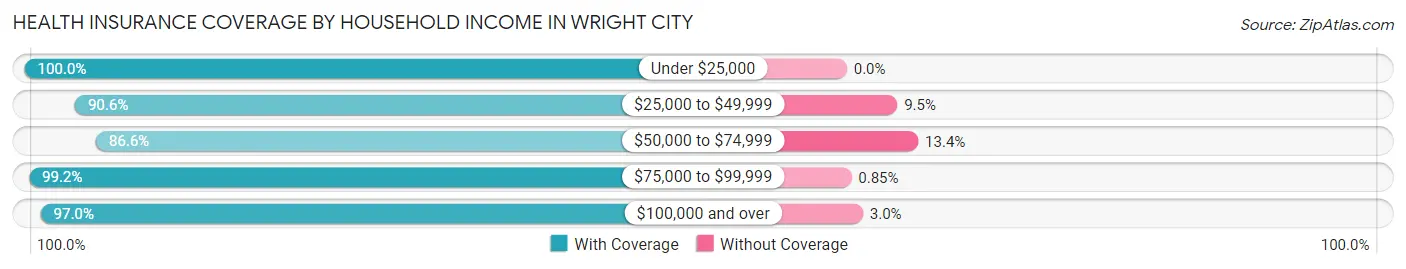
| Household Income | With Coverage | Without Coverage |
| Under $25,000 | 322 (100.0%) | 0 (0.0%) |
| $25,000 to $49,999 | 1,016 (90.5%) | 106 (9.5%) |
| $50,000 to $74,999 | 648 (86.6%) | 100 (13.4%) |
| $75,000 to $99,999 | 931 (99.2%) | 8 (0.9%) |
| $100,000 and over | 1,643 (97.0%) | 51 (3.0%) |
Public vs Private Health Insurance Coverage by Age in Wright City
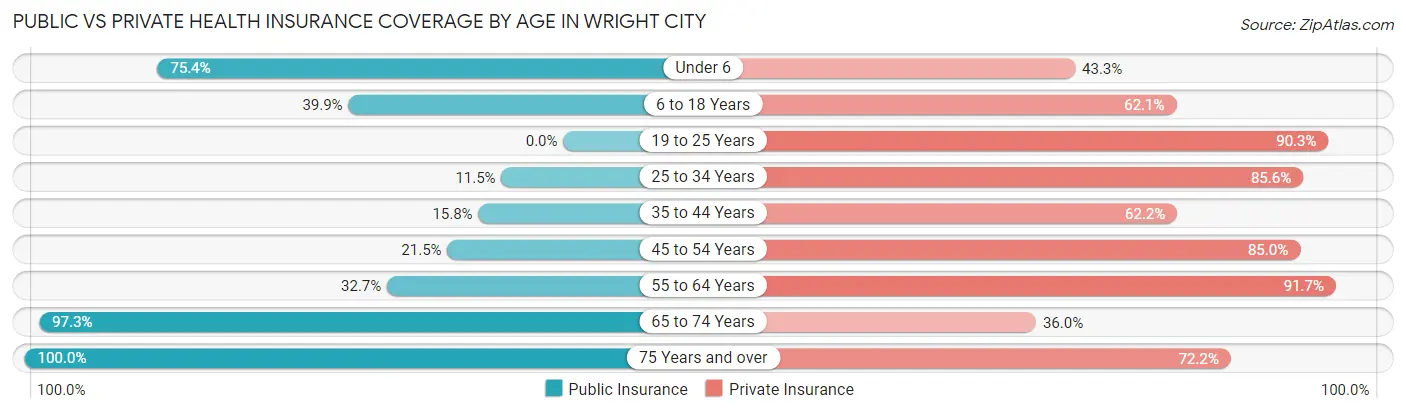
| Age Bracket | Public Insurance | Private Insurance |
| Under 6 | 214 (75.3%) | 123 (43.3%) |
| 6 to 18 Years | 363 (39.9%) | 565 (62.1%) |
| 19 to 25 Years | 0 (0.0%) | 419 (90.3%) |
| 25 to 34 Years | 75 (11.5%) | 559 (85.6%) |
| 35 to 44 Years | 121 (15.8%) | 478 (62.2%) |
| 45 to 54 Years | 105 (21.5%) | 415 (85.0%) |
| 55 to 64 Years | 193 (32.7%) | 541 (91.7%) |
| 65 to 74 Years | 359 (97.3%) | 133 (36.0%) |
| 75 Years and over | 302 (100.0%) | 218 (72.2%) |
| Total | 1,732 (35.9%) | 3,451 (71.5%) |
Disability Status by Sex by Age in Wright City
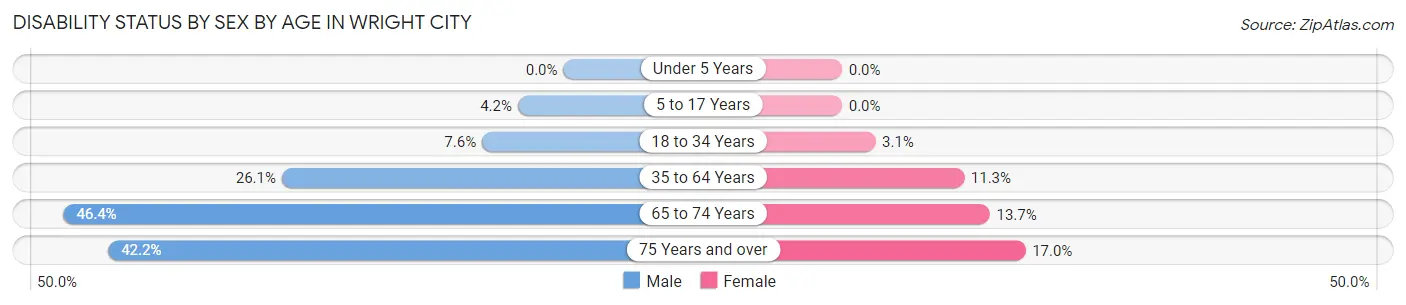
| Age Bracket | Male | Female |
| Under 5 Years | 0 (0.0%) | 0 (0.0%) |
| 5 to 17 Years | 26 (4.2%) | 0 (0.0%) |
| 18 to 34 Years | 44 (7.5%) | 17 (3.1%) |
| 35 to 64 Years | 284 (26.1%) | 86 (11.3%) |
| 65 to 74 Years | 90 (46.4%) | 24 (13.7%) |
| 75 Years and over | 68 (42.2%) | 24 (17.0%) |
Disability Class by Sex by Age in Wright City
Disability Class: Hearing Difficulty
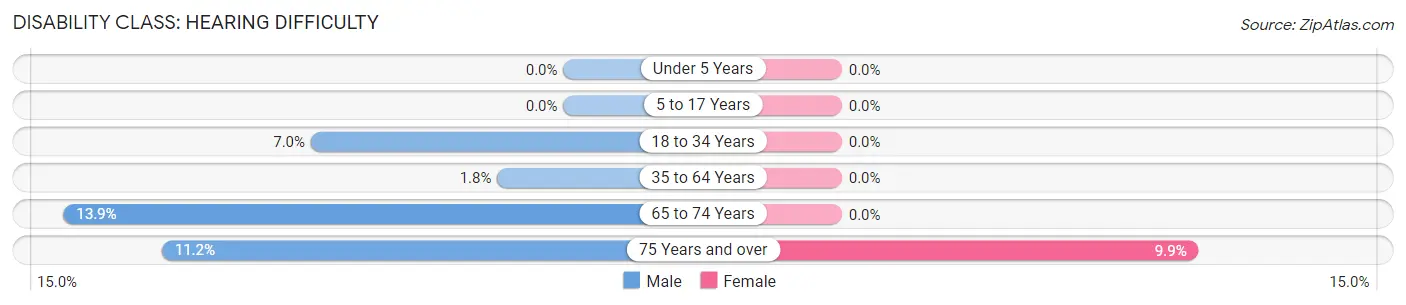
| Age Bracket | Male | Female |
| Under 5 Years | 0 (0.0%) | 0 (0.0%) |
| 5 to 17 Years | 0 (0.0%) | 0 (0.0%) |
| 18 to 34 Years | 41 (7.0%) | 0 (0.0%) |
| 35 to 64 Years | 20 (1.8%) | 0 (0.0%) |
| 65 to 74 Years | 27 (13.9%) | 0 (0.0%) |
| 75 Years and over | 18 (11.2%) | 14 (9.9%) |
Disability Class: Vision Difficulty
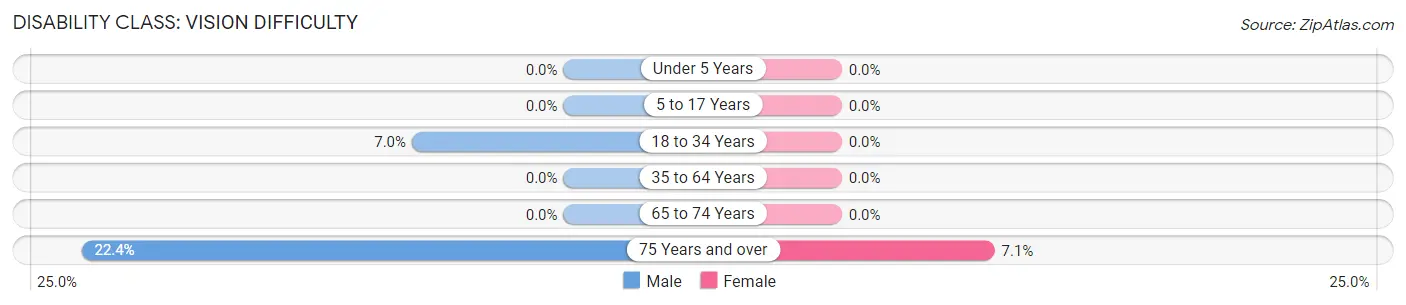
| Age Bracket | Male | Female |
| Under 5 Years | 0 (0.0%) | 0 (0.0%) |
| 5 to 17 Years | 0 (0.0%) | 0 (0.0%) |
| 18 to 34 Years | 41 (7.0%) | 0 (0.0%) |
| 35 to 64 Years | 0 (0.0%) | 0 (0.0%) |
| 65 to 74 Years | 0 (0.0%) | 0 (0.0%) |
| 75 Years and over | 36 (22.4%) | 10 (7.1%) |
Disability Class: Cognitive Difficulty
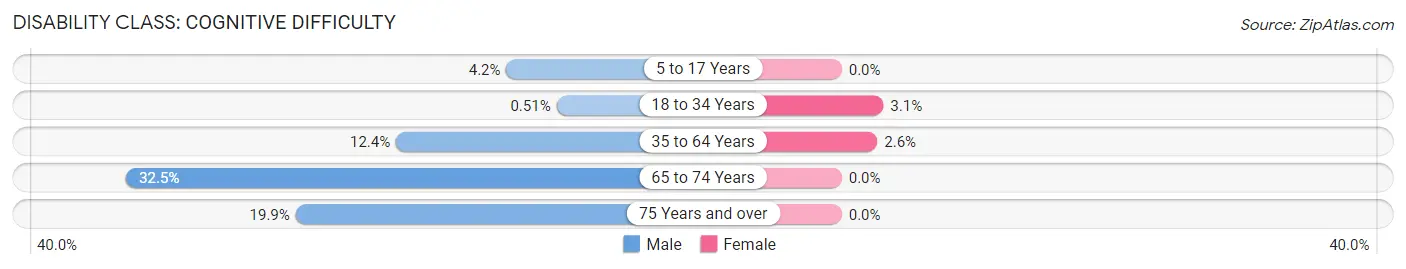
| Age Bracket | Male | Female |
| 5 to 17 Years | 26 (4.2%) | 0 (0.0%) |
| 18 to 34 Years | 3 (0.5%) | 17 (3.1%) |
| 35 to 64 Years | 135 (12.4%) | 20 (2.6%) |
| 65 to 74 Years | 63 (32.5%) | 0 (0.0%) |
| 75 Years and over | 32 (19.9%) | 0 (0.0%) |
Disability Class: Ambulatory Difficulty
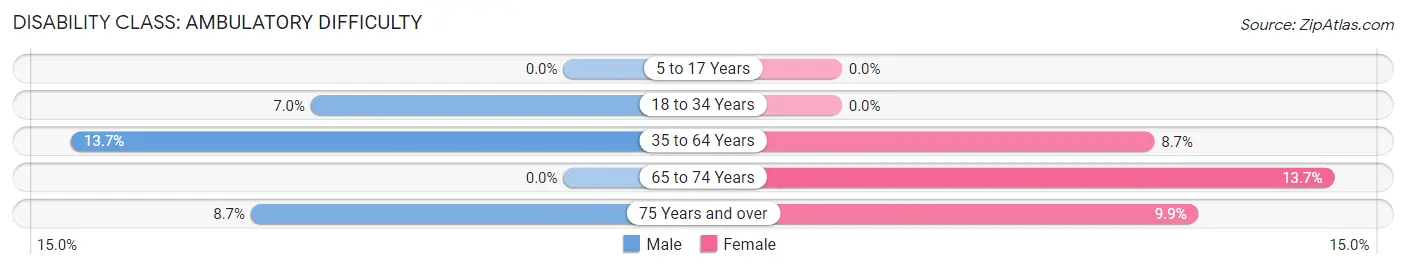
| Age Bracket | Male | Female |
| 5 to 17 Years | 0 (0.0%) | 0 (0.0%) |
| 18 to 34 Years | 41 (7.0%) | 0 (0.0%) |
| 35 to 64 Years | 149 (13.7%) | 66 (8.7%) |
| 65 to 74 Years | 0 (0.0%) | 24 (13.7%) |
| 75 Years and over | 14 (8.7%) | 14 (9.9%) |
Disability Class: Self-Care Difficulty
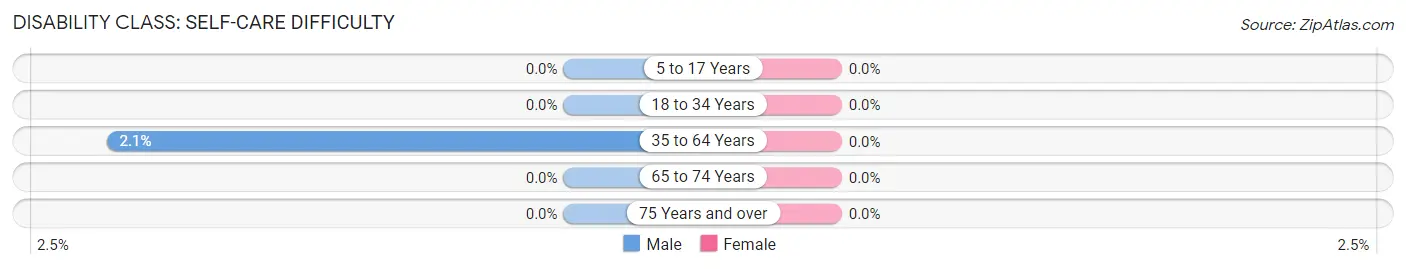
| Age Bracket | Male | Female |
| 5 to 17 Years | 0 (0.0%) | 0 (0.0%) |
| 18 to 34 Years | 0 (0.0%) | 0 (0.0%) |
| 35 to 64 Years | 23 (2.1%) | 0 (0.0%) |
| 65 to 74 Years | 0 (0.0%) | 0 (0.0%) |
| 75 Years and over | 0 (0.0%) | 0 (0.0%) |
Technology Access in Wright City
Computing Device Access in Wright City
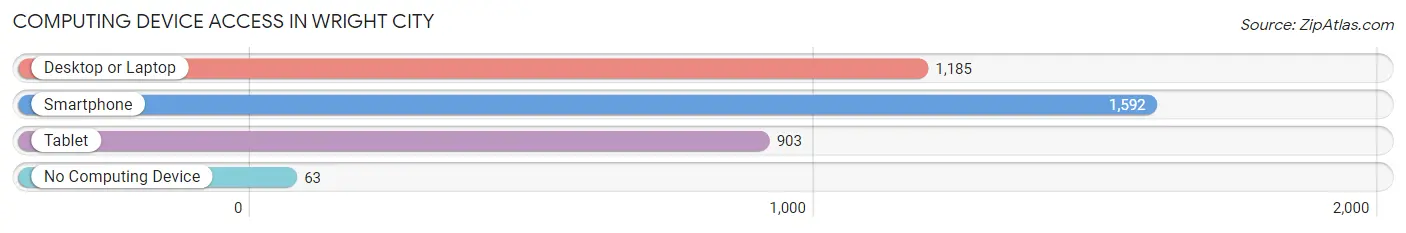
| Device Type | # Households | % Households |
| Desktop or Laptop | 1,185 | 70.2% |
| Smartphone | 1,592 | 94.4% |
| Tablet | 903 | 53.5% |
| No Computing Device | 63 | 3.7% |
| Total | 1,687 | 100.0% |
Internet Access in Wright City
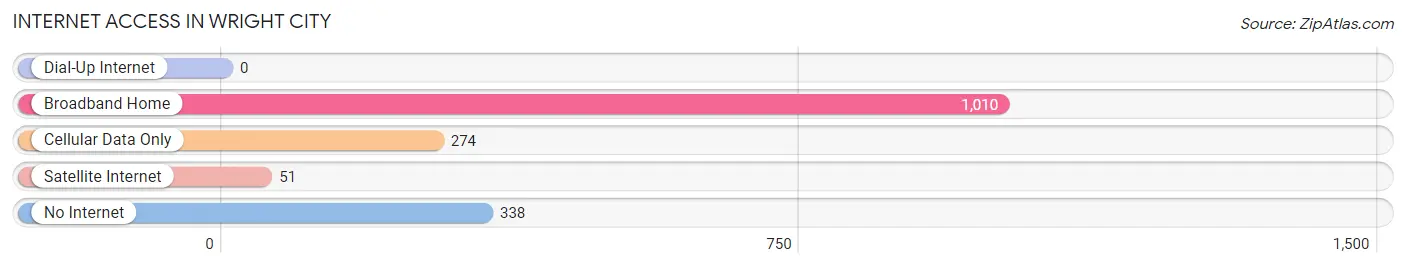
| Internet Type | # Households | % Households |
| Dial-Up Internet | 0 | 0.0% |
| Broadband Home | 1,010 | 59.9% |
| Cellular Data Only | 274 | 16.2% |
| Satellite Internet | 51 | 3.0% |
| No Internet | 338 | 20.0% |
| Total | 1,687 | 100.0% |
Wright City Summary
Wright City is a small town located in Warren County, Missouri, United States. It is situated on the banks of the Missouri River, approximately 40 miles west of St. Louis. The town was founded in 1855 and was named after the Wright family, who were among the first settlers in the area. The population of Wright City was 1,845 at the 2010 census.
Geography
Wright City is located at 38°45'25" North, 90°59'45" West (38.756944, -90.995833). According to the United States Census Bureau, the town has a total area of 1.2 square miles (3.1 km2), all of it land.
Demographics
As of the census of 2000, there were 1,845 people, 717 households, and 517 families residing in the town. The population density was 1,541.2 people per square mile (595.2/km2). There were 762 housing units at an average density of 631.2 per square mile (244.2/km2). The racial makeup of the town was 97.45% White, 0.76% African American, 0.05% Native American, 0.05% Asian, 0.05% Pacific Islander, 0.05% from other races, and 1.54% from two or more races. Hispanic or Latino of any race were 0.76% of the population.
There were 717 households, out of which 33.2% had children under the age of 18 living with them, 56.2% were married couples living together, 10.2% had a female householder with no husband present, and 29.7% were non-families. 25.2% of all households were made up of individuals, and 11.2% had someone living alone who was 65 years of age or older. The average household size was 2.56 and the average family size was 3.08.
In the town, the population was spread out, with 26.2% under the age of 18, 8.2% from 18 to 24, 29.2% from 25 to 44, 22.7% from 45 to 64, and 13.7% who were 65 years of age or older. The median age was 36 years. For every 100 females, there were 95.2 males. For every 100 females age 18 and over, there were 91.2 males.
The median income for a household in the town was $41,250, and the median income for a family was $48,750. Males had a median income of $35,000 versus $22,500 for females. The per capita income for the town was $18,945. About 4.2% of families and 6.2% of the population were below the poverty line, including 8.2% of those under age 18 and 6.2% of those age 65 or over.
Economy
Wright City is home to several businesses, including a lumber yard, a hardware store, a grocery store, a bank, a post office, and several restaurants. The town is also home to a number of manufacturing companies, including a plastics manufacturer, a metal fabricator, and a printing company.
The town is served by the Warren County R-III School District, which includes Wright City Elementary School, Wright City Middle School, and Wright City High School. The town is also home to a branch of the St. Charles Community College.
Wright City is also home to a number of parks and recreational facilities, including a public swimming pool, a skate park, and a disc golf course. The town also hosts a number of annual events, including the Wright City Rodeo, the Wright City Music Festival, and the Wright City Car Show.
Wright City is a small town with a big heart. It is a great place to live, work, and play. With its friendly people, beautiful scenery, and strong economy, Wright City is a great place to call home.
Common Questions
What is Per Capita Income in Wright City?
Per Capita income in Wright City is $29,328.
What is the Median Family Income in Wright City?
Median Family Income in Wright City is $80,938.
What is the Median Household income in Wright City?
Median Household Income in Wright City is $74,904.
What is Income or Wage Gap in Wright City?
Income or Wage Gap in Wright City is 39.9%.
Women in Wright City earn 60.1 cents for every dollar earned by a man.
What is Inequality or Gini Index in Wright City?
Inequality or Gini Index in Wright City is 0.32.
What is the Total Population of Wright City?
Total Population of Wright City is 4,828.
What is the Total Male Population of Wright City?
Total Male Population of Wright City is 2,780.
What is the Total Female Population of Wright City?
Total Female Population of Wright City is 2,048.
What is the Ratio of Males per 100 Females in Wright City?
There are 135.74 Males per 100 Females in Wright City.
What is the Ratio of Females per 100 Males in Wright City?
There are 73.67 Females per 100 Males in Wright City.
What is the Median Population Age in Wright City?
Median Population Age in Wright City is 36.4 Years.
What is the Average Family Size in Wright City
Average Family Size in Wright City is 3.2 People.
What is the Average Household Size in Wright City
Average Household Size in Wright City is 2.9 People.
How Large is the Labor Force in Wright City?
There are 2,457 People in the Labor Forcein in Wright City.
What is the Percentage of People in the Labor Force in Wright City?
65.9% of People are in the Labor Force in Wright City.
What is the Unemployment Rate in Wright City?
Unemployment Rate in Wright City is 6.6%.