Gray Summit, MO Map & Demographics
Gray Summit Map
Gray Summit Overview
$28,679
PER CAPITA INCOME
$85,385
AVG FAMILY INCOME
$68,272
AVG HOUSEHOLD INCOME
18.7%
WAGE / INCOME GAP [ % ]
81.3¢/ $1
WAGE / INCOME GAP [ $ ]
0.37
INEQUALITY / GINI INDEX
2,573
TOTAL POPULATION
1,465
MALE POPULATION
1,108
FEMALE POPULATION
132.22
MALES / 100 FEMALES
75.63
FEMALES / 100 MALES
37.2
MEDIAN AGE
3.1
AVG FAMILY SIZE
2.8
AVG HOUSEHOLD SIZE
1,228
LABOR FORCE [ PEOPLE ]
65.8%
PERCENT IN LABOR FORCE
2.5%
UNEMPLOYMENT RATE
Gray Summit Zip Codes
Gray Summit Area Codes
Income in Gray Summit
Income Overview in Gray Summit
Per Capita Income in Gray Summit is $28,679, while median incomes of families and households are $85,385 and $68,272 respectively.
| Characteristic | Number | Measure |
| Per Capita Income | 2,573 | $28,679 |
| Median Family Income | 668 | $85,385 |
| Mean Family Income | 668 | $90,048 |
| Median Household Income | 911 | $68,272 |
| Mean Household Income | 911 | $81,354 |
| Income Deficit | 668 | $0 |
| Wage / Income Gap (%) | 2,573 | 18.73% |
| Wage / Income Gap ($) | 2,573 | 81.27¢ per $1 |
| Gini / Inequality Index | 2,573 | 0.37 |
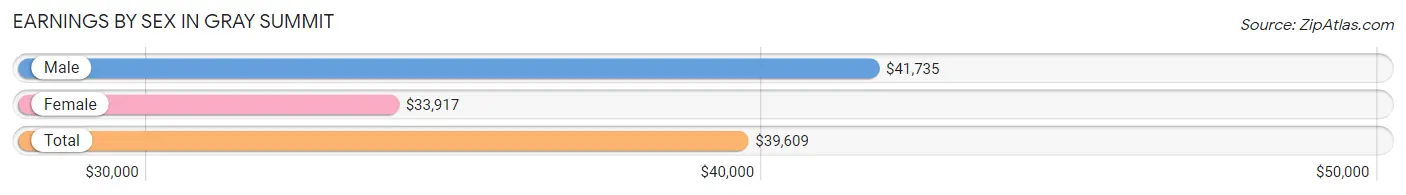
Earnings by Sex in Gray Summit
Average Earnings in Gray Summit are $39,609, $41,735 for men and $33,917 for women, a difference of 18.7%.
| Sex | Number | Average Earnings |
| Male | 662 (50.7%) | $41,735 |
| Female | 644 (49.3%) | $33,917 |
| Total | 1,306 (100.0%) | $39,609 |
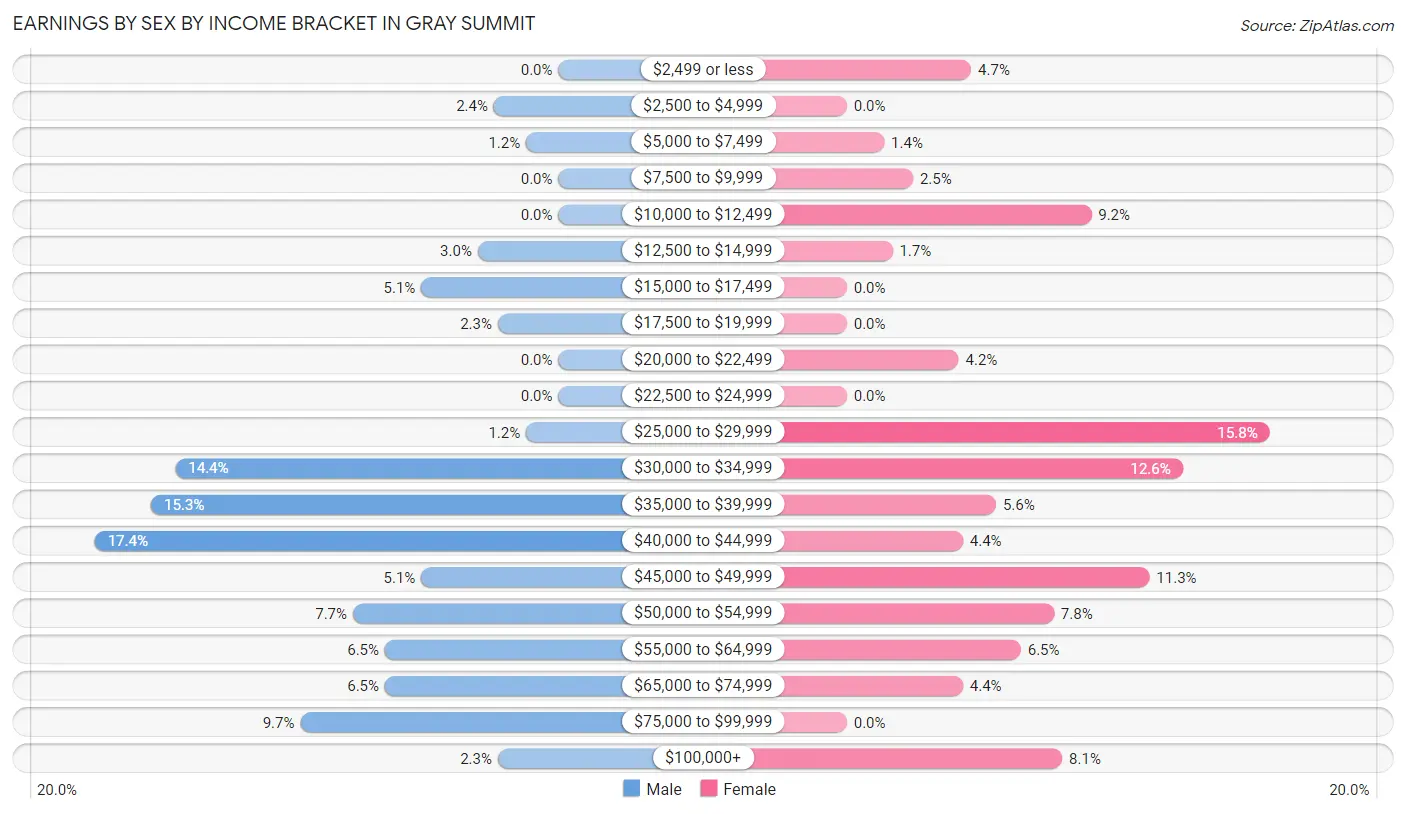
Earnings by Sex by Income Bracket in Gray Summit
The most common earnings brackets in Gray Summit are $40,000 to $44,999 for men (115 | 17.4%) and $25,000 to $29,999 for women (102 | 15.8%).
| Income | Male | Female |
| $2,499 or less | 0 (0.0%) | 30 (4.7%) |
| $2,500 to $4,999 | 16 (2.4%) | 0 (0.0%) |
| $5,000 to $7,499 | 8 (1.2%) | 9 (1.4%) |
| $7,500 to $9,999 | 0 (0.0%) | 16 (2.5%) |
| $10,000 to $12,499 | 0 (0.0%) | 59 (9.2%) |
| $12,500 to $14,999 | 20 (3.0%) | 11 (1.7%) |
| $15,000 to $17,499 | 34 (5.1%) | 0 (0.0%) |
| $17,500 to $19,999 | 15 (2.3%) | 0 (0.0%) |
| $20,000 to $22,499 | 0 (0.0%) | 27 (4.2%) |
| $22,500 to $24,999 | 0 (0.0%) | 0 (0.0%) |
| $25,000 to $29,999 | 8 (1.2%) | 102 (15.8%) |
| $30,000 to $34,999 | 95 (14.3%) | 81 (12.6%) |
| $35,000 to $39,999 | 101 (15.3%) | 36 (5.6%) |
| $40,000 to $44,999 | 115 (17.4%) | 28 (4.3%) |
| $45,000 to $49,999 | 34 (5.1%) | 73 (11.3%) |
| $50,000 to $54,999 | 51 (7.7%) | 50 (7.8%) |
| $55,000 to $64,999 | 43 (6.5%) | 42 (6.5%) |
| $65,000 to $74,999 | 43 (6.5%) | 28 (4.3%) |
| $75,000 to $99,999 | 64 (9.7%) | 0 (0.0%) |
| $100,000+ | 15 (2.3%) | 52 (8.1%) |
| Total | 662 (100.0%) | 644 (100.0%) |
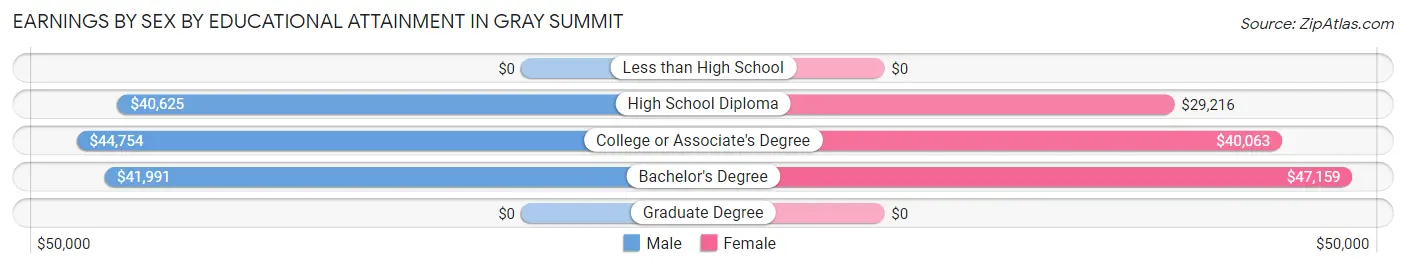
Earnings by Sex by Educational Attainment in Gray Summit
Average earnings in Gray Summit are $44,034 for men and $34,542 for women, a difference of 21.6%. Men with an educational attainment of college or associate's degree enjoy the highest average annual earnings of $44,754, while those with high school diploma education earn the least with $40,625. Women with an educational attainment of bachelor's degree earn the most with the average annual earnings of $47,159, while those with high school diploma education have the smallest earnings of $29,216.
| Educational Attainment | Male Income | Female Income |
| Less than High School | - | - |
| High School Diploma | $40,625 | $29,216 |
| College or Associate's Degree | $44,754 | $40,063 |
| Bachelor's Degree | $41,991 | $47,159 |
| Graduate Degree | - | - |
| Total | $44,034 | $34,542 |
Family Income in Gray Summit
Family Income Brackets in Gray Summit
According to the Gray Summit family income data, there are 162 families falling into the $75,000 to $99,999 income range, which is the most common income bracket and makes up 24.2% of all families. Conversely, the $10,000 to $14,999 income bracket is the least frequent group with only 7 families (1.1%) belonging to this category.
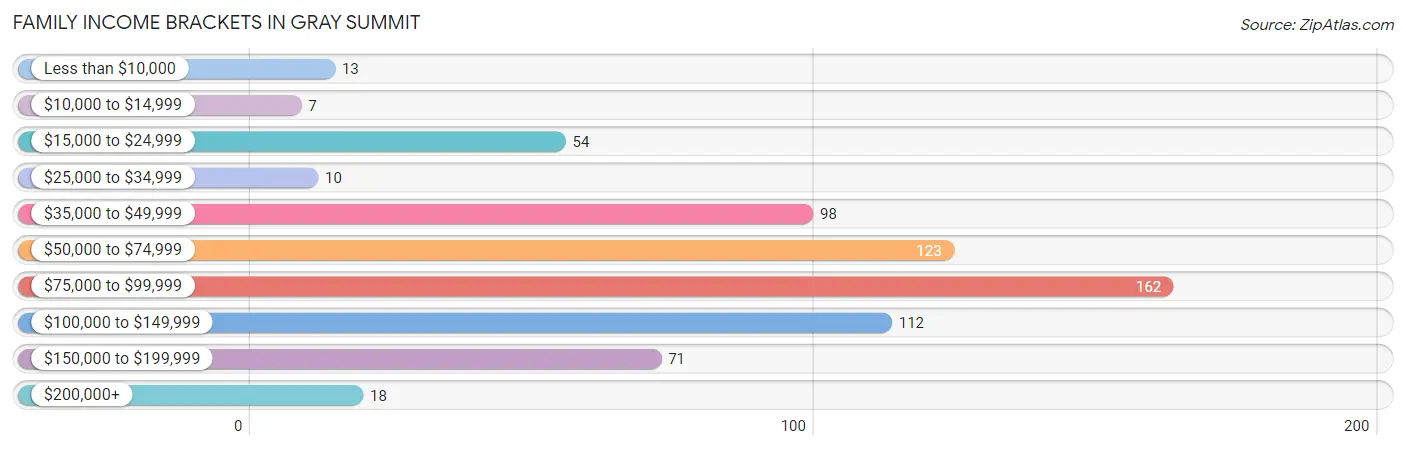
| Income Bracket | # Families | % Families |
| Less than $10,000 | 13 | 1.9% |
| $10,000 to $14,999 | 7 | 1.0% |
| $15,000 to $24,999 | 54 | 8.1% |
| $25,000 to $34,999 | 10 | 1.5% |
| $35,000 to $49,999 | 98 | 14.7% |
| $50,000 to $74,999 | 123 | 18.4% |
| $75,000 to $99,999 | 162 | 24.3% |
| $100,000 to $149,999 | 112 | 16.8% |
| $150,000 to $199,999 | 71 | 10.6% |
| $200,000+ | 18 | 2.7% |
Family Income by Famaliy Size in Gray Summit
4-person families (80 | 12.0%) account for the highest median family income in Gray Summit with $106,250 per family, while 2-person families (363 | 54.3%) have the highest median income of $46,466 per family member.
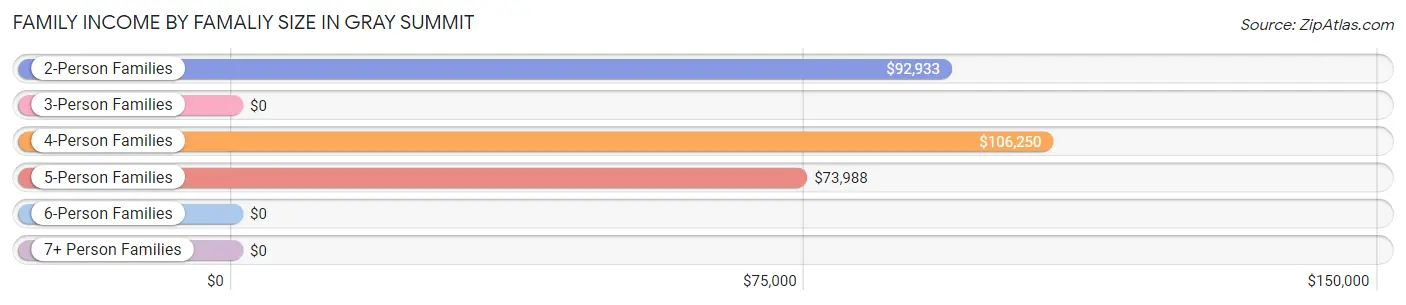
| Income Bracket | # Families | Median Income |
| 2-Person Families | 363 (54.3%) | $92,933 |
| 3-Person Families | 70 (10.5%) | $0 |
| 4-Person Families | 80 (12.0%) | $106,250 |
| 5-Person Families | 141 (21.1%) | $73,988 |
| 6-Person Families | 14 (2.1%) | $0 |
| 7+ Person Families | 0 (0.0%) | $0 |
| Total | 668 (100.0%) | $85,385 |
Family Income by Number of Earners in Gray Summit
The median family income in Gray Summit is $85,385, with families comprising 3+ earners (91) having the highest median family income of $98,862, while families with no earners (82) have the lowest median family income of $39,464, accounting for 13.6% and 12.3% of families, respectively.
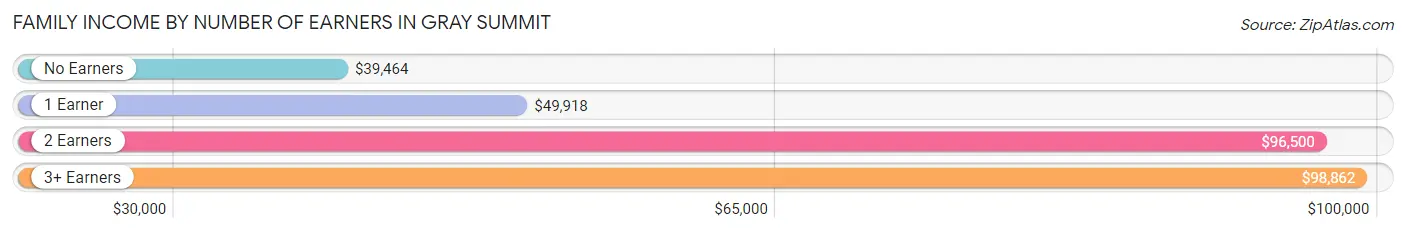
| Number of Earners | # Families | Median Income |
| No Earners | 82 (12.3%) | $39,464 |
| 1 Earner | 227 (34.0%) | $49,918 |
| 2 Earners | 268 (40.1%) | $96,500 |
| 3+ Earners | 91 (13.6%) | $98,862 |
| Total | 668 (100.0%) | $85,385 |
Household Income in Gray Summit
Household Income Brackets in Gray Summit
With 192 households falling in the category, the $75,000 to $99,999 income range is the most frequent in Gray Summit, accounting for 21.1% of all households. In contrast, only 13 households (1.4%) fall into the $10,000 to $14,999 income bracket, making it the least populous group.
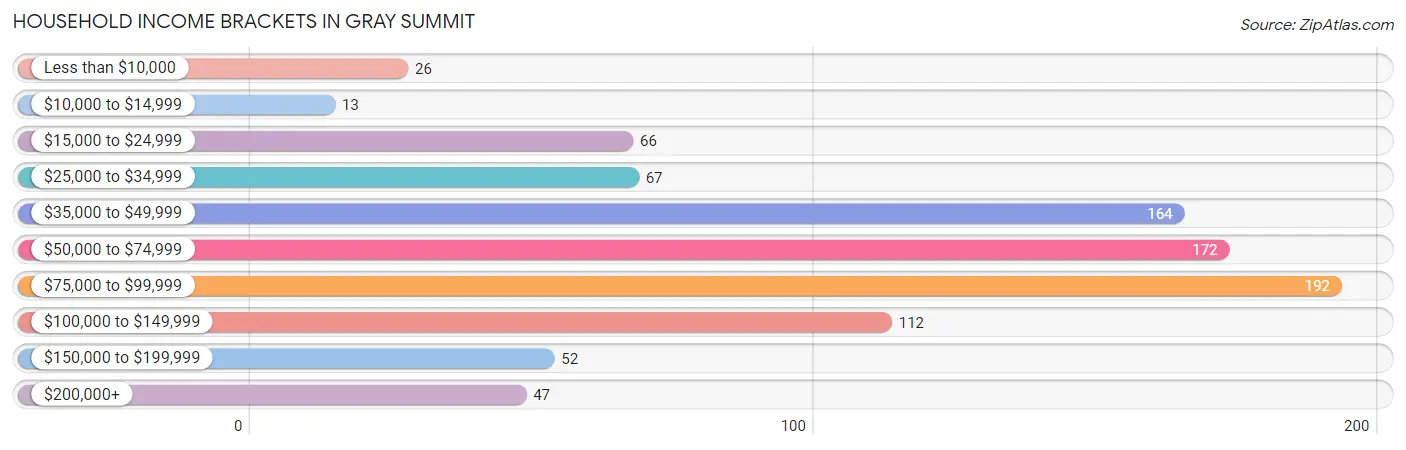
| Income Bracket | # Households | % Households |
| Less than $10,000 | 26 | 2.9% |
| $10,000 to $14,999 | 13 | 1.4% |
| $15,000 to $24,999 | 66 | 7.2% |
| $25,000 to $34,999 | 67 | 7.4% |
| $35,000 to $49,999 | 164 | 18.0% |
| $50,000 to $74,999 | 172 | 18.9% |
| $75,000 to $99,999 | 192 | 21.1% |
| $100,000 to $149,999 | 112 | 12.3% |
| $150,000 to $199,999 | 52 | 5.7% |
| $200,000+ | 47 | 5.2% |
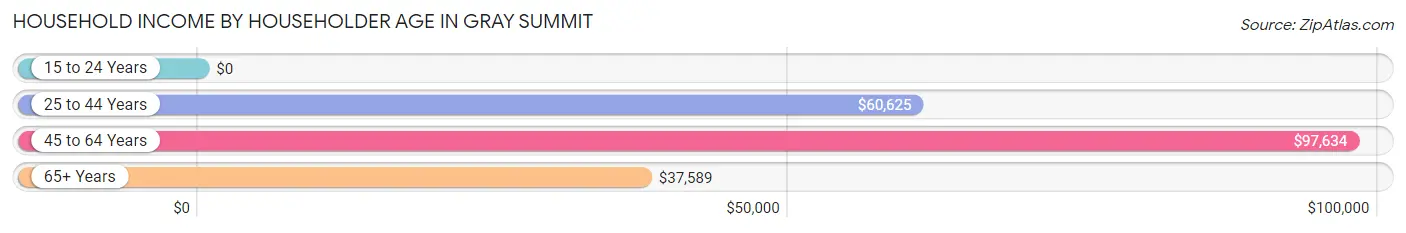
Household Income by Householder Age in Gray Summit
The median household income in Gray Summit is $68,272, with the highest median household income of $97,634 found in the 45 to 64 years age bracket for the primary householder. A total of 490 households (53.8%) fall into this category.
| Income Bracket | # Households | Median Income |
| 15 to 24 Years | 0 (0.0%) | $0 |
| 25 to 44 Years | 242 (26.6%) | $60,625 |
| 45 to 64 Years | 490 (53.8%) | $97,634 |
| 65+ Years | 179 (19.7%) | $37,589 |
| Total | 911 (100.0%) | $68,272 |
Poverty in Gray Summit
Income Below Poverty by Sex and Age in Gray Summit
With 13.2% poverty level for males and 17.8% for females among the residents of Gray Summit, 15 year old males and 6 to 11 year old females are the most vulnerable to poverty, with 14 males (33.3%) and 57 females (67.1%) in their respective age groups living below the poverty level.
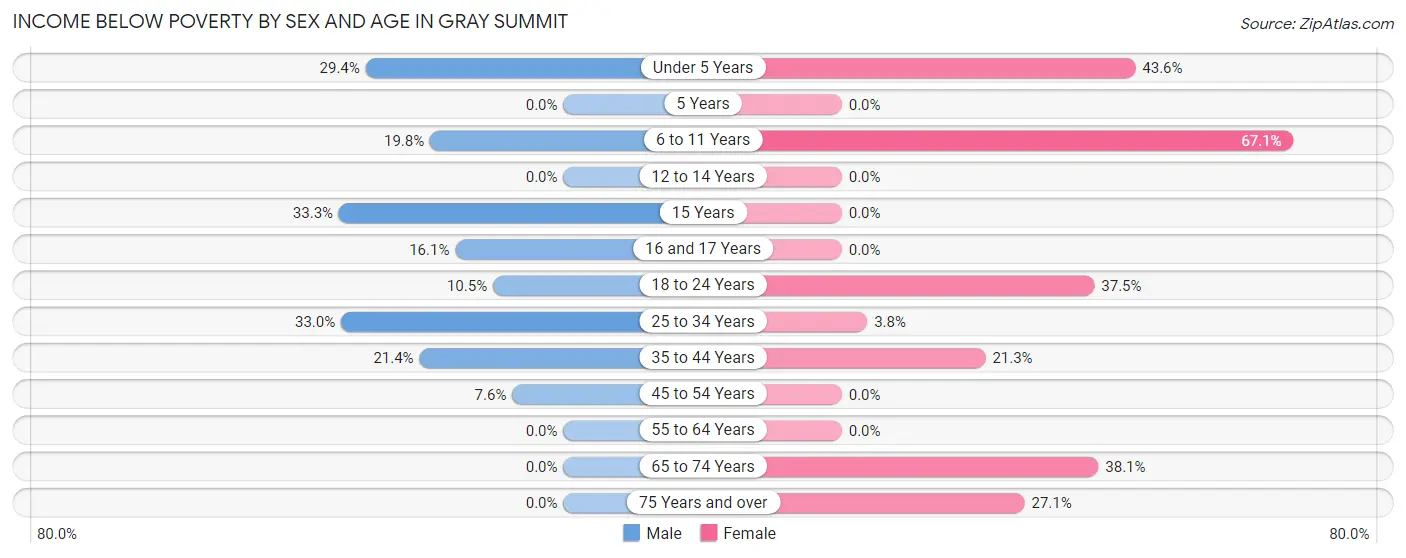
| Age Bracket | Male | Female |
| Under 5 Years | 32 (29.4%) | 34 (43.6%) |
| 5 Years | 0 (0.0%) | 0 (0.0%) |
| 6 to 11 Years | 37 (19.8%) | 57 (67.1%) |
| 12 to 14 Years | 0 (0.0%) | 0 (0.0%) |
| 15 Years | 14 (33.3%) | 0 (0.0%) |
| 16 and 17 Years | 13 (16.1%) | 0 (0.0%) |
| 18 to 24 Years | 14 (10.4%) | 9 (37.5%) |
| 25 to 34 Years | 34 (33.0%) | 7 (3.8%) |
| 35 to 44 Years | 28 (21.4%) | 32 (21.3%) |
| 45 to 54 Years | 17 (7.6%) | 0 (0.0%) |
| 55 to 64 Years | 0 (0.0%) | 0 (0.0%) |
| 65 to 74 Years | 0 (0.0%) | 32 (38.1%) |
| 75 Years and over | 0 (0.0%) | 19 (27.1%) |
| Total | 189 (13.2%) | 190 (17.8%) |
Income Above Poverty by Sex and Age in Gray Summit
According to the poverty statistics in Gray Summit, males aged 5 years and females aged 12 to 14 years are the age groups that are most secure financially, with 100.0% of males and 100.0% of females in these age groups living above the poverty line.
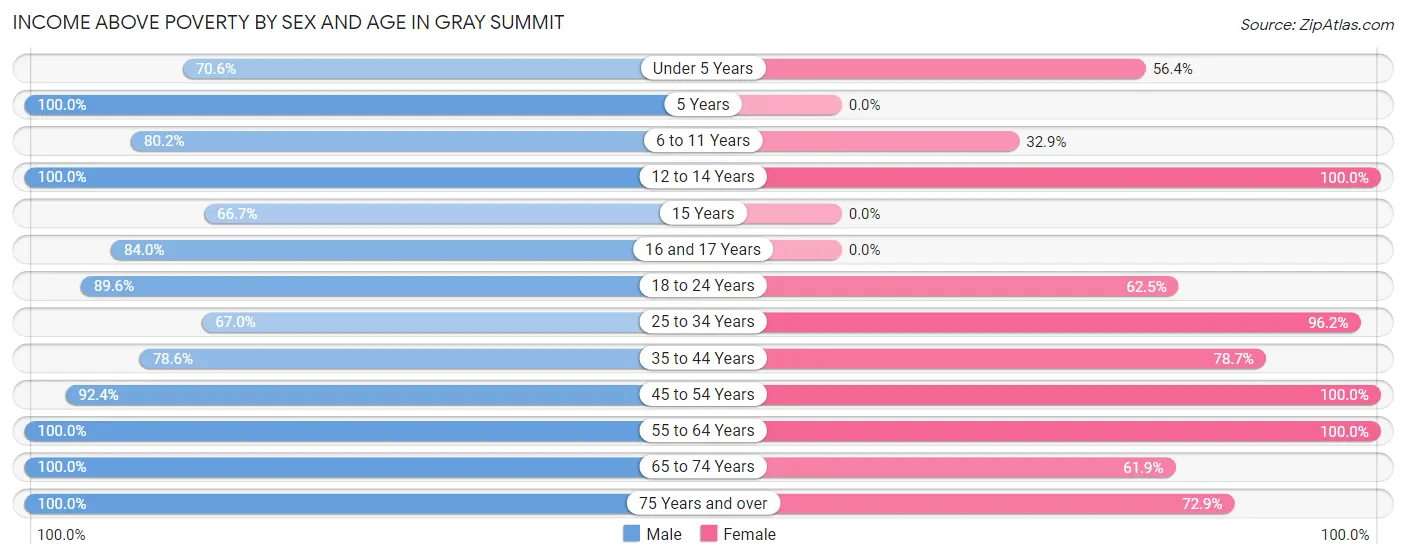
| Age Bracket | Male | Female |
| Under 5 Years | 77 (70.6%) | 44 (56.4%) |
| 5 Years | 55 (100.0%) | 0 (0.0%) |
| 6 to 11 Years | 150 (80.2%) | 28 (32.9%) |
| 12 to 14 Years | 58 (100.0%) | 19 (100.0%) |
| 15 Years | 28 (66.7%) | 0 (0.0%) |
| 16 and 17 Years | 68 (84.0%) | 0 (0.0%) |
| 18 to 24 Years | 120 (89.5%) | 15 (62.5%) |
| 25 to 34 Years | 69 (67.0%) | 178 (96.2%) |
| 35 to 44 Years | 103 (78.6%) | 118 (78.7%) |
| 45 to 54 Years | 207 (92.4%) | 213 (100.0%) |
| 55 to 64 Years | 129 (100.0%) | 162 (100.0%) |
| 65 to 74 Years | 129 (100.0%) | 52 (61.9%) |
| 75 Years and over | 48 (100.0%) | 51 (72.9%) |
| Total | 1,241 (86.8%) | 880 (82.2%) |
Income Below Poverty Among Married-Couple Families in Gray Summit
The poverty statistics for married-couple families in Gray Summit show that 4.7% or 20 of the total 424 families live below the poverty line. Families with 3 or 4 children have the highest poverty rate of 20.2%, comprising of 20 families. On the other hand, families with no children have the lowest poverty rate of 0.0%, which includes 0 families.
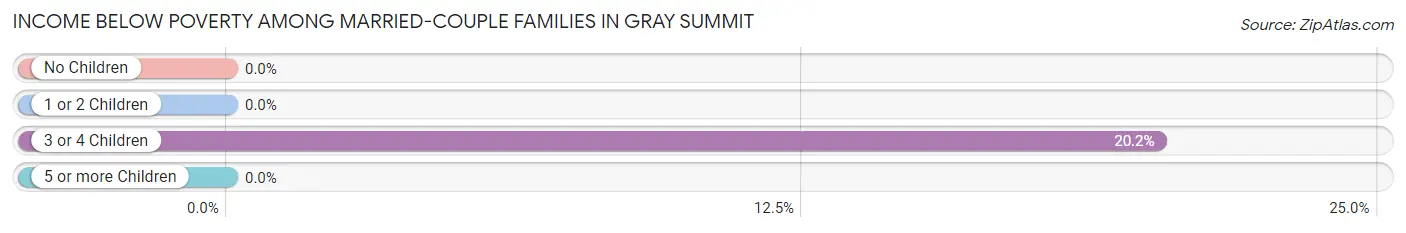
| Children | Above Poverty | Below Poverty |
| No Children | 216 (100.0%) | 0 (0.0%) |
| 1 or 2 Children | 109 (100.0%) | 0 (0.0%) |
| 3 or 4 Children | 79 (79.8%) | 20 (20.2%) |
| 5 or more Children | 0 (0.0%) | 0 (0.0%) |
| Total | 404 (95.3%) | 20 (4.7%) |
Income Below Poverty Among Single-Parent Households in Gray Summit
According to the poverty data in Gray Summit, 33.3% or 34 single-father households and 14.1% or 20 single-mother households are living below the poverty line. Among single-father households, those with 1 or 2 children have the highest poverty rate, with 34 households (80.9%) experiencing poverty. Likewise, among single-mother households, those with 1 or 2 children have the highest poverty rate, with 20 households (32.8%) falling below the poverty line.
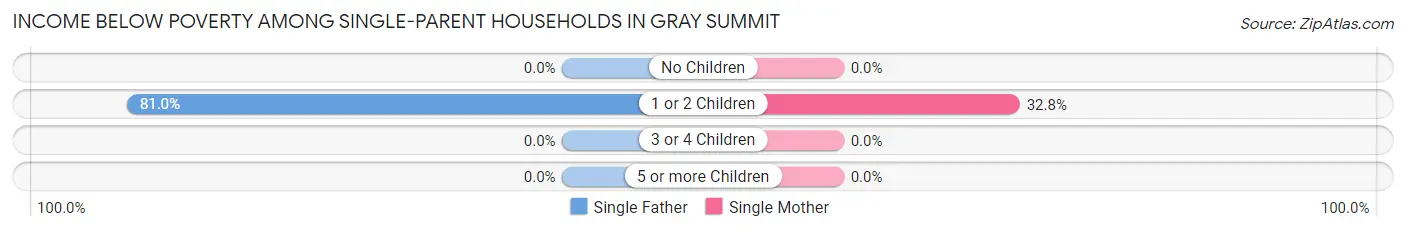
| Children | Single Father | Single Mother |
| No Children | 0 (0.0%) | 0 (0.0%) |
| 1 or 2 Children | 34 (80.9%) | 20 (32.8%) |
| 3 or 4 Children | 0 (0.0%) | 0 (0.0%) |
| 5 or more Children | 0 (0.0%) | 0 (0.0%) |
| Total | 34 (33.3%) | 20 (14.1%) |
Income Below Poverty Among Married-Couple vs Single-Parent Households in Gray Summit
The poverty data for Gray Summit shows that 20 of the married-couple family households (4.7%) and 54 of the single-parent households (22.1%) are living below the poverty level. Within the married-couple family households, those with 3 or 4 children have the highest poverty rate, with 20 households (20.2%) falling below the poverty line. Among the single-parent households, those with 1 or 2 children have the highest poverty rate, with 54 household (52.4%) living below poverty.
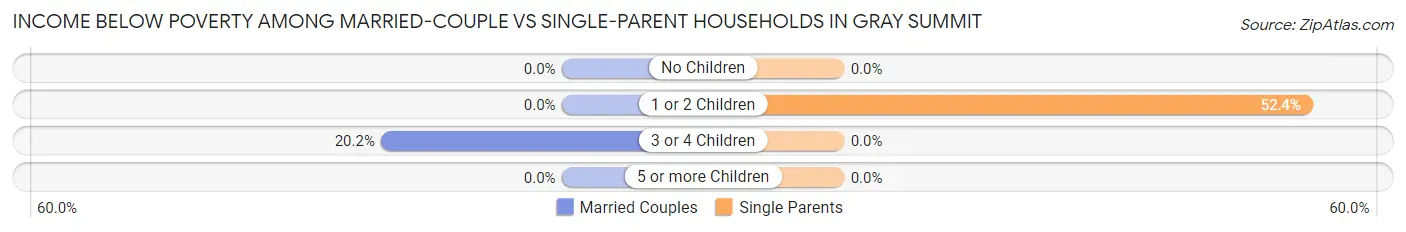
| Children | Married-Couple Families | Single-Parent Households |
| No Children | 0 (0.0%) | 0 (0.0%) |
| 1 or 2 Children | 0 (0.0%) | 54 (52.4%) |
| 3 or 4 Children | 20 (20.2%) | 0 (0.0%) |
| 5 or more Children | 0 (0.0%) | 0 (0.0%) |
| Total | 20 (4.7%) | 54 (22.1%) |
Race in Gray Summit
The most populous races in Gray Summit are White / Caucasian (2,255 | 87.6%), Two or more Races (238 | 9.2%), and Black / African American (80 | 3.1%).
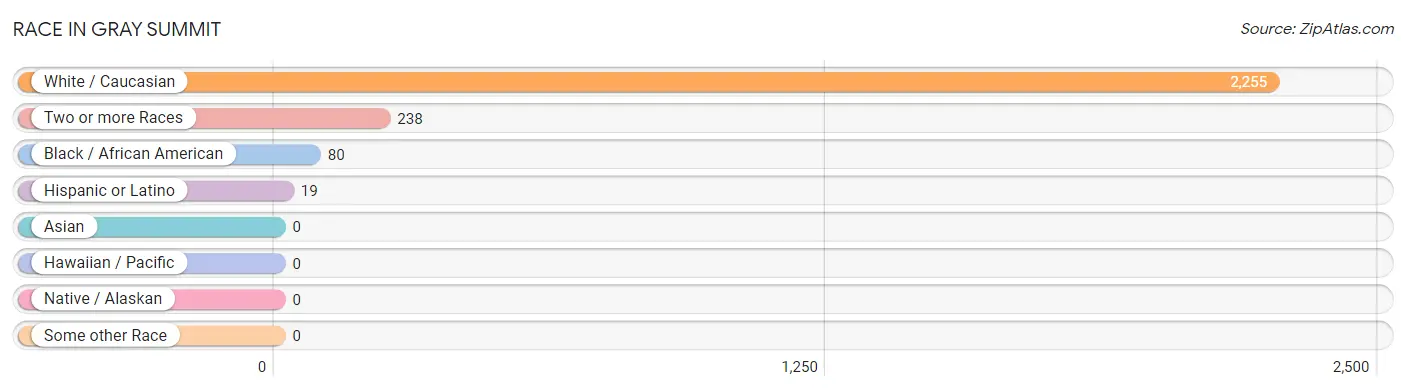
| Race | # Population | % Population |
| Asian | 0 | 0.0% |
| Black / African American | 80 | 3.1% |
| Hawaiian / Pacific | 0 | 0.0% |
| Hispanic or Latino | 19 | 0.7% |
| Native / Alaskan | 0 | 0.0% |
| White / Caucasian | 2,255 | 87.6% |
| Two or more Races | 238 | 9.2% |
| Some other Race | 0 | 0.0% |
| Total | 2,573 | 100.0% |
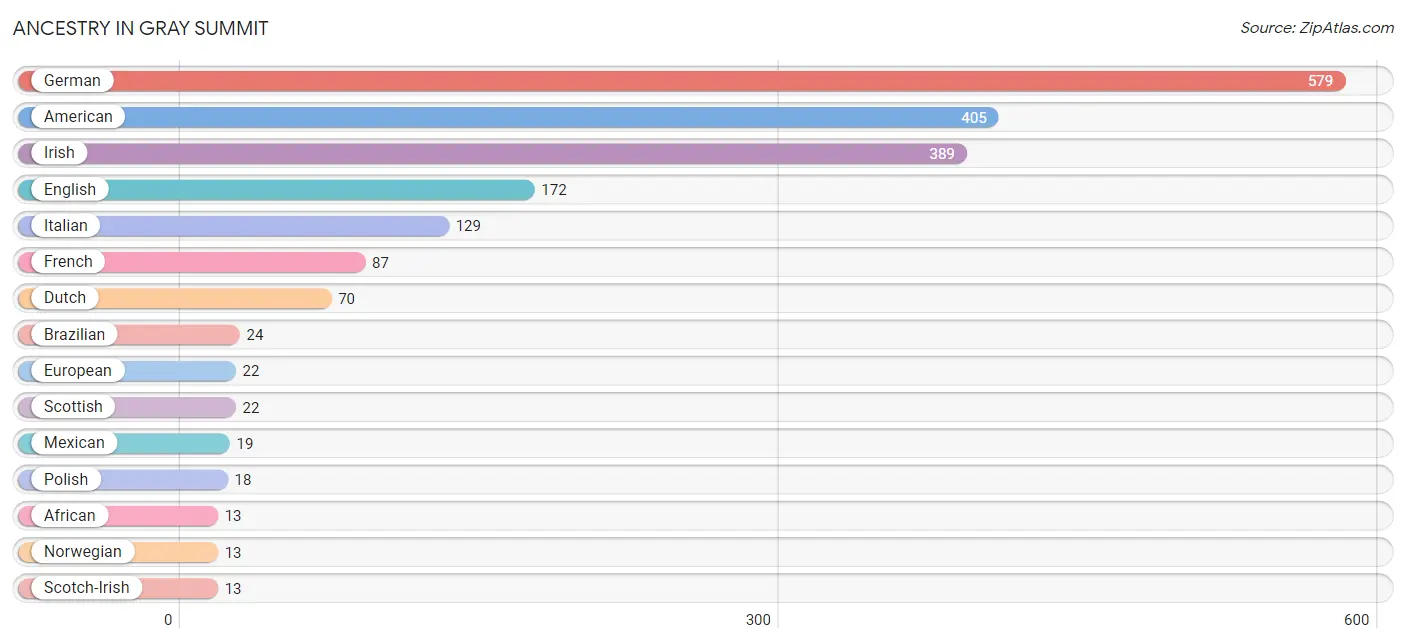
Ancestry in Gray Summit
The most populous ancestries reported in Gray Summit are German (579 | 22.5%), American (405 | 15.7%), Irish (389 | 15.1%), English (172 | 6.7%), and Italian (129 | 5.0%), together accounting for 65.1% of all Gray Summit residents.
| Ancestry | # Population | % Population |
| African | 13 | 0.5% |
| American | 405 | 15.7% |
| Brazilian | 24 | 0.9% |
| Celtic | 3 | 0.1% |
| Cherokee | 3 | 0.1% |
| Creek | 3 | 0.1% |
| Dutch | 70 | 2.7% |
| Eastern European | 8 | 0.3% |
| English | 172 | 6.7% |
| European | 22 | 0.9% |
| French | 87 | 3.4% |
| French Canadian | 8 | 0.3% |
| German | 579 | 22.5% |
| Irish | 389 | 15.1% |
| Italian | 129 | 5.0% |
| Mexican | 19 | 0.7% |
| Norwegian | 13 | 0.5% |
| Osage | 2 | 0.1% |
| Polish | 18 | 0.7% |
| Scandinavian | 11 | 0.4% |
| Scotch-Irish | 13 | 0.5% |
| Scottish | 22 | 0.9% |
| Subsaharan African | 13 | 0.5% |
| Swedish | 13 | 0.5% |
| Welsh | 6 | 0.2% | View All 25 Rows |
Immigrants in Gray Summit
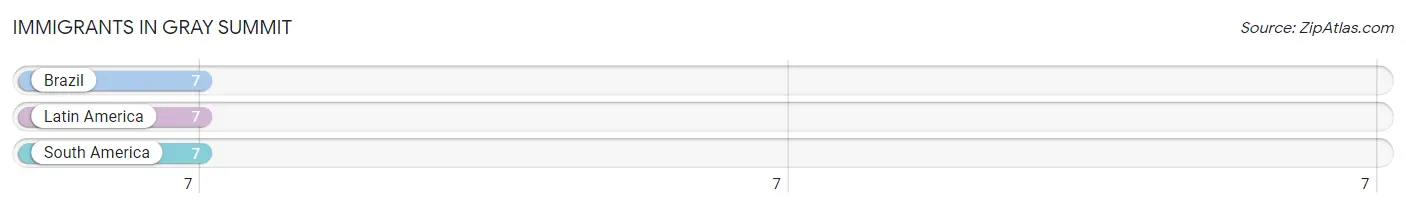
The most numerous immigrant groups reported in Gray Summit came from Brazil (7 | 0.3%), Latin America (7 | 0.3%), and South America (7 | 0.3%), together accounting for 0.8% of all Gray Summit residents.
| Immigration Origin | # Population | % Population |
| Brazil | 7 | 0.3% |
| Latin America | 7 | 0.3% |
| South America | 7 | 0.3% | View All 3 Rows |
Sex and Age in Gray Summit
Sex and Age in Gray Summit
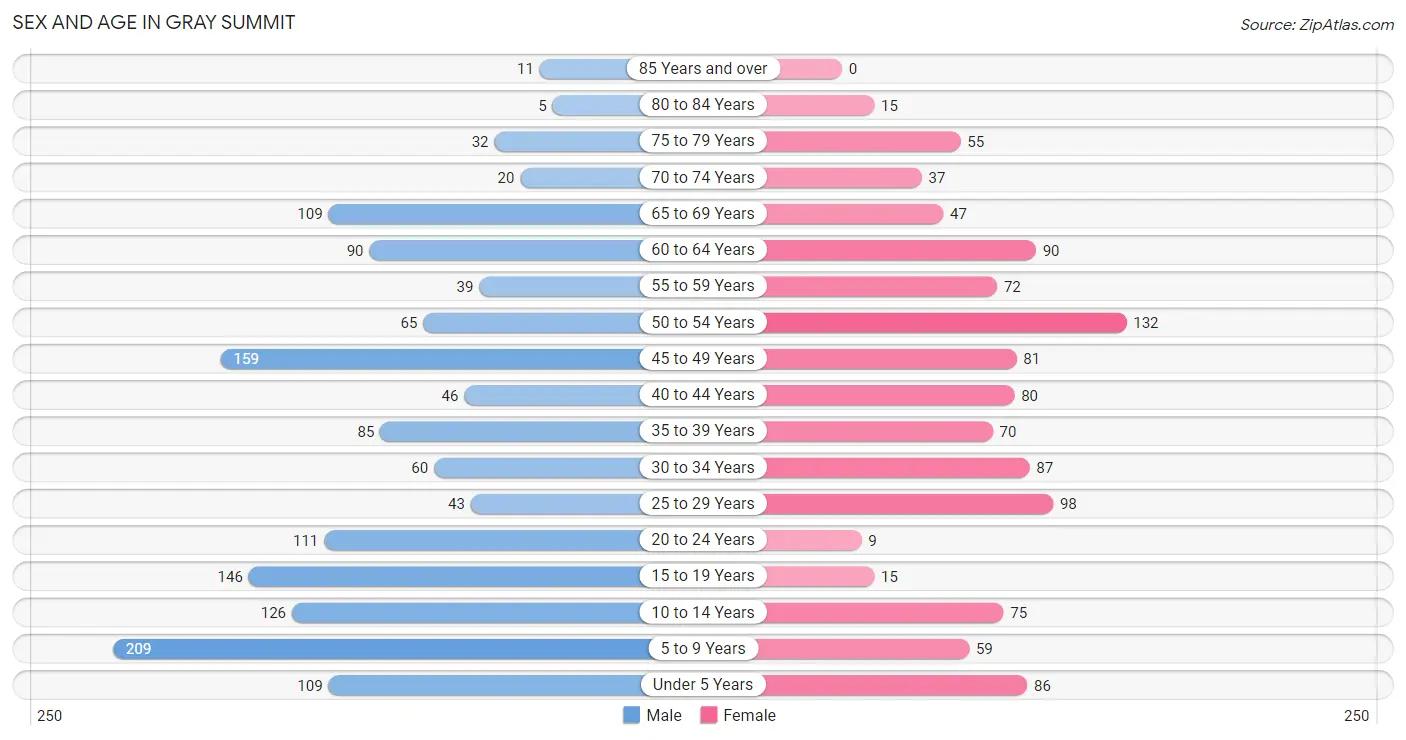
The most populous age groups in Gray Summit are 5 to 9 Years (209 | 14.3%) for men and 50 to 54 Years (132 | 11.9%) for women.
| Age Bracket | Male | Female |
| Under 5 Years | 109 (7.4%) | 86 (7.8%) |
| 5 to 9 Years | 209 (14.3%) | 59 (5.3%) |
| 10 to 14 Years | 126 (8.6%) | 75 (6.8%) |
| 15 to 19 Years | 146 (10.0%) | 15 (1.3%) |
| 20 to 24 Years | 111 (7.6%) | 9 (0.8%) |
| 25 to 29 Years | 43 (2.9%) | 98 (8.8%) |
| 30 to 34 Years | 60 (4.1%) | 87 (7.9%) |
| 35 to 39 Years | 85 (5.8%) | 70 (6.3%) |
| 40 to 44 Years | 46 (3.1%) | 80 (7.2%) |
| 45 to 49 Years | 159 (10.8%) | 81 (7.3%) |
| 50 to 54 Years | 65 (4.4%) | 132 (11.9%) |
| 55 to 59 Years | 39 (2.7%) | 72 (6.5%) |
| 60 to 64 Years | 90 (6.1%) | 90 (8.1%) |
| 65 to 69 Years | 109 (7.4%) | 47 (4.2%) |
| 70 to 74 Years | 20 (1.4%) | 37 (3.3%) |
| 75 to 79 Years | 32 (2.2%) | 55 (5.0%) |
| 80 to 84 Years | 5 (0.3%) | 15 (1.3%) |
| 85 Years and over | 11 (0.7%) | 0 (0.0%) |
| Total | 1,465 (100.0%) | 1,108 (100.0%) |
Families and Households in Gray Summit
Median Family Size in Gray Summit
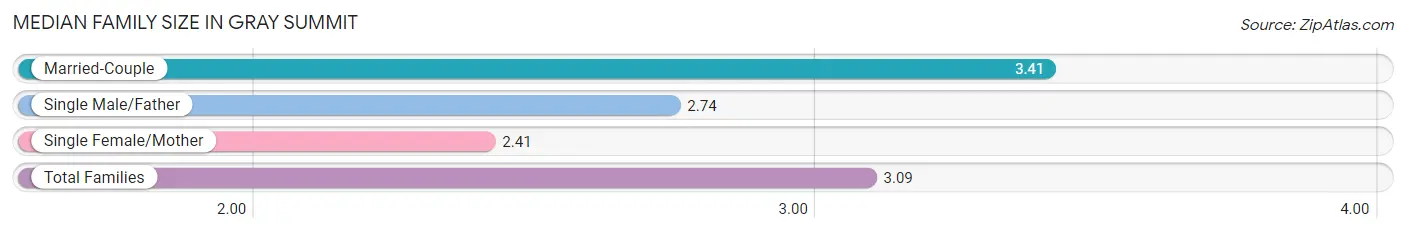
The median family size in Gray Summit is 3.09 persons per family, with married-couple families (424 | 63.5%) accounting for the largest median family size of 3.41 persons per family. On the other hand, single female/mother families (142 | 21.3%) represent the smallest median family size with 2.41 persons per family.
| Family Type | # Families | Family Size |
| Married-Couple | 424 (63.5%) | 3.41 |
| Single Male/Father | 102 (15.3%) | 2.74 |
| Single Female/Mother | 142 (21.3%) | 2.41 |
| Total Families | 668 (100.0%) | 3.09 |
Median Household Size in Gray Summit
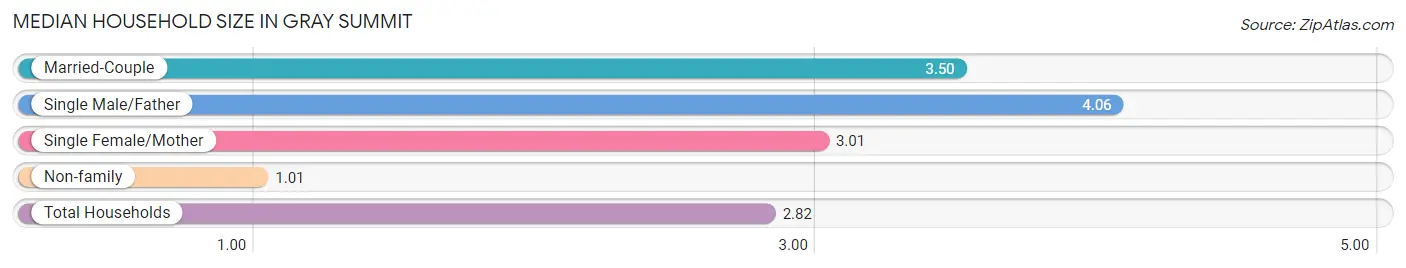
The median household size in Gray Summit is 2.82 persons per household, with single male/father households (102 | 11.2%) accounting for the largest median household size of 4.06 persons per household. non-family households (243 | 26.7%) represent the smallest median household size with 1.01 persons per household.
| Household Type | # Households | Household Size |
| Married-Couple | 424 (46.5%) | 3.50 |
| Single Male/Father | 102 (11.2%) | 4.06 |
| Single Female/Mother | 142 (15.6%) | 3.01 |
| Non-family | 243 (26.7%) | 1.01 |
| Total Households | 911 (100.0%) | 2.82 |
Household Size by Marriage Status in Gray Summit
Out of a total of 911 households in Gray Summit, 668 (73.3%) are family households, while 243 (26.7%) are nonfamily households. The most numerous type of family households are 2-person households, comprising 281, and the most common type of nonfamily households are 1-person households, comprising 240.
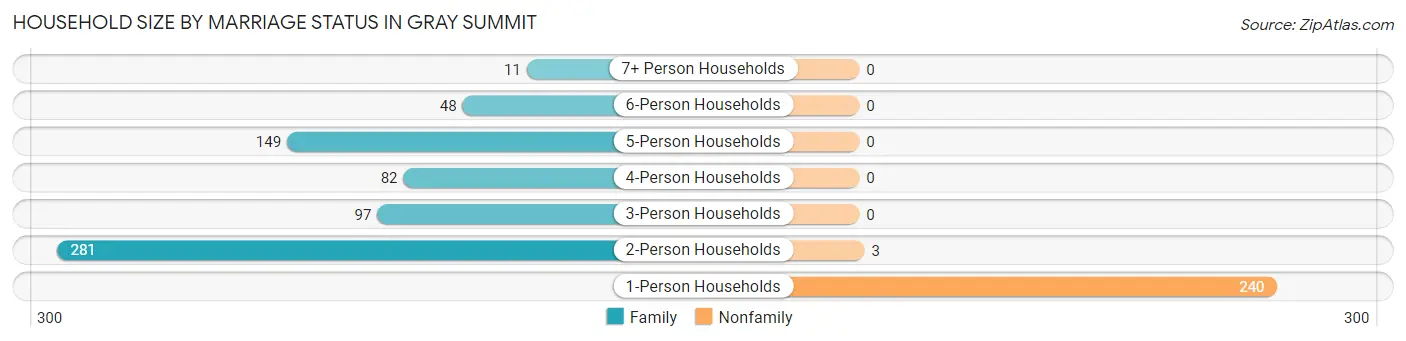
| Household Size | Family Households | Nonfamily Households |
| 1-Person Households | - | 240 (26.3%) |
| 2-Person Households | 281 (30.8%) | 3 (0.3%) |
| 3-Person Households | 97 (10.6%) | 0 (0.0%) |
| 4-Person Households | 82 (9.0%) | 0 (0.0%) |
| 5-Person Households | 149 (16.4%) | 0 (0.0%) |
| 6-Person Households | 48 (5.3%) | 0 (0.0%) |
| 7+ Person Households | 11 (1.2%) | 0 (0.0%) |
| Total | 668 (73.3%) | 243 (26.7%) |
Female Fertility in Gray Summit
Fertility by Age in Gray Summit
Average fertility rate in Gray Summit is 71.0 births per 1,000 women. Women in the age bracket of 20 to 34 years have the highest fertility rate with 180.0 births per 1,000 women. Women in the age bracket of 20 to 34 years acount for 100.0% of all women with births.
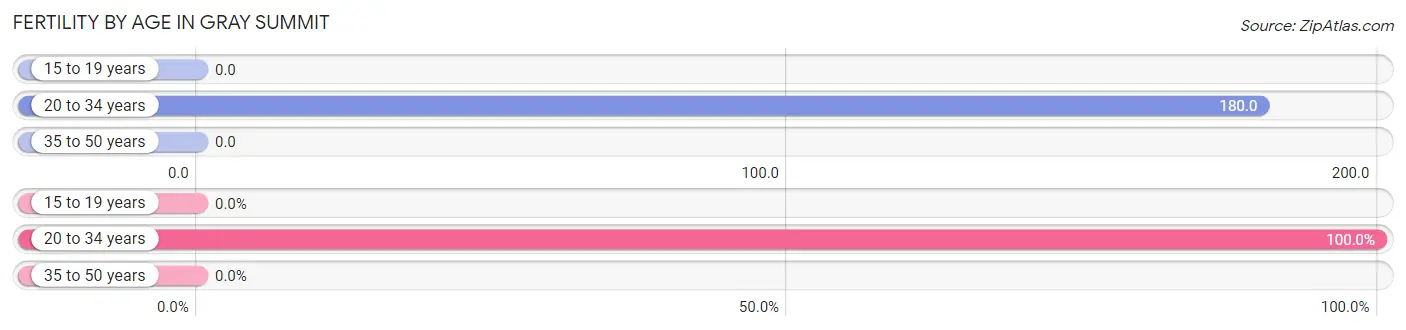
| Age Bracket | Women with Births | Births / 1,000 Women |
| 15 to 19 years | 0 (0.0%) | 0.0 |
| 20 to 34 years | 35 (100.0%) | 180.0 |
| 35 to 50 years | 0 (0.0%) | 0.0 |
| Total | 35 (100.0%) | 71.0 |
Fertility by Age by Marriage Status in Gray Summit
51.4% of women with births (35) in Gray Summit are married. The highest percentage of unmarried women with births falls into 20 to 34 years age bracket with 48.6% of them unmarried at the time of birth, while the lowest percentage of unmarried women with births belong to 20 to 34 years age bracket with 48.6% of them unmarried.
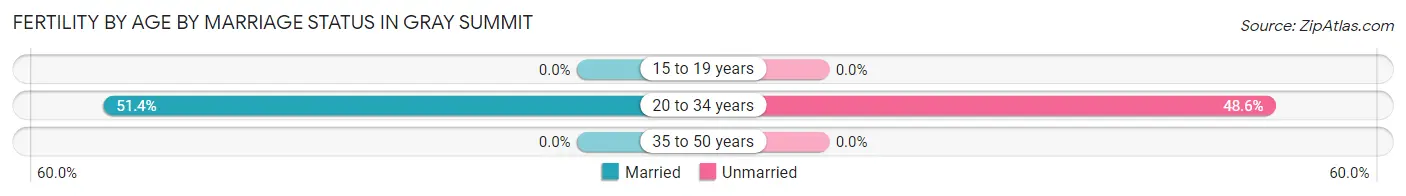
| Age Bracket | Married | Unmarried |
| 15 to 19 years | 0 (0.0%) | 0 (0.0%) |
| 20 to 34 years | 18 (51.4%) | 17 (48.6%) |
| 35 to 50 years | 0 (0.0%) | 0 (0.0%) |
| Total | 18 (51.4%) | 17 (48.6%) |
Fertility by Education in Gray Summit
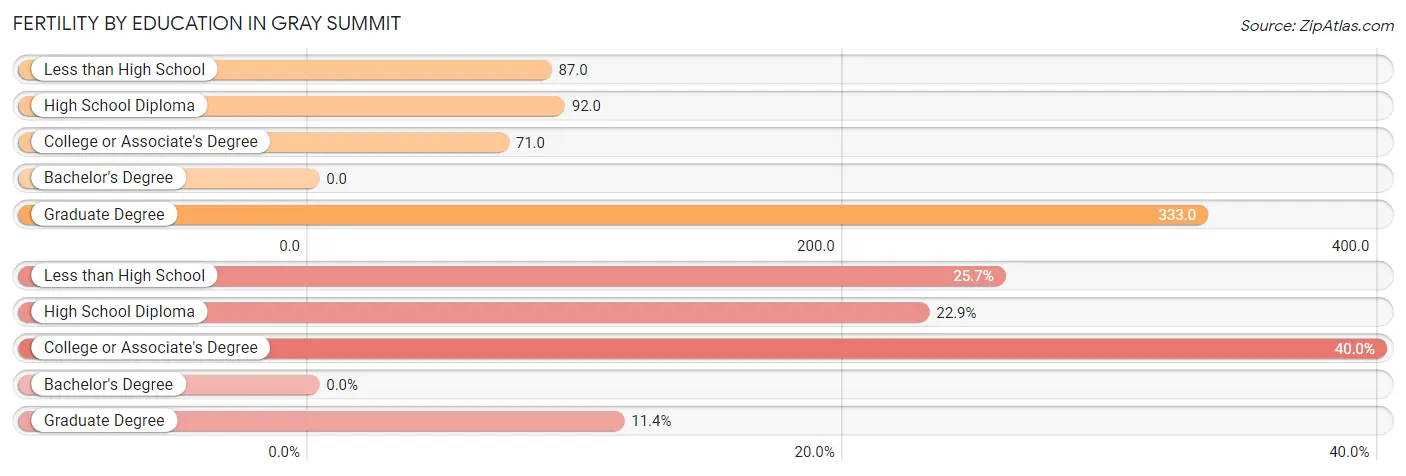
| Educational Attainment | Women with Births | Births / 1,000 Women |
| Less than High School | 9 (25.7%) | 87.0 |
| High School Diploma | 8 (22.9%) | 92.0 |
| College or Associate's Degree | 14 (40.0%) | 71.0 |
| Bachelor's Degree | 0 (0.0%) | 0.0 |
| Graduate Degree | 4 (11.4%) | 333.0 |
| Total | 35 (100.0%) | 71.0 |
Fertility by Education by Marriage Status in Gray Summit
48.6% of women with births in Gray Summit are unmarried. Women with the educational attainment of college or associate's degree are most likely to be married with 100.0% of them married at childbirth, while women with the educational attainment of less than high school are least likely to be married with 100.0% of them unmarried at childbirth.
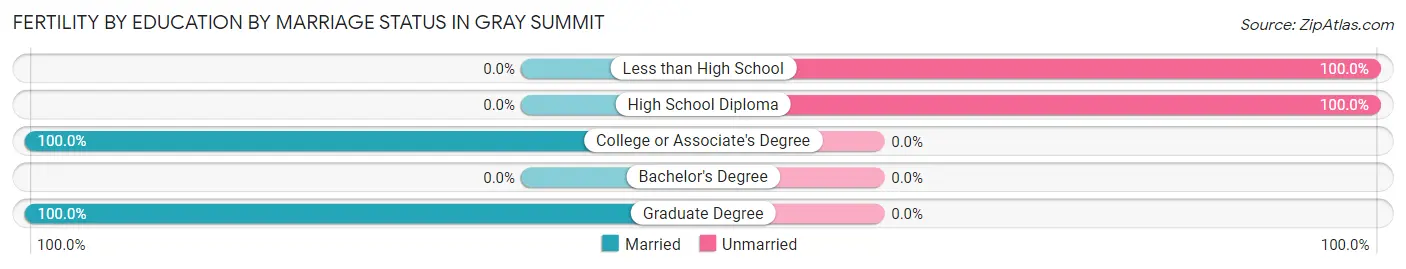
| Educational Attainment | Married | Unmarried |
| Less than High School | 0 (0.0%) | 9 (100.0%) |
| High School Diploma | 0 (0.0%) | 8 (100.0%) |
| College or Associate's Degree | 14 (100.0%) | 0 (0.0%) |
| Bachelor's Degree | 0 (0.0%) | 0 (0.0%) |
| Graduate Degree | 4 (100.0%) | 0 (0.0%) |
| Total | 18 (51.4%) | 17 (48.6%) |
Employment Characteristics in Gray Summit
Employment by Class of Employer in Gray Summit
Among the 1,140 employed individuals in Gray Summit, private company employees (875 | 76.7%), local government employees (83 | 7.3%), and self-employed (not incorporated) (63 | 5.5%) make up the most common classes of employment.
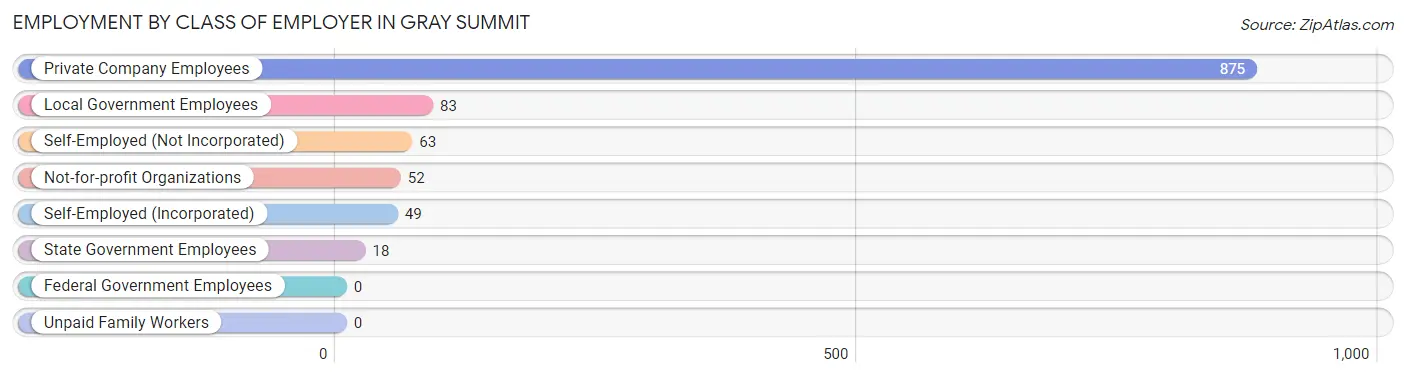
| Employer Class | # Employees | % Employees |
| Private Company Employees | 875 | 76.7% |
| Self-Employed (Incorporated) | 49 | 4.3% |
| Self-Employed (Not Incorporated) | 63 | 5.5% |
| Not-for-profit Organizations | 52 | 4.6% |
| Local Government Employees | 83 | 7.3% |
| State Government Employees | 18 | 1.6% |
| Federal Government Employees | 0 | 0.0% |
| Unpaid Family Workers | 0 | 0.0% |
| Total | 1,140 | 100.0% |
Employment Status by Age in Gray Summit
According to the labor force statistics for Gray Summit, out of the total population over 16 years of age (1,867), 65.8% or 1,228 individuals are in the labor force, with 2.5% or 31 of them unemployed. The age group with the highest labor force participation rate is 25 to 29 years, with 89.4% or 126 individuals in the labor force. Within the labor force, the 16 to 19 years age range has the highest percentage of unemployed individuals, with 100.0% or 15 of them being unemployed.
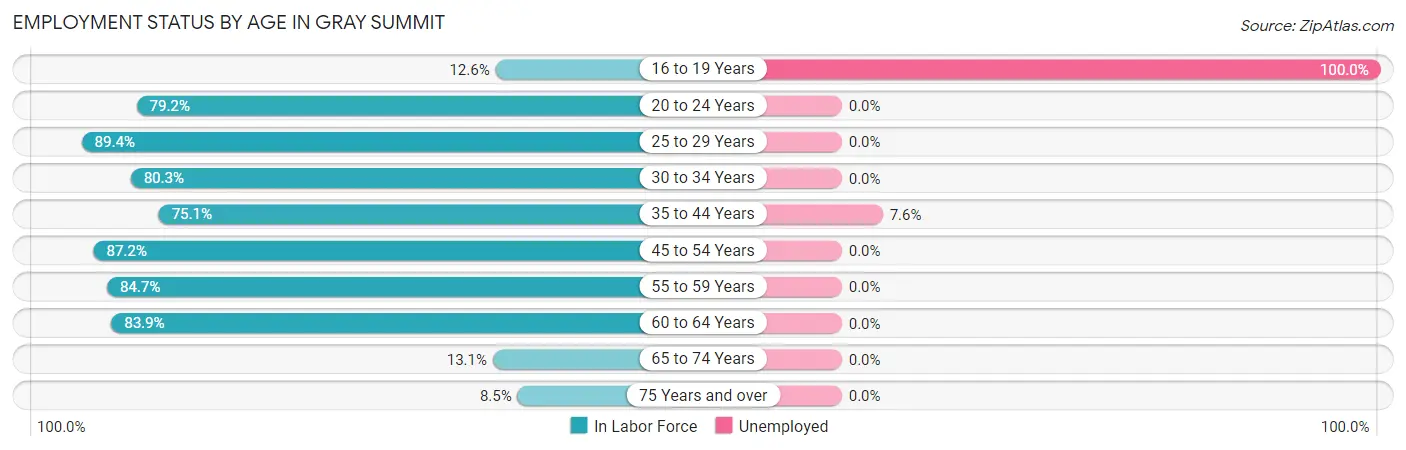
| Age Bracket | In Labor Force | Unemployed |
| 16 to 19 Years | 15 (12.6%) | 15 (100.0%) |
| 20 to 24 Years | 95 (79.2%) | 0 (0.0%) |
| 25 to 29 Years | 126 (89.4%) | 0 (0.0%) |
| 30 to 34 Years | 118 (80.3%) | 0 (0.0%) |
| 35 to 44 Years | 211 (75.1%) | 16 (7.6%) |
| 45 to 54 Years | 381 (87.2%) | 0 (0.0%) |
| 55 to 59 Years | 94 (84.7%) | 0 (0.0%) |
| 60 to 64 Years | 151 (83.9%) | 0 (0.0%) |
| 65 to 74 Years | 28 (13.1%) | 0 (0.0%) |
| 75 Years and over | 10 (8.5%) | 0 (0.0%) |
| Total | 1,228 (65.8%) | 31 (2.5%) |
Employment Status by Educational Attainment in Gray Summit
According to labor force statistics for Gray Summit, 83.3% of individuals (1,080) out of the total population between 25 and 64 years of age (1,297) are in the labor force, with 1.5% or 16 of them being unemployed. The group with the highest labor force participation rate are those with the educational attainment of high school diploma, with 91.2% or 332 individuals in the labor force. Within the labor force, individuals with less than high school education have the highest percentage of unemployment, with 12.0% or 16 of them being unemployed.
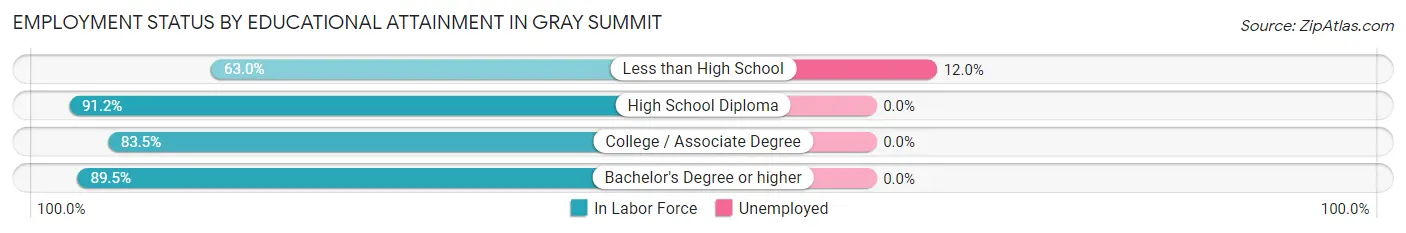
| Educational Attainment | In Labor Force | Unemployed |
| Less than High School | 133 (63.0%) | 25 (12.0%) |
| High School Diploma | 332 (91.2%) | 0 (0.0%) |
| College / Associate Degree | 420 (83.5%) | 0 (0.0%) |
| Bachelor's Degree or higher | 196 (89.5%) | 0 (0.0%) |
| Total | 1,080 (83.3%) | 19 (1.5%) |
Employment Occupations by Sex in Gray Summit
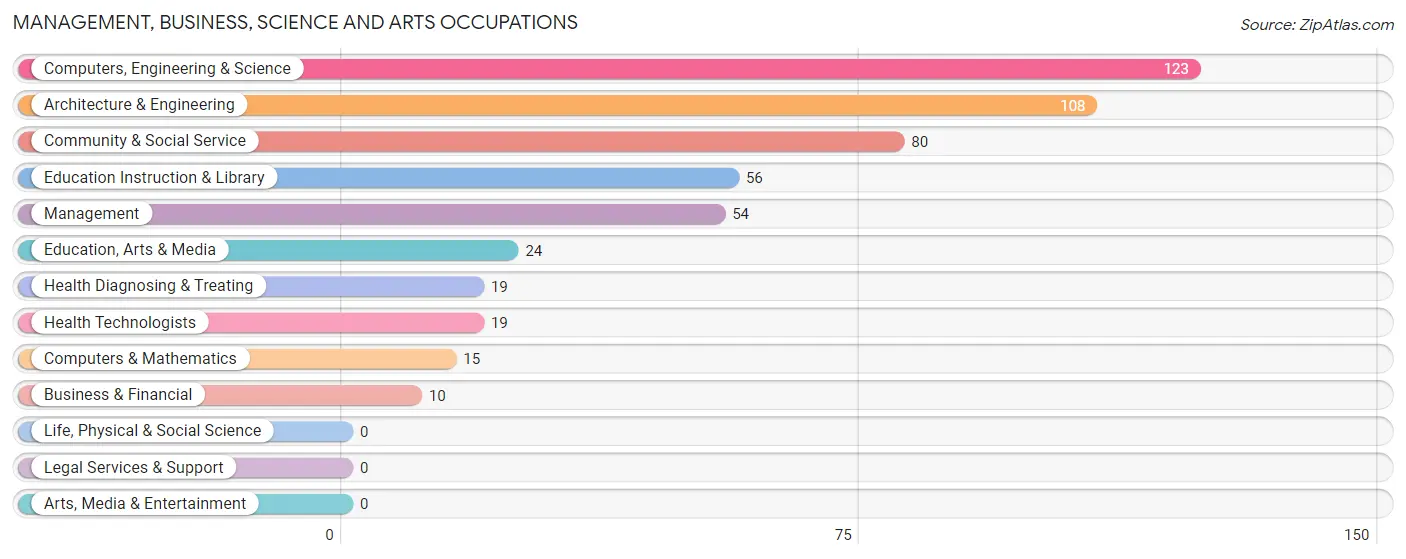
Management, Business, Science and Arts Occupations
The most common Management, Business, Science and Arts occupations in Gray Summit are Computers, Engineering & Science (123 | 10.3%), Architecture & Engineering (108 | 9.0%), Community & Social Service (80 | 6.7%), Education Instruction & Library (56 | 4.7%), and Management (54 | 4.5%).
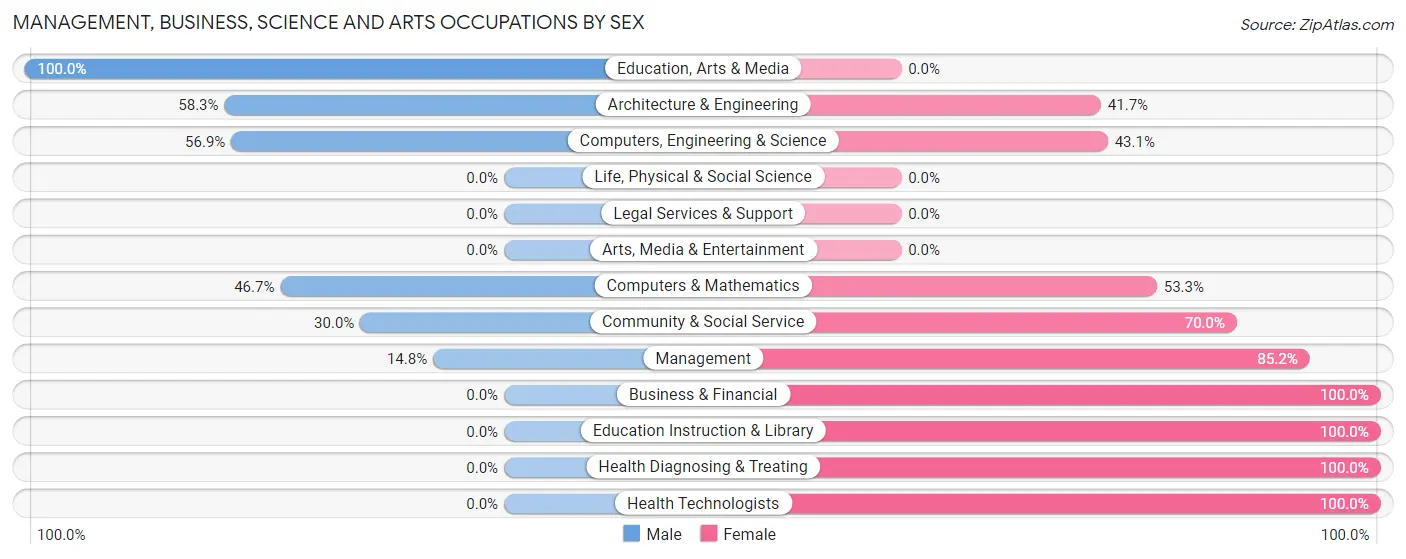
Management, Business, Science and Arts Occupations by Sex
Within the Management, Business, Science and Arts occupations in Gray Summit, the most male-oriented occupations are Education, Arts & Media (100.0%), Architecture & Engineering (58.3%), and Computers, Engineering & Science (56.9%), while the most female-oriented occupations are Business & Financial (100.0%), Education Instruction & Library (100.0%), and Health Diagnosing & Treating (100.0%).
| Occupation | Male | Female |
| Management | 8 (14.8%) | 46 (85.2%) |
| Business & Financial | 0 (0.0%) | 10 (100.0%) |
| Computers, Engineering & Science | 70 (56.9%) | 53 (43.1%) |
| Computers & Mathematics | 7 (46.7%) | 8 (53.3%) |
| Architecture & Engineering | 63 (58.3%) | 45 (41.7%) |
| Life, Physical & Social Science | 0 (0.0%) | 0 (0.0%) |
| Community & Social Service | 24 (30.0%) | 56 (70.0%) |
| Education, Arts & Media | 24 (100.0%) | 0 (0.0%) |
| Legal Services & Support | 0 (0.0%) | 0 (0.0%) |
| Education Instruction & Library | 0 (0.0%) | 56 (100.0%) |
| Arts, Media & Entertainment | 0 (0.0%) | 0 (0.0%) |
| Health Diagnosing & Treating | 0 (0.0%) | 19 (100.0%) |
| Health Technologists | 0 (0.0%) | 19 (100.0%) |
| Total (Category) | 102 (35.7%) | 184 (64.3%) |
| Total (Overall) | 618 (51.6%) | 580 (48.4%) |
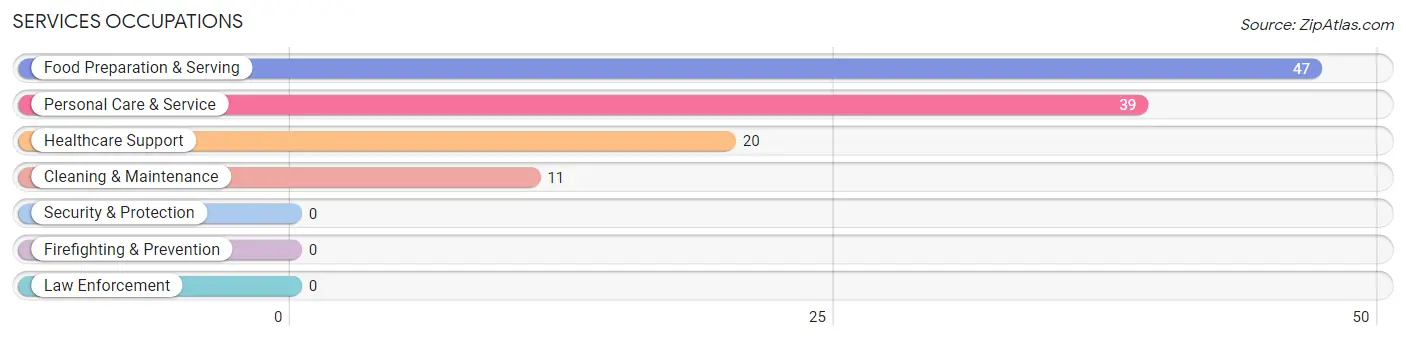
Services Occupations
The most common Services occupations in Gray Summit are Food Preparation & Serving (47 | 3.9%), Personal Care & Service (39 | 3.3%), Healthcare Support (20 | 1.7%), and Cleaning & Maintenance (11 | 0.9%).
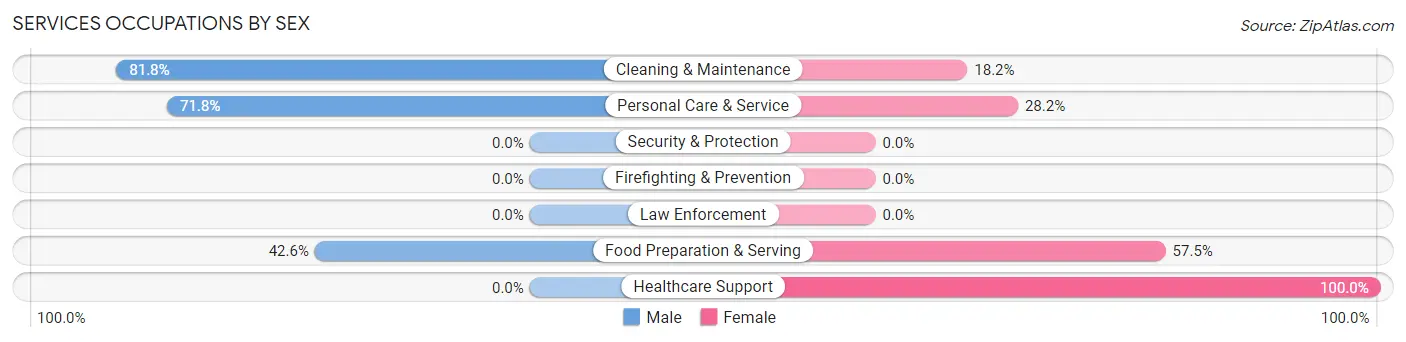
Services Occupations by Sex
Within the Services occupations in Gray Summit, the most male-oriented occupations are Cleaning & Maintenance (81.8%), Personal Care & Service (71.8%), and Food Preparation & Serving (42.5%), while the most female-oriented occupations are Healthcare Support (100.0%), Food Preparation & Serving (57.5%), and Personal Care & Service (28.2%).
| Occupation | Male | Female |
| Healthcare Support | 0 (0.0%) | 20 (100.0%) |
| Security & Protection | 0 (0.0%) | 0 (0.0%) |
| Firefighting & Prevention | 0 (0.0%) | 0 (0.0%) |
| Law Enforcement | 0 (0.0%) | 0 (0.0%) |
| Food Preparation & Serving | 20 (42.5%) | 27 (57.5%) |
| Cleaning & Maintenance | 9 (81.8%) | 2 (18.2%) |
| Personal Care & Service | 28 (71.8%) | 11 (28.2%) |
| Total (Category) | 57 (48.7%) | 60 (51.3%) |
| Total (Overall) | 618 (51.6%) | 580 (48.4%) |
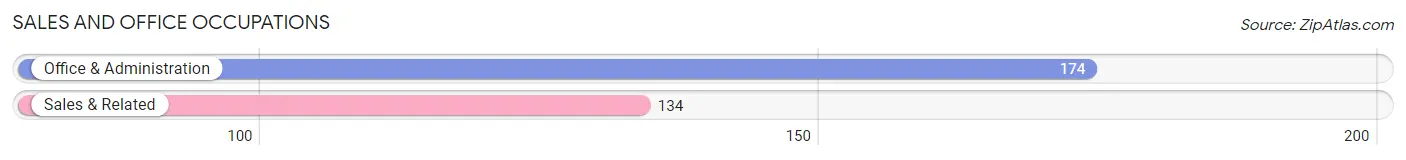
Sales and Office Occupations
The most common Sales and Office occupations in Gray Summit are Office & Administration (174 | 14.5%), and Sales & Related (134 | 11.2%).
Sales and Office Occupations by Sex
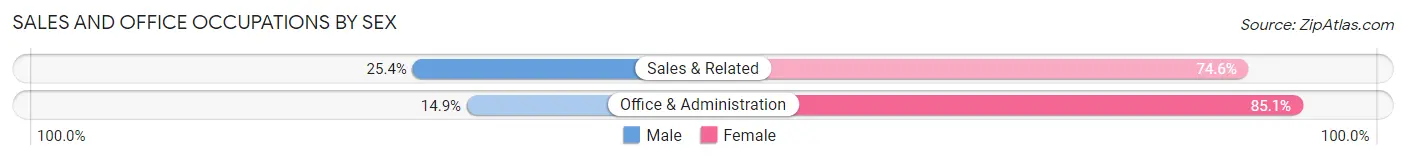
| Occupation | Male | Female |
| Sales & Related | 34 (25.4%) | 100 (74.6%) |
| Office & Administration | 26 (14.9%) | 148 (85.1%) |
| Total (Category) | 60 (19.5%) | 248 (80.5%) |
| Total (Overall) | 618 (51.6%) | 580 (48.4%) |
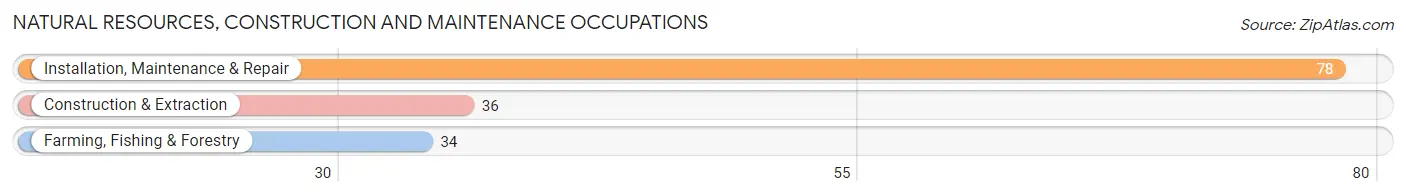
Natural Resources, Construction and Maintenance Occupations
The most common Natural Resources, Construction and Maintenance occupations in Gray Summit are Installation, Maintenance & Repair (78 | 6.5%), Construction & Extraction (36 | 3.0%), and Farming, Fishing & Forestry (34 | 2.8%).
Natural Resources, Construction and Maintenance Occupations by Sex
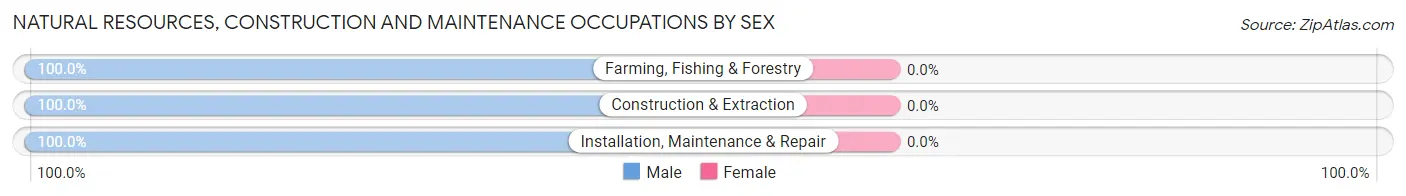
| Occupation | Male | Female |
| Farming, Fishing & Forestry | 34 (100.0%) | 0 (0.0%) |
| Construction & Extraction | 36 (100.0%) | 0 (0.0%) |
| Installation, Maintenance & Repair | 78 (100.0%) | 0 (0.0%) |
| Total (Category) | 148 (100.0%) | 0 (0.0%) |
| Total (Overall) | 618 (51.6%) | 580 (48.4%) |
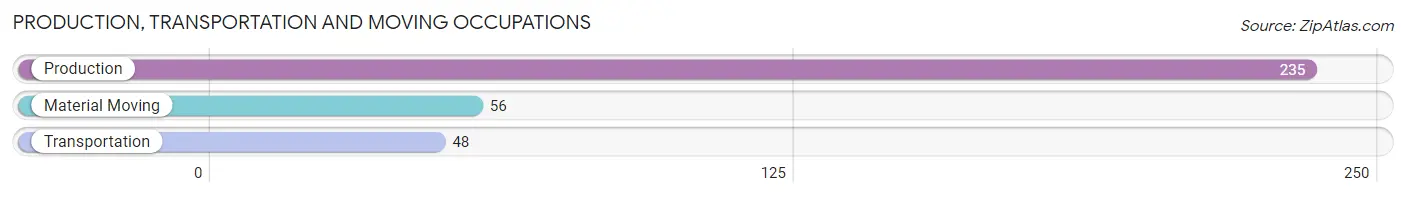
Production, Transportation and Moving Occupations
The most common Production, Transportation and Moving occupations in Gray Summit are Production (235 | 19.6%), Material Moving (56 | 4.7%), and Transportation (48 | 4.0%).
Production, Transportation and Moving Occupations by Sex
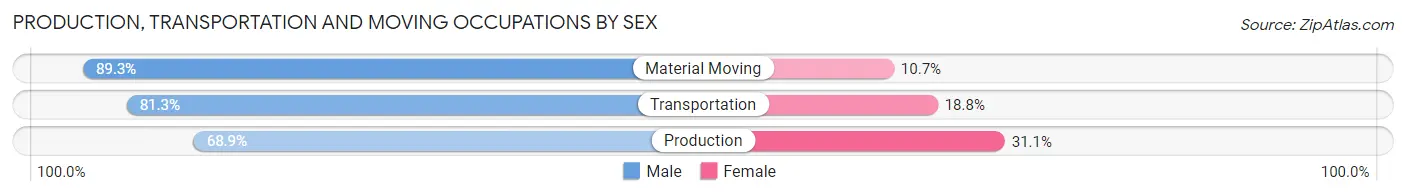
| Occupation | Male | Female |
| Production | 162 (68.9%) | 73 (31.1%) |
| Transportation | 39 (81.2%) | 9 (18.8%) |
| Material Moving | 50 (89.3%) | 6 (10.7%) |
| Total (Category) | 251 (74.0%) | 88 (26.0%) |
| Total (Overall) | 618 (51.6%) | 580 (48.4%) |
Employment Industries by Sex in Gray Summit
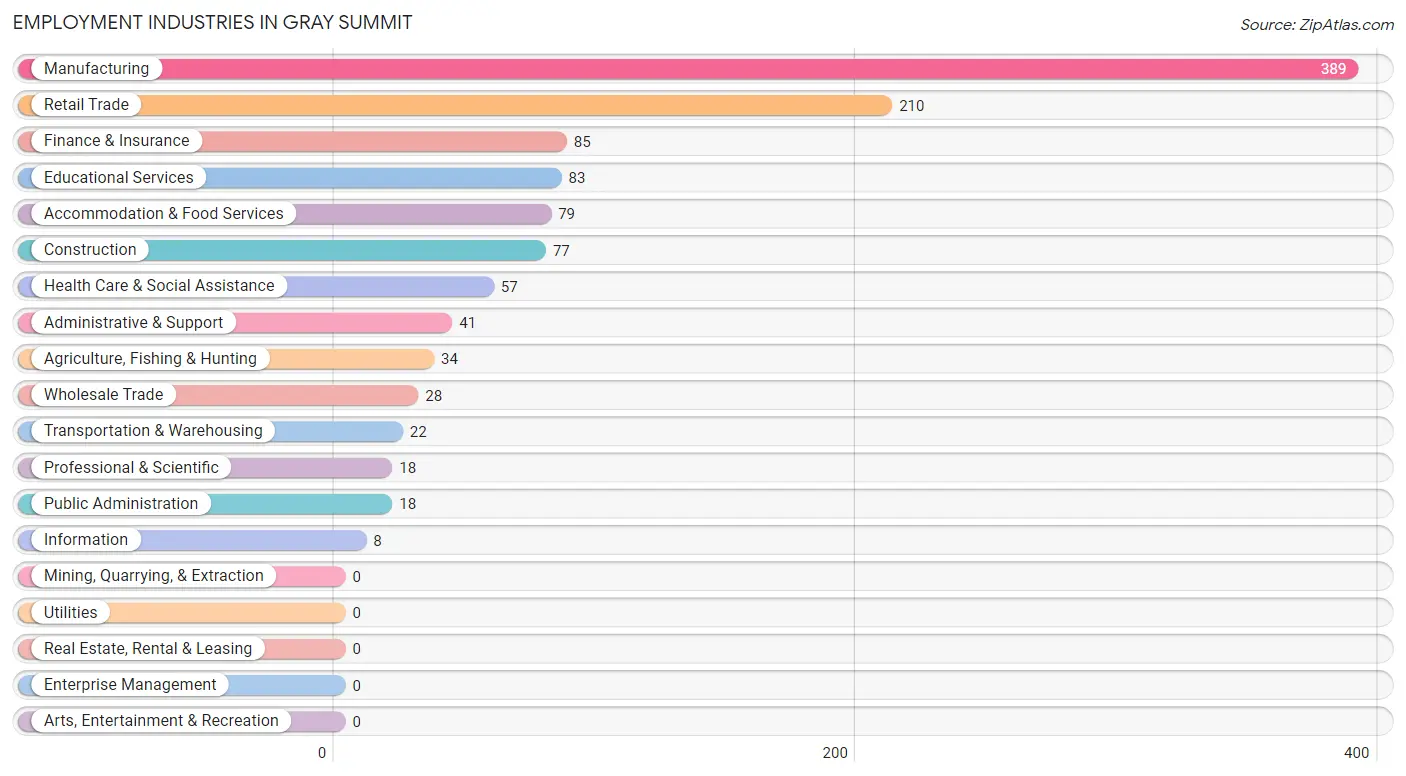
Employment Industries in Gray Summit
The major employment industries in Gray Summit include Manufacturing (389 | 32.5%), Retail Trade (210 | 17.5%), Finance & Insurance (85 | 7.1%), Educational Services (83 | 6.9%), and Accommodation & Food Services (79 | 6.6%).
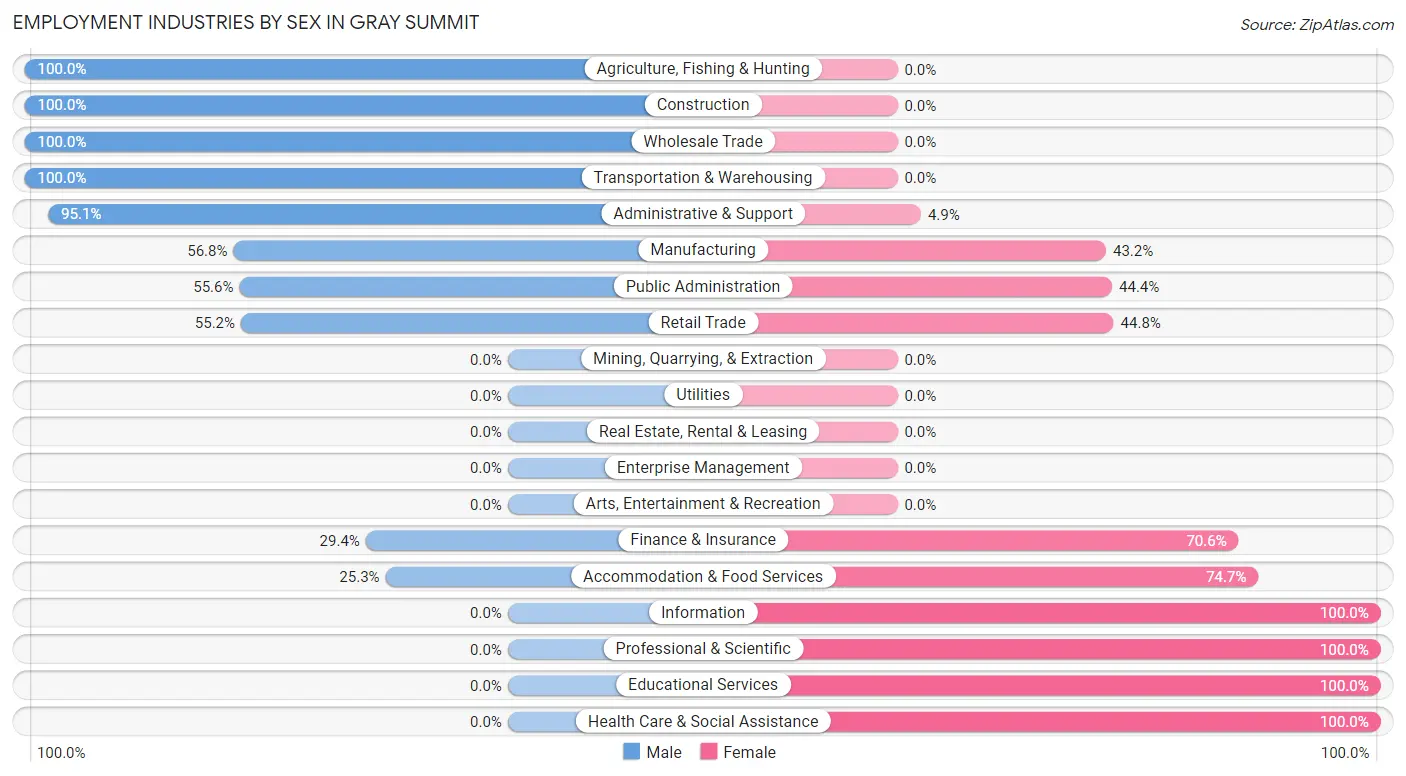
Employment Industries by Sex in Gray Summit
The Gray Summit industries that see more men than women are Agriculture, Fishing & Hunting (100.0%), Construction (100.0%), and Wholesale Trade (100.0%), whereas the industries that tend to have a higher number of women are Information (100.0%), Professional & Scientific (100.0%), and Educational Services (100.0%).
| Industry | Male | Female |
| Agriculture, Fishing & Hunting | 34 (100.0%) | 0 (0.0%) |
| Mining, Quarrying, & Extraction | 0 (0.0%) | 0 (0.0%) |
| Construction | 77 (100.0%) | 0 (0.0%) |
| Manufacturing | 221 (56.8%) | 168 (43.2%) |
| Wholesale Trade | 28 (100.0%) | 0 (0.0%) |
| Retail Trade | 116 (55.2%) | 94 (44.8%) |
| Transportation & Warehousing | 22 (100.0%) | 0 (0.0%) |
| Utilities | 0 (0.0%) | 0 (0.0%) |
| Information | 0 (0.0%) | 8 (100.0%) |
| Finance & Insurance | 25 (29.4%) | 60 (70.6%) |
| Real Estate, Rental & Leasing | 0 (0.0%) | 0 (0.0%) |
| Professional & Scientific | 0 (0.0%) | 18 (100.0%) |
| Enterprise Management | 0 (0.0%) | 0 (0.0%) |
| Administrative & Support | 39 (95.1%) | 2 (4.9%) |
| Educational Services | 0 (0.0%) | 83 (100.0%) |
| Health Care & Social Assistance | 0 (0.0%) | 57 (100.0%) |
| Arts, Entertainment & Recreation | 0 (0.0%) | 0 (0.0%) |
| Accommodation & Food Services | 20 (25.3%) | 59 (74.7%) |
| Public Administration | 10 (55.6%) | 8 (44.4%) |
| Total | 618 (51.6%) | 580 (48.4%) |
Education in Gray Summit
School Enrollment in Gray Summit
The most common levels of schooling among the 796 students in Gray Summit are elementary school (200 | 25.1%), high school (186 | 23.4%), and middle school (167 | 21.0%).
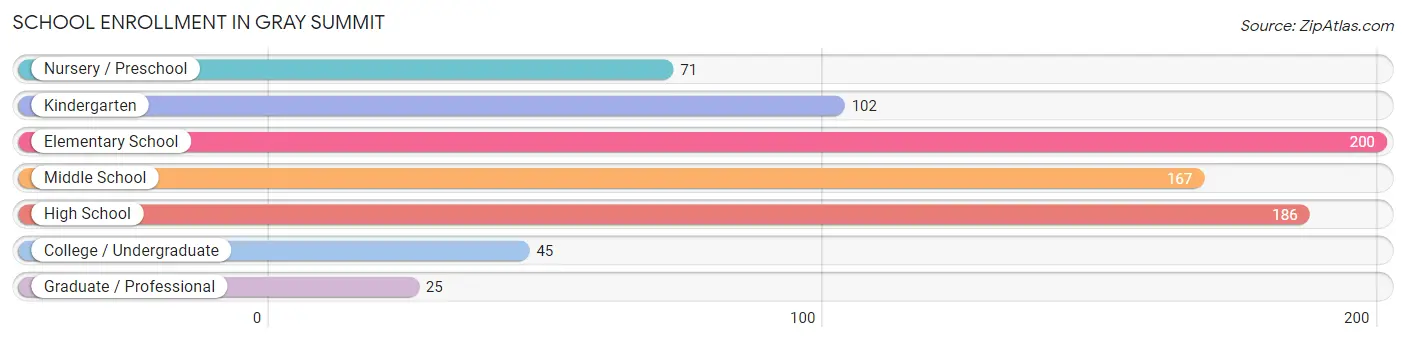
| School Level | # Students | % Students |
| Nursery / Preschool | 71 | 8.9% |
| Kindergarten | 102 | 12.8% |
| Elementary School | 200 | 25.1% |
| Middle School | 167 | 21.0% |
| High School | 186 | 23.4% |
| College / Undergraduate | 45 | 5.7% |
| Graduate / Professional | 25 | 3.1% |
| Total | 796 | 100.0% |
School Enrollment by Age by Funding Source in Gray Summit
Out of a total of 796 students who are enrolled in schools in Gray Summit, 125 (15.7%) attend a private institution, while the remaining 671 (84.3%) are enrolled in public schools. The age group of 3 to 4 year olds has the highest likelihood of being enrolled in private schools, with 37 (52.1% in the age bracket) enrolled. Conversely, the age group of 18 to 19 year olds has the lowest likelihood of being enrolled in a private school, with 14 (100.0% in the age bracket) attending a public institution.
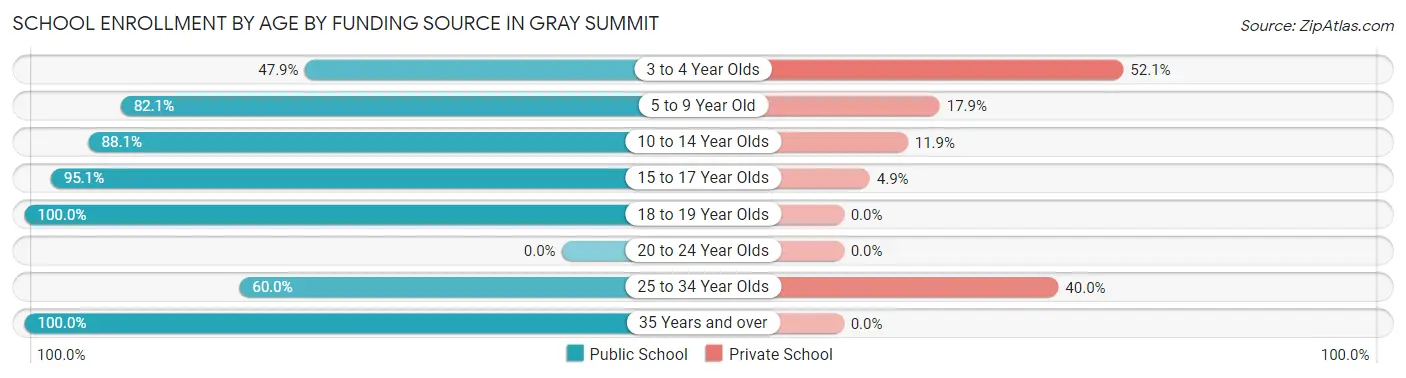
| Age Bracket | Public School | Private School |
| 3 to 4 Year Olds | 34 (47.9%) | 37 (52.1%) |
| 5 to 9 Year Old | 220 (82.1%) | 48 (17.9%) |
| 10 to 14 Year Olds | 177 (88.1%) | 24 (11.9%) |
| 15 to 17 Year Olds | 117 (95.1%) | 6 (4.9%) |
| 18 to 19 Year Olds | 14 (100.0%) | 0 (0.0%) |
| 20 to 24 Year Olds | 0 (0.0%) | 0 (0.0%) |
| 25 to 34 Year Olds | 15 (60.0%) | 10 (40.0%) |
| 35 Years and over | 94 (100.0%) | 0 (0.0%) |
| Total | 671 (84.3%) | 125 (15.7%) |
Educational Attainment by Field of Study in Gray Summit
Education (70 | 26.7%), science & technology (57 | 21.8%), business (42 | 16.0%), engineering (37 | 14.1%), and arts & humanities (29 | 11.1%) are the most common fields of study among 262 individuals in Gray Summit who have obtained a bachelor's degree or higher.
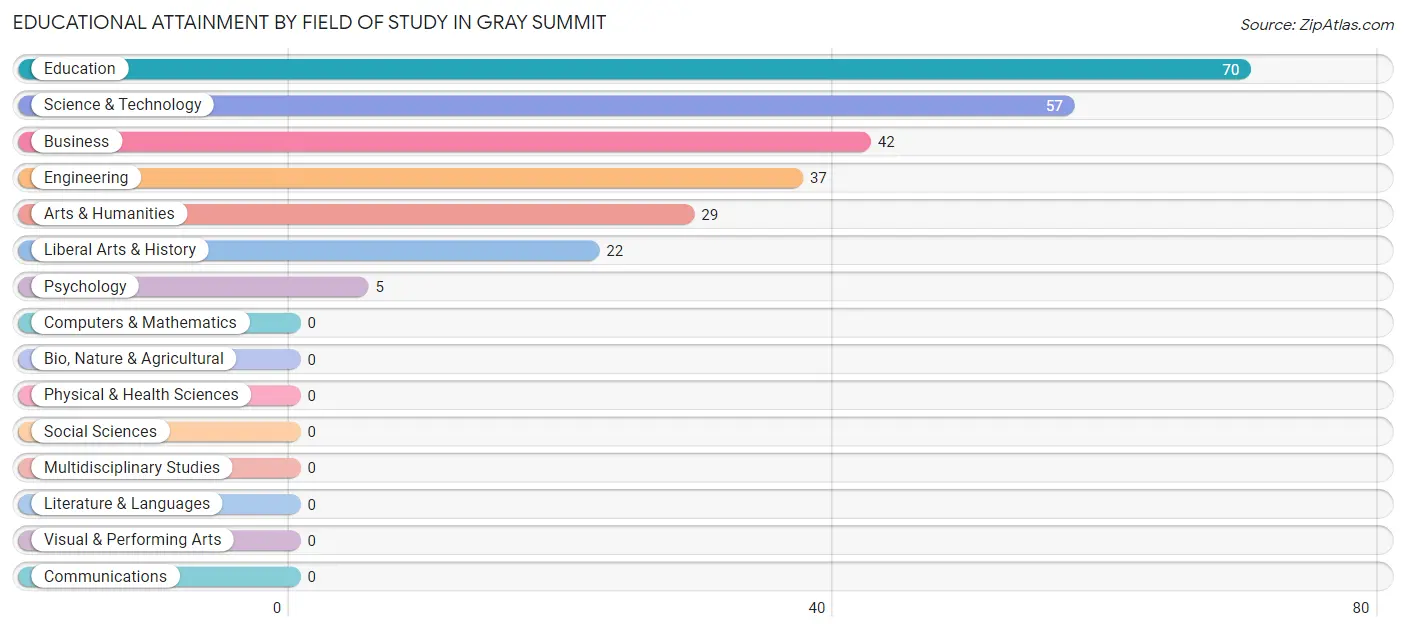
| Field of Study | # Graduates | % Graduates |
| Computers & Mathematics | 0 | 0.0% |
| Bio, Nature & Agricultural | 0 | 0.0% |
| Physical & Health Sciences | 0 | 0.0% |
| Psychology | 5 | 1.9% |
| Social Sciences | 0 | 0.0% |
| Engineering | 37 | 14.1% |
| Multidisciplinary Studies | 0 | 0.0% |
| Science & Technology | 57 | 21.8% |
| Business | 42 | 16.0% |
| Education | 70 | 26.7% |
| Literature & Languages | 0 | 0.0% |
| Liberal Arts & History | 22 | 8.4% |
| Visual & Performing Arts | 0 | 0.0% |
| Communications | 0 | 0.0% |
| Arts & Humanities | 29 | 11.1% |
| Total | 262 | 100.0% |
Transportation & Commute in Gray Summit
Vehicle Availability by Sex in Gray Summit
The most prevalent vehicle ownership categories in Gray Summit are males with 2 vehicles (220, accounting for 38.2%) and females with 2 vehicles (240, making up 39.0%).
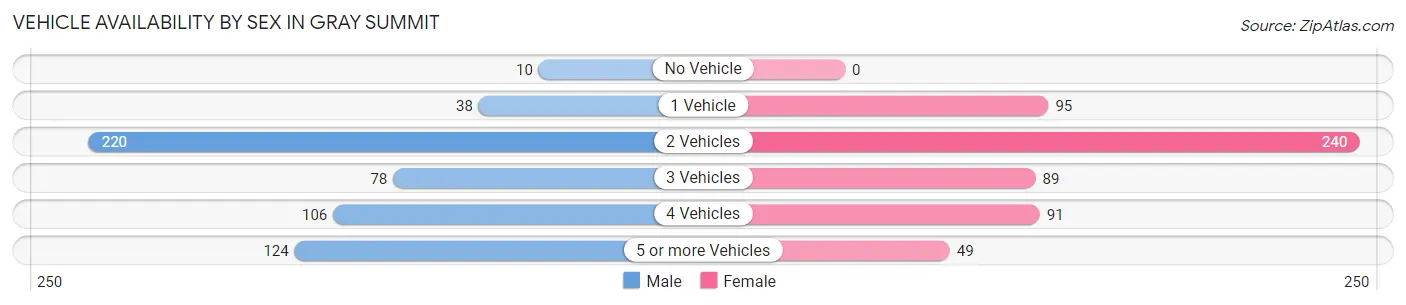
| Vehicles Available | Male | Female |
| No Vehicle | 10 (1.7%) | 0 (0.0%) |
| 1 Vehicle | 38 (6.6%) | 95 (16.8%) |
| 2 Vehicles | 220 (38.2%) | 240 (42.5%) |
| 3 Vehicles | 78 (13.5%) | 89 (15.8%) |
| 4 Vehicles | 106 (18.4%) | 91 (16.1%) |
| 5 or more Vehicles | 124 (21.5%) | 49 (8.7%) |
| Total | 576 (100.0%) | 564 (100.0%) |
Commute Time in Gray Summit
The most frequently occuring commute durations in Gray Summit are 10 to 14 minutes (211 commuters, 19.8%), 45 to 59 minutes (183 commuters, 17.1%), and 30 to 34 minutes (154 commuters, 14.4%).
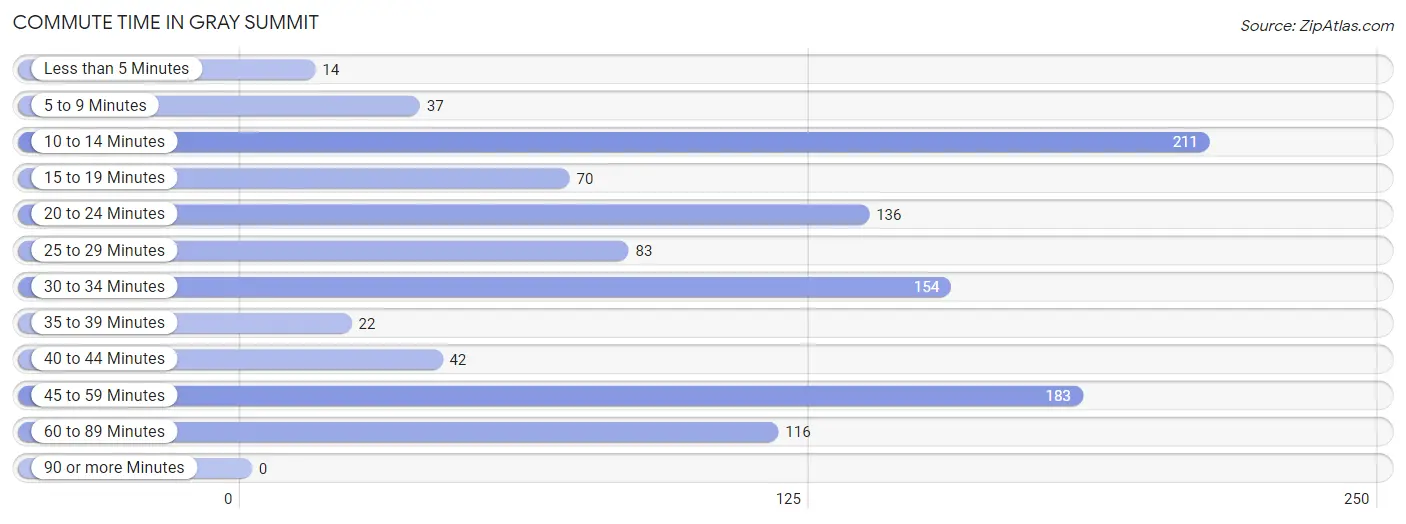
| Commute Time | # Commuters | % Commuters |
| Less than 5 Minutes | 14 | 1.3% |
| 5 to 9 Minutes | 37 | 3.5% |
| 10 to 14 Minutes | 211 | 19.8% |
| 15 to 19 Minutes | 70 | 6.6% |
| 20 to 24 Minutes | 136 | 12.7% |
| 25 to 29 Minutes | 83 | 7.8% |
| 30 to 34 Minutes | 154 | 14.4% |
| 35 to 39 Minutes | 22 | 2.1% |
| 40 to 44 Minutes | 42 | 3.9% |
| 45 to 59 Minutes | 183 | 17.1% |
| 60 to 89 Minutes | 116 | 10.9% |
| 90 or more Minutes | 0 | 0.0% |
Commute Time by Sex in Gray Summit
The most common commute times in Gray Summit are 10 to 14 minutes (110 commuters, 20.8%) for males and 10 to 14 minutes (101 commuters, 18.7%) for females.
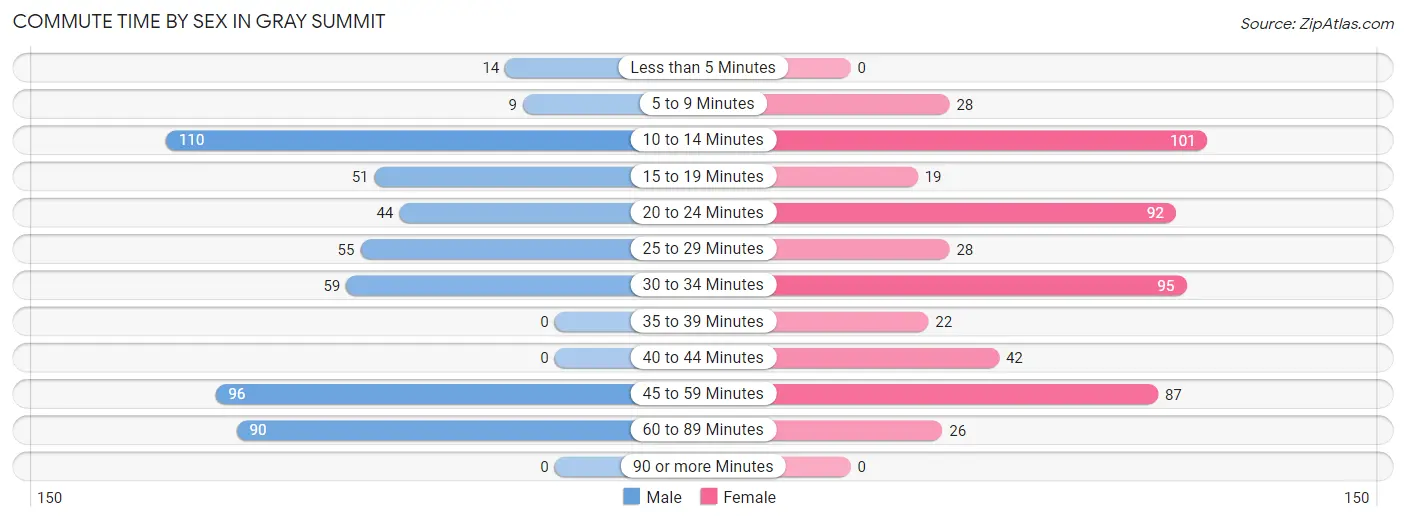
| Commute Time | Male | Female |
| Less than 5 Minutes | 14 (2.6%) | 0 (0.0%) |
| 5 to 9 Minutes | 9 (1.7%) | 28 (5.2%) |
| 10 to 14 Minutes | 110 (20.8%) | 101 (18.7%) |
| 15 to 19 Minutes | 51 (9.7%) | 19 (3.5%) |
| 20 to 24 Minutes | 44 (8.3%) | 92 (17.0%) |
| 25 to 29 Minutes | 55 (10.4%) | 28 (5.2%) |
| 30 to 34 Minutes | 59 (11.2%) | 95 (17.6%) |
| 35 to 39 Minutes | 0 (0.0%) | 22 (4.1%) |
| 40 to 44 Minutes | 0 (0.0%) | 42 (7.8%) |
| 45 to 59 Minutes | 96 (18.2%) | 87 (16.1%) |
| 60 to 89 Minutes | 90 (17.1%) | 26 (4.8%) |
| 90 or more Minutes | 0 (0.0%) | 0 (0.0%) |
Time of Departure to Work by Sex in Gray Summit
The most frequent times of departure to work in Gray Summit are 5:00 AM to 5:29 AM (115, 21.8%) for males and 6:00 AM to 6:29 AM (117, 21.7%) for females.
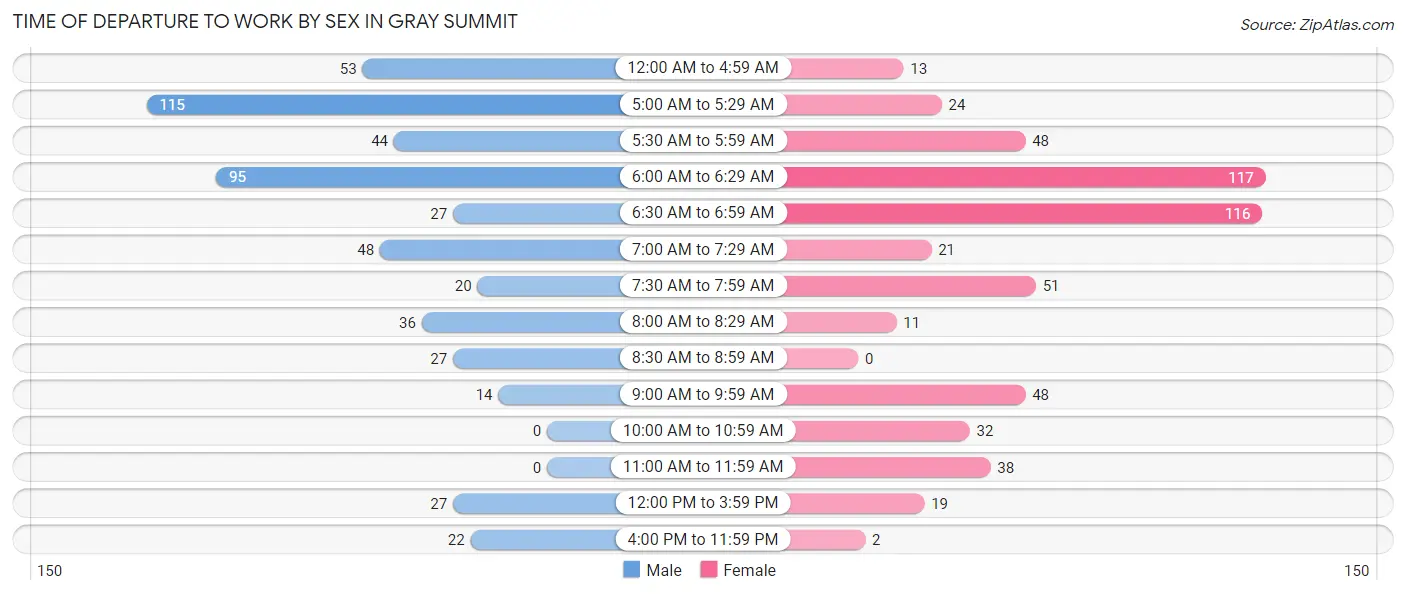
| Time of Departure | Male | Female |
| 12:00 AM to 4:59 AM | 53 (10.0%) | 13 (2.4%) |
| 5:00 AM to 5:29 AM | 115 (21.8%) | 24 (4.4%) |
| 5:30 AM to 5:59 AM | 44 (8.3%) | 48 (8.9%) |
| 6:00 AM to 6:29 AM | 95 (18.0%) | 117 (21.7%) |
| 6:30 AM to 6:59 AM | 27 (5.1%) | 116 (21.5%) |
| 7:00 AM to 7:29 AM | 48 (9.1%) | 21 (3.9%) |
| 7:30 AM to 7:59 AM | 20 (3.8%) | 51 (9.4%) |
| 8:00 AM to 8:29 AM | 36 (6.8%) | 11 (2.0%) |
| 8:30 AM to 8:59 AM | 27 (5.1%) | 0 (0.0%) |
| 9:00 AM to 9:59 AM | 14 (2.6%) | 48 (8.9%) |
| 10:00 AM to 10:59 AM | 0 (0.0%) | 32 (5.9%) |
| 11:00 AM to 11:59 AM | 0 (0.0%) | 38 (7.0%) |
| 12:00 PM to 3:59 PM | 27 (5.1%) | 19 (3.5%) |
| 4:00 PM to 11:59 PM | 22 (4.2%) | 2 (0.4%) |
| Total | 528 (100.0%) | 540 (100.0%) |
Housing Occupancy in Gray Summit
Occupancy by Ownership in Gray Summit
Of the total 911 dwellings in Gray Summit, owner-occupied units account for 740 (81.2%), while renter-occupied units make up 171 (18.8%).
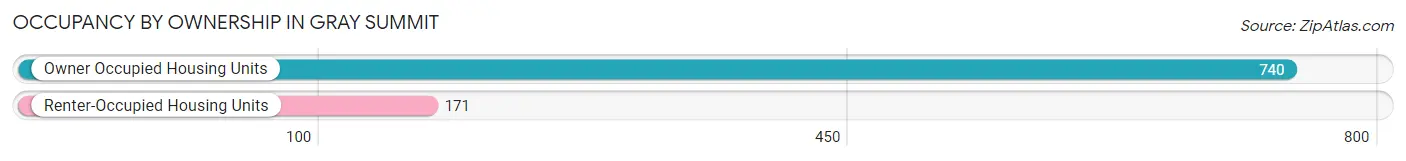
| Occupancy | # Housing Units | % Housing Units |
| Owner Occupied Housing Units | 740 | 81.2% |
| Renter-Occupied Housing Units | 171 | 18.8% |
| Total Occupied Housing Units | 911 | 100.0% |
Occupancy by Household Size in Gray Summit
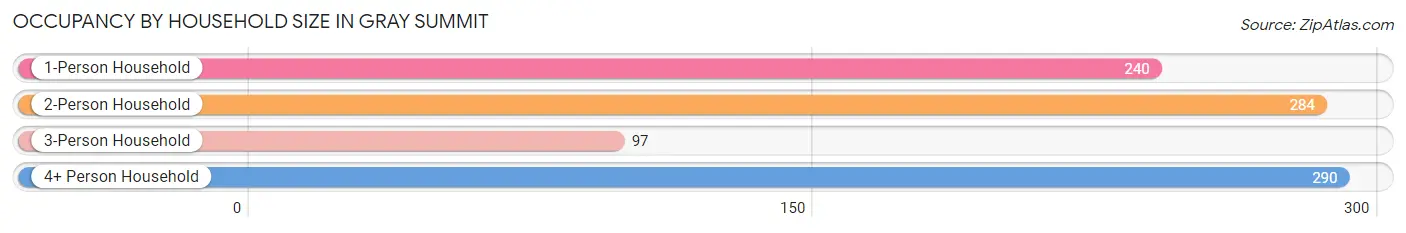
| Household Size | # Housing Units | % Housing Units |
| 1-Person Household | 240 | 26.3% |
| 2-Person Household | 284 | 31.2% |
| 3-Person Household | 97 | 10.6% |
| 4+ Person Household | 290 | 31.8% |
| Total Housing Units | 911 | 100.0% |
Occupancy by Ownership by Household Size in Gray Summit
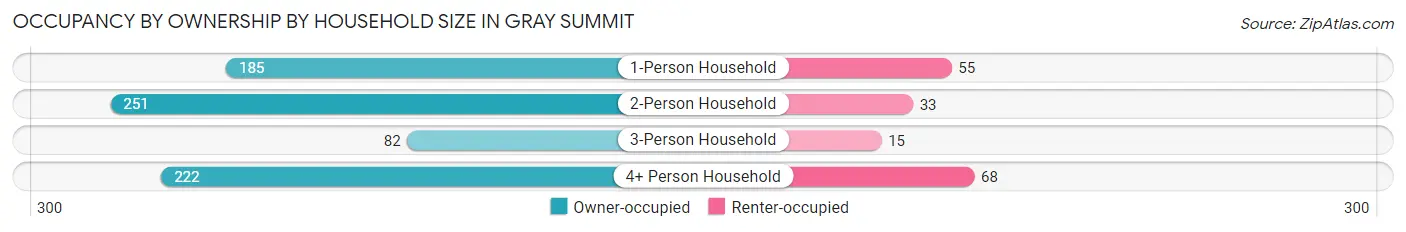
| Household Size | Owner-occupied | Renter-occupied |
| 1-Person Household | 185 (77.1%) | 55 (22.9%) |
| 2-Person Household | 251 (88.4%) | 33 (11.6%) |
| 3-Person Household | 82 (84.5%) | 15 (15.5%) |
| 4+ Person Household | 222 (76.5%) | 68 (23.4%) |
| Total Housing Units | 740 (81.2%) | 171 (18.8%) |
Occupancy by Educational Attainment in Gray Summit
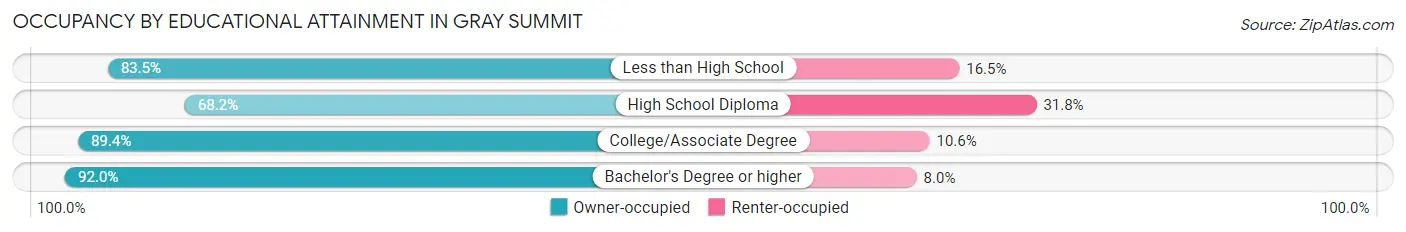
| Household Size | Owner-occupied | Renter-occupied |
| Less than High School | 76 (83.5%) | 15 (16.5%) |
| High School Diploma | 234 (68.2%) | 109 (31.8%) |
| College/Associate Degree | 304 (89.4%) | 36 (10.6%) |
| Bachelor's Degree or higher | 126 (92.0%) | 11 (8.0%) |
Occupancy by Age of Householder in Gray Summit
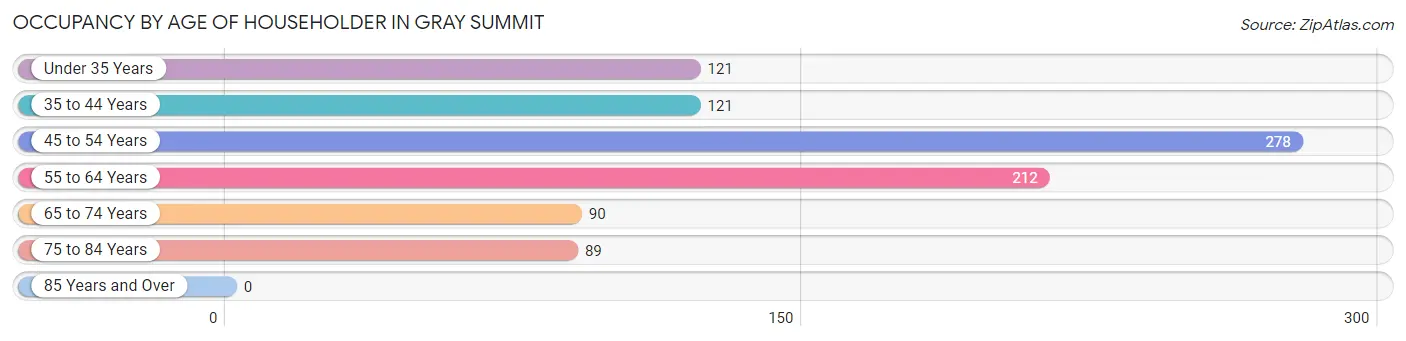
| Age Bracket | # Households | % Households |
| Under 35 Years | 121 | 13.3% |
| 35 to 44 Years | 121 | 13.3% |
| 45 to 54 Years | 278 | 30.5% |
| 55 to 64 Years | 212 | 23.3% |
| 65 to 74 Years | 90 | 9.9% |
| 75 to 84 Years | 89 | 9.8% |
| 85 Years and Over | 0 | 0.0% |
| Total | 911 | 100.0% |
Housing Finances in Gray Summit
Median Income by Occupancy in Gray Summit
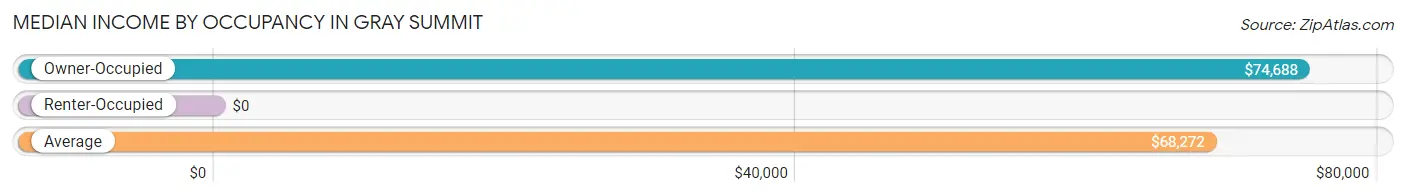
| Occupancy Type | # Households | Median Income |
| Owner-Occupied | 740 (81.2%) | $74,688 |
| Renter-Occupied | 171 (18.8%) | $0 |
| Average | 911 (100.0%) | $68,272 |
Occupancy by Householder Income Bracket in Gray Summit
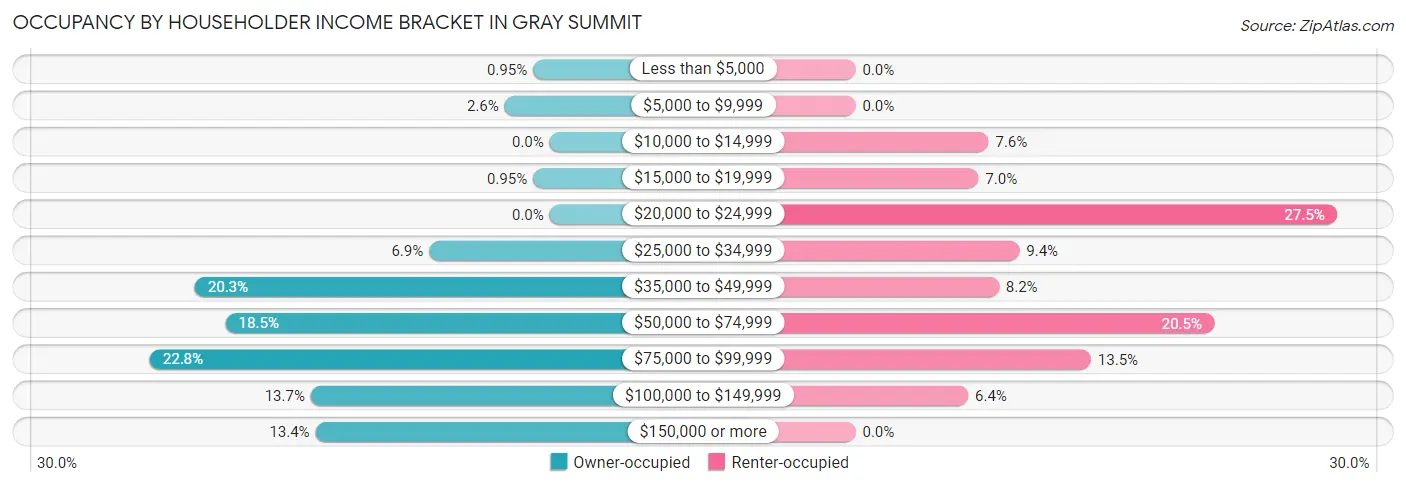
| Income Bracket | Owner-occupied | Renter-occupied |
| Less than $5,000 | 7 (0.9%) | 0 (0.0%) |
| $5,000 to $9,999 | 19 (2.6%) | 0 (0.0%) |
| $10,000 to $14,999 | 0 (0.0%) | 13 (7.6%) |
| $15,000 to $19,999 | 7 (0.9%) | 12 (7.0%) |
| $20,000 to $24,999 | 0 (0.0%) | 47 (27.5%) |
| $25,000 to $34,999 | 51 (6.9%) | 16 (9.4%) |
| $35,000 to $49,999 | 150 (20.3%) | 14 (8.2%) |
| $50,000 to $74,999 | 137 (18.5%) | 35 (20.5%) |
| $75,000 to $99,999 | 169 (22.8%) | 23 (13.5%) |
| $100,000 to $149,999 | 101 (13.7%) | 11 (6.4%) |
| $150,000 or more | 99 (13.4%) | 0 (0.0%) |
| Total | 740 (100.0%) | 171 (100.0%) |
Monthly Housing Cost Tiers in Gray Summit
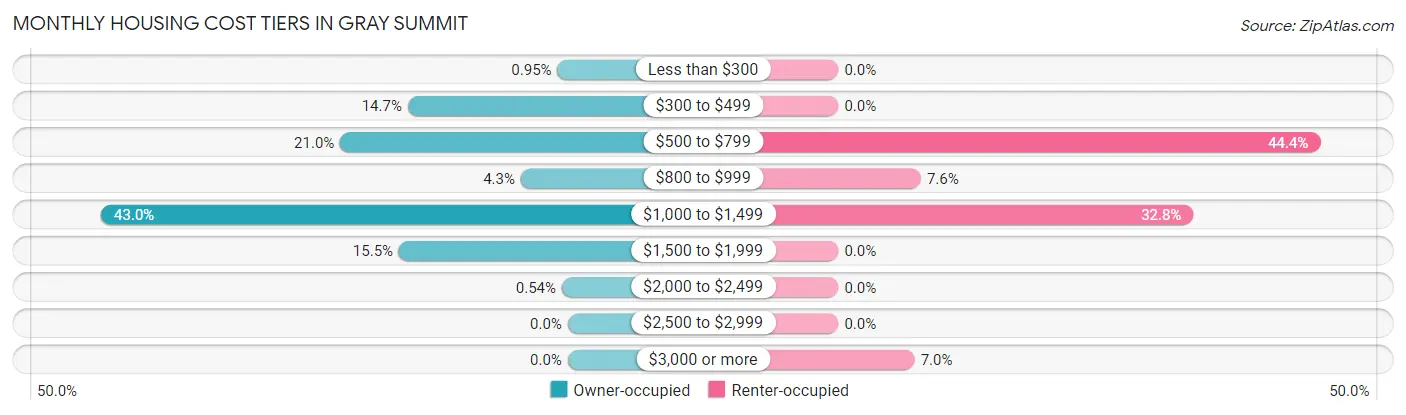
| Monthly Cost | Owner-occupied | Renter-occupied |
| Less than $300 | 7 (0.9%) | 0 (0.0%) |
| $300 to $499 | 109 (14.7%) | 0 (0.0%) |
| $500 to $799 | 155 (20.9%) | 76 (44.4%) |
| $800 to $999 | 32 (4.3%) | 13 (7.6%) |
| $1,000 to $1,499 | 318 (43.0%) | 56 (32.8%) |
| $1,500 to $1,999 | 115 (15.5%) | 0 (0.0%) |
| $2,000 to $2,499 | 4 (0.5%) | 0 (0.0%) |
| $2,500 to $2,999 | 0 (0.0%) | 0 (0.0%) |
| $3,000 or more | 0 (0.0%) | 12 (7.0%) |
| Total | 740 (100.0%) | 171 (100.0%) |
Physical Housing Characteristics in Gray Summit
Housing Structures in Gray Summit
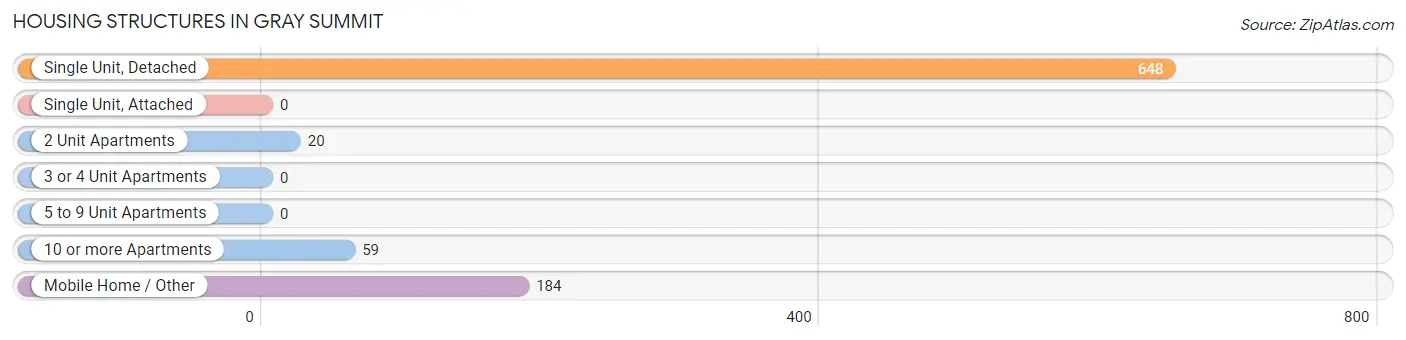
| Structure Type | # Housing Units | % Housing Units |
| Single Unit, Detached | 648 | 71.1% |
| Single Unit, Attached | 0 | 0.0% |
| 2 Unit Apartments | 20 | 2.2% |
| 3 or 4 Unit Apartments | 0 | 0.0% |
| 5 to 9 Unit Apartments | 0 | 0.0% |
| 10 or more Apartments | 59 | 6.5% |
| Mobile Home / Other | 184 | 20.2% |
| Total | 911 | 100.0% |
Housing Structures by Occupancy in Gray Summit
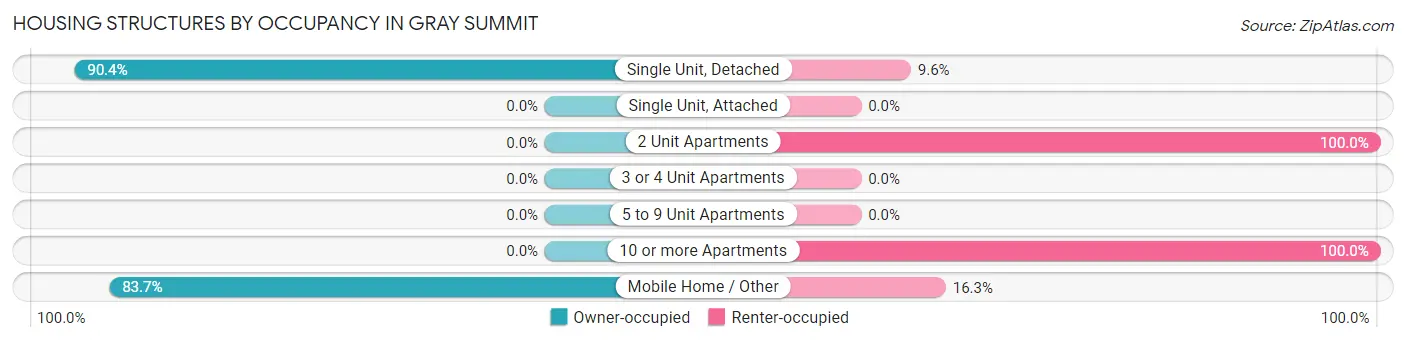
| Structure Type | Owner-occupied | Renter-occupied |
| Single Unit, Detached | 586 (90.4%) | 62 (9.6%) |
| Single Unit, Attached | 0 (0.0%) | 0 (0.0%) |
| 2 Unit Apartments | 0 (0.0%) | 20 (100.0%) |
| 3 or 4 Unit Apartments | 0 (0.0%) | 0 (0.0%) |
| 5 to 9 Unit Apartments | 0 (0.0%) | 0 (0.0%) |
| 10 or more Apartments | 0 (0.0%) | 59 (100.0%) |
| Mobile Home / Other | 154 (83.7%) | 30 (16.3%) |
| Total | 740 (81.2%) | 171 (18.8%) |
Housing Structures by Number of Rooms in Gray Summit
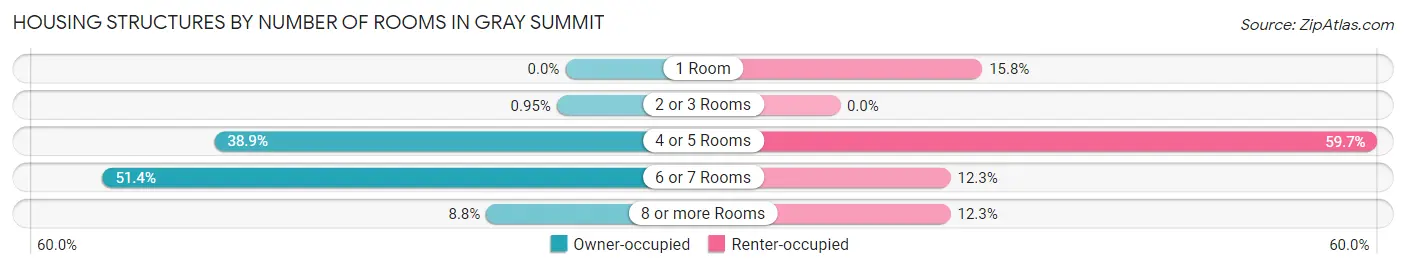
| Number of Rooms | Owner-occupied | Renter-occupied |
| 1 Room | 0 (0.0%) | 27 (15.8%) |
| 2 or 3 Rooms | 7 (0.9%) | 0 (0.0%) |
| 4 or 5 Rooms | 288 (38.9%) | 102 (59.7%) |
| 6 or 7 Rooms | 380 (51.3%) | 21 (12.3%) |
| 8 or more Rooms | 65 (8.8%) | 21 (12.3%) |
| Total | 740 (100.0%) | 171 (100.0%) |
Housing Structure by Heating Type in Gray Summit
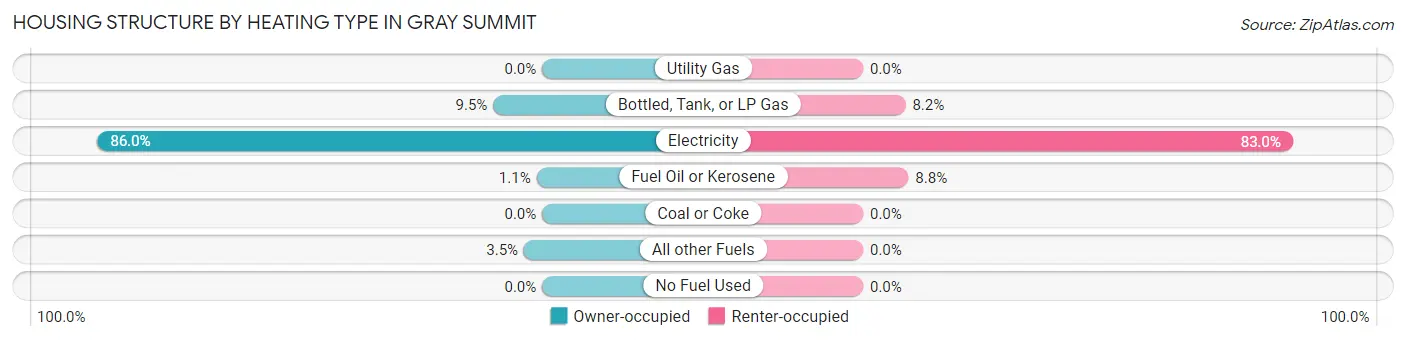
| Heating Type | Owner-occupied | Renter-occupied |
| Utility Gas | 0 (0.0%) | 0 (0.0%) |
| Bottled, Tank, or LP Gas | 70 (9.5%) | 14 (8.2%) |
| Electricity | 636 (86.0%) | 142 (83.0%) |
| Fuel Oil or Kerosene | 8 (1.1%) | 15 (8.8%) |
| Coal or Coke | 0 (0.0%) | 0 (0.0%) |
| All other Fuels | 26 (3.5%) | 0 (0.0%) |
| No Fuel Used | 0 (0.0%) | 0 (0.0%) |
| Total | 740 (100.0%) | 171 (100.0%) |
Household Vehicle Usage in Gray Summit
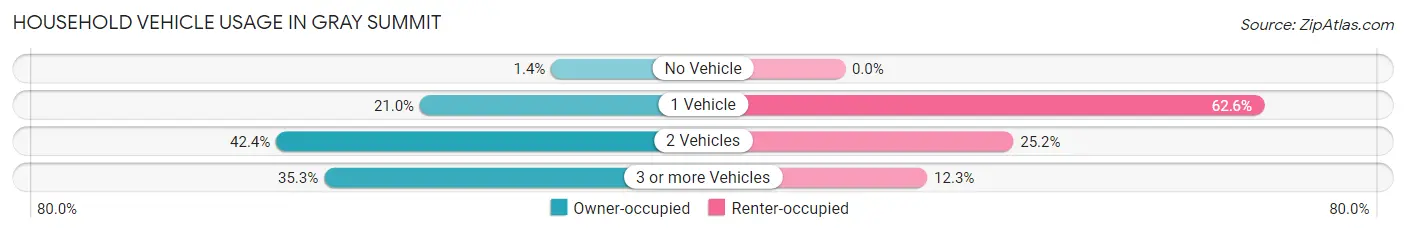
| Vehicles per Household | Owner-occupied | Renter-occupied |
| No Vehicle | 10 (1.3%) | 0 (0.0%) |
| 1 Vehicle | 155 (20.9%) | 107 (62.6%) |
| 2 Vehicles | 314 (42.4%) | 43 (25.2%) |
| 3 or more Vehicles | 261 (35.3%) | 21 (12.3%) |
| Total | 740 (100.0%) | 171 (100.0%) |
Real Estate & Mortgages in Gray Summit
Real Estate and Mortgage Overview in Gray Summit
| Characteristic | Without Mortgage | With Mortgage |
| Housing Units | 277 | 463 |
| Median Property Value | - | - |
| Median Household Income | $48,257 | $85 |
| Monthly Housing Costs | $542 | $0 |
| Real Estate Taxes | - | - |
Property Value by Mortgage Status in Gray Summit
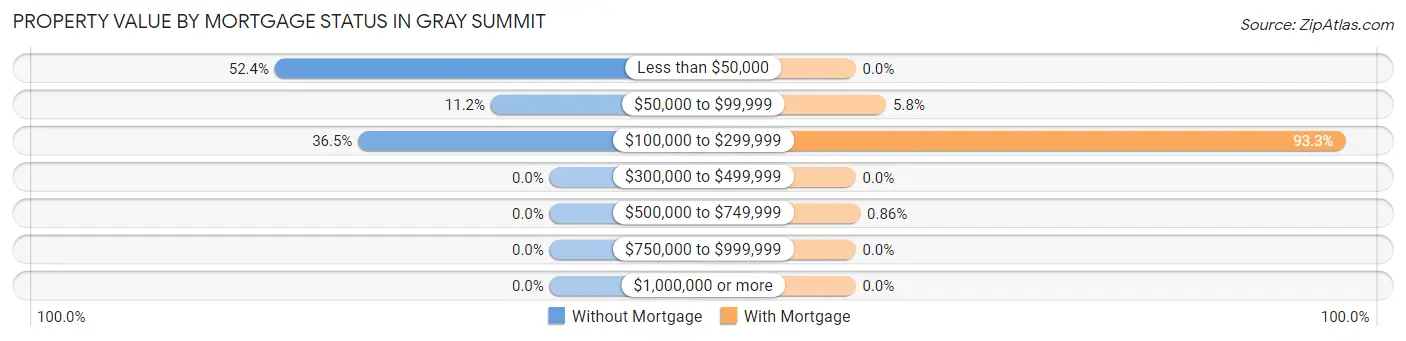
| Property Value | Without Mortgage | With Mortgage |
| Less than $50,000 | 145 (52.3%) | 0 (0.0%) |
| $50,000 to $99,999 | 31 (11.2%) | 27 (5.8%) |
| $100,000 to $299,999 | 101 (36.5%) | 432 (93.3%) |
| $300,000 to $499,999 | 0 (0.0%) | 0 (0.0%) |
| $500,000 to $749,999 | 0 (0.0%) | 4 (0.9%) |
| $750,000 to $999,999 | 0 (0.0%) | 0 (0.0%) |
| $1,000,000 or more | 0 (0.0%) | 0 (0.0%) |
| Total | 277 (100.0%) | 463 (100.0%) |
Household Income by Mortgage Status in Gray Summit
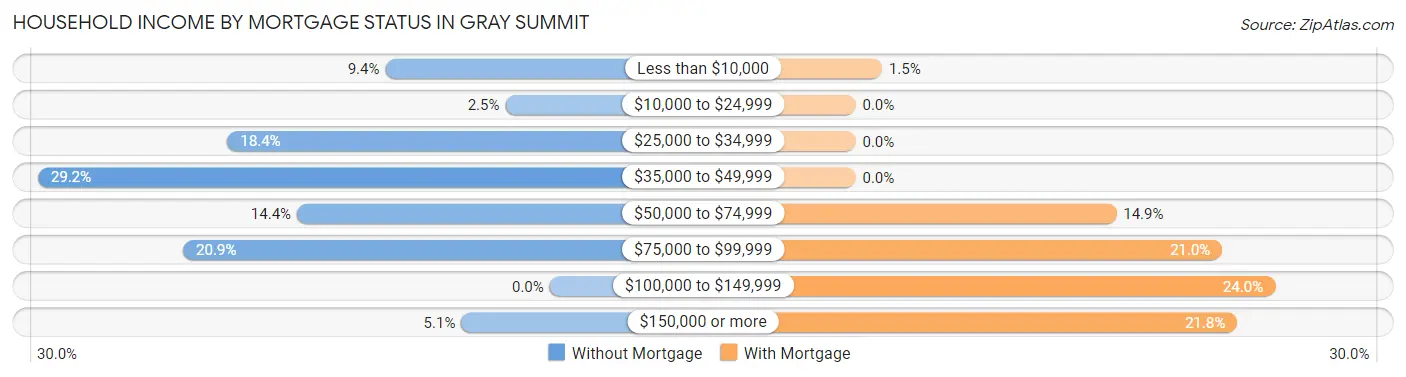
| Household Income | Without Mortgage | With Mortgage |
| Less than $10,000 | 26 (9.4%) | 7 (1.5%) |
| $10,000 to $24,999 | 7 (2.5%) | 0 (0.0%) |
| $25,000 to $34,999 | 51 (18.4%) | 0 (0.0%) |
| $35,000 to $49,999 | 81 (29.2%) | 0 (0.0%) |
| $50,000 to $74,999 | 40 (14.4%) | 69 (14.9%) |
| $75,000 to $99,999 | 58 (20.9%) | 97 (20.9%) |
| $100,000 to $149,999 | 0 (0.0%) | 111 (24.0%) |
| $150,000 or more | 14 (5.1%) | 101 (21.8%) |
| Total | 277 (100.0%) | 463 (100.0%) |
Property Value to Household Income Ratio in Gray Summit
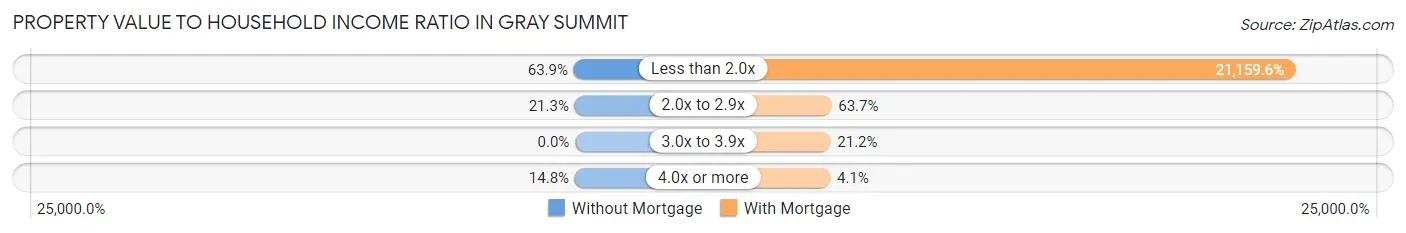
| Value-to-Income Ratio | Without Mortgage | With Mortgage |
| Less than 2.0x | 177 (63.9%) | 97,969 (21,159.6%) |
| 2.0x to 2.9x | 59 (21.3%) | 295 (63.7%) |
| 3.0x to 3.9x | 0 (0.0%) | 98 (21.2%) |
| 4.0x or more | 41 (14.8%) | 19 (4.1%) |
| Total | 277 (100.0%) | 463 (100.0%) |
Real Estate Taxes by Mortgage Status in Gray Summit
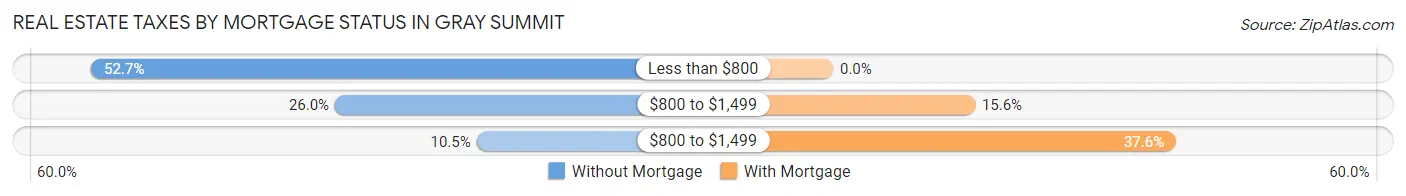
| Property Taxes | Without Mortgage | With Mortgage |
| Less than $800 | 146 (52.7%) | 0 (0.0%) |
| $800 to $1,499 | 72 (26.0%) | 72 (15.5%) |
| $800 to $1,499 | 29 (10.5%) | 174 (37.6%) |
| Total | 277 (100.0%) | 463 (100.0%) |
Health & Disability in Gray Summit
Health Insurance Coverage by Age in Gray Summit
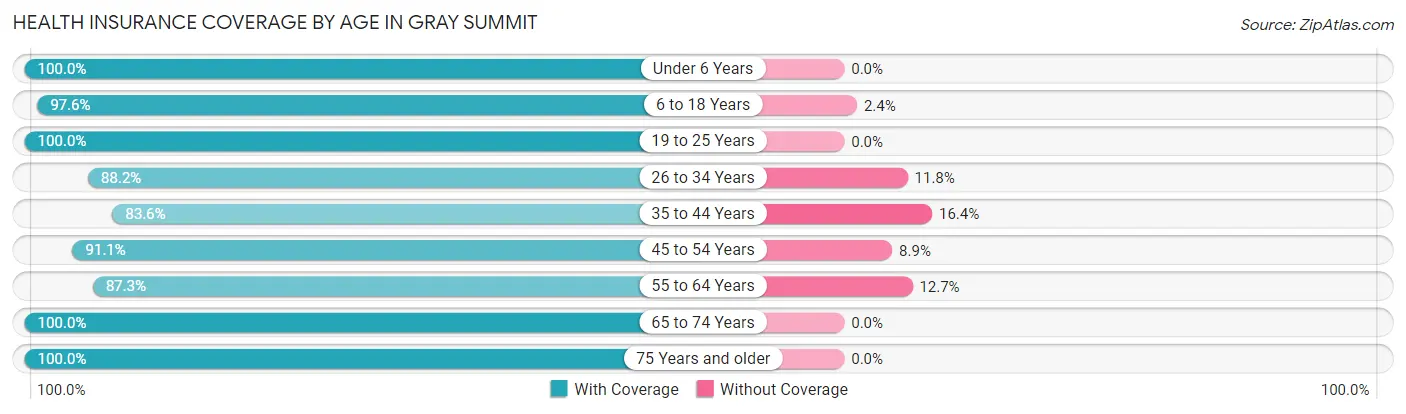
| Age Bracket | With Coverage | Without Coverage |
| Under 6 Years | 250 (100.0%) | 0 (0.0%) |
| 6 to 18 Years | 539 (97.6%) | 13 (2.4%) |
| 19 to 25 Years | 143 (100.0%) | 0 (0.0%) |
| 26 to 34 Years | 254 (88.2%) | 34 (11.8%) |
| 35 to 44 Years | 235 (83.6%) | 46 (16.4%) |
| 45 to 54 Years | 398 (91.1%) | 39 (8.9%) |
| 55 to 64 Years | 254 (87.3%) | 37 (12.7%) |
| 65 to 74 Years | 213 (100.0%) | 0 (0.0%) |
| 75 Years and older | 118 (100.0%) | 0 (0.0%) |
| Total | 2,404 (93.4%) | 169 (6.6%) |
Health Insurance Coverage by Citizenship Status in Gray Summit
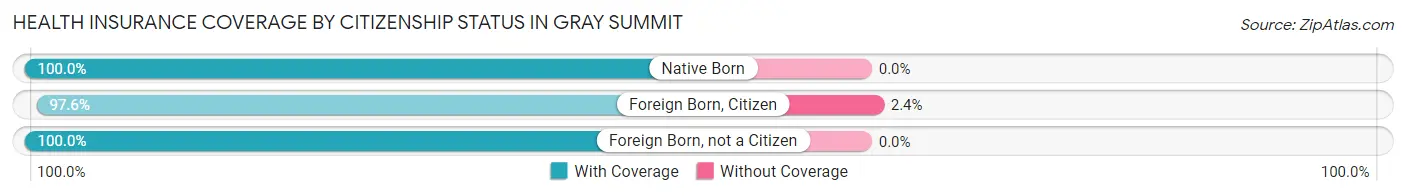
| Citizenship Status | With Coverage | Without Coverage |
| Native Born | 250 (100.0%) | 0 (0.0%) |
| Foreign Born, Citizen | 539 (97.6%) | 13 (2.4%) |
| Foreign Born, not a Citizen | 143 (100.0%) | 0 (0.0%) |
Health Insurance Coverage by Household Income in Gray Summit
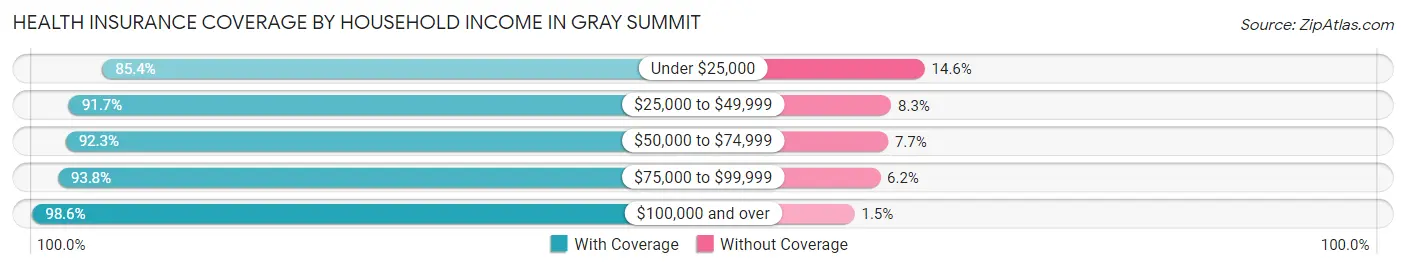
| Household Income | With Coverage | Without Coverage |
| Under $25,000 | 205 (85.4%) | 35 (14.6%) |
| $25,000 to $49,999 | 420 (91.7%) | 38 (8.3%) |
| $50,000 to $74,999 | 551 (92.3%) | 46 (7.7%) |
| $75,000 to $99,999 | 616 (93.8%) | 41 (6.2%) |
| $100,000 and over | 612 (98.6%) | 9 (1.5%) |
Public vs Private Health Insurance Coverage by Age in Gray Summit
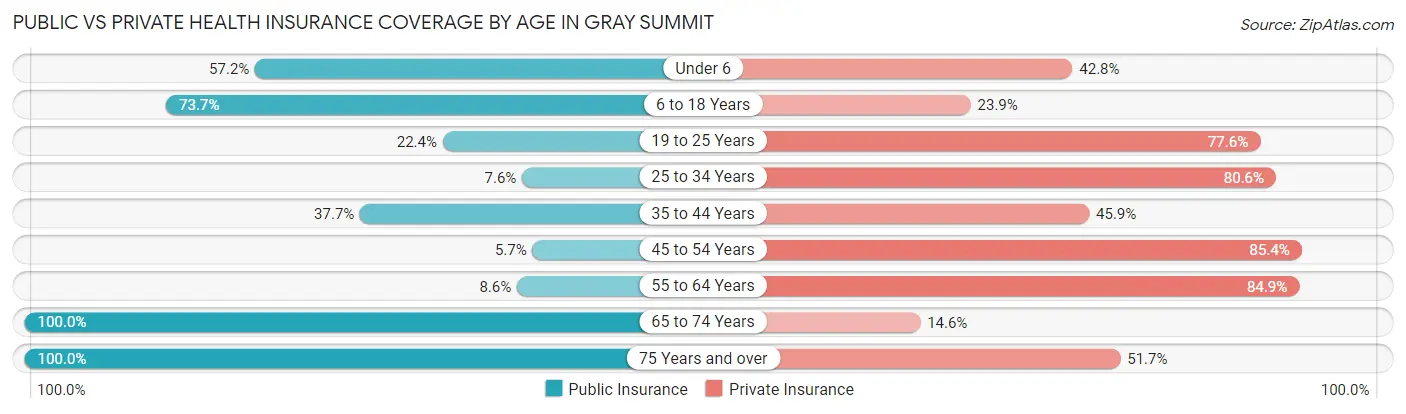
| Age Bracket | Public Insurance | Private Insurance |
| Under 6 | 143 (57.2%) | 107 (42.8%) |
| 6 to 18 Years | 407 (73.7%) | 132 (23.9%) |
| 19 to 25 Years | 32 (22.4%) | 111 (77.6%) |
| 25 to 34 Years | 22 (7.6%) | 232 (80.6%) |
| 35 to 44 Years | 106 (37.7%) | 129 (45.9%) |
| 45 to 54 Years | 25 (5.7%) | 373 (85.4%) |
| 55 to 64 Years | 25 (8.6%) | 247 (84.9%) |
| 65 to 74 Years | 213 (100.0%) | 31 (14.5%) |
| 75 Years and over | 118 (100.0%) | 61 (51.7%) |
| Total | 1,091 (42.4%) | 1,423 (55.3%) |
Disability Status by Sex by Age in Gray Summit
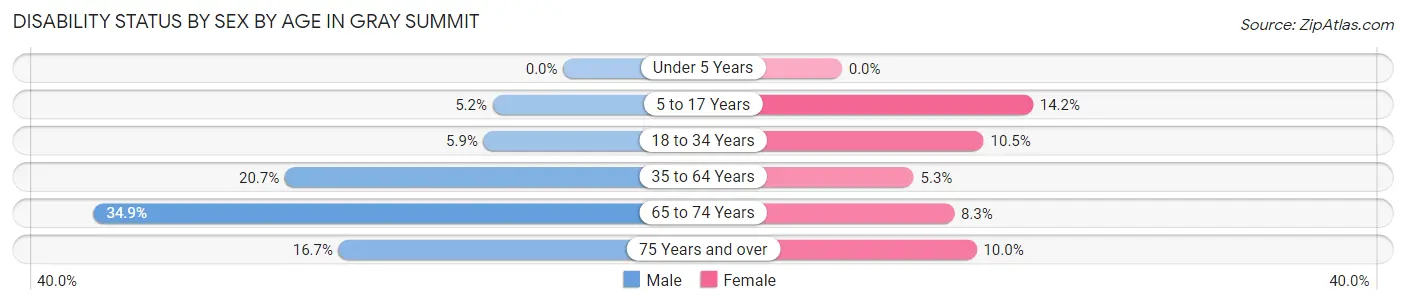
| Age Bracket | Male | Female |
| Under 5 Years | 0 (0.0%) | 0 (0.0%) |
| 5 to 17 Years | 24 (5.2%) | 19 (14.2%) |
| 18 to 34 Years | 14 (5.9%) | 22 (10.5%) |
| 35 to 64 Years | 100 (20.7%) | 28 (5.3%) |
| 65 to 74 Years | 45 (34.9%) | 7 (8.3%) |
| 75 Years and over | 8 (16.7%) | 7 (10.0%) |
Disability Class by Sex by Age in Gray Summit
Disability Class: Hearing Difficulty
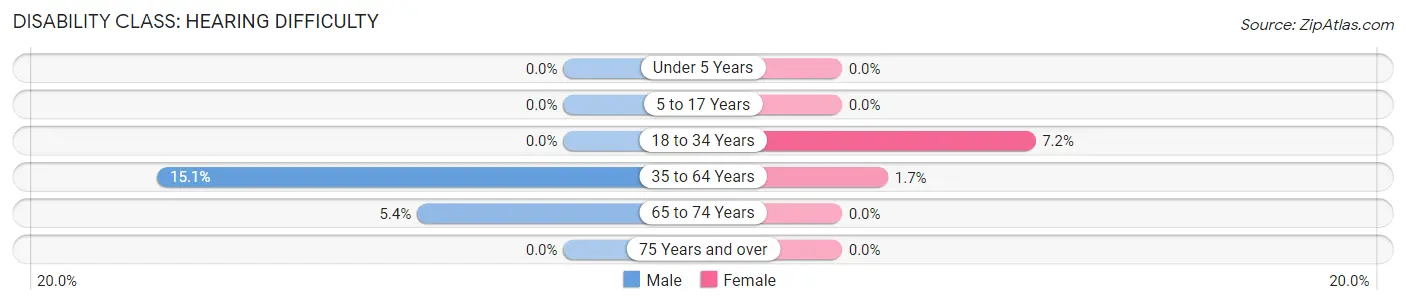
| Age Bracket | Male | Female |
| Under 5 Years | 0 (0.0%) | 0 (0.0%) |
| 5 to 17 Years | 0 (0.0%) | 0 (0.0%) |
| 18 to 34 Years | 0 (0.0%) | 15 (7.2%) |
| 35 to 64 Years | 73 (15.1%) | 9 (1.7%) |
| 65 to 74 Years | 7 (5.4%) | 0 (0.0%) |
| 75 Years and over | 0 (0.0%) | 0 (0.0%) |
Disability Class: Vision Difficulty
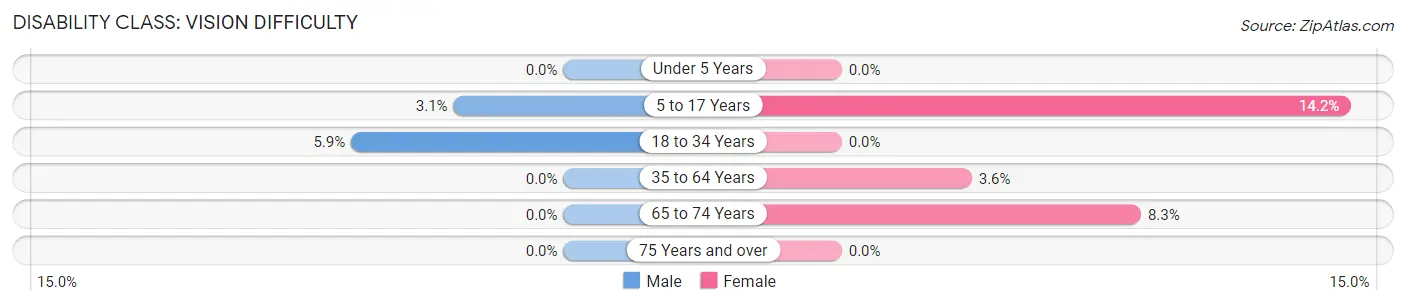
| Age Bracket | Male | Female |
| Under 5 Years | 0 (0.0%) | 0 (0.0%) |
| 5 to 17 Years | 14 (3.1%) | 19 (14.2%) |
| 18 to 34 Years | 14 (5.9%) | 0 (0.0%) |
| 35 to 64 Years | 0 (0.0%) | 19 (3.6%) |
| 65 to 74 Years | 0 (0.0%) | 7 (8.3%) |
| 75 Years and over | 0 (0.0%) | 0 (0.0%) |
Disability Class: Cognitive Difficulty
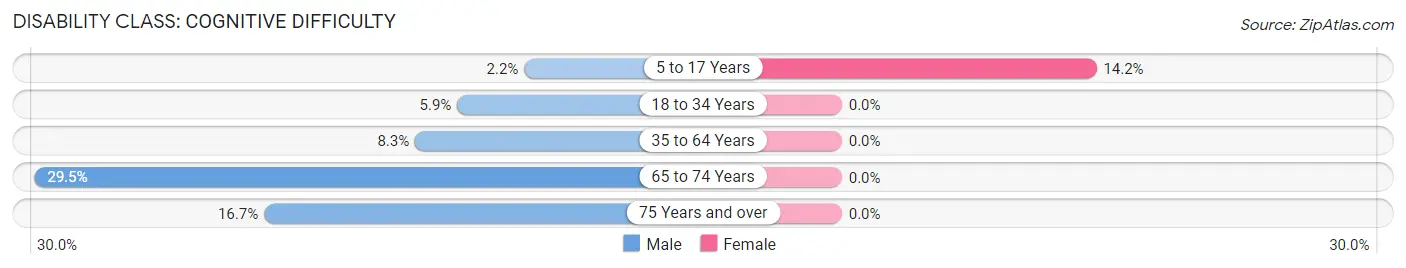
| Age Bracket | Male | Female |
| 5 to 17 Years | 10 (2.2%) | 19 (14.2%) |
| 18 to 34 Years | 14 (5.9%) | 0 (0.0%) |
| 35 to 64 Years | 40 (8.3%) | 0 (0.0%) |
| 65 to 74 Years | 38 (29.5%) | 0 (0.0%) |
| 75 Years and over | 8 (16.7%) | 0 (0.0%) |
Disability Class: Ambulatory Difficulty
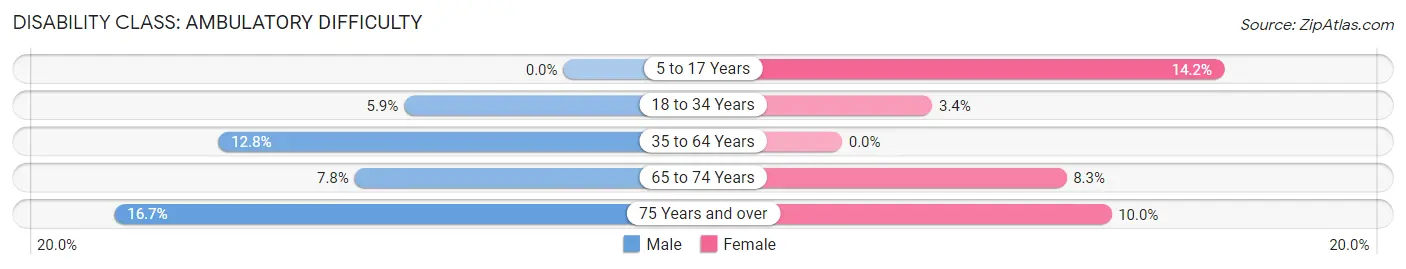
| Age Bracket | Male | Female |
| 5 to 17 Years | 0 (0.0%) | 19 (14.2%) |
| 18 to 34 Years | 14 (5.9%) | 7 (3.4%) |
| 35 to 64 Years | 62 (12.8%) | 0 (0.0%) |
| 65 to 74 Years | 10 (7.7%) | 7 (8.3%) |
| 75 Years and over | 8 (16.7%) | 7 (10.0%) |
Disability Class: Self-Care Difficulty
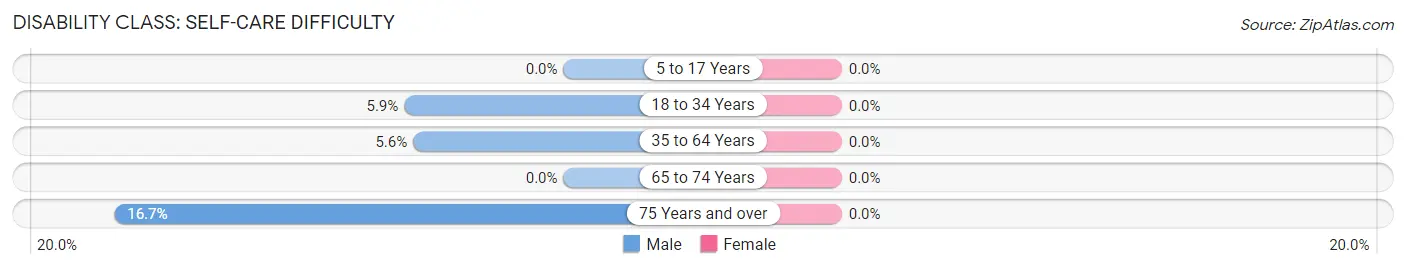
| Age Bracket | Male | Female |
| 5 to 17 Years | 0 (0.0%) | 0 (0.0%) |
| 18 to 34 Years | 14 (5.9%) | 0 (0.0%) |
| 35 to 64 Years | 27 (5.6%) | 0 (0.0%) |
| 65 to 74 Years | 0 (0.0%) | 0 (0.0%) |
| 75 Years and over | 8 (16.7%) | 0 (0.0%) |
Technology Access in Gray Summit
Computing Device Access in Gray Summit
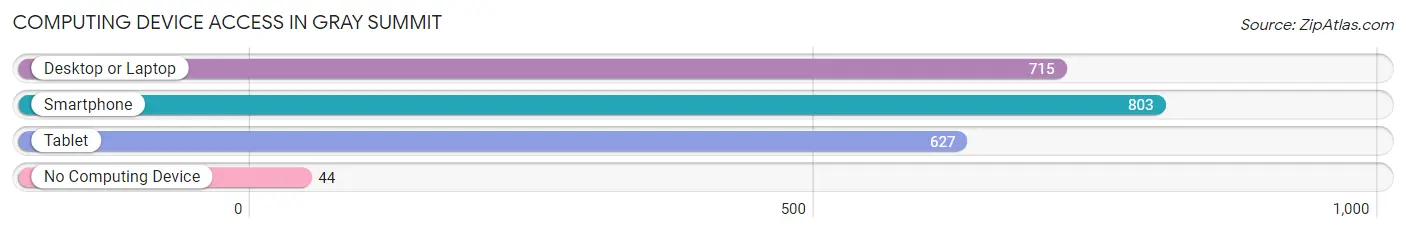
| Device Type | # Households | % Households |
| Desktop or Laptop | 715 | 78.5% |
| Smartphone | 803 | 88.1% |
| Tablet | 627 | 68.8% |
| No Computing Device | 44 | 4.8% |
| Total | 911 | 100.0% |
Internet Access in Gray Summit
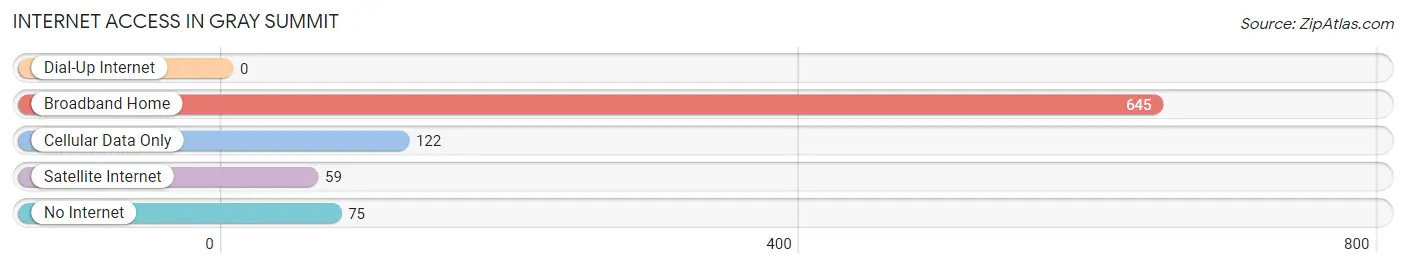
| Internet Type | # Households | % Households |
| Dial-Up Internet | 0 | 0.0% |
| Broadband Home | 645 | 70.8% |
| Cellular Data Only | 122 | 13.4% |
| Satellite Internet | 59 | 6.5% |
| No Internet | 75 | 8.2% |
| Total | 911 | 100.0% |
Gray Summit Summary
Geography
Gray Summit is a small unincorporated community located in Franklin County, Missouri. It is situated in the foothills of the Ozark Mountains, approximately 25 miles southwest of St. Louis. The community is located along Interstate 44, and is bordered by the towns of Pacific and Villa Ridge. The area is characterized by rolling hills, dense forests, and numerous creeks and streams. The climate is humid and subtropical, with hot summers and mild winters.
History
Gray Summit was founded in 1858 by German immigrants who were seeking a new life in the United States. The town was named after the nearby Gray Summit, a peak in the Ozark Mountains. The town quickly grew and became a popular stop for travelers on the St. Louis-San Francisco Railway. The town was also home to a number of businesses, including a hotel, a general store, and a blacksmith shop.
In the early 20th century, Gray Summit began to decline as the railroad industry shifted away from the area. The town was further impacted by the Great Depression, and many of the businesses closed. In the 1950s, the town was revitalized with the construction of Interstate 44, which brought new visitors and businesses to the area.
Economy
Gray Summit is primarily a residential community, with a small number of businesses located in the area. The town is home to a number of small businesses, including a gas station, a convenience store, and a few restaurants. The town is also home to a number of farms, which produce a variety of crops, including corn, soybeans, and hay.
Demographics
As of the 2010 census, the population of Gray Summit was 1,845. The population is primarily white (94.3%), with a small percentage of African Americans (2.2%) and Hispanics (2.2%). The median household income is $50,000, and the median home value is $150,000. The town has a low unemployment rate (3.2%), and a high rate of homeownership (83.3%).
Conclusion
Gray Summit is a small unincorporated community located in Franklin County, Missouri. It is situated in the foothills of the Ozark Mountains, and is bordered by the towns of Pacific and Villa Ridge. The town was founded in 1858 by German immigrants, and was revitalized in the 1950s with the construction of Interstate 44. Today, Gray Summit is primarily a residential community, with a small number of businesses located in the area. The population is primarily white, with a median household income of $50,000 and a median home value of $150,000. The town has a low unemployment rate and a high rate of homeownership.
Common Questions
What is Per Capita Income in Gray Summit?
Per Capita income in Gray Summit is $28,679.
What is the Median Family Income in Gray Summit?
Median Family Income in Gray Summit is $85,385.
What is the Median Household income in Gray Summit?
Median Household Income in Gray Summit is $68,272.
What is Income or Wage Gap in Gray Summit?
Income or Wage Gap in Gray Summit is 18.7%.
Women in Gray Summit earn 81.3 cents for every dollar earned by a man.
What is Inequality or Gini Index in Gray Summit?
Inequality or Gini Index in Gray Summit is 0.37.
What is the Total Population of Gray Summit?
Total Population of Gray Summit is 2,573.
What is the Total Male Population of Gray Summit?
Total Male Population of Gray Summit is 1,465.
What is the Total Female Population of Gray Summit?
Total Female Population of Gray Summit is 1,108.
What is the Ratio of Males per 100 Females in Gray Summit?
There are 132.22 Males per 100 Females in Gray Summit.
What is the Ratio of Females per 100 Males in Gray Summit?
There are 75.63 Females per 100 Males in Gray Summit.
What is the Median Population Age in Gray Summit?
Median Population Age in Gray Summit is 37.2 Years.
What is the Average Family Size in Gray Summit
Average Family Size in Gray Summit is 3.1 People.
What is the Average Household Size in Gray Summit
Average Household Size in Gray Summit is 2.8 People.
How Large is the Labor Force in Gray Summit?
There are 1,228 People in the Labor Forcein in Gray Summit.
What is the Percentage of People in the Labor Force in Gray Summit?
65.8% of People are in the Labor Force in Gray Summit.
What is the Unemployment Rate in Gray Summit?
Unemployment Rate in Gray Summit is 2.5%.