Cities with the Highest Percentage of Households Without a Vehicle in Missouri
RELATED REPORTS & OPTIONS
Households without a Cars
Missouri
Compare Cities
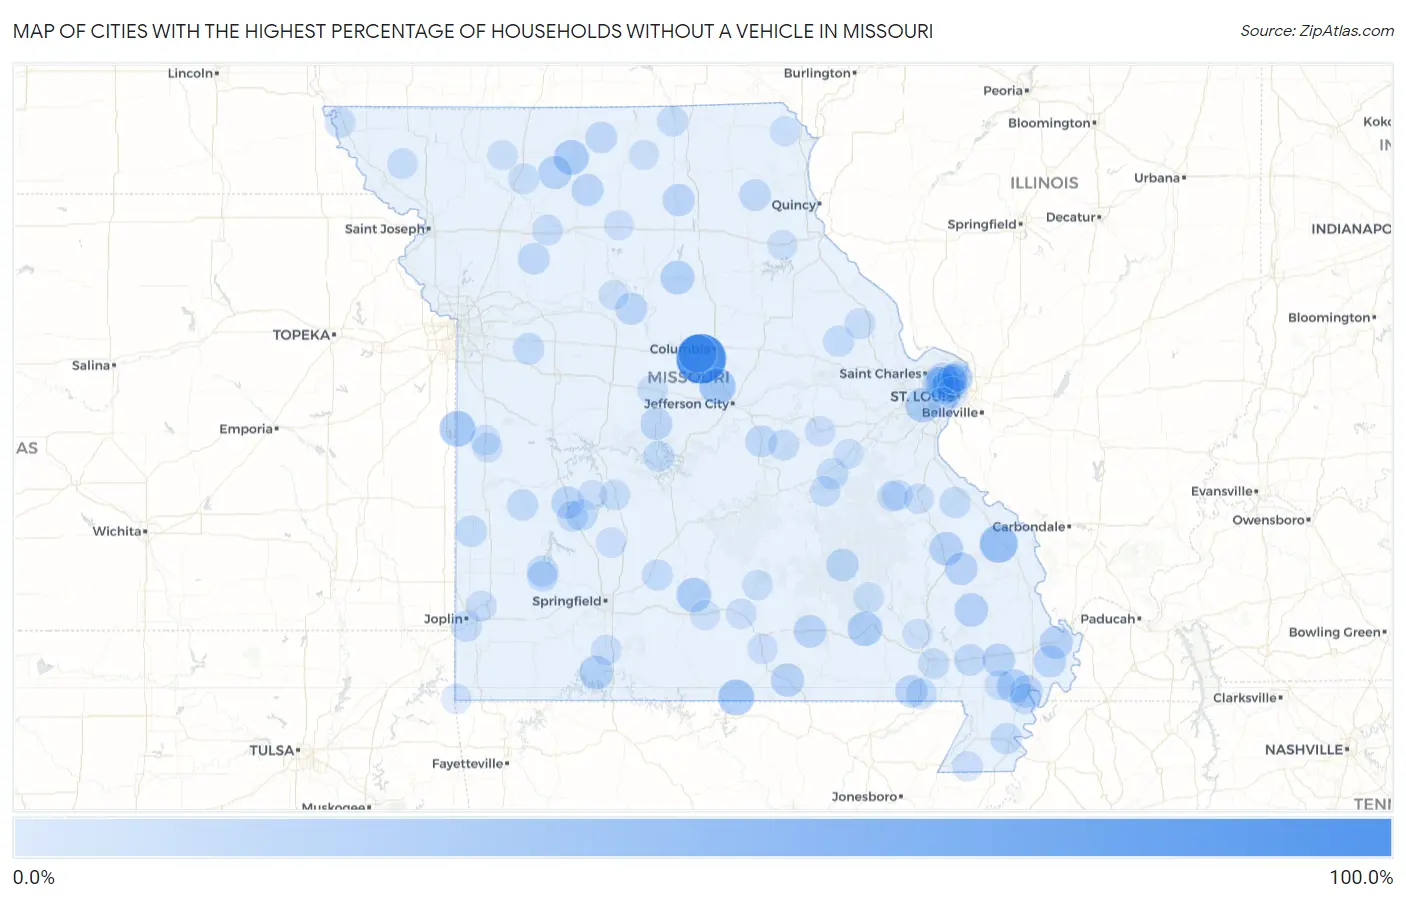
Map of Cities with the Highest Percentage of Households Without a Vehicle in Missouri
0.0%
100.0%
Cities with the Highest Percentage of Households Without a Vehicle in Missouri
| City | Housholds Without a Car | vs State | vs National | |
| 1. | Mcbaine | 100.0% | 6.6%(+93.4)#1 | 8.3%(+91.7)#69 |
| 2. | Huntsdale | 50.0% | 6.6%(+43.4)#2 | 8.3%(+41.7)#240 |
| 3. | Biehle | 47.4% | 6.6%(+40.8)#3 | 8.3%(+39.1)#253 |
| 4. | Hartsburg | 39.7% | 6.6%(+33.1)#4 | 8.3%(+31.4)#348 |
| 5. | Bakersfield | 38.3% | 6.6%(+31.7)#5 | 8.3%(+30.0)#363 |
| 6. | Merwin | 38.1% | 6.6%(+31.5)#6 | 8.3%(+29.8)#369 |
| 7. | Spickard | 34.0% | 6.6%(+27.4)#7 | 8.3%(+25.7)#460 |
| 8. | Van Buren | 33.3% | 6.6%(+26.7)#8 | 8.3%(+25.0)#476 |
| 9. | Twin Oaks | 33.2% | 6.6%(+26.6)#9 | 8.3%(+24.9)#492 |
| 10. | Hartville | 32.5% | 6.6%(+25.9)#10 | 8.3%(+24.2)#510 |
| 11. | Bel Ridge | 29.9% | 6.6%(+23.3)#11 | 8.3%(+21.6)#595 |
| 12. | Flordell Hills | 29.9% | 6.6%(+23.3)#12 | 8.3%(+21.6)#596 |
| 13. | Branson West | 29.9% | 6.6%(+23.3)#13 | 8.3%(+21.6)#597 |
| 14. | Clifton Hill | 29.4% | 6.6%(+22.8)#14 | 8.3%(+21.1)#619 |
| 15. | Catron | 29.2% | 6.6%(+22.6)#15 | 8.3%(+20.9)#630 |
| 16. | Zalma | 28.9% | 6.6%(+22.3)#16 | 8.3%(+20.6)#640 |
| 17. | Junction City | 28.6% | 6.6%(+22.0)#17 | 8.3%(+20.3)#655 |
| 18. | Brandsville | 27.4% | 6.6%(+20.8)#18 | 8.3%(+19.1)#706 |
| 19. | Brimson | 27.3% | 6.6%(+20.7)#19 | 8.3%(+19.0)#710 |
| 20. | Charleston | 26.9% | 6.6%(+20.3)#20 | 8.3%(+18.6)#730 |
| 21. | Marquand | 25.6% | 6.6%(+19.0)#21 | 8.3%(+17.3)#817 |
| 22. | Birch Tree | 25.0% | 6.6%(+18.4)#22 | 8.3%(+16.7)#843 |
| 23. | Penermon | 25.0% | 6.6%(+18.4)#23 | 8.3%(+16.7)#854 |
| 24. | Howardville | 24.4% | 6.6%(+17.8)#24 | 8.3%(+16.1)#897 |
| 25. | Bunker | 24.1% | 6.6%(+17.5)#25 | 8.3%(+15.8)#920 |
| 26. | East Prairie | 24.0% | 6.6%(+17.4)#26 | 8.3%(+15.7)#924 |
| 27. | Jennings | 23.7% | 6.6%(+17.1)#27 | 8.3%(+15.4)#948 |
| 28. | Collins | 23.7% | 6.6%(+17.1)#28 | 8.3%(+15.4)#952 |
| 29. | Naylor | 23.4% | 6.6%(+16.8)#29 | 8.3%(+15.1)#982 |
| 30. | Versailles | 23.2% | 6.6%(+16.6)#30 | 8.3%(+14.9)#996 |
| 31. | Elmer | 23.1% | 6.6%(+16.5)#31 | 8.3%(+14.8)#1,011 |
| 32. | Pine Lawn | 22.3% | 6.6%(+15.7)#32 | 8.3%(+14.0)#1,083 |
| 33. | Laredo | 22.2% | 6.6%(+15.6)#33 | 8.3%(+13.9)#1,099 |
| 34. | Slater | 22.1% | 6.6%(+15.5)#34 | 8.3%(+13.8)#1,104 |
| 35. | Berkeley | 22.0% | 6.6%(+15.4)#35 | 8.3%(+13.7)#1,117 |
| 36. | Freeburg | 21.7% | 6.6%(+15.1)#36 | 8.3%(+13.4)#1,159 |
| 37. | Pagedale | 21.3% | 6.6%(+14.7)#37 | 8.3%(+13.0)#1,211 |
| 38. | Newtown | 21.1% | 6.6%(+14.5)#38 | 8.3%(+12.8)#1,247 |
| 39. | Dudley | 20.8% | 6.6%(+14.2)#39 | 8.3%(+12.5)#1,293 |
| 40. | Cowgill | 20.7% | 6.6%(+14.1)#40 | 8.3%(+12.4)#1,312 |
| 41. | Newark | 20.7% | 6.6%(+14.1)#41 | 8.3%(+12.4)#1,313 |
| 42. | Riverview | 20.5% | 6.6%(+13.9)#42 | 8.3%(+12.2)#1,332 |
| 43. | Hayti Heights | 20.2% | 6.6%(+13.6)#43 | 8.3%(+11.9)#1,376 |
| 44. | Lake Lafayette | 20.0% | 6.6%(+13.4)#44 | 8.3%(+11.7)#1,402 |
| 45. | Bronaugh | 20.0% | 6.6%(+13.4)#45 | 8.3%(+11.7)#1,410 |
| 46. | Flemington | 20.0% | 6.6%(+13.4)#46 | 8.3%(+11.7)#1,414 |
| 47. | Leasburg | 19.7% | 6.6%(+13.1)#47 | 8.3%(+11.4)#1,461 |
| 48. | El Dorado Springs | 19.6% | 6.6%(+13.0)#48 | 8.3%(+11.3)#1,476 |
| 49. | Breckenridge Hills | 19.2% | 6.6%(+12.6)#49 | 8.3%(+10.9)#1,547 |
| 50. | Greenfield | 19.0% | 6.6%(+12.4)#50 | 8.3%(+10.7)#1,583 |
| 51. | Weingarten | 18.8% | 6.6%(+12.2)#51 | 8.3%(+10.5)#1,630 |
| 52. | St Louis | 18.5% | 6.6%(+11.9)#52 | 8.3%(+10.2)#1,667 |
| 53. | Humansville | 18.4% | 6.6%(+11.8)#53 | 8.3%(+10.1)#1,699 |
| 54. | Niangua | 18.3% | 6.6%(+11.7)#54 | 8.3%(+10.00)#1,718 |
| 55. | Cliff Village | 18.2% | 6.6%(+11.6)#55 | 8.3%(+9.90)#1,746 |
| 56. | South Greenfield | 17.9% | 6.6%(+11.3)#56 | 8.3%(+9.60)#1,813 |
| 57. | Truxton | 17.9% | 6.6%(+11.3)#57 | 8.3%(+9.60)#1,815 |
| 58. | Poplar Bluff | 17.8% | 6.6%(+11.2)#58 | 8.3%(+9.50)#1,817 |
| 59. | Laurie | 17.8% | 6.6%(+11.2)#59 | 8.3%(+9.50)#1,832 |
| 60. | Marston | 17.8% | 6.6%(+11.2)#60 | 8.3%(+9.50)#1,837 |
| 61. | Neelyville | 17.8% | 6.6%(+11.2)#61 | 8.3%(+9.50)#1,841 |
| 62. | Coffey | 17.6% | 6.6%(+11.0)#62 | 8.3%(+9.30)#1,884 |
| 63. | Brooklyn Heights | 17.6% | 6.6%(+11.0)#63 | 8.3%(+9.30)#1,885 |
| 64. | Belle | 17.3% | 6.6%(+10.7)#64 | 8.3%(+9.00)#1,957 |
| 65. | Mineral Point | 17.2% | 6.6%(+10.6)#65 | 8.3%(+8.90)#1,983 |
| 66. | Silex | 17.2% | 6.6%(+10.6)#66 | 8.3%(+8.90)#1,984 |
| 67. | Watson | 17.1% | 6.6%(+10.5)#67 | 8.3%(+8.80)#2,011 |
| 68. | Ellington | 17.0% | 6.6%(+10.4)#68 | 8.3%(+8.70)#2,026 |
| 69. | Breckenridge | 16.7% | 6.6%(+10.1)#69 | 8.3%(+8.40)#2,109 |
| 70. | Livonia | 16.7% | 6.6%(+10.1)#70 | 8.3%(+8.40)#2,131 |
| 71. | Preston | 16.5% | 6.6%(+9.90)#71 | 8.3%(+8.20)#2,176 |
| 72. | Steelville | 16.4% | 6.6%(+9.80)#72 | 8.3%(+8.10)#2,201 |
| 73. | Maitland | 16.4% | 6.6%(+9.80)#73 | 8.3%(+8.10)#2,210 |
| 74. | Spokane | 16.2% | 6.6%(+9.60)#74 | 8.3%(+7.90)#2,276 |
| 75. | Potosi | 16.0% | 6.6%(+9.40)#75 | 8.3%(+7.70)#2,317 |
| 76. | Glasgow Village | 15.9% | 6.6%(+9.30)#76 | 8.3%(+7.60)#2,341 |
| 77. | Cabool | 15.9% | 6.6%(+9.30)#77 | 8.3%(+7.60)#2,345 |
| 78. | Parma | 15.8% | 6.6%(+9.20)#78 | 8.3%(+7.50)#2,403 |
| 79. | Passaic | 15.8% | 6.6%(+9.20)#79 | 8.3%(+7.50)#2,414 |
| 80. | Houston | 15.7% | 6.6%(+9.10)#80 | 8.3%(+7.40)#2,430 |
| 81. | Rosebud | 15.5% | 6.6%(+8.90)#81 | 8.3%(+7.20)#2,518 |
| 82. | Syracuse | 15.5% | 6.6%(+8.90)#82 | 8.3%(+7.20)#2,522 |
| 83. | Bonne Terre | 15.4% | 6.6%(+8.80)#83 | 8.3%(+7.10)#2,534 |
| 84. | Pomona | 15.3% | 6.6%(+8.70)#84 | 8.3%(+7.00)#2,600 |
| 85. | Halfway | 15.3% | 6.6%(+8.70)#85 | 8.3%(+7.00)#2,603 |
| 86. | Moline Acres | 15.1% | 6.6%(+8.50)#86 | 8.3%(+6.80)#2,650 |
| 87. | Hornersville | 15.0% | 6.6%(+8.40)#87 | 8.3%(+6.70)#2,697 |
| 88. | Southwest City | 14.8% | 6.6%(+8.20)#88 | 8.3%(+6.50)#2,766 |
| 89. | Norwood | 14.7% | 6.6%(+8.10)#89 | 8.3%(+6.40)#2,809 |
| 90. | Green City | 14.7% | 6.6%(+8.10)#90 | 8.3%(+6.40)#2,812 |
| 91. | Monroe City | 14.6% | 6.6%(+8.00)#91 | 8.3%(+6.30)#2,833 |
| 92. | Kahoka | 14.6% | 6.6%(+8.00)#92 | 8.3%(+6.30)#2,838 |
| 93. | Butler | 14.4% | 6.6%(+7.80)#93 | 8.3%(+6.10)#2,926 |
| 94. | Laclede | 14.4% | 6.6%(+7.80)#94 | 8.3%(+6.10)#2,958 |
| 95. | Wheatland | 14.4% | 6.6%(+7.80)#95 | 8.3%(+6.10)#2,959 |
| 96. | Williamsville | 14.3% | 6.6%(+7.70)#96 | 8.3%(+6.00)#2,992 |
| 97. | Miami | 14.3% | 6.6%(+7.70)#97 | 8.3%(+6.00)#2,998 |
| 98. | Shrewsbury | 14.2% | 6.6%(+7.60)#98 | 8.3%(+5.90)#3,015 |
| 99. | New Hampton | 14.2% | 6.6%(+7.60)#99 | 8.3%(+5.90)#3,042 |
| 100. | Oak Grove Village | 14.1% | 6.6%(+7.50)#100 | 8.3%(+5.80)#3,083 |
Common Questions
What are the Top 10 Cities with the Highest Percentage of Households Without a Vehicle in Missouri?
Top 10 Cities with the Highest Percentage of Households Without a Vehicle in Missouri are:
What city has the Highest Percentage of Households Without a Vehicle in Missouri?
McBaine has the Highest Percentage of Households Without a Vehicle in Missouri with 100.0%.
What is the Percentage of Households Without a Vehicle in the State of Missouri?
Percentage of Households Without a Vehicle in Missouri is 6.6%.
What is the Percentage of Households Without a Vehicle in the United States?
Percentage of Households Without a Vehicle in the United States is 8.3%.