Ozark, MO Map & Demographics
Ozark Map
Ozark Overview
$30,317
PER CAPITA INCOME
$82,538
AVG FAMILY INCOME
$66,631
AVG HOUSEHOLD INCOME
24.0%
WAGE / INCOME GAP [ % ]
76.0¢/ $1
WAGE / INCOME GAP [ $ ]
$14,226
FAMILY INCOME DEFICIT
0.38
INEQUALITY / GINI INDEX
21,459
TOTAL POPULATION
10,278
MALE POPULATION
11,181
FEMALE POPULATION
91.92
MALES / 100 FEMALES
108.79
FEMALES / 100 MALES
33.1
MEDIAN AGE
3.1
AVG FAMILY SIZE
2.6
AVG HOUSEHOLD SIZE
10,679
LABOR FORCE [ PEOPLE ]
67.0%
PERCENT IN LABOR FORCE
3.6%
UNEMPLOYMENT RATE
Ozark Zip Codes
Ozark Area Codes
Income in Ozark
Income Overview in Ozark
Per Capita Income in Ozark is $30,317, while median incomes of families and households are $82,538 and $66,631 respectively.
| Characteristic | Number | Measure |
| Per Capita Income | 21,459 | $30,317 |
| Median Family Income | 5,593 | $82,538 |
| Mean Family Income | 5,593 | $89,238 |
| Median Household Income | 8,179 | $66,631 |
| Mean Household Income | 8,179 | $79,132 |
| Income Deficit | 5,593 | $14,226 |
| Wage / Income Gap (%) | 21,459 | 23.98% |
| Wage / Income Gap ($) | 21,459 | 76.02¢ per $1 |
| Gini / Inequality Index | 21,459 | 0.38 |
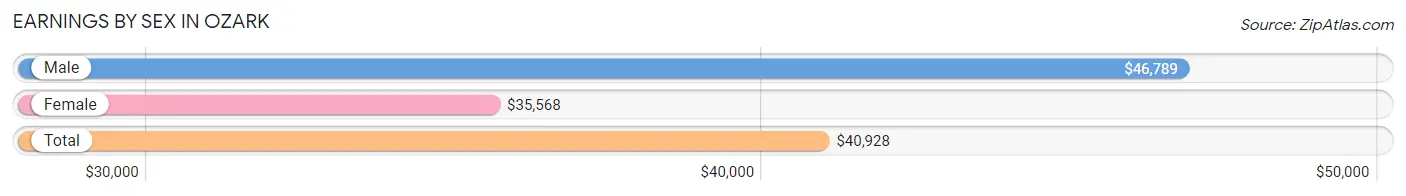
Earnings by Sex in Ozark
Average Earnings in Ozark are $40,928, $46,789 for men and $35,568 for women, a difference of 24.0%.
| Sex | Number | Average Earnings |
| Male | 5,832 (53.0%) | $46,789 |
| Female | 5,167 (47.0%) | $35,568 |
| Total | 10,999 (100.0%) | $40,928 |
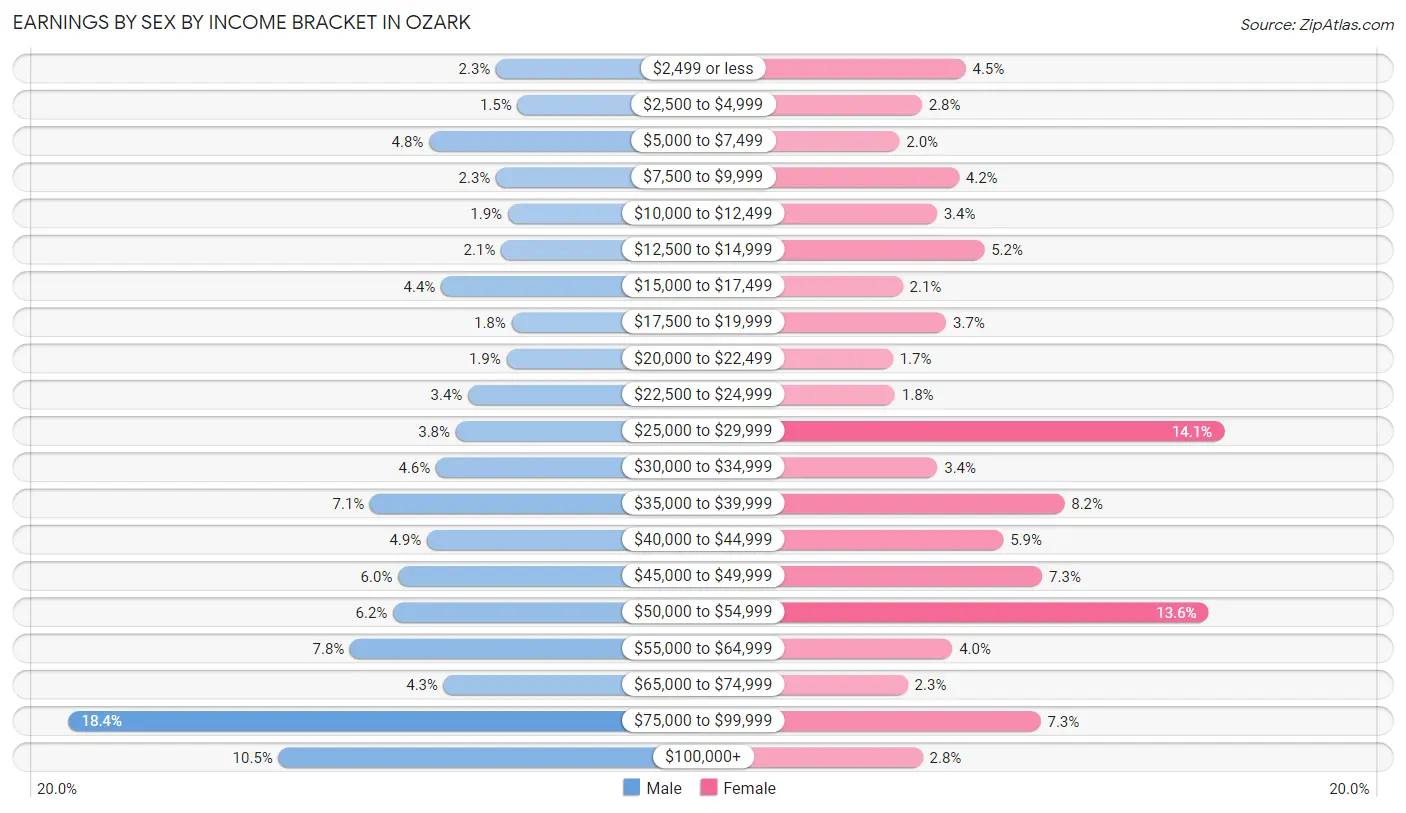
Earnings by Sex by Income Bracket in Ozark
The most common earnings brackets in Ozark are $75,000 to $99,999 for men (1,070 | 18.3%) and $25,000 to $29,999 for women (730 | 14.1%).
| Income | Male | Female |
| $2,499 or less | 136 (2.3%) | 230 (4.4%) |
| $2,500 to $4,999 | 89 (1.5%) | 145 (2.8%) |
| $5,000 to $7,499 | 282 (4.8%) | 102 (2.0%) |
| $7,500 to $9,999 | 136 (2.3%) | 217 (4.2%) |
| $10,000 to $12,499 | 110 (1.9%) | 174 (3.4%) |
| $12,500 to $14,999 | 125 (2.1%) | 266 (5.1%) |
| $15,000 to $17,499 | 256 (4.4%) | 108 (2.1%) |
| $17,500 to $19,999 | 102 (1.8%) | 192 (3.7%) |
| $20,000 to $22,499 | 113 (1.9%) | 89 (1.7%) |
| $22,500 to $24,999 | 197 (3.4%) | 93 (1.8%) |
| $25,000 to $29,999 | 224 (3.8%) | 730 (14.1%) |
| $30,000 to $34,999 | 267 (4.6%) | 175 (3.4%) |
| $35,000 to $39,999 | 411 (7.0%) | 421 (8.2%) |
| $40,000 to $44,999 | 287 (4.9%) | 303 (5.9%) |
| $45,000 to $49,999 | 350 (6.0%) | 378 (7.3%) |
| $50,000 to $54,999 | 361 (6.2%) | 700 (13.6%) |
| $55,000 to $64,999 | 455 (7.8%) | 204 (4.0%) |
| $65,000 to $74,999 | 250 (4.3%) | 118 (2.3%) |
| $75,000 to $99,999 | 1,070 (18.3%) | 375 (7.3%) |
| $100,000+ | 611 (10.5%) | 147 (2.8%) |
| Total | 5,832 (100.0%) | 5,167 (100.0%) |
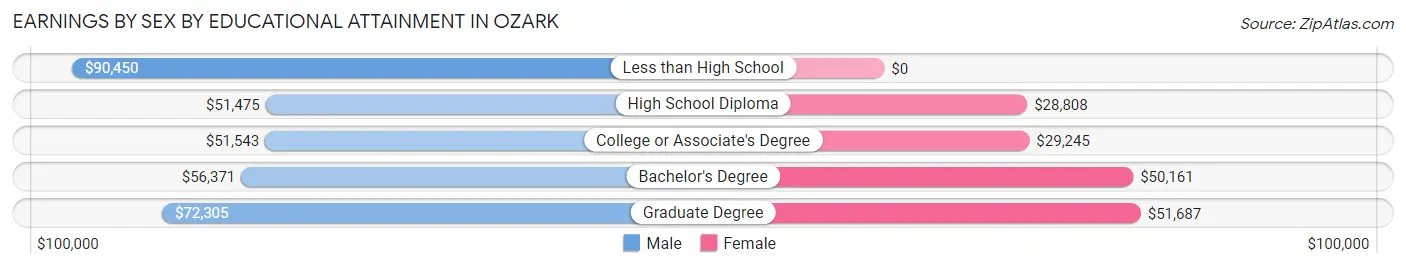
Earnings by Sex by Educational Attainment in Ozark
Average earnings in Ozark are $55,459 for men and $40,017 for women, a difference of 27.8%. Men with an educational attainment of less than high school enjoy the highest average annual earnings of $90,450, while those with high school diploma education earn the least with $51,475. Women with an educational attainment of graduate degree earn the most with the average annual earnings of $51,687, while those with high school diploma education have the smallest earnings of $28,808.
| Educational Attainment | Male Income | Female Income |
| Less than High School | $90,450 | $0 |
| High School Diploma | $51,475 | $28,808 |
| College or Associate's Degree | $51,543 | $29,245 |
| Bachelor's Degree | $56,371 | $50,161 |
| Graduate Degree | $72,305 | $51,687 |
| Total | $55,459 | $40,017 |
Family Income in Ozark
Family Income Brackets in Ozark
According to the Ozark family income data, there are 1,342 families falling into the $100,000 to $149,999 income range, which is the most common income bracket and makes up 24.0% of all families. Conversely, the $10,000 to $14,999 income bracket is the least frequent group with only 89 families (1.6%) belonging to this category.
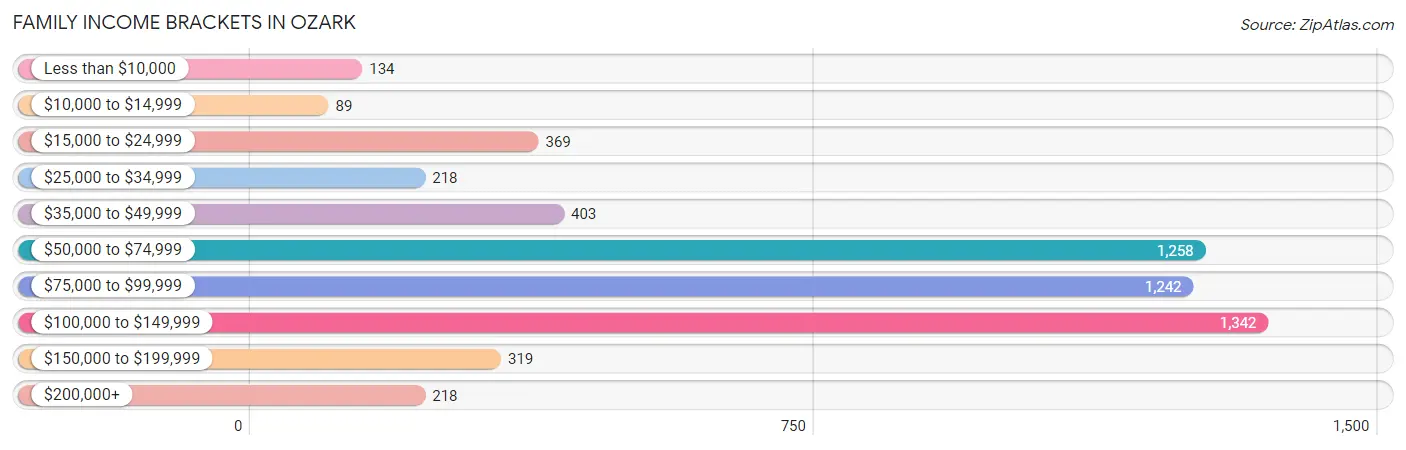
| Income Bracket | # Families | % Families |
| Less than $10,000 | 134 | 2.4% |
| $10,000 to $14,999 | 89 | 1.6% |
| $15,000 to $24,999 | 369 | 6.6% |
| $25,000 to $34,999 | 218 | 3.9% |
| $35,000 to $49,999 | 403 | 7.2% |
| $50,000 to $74,999 | 1,258 | 22.5% |
| $75,000 to $99,999 | 1,242 | 22.2% |
| $100,000 to $149,999 | 1,342 | 24.0% |
| $150,000 to $199,999 | 319 | 5.7% |
| $200,000+ | 218 | 3.9% |
Family Income by Famaliy Size in Ozark
4-person families (1,412 | 25.3%) account for the highest median family income in Ozark with $101,178 per family, while 2-person families (2,473 | 44.2%) have the highest median income of $35,625 per family member.
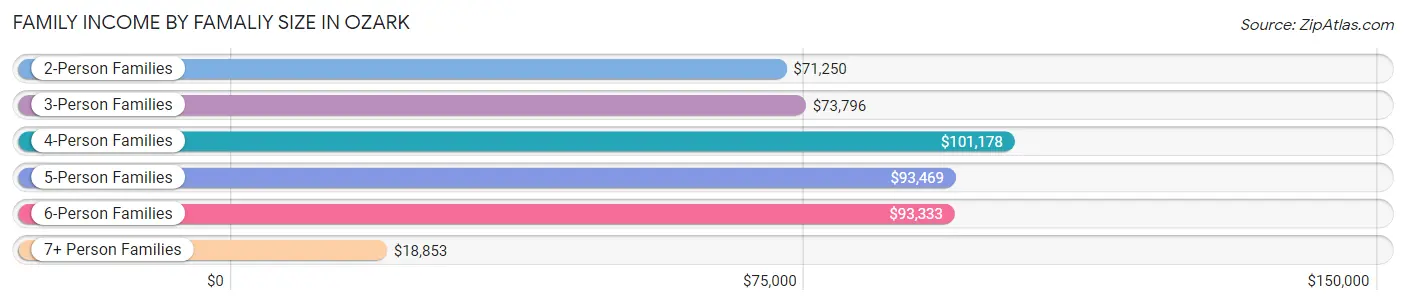
| Income Bracket | # Families | Median Income |
| 2-Person Families | 2,473 (44.2%) | $71,250 |
| 3-Person Families | 990 (17.7%) | $73,796 |
| 4-Person Families | 1,412 (25.3%) | $101,178 |
| 5-Person Families | 435 (7.8%) | $93,469 |
| 6-Person Families | 112 (2.0%) | $93,333 |
| 7+ Person Families | 171 (3.1%) | $18,853 |
| Total | 5,593 (100.0%) | $82,538 |
Family Income by Number of Earners in Ozark
The median family income in Ozark is $82,538, with families comprising 2 earners (2,124) having the highest median family income of $104,926, while families with no earners (641) have the lowest median family income of $47,083, accounting for 38.0% and 11.5% of families, respectively.
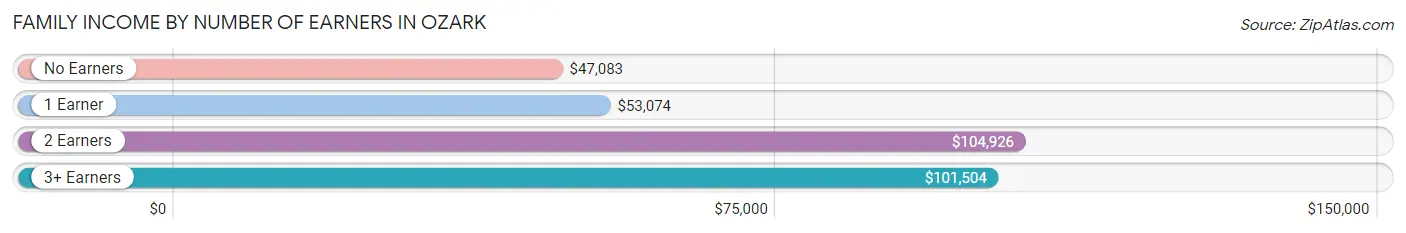
| Number of Earners | # Families | Median Income |
| No Earners | 641 (11.5%) | $47,083 |
| 1 Earner | 2,180 (39.0%) | $53,074 |
| 2 Earners | 2,124 (38.0%) | $104,926 |
| 3+ Earners | 648 (11.6%) | $101,504 |
| Total | 5,593 (100.0%) | $82,538 |
Household Income in Ozark
Household Income Brackets in Ozark
With 1,848 households falling in the category, the $50,000 to $74,999 income range is the most frequent in Ozark, accounting for 22.6% of all households. In contrast, only 294 households (3.6%) fall into the less than $10,000 income bracket, making it the least populous group.
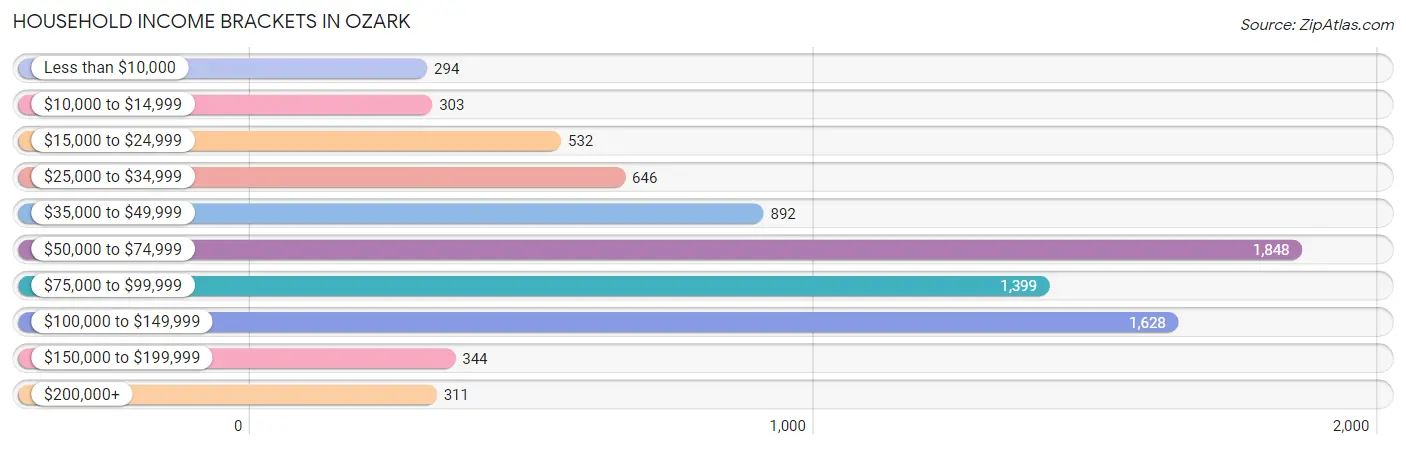
| Income Bracket | # Households | % Households |
| Less than $10,000 | 294 | 3.6% |
| $10,000 to $14,999 | 303 | 3.7% |
| $15,000 to $24,999 | 532 | 6.5% |
| $25,000 to $34,999 | 646 | 7.9% |
| $35,000 to $49,999 | 892 | 10.9% |
| $50,000 to $74,999 | 1,848 | 22.6% |
| $75,000 to $99,999 | 1,399 | 17.1% |
| $100,000 to $149,999 | 1,628 | 19.9% |
| $150,000 to $199,999 | 344 | 4.2% |
| $200,000+ | 311 | 3.8% |
Household Income by Householder Age in Ozark
The median household income in Ozark is $66,631, with the highest median household income of $79,162 found in the 25 to 44 years age bracket for the primary householder. A total of 3,353 households (41.0%) fall into this category. Meanwhile, the 15 to 24 years age bracket for the primary householder has the lowest median household income of $35,602, with 399 households (4.9%) in this group.
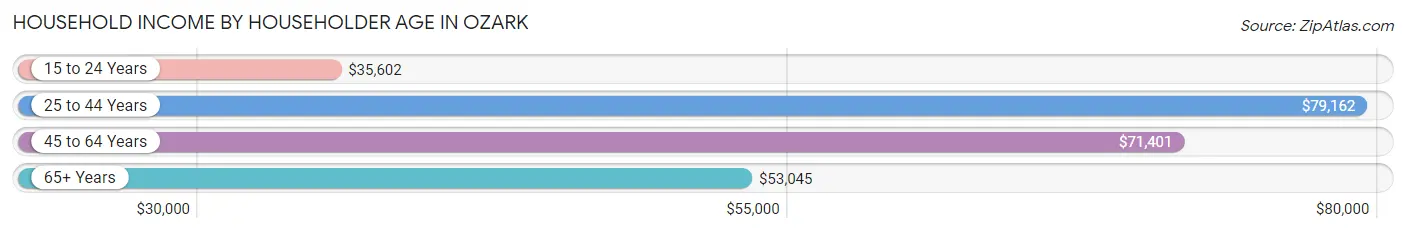
| Income Bracket | # Households | Median Income |
| 15 to 24 Years | 399 (4.9%) | $35,602 |
| 25 to 44 Years | 3,353 (41.0%) | $79,162 |
| 45 to 64 Years | 2,696 (33.0%) | $71,401 |
| 65+ Years | 1,731 (21.2%) | $53,045 |
| Total | 8,179 (100.0%) | $66,631 |
Poverty in Ozark
Income Below Poverty by Sex and Age in Ozark
With 10.9% poverty level for males and 14.3% for females among the residents of Ozark, 5 year old males and 12 to 14 year old females are the most vulnerable to poverty, with 95 males (52.8%) and 286 females (41.6%) in their respective age groups living below the poverty level.
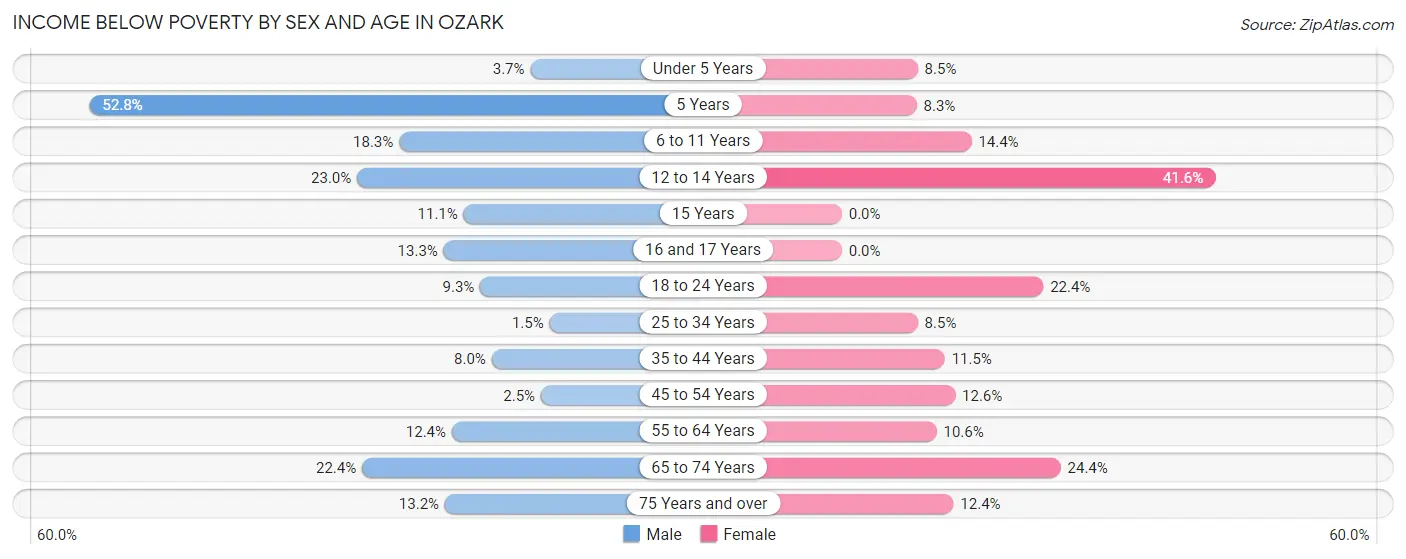
| Age Bracket | Male | Female |
| Under 5 Years | 19 (3.7%) | 83 (8.5%) |
| 5 Years | 95 (52.8%) | 7 (8.3%) |
| 6 to 11 Years | 171 (18.3%) | 133 (14.4%) |
| 12 to 14 Years | 167 (23.0%) | 286 (41.6%) |
| 15 Years | 18 (11.1%) | 0 (0.0%) |
| 16 and 17 Years | 48 (13.3%) | 0 (0.0%) |
| 18 to 24 Years | 96 (9.3%) | 168 (22.4%) |
| 25 to 34 Years | 25 (1.5%) | 130 (8.5%) |
| 35 to 44 Years | 107 (8.0%) | 184 (11.5%) |
| 45 to 54 Years | 31 (2.5%) | 144 (12.6%) |
| 55 to 64 Years | 79 (12.4%) | 145 (10.5%) |
| 65 to 74 Years | 180 (22.4%) | 202 (24.4%) |
| 75 Years and over | 55 (13.2%) | 85 (12.4%) |
| Total | 1,091 (10.9%) | 1,567 (14.3%) |
Income Above Poverty by Sex and Age in Ozark
According to the poverty statistics in Ozark, males aged 25 to 34 years and females aged 15 years are the age groups that are most secure financially, with 98.5% of males and 100.0% of females in these age groups living above the poverty line.
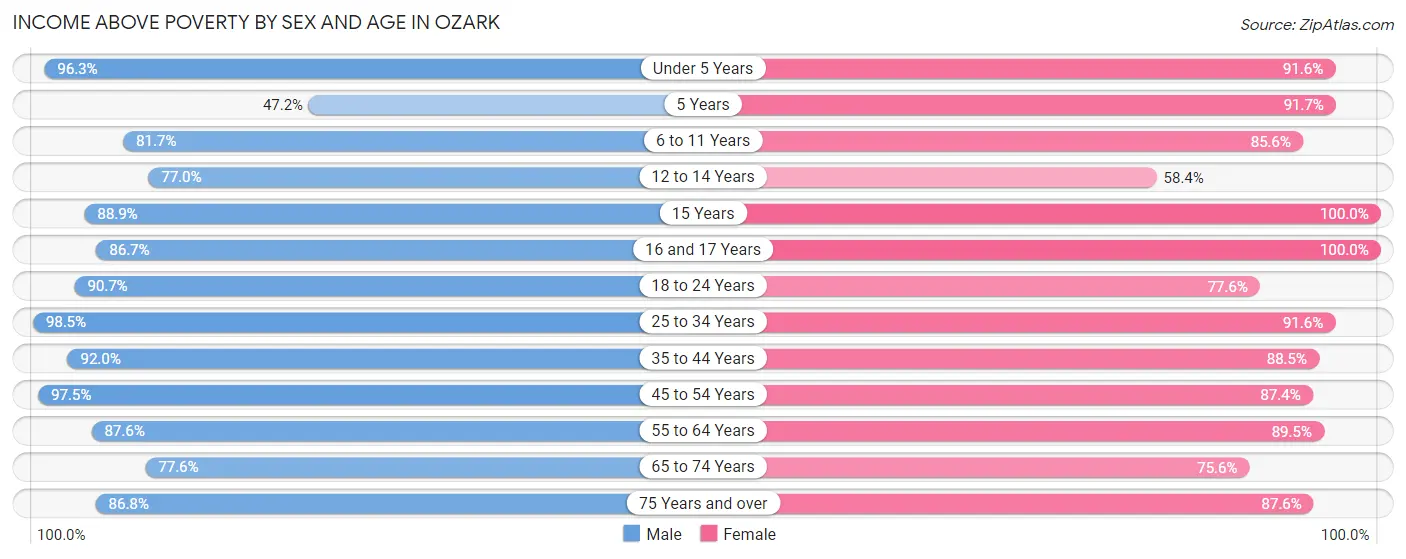
| Age Bracket | Male | Female |
| Under 5 Years | 499 (96.3%) | 899 (91.5%) |
| 5 Years | 85 (47.2%) | 77 (91.7%) |
| 6 to 11 Years | 764 (81.7%) | 788 (85.6%) |
| 12 to 14 Years | 560 (77.0%) | 402 (58.4%) |
| 15 Years | 144 (88.9%) | 123 (100.0%) |
| 16 and 17 Years | 312 (86.7%) | 254 (100.0%) |
| 18 to 24 Years | 941 (90.7%) | 581 (77.6%) |
| 25 to 34 Years | 1,594 (98.5%) | 1,409 (91.5%) |
| 35 to 44 Years | 1,234 (92.0%) | 1,422 (88.5%) |
| 45 to 54 Years | 1,208 (97.5%) | 997 (87.4%) |
| 55 to 64 Years | 557 (87.6%) | 1,229 (89.4%) |
| 65 to 74 Years | 623 (77.6%) | 627 (75.6%) |
| 75 Years and over | 362 (86.8%) | 599 (87.6%) |
| Total | 8,883 (89.1%) | 9,407 (85.7%) |
Income Below Poverty Among Married-Couple Families in Ozark
The poverty statistics for married-couple families in Ozark show that 6.3% or 251 of the total 3,994 families live below the poverty line. Families with 5 or more children have the highest poverty rate of 100.0%, comprising of 7 families. On the other hand, families with 1 or 2 children have the lowest poverty rate of 1.7%, which includes 29 families.
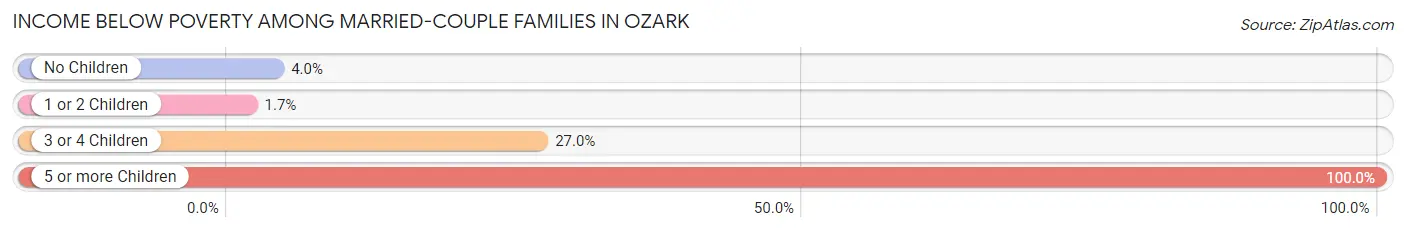
| Children | Above Poverty | Below Poverty |
| No Children | 1,670 (96.0%) | 70 (4.0%) |
| 1 or 2 Children | 1,681 (98.3%) | 29 (1.7%) |
| 3 or 4 Children | 392 (73.0%) | 145 (27.0%) |
| 5 or more Children | 0 (0.0%) | 7 (100.0%) |
| Total | 3,743 (93.7%) | 251 (6.3%) |
Income Below Poverty Among Single-Parent Households in Ozark
According to the poverty data in Ozark, 18.6% or 72 single-father households and 15.5% or 188 single-mother households are living below the poverty line. Among single-father households, those with 3 or 4 children have the highest poverty rate, with 32 households (78.0%) experiencing poverty. Likewise, among single-mother households, those with 1 or 2 children have the highest poverty rate, with 169 households (17.3%) falling below the poverty line.
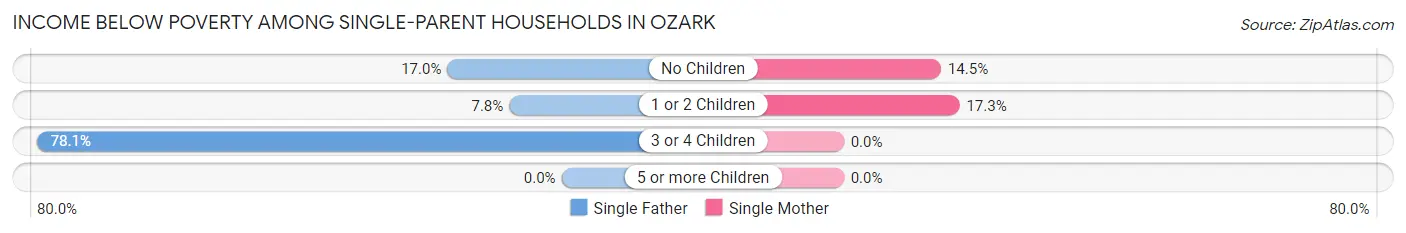
| Children | Single Father | Single Mother |
| No Children | 24 (17.0%) | 19 (14.5%) |
| 1 or 2 Children | 16 (7.8%) | 169 (17.3%) |
| 3 or 4 Children | 32 (78.0%) | 0 (0.0%) |
| 5 or more Children | 0 (0.0%) | 0 (0.0%) |
| Total | 72 (18.6%) | 188 (15.5%) |
Income Below Poverty Among Married-Couple vs Single-Parent Households in Ozark
The poverty data for Ozark shows that 251 of the married-couple family households (6.3%) and 260 of the single-parent households (16.3%) are living below the poverty level. Within the married-couple family households, those with 5 or more children have the highest poverty rate, with 7 households (100.0%) falling below the poverty line. Among the single-parent households, those with 3 or 4 children have the highest poverty rate, with 32 household (22.4%) living below poverty.
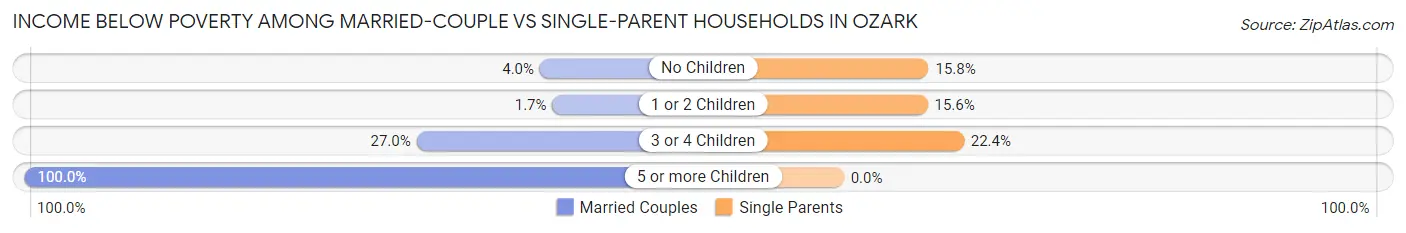
| Children | Married-Couple Families | Single-Parent Households |
| No Children | 70 (4.0%) | 43 (15.8%) |
| 1 or 2 Children | 29 (1.7%) | 185 (15.6%) |
| 3 or 4 Children | 145 (27.0%) | 32 (22.4%) |
| 5 or more Children | 7 (100.0%) | 0 (0.0%) |
| Total | 251 (6.3%) | 260 (16.3%) |
Race in Ozark
The most populous races in Ozark are White / Caucasian (19,484 | 90.8%), Two or more Races (1,190 | 5.6%), and Hispanic or Latino (963 | 4.5%).
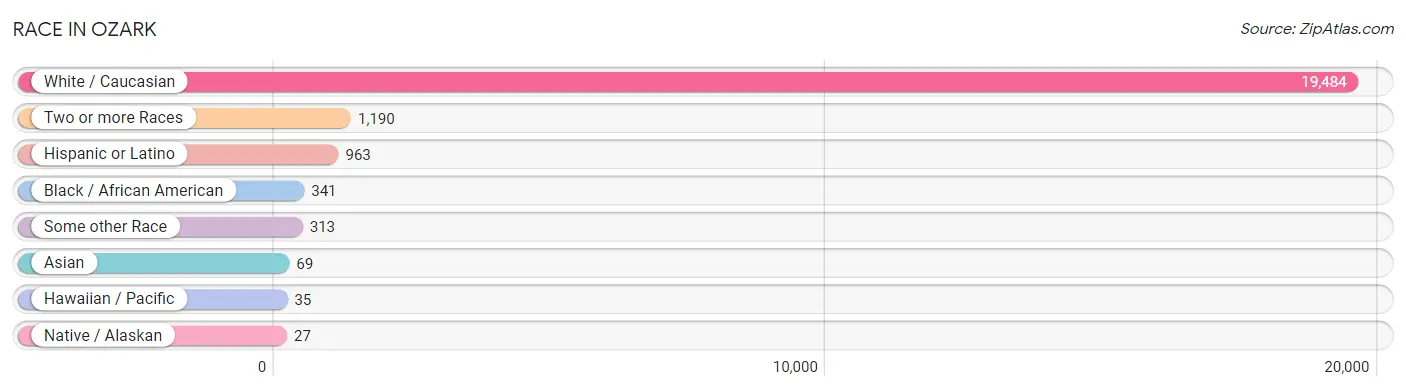
| Race | # Population | % Population |
| Asian | 69 | 0.3% |
| Black / African American | 341 | 1.6% |
| Hawaiian / Pacific | 35 | 0.2% |
| Hispanic or Latino | 963 | 4.5% |
| Native / Alaskan | 27 | 0.1% |
| White / Caucasian | 19,484 | 90.8% |
| Two or more Races | 1,190 | 5.6% |
| Some other Race | 313 | 1.5% |
| Total | 21,459 | 100.0% |
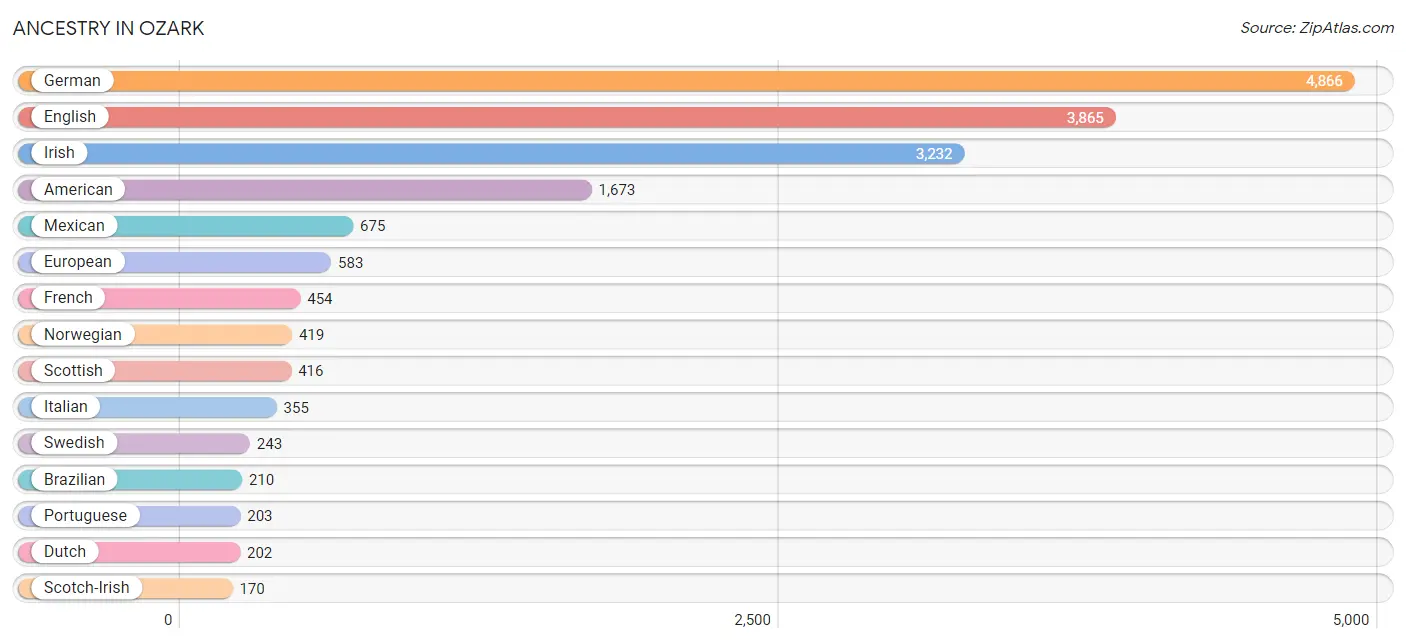
Ancestry in Ozark
The most populous ancestries reported in Ozark are German (4,866 | 22.7%), English (3,865 | 18.0%), Irish (3,232 | 15.1%), American (1,673 | 7.8%), and Mexican (675 | 3.2%), together accounting for 66.7% of all Ozark residents.
| Ancestry | # Population | % Population |
| African | 62 | 0.3% |
| American | 1,673 | 7.8% |
| Bhutanese | 20 | 0.1% |
| Brazilian | 210 | 1.0% |
| British | 127 | 0.6% |
| Burmese | 37 | 0.2% |
| Canadian | 90 | 0.4% |
| Central American | 35 | 0.2% |
| Cherokee | 102 | 0.5% |
| Croatian | 30 | 0.1% |
| Czech | 107 | 0.5% |
| Czechoslovakian | 17 | 0.1% |
| Danish | 20 | 0.1% |
| Dutch | 202 | 0.9% |
| Eastern European | 43 | 0.2% |
| Ecuadorian | 45 | 0.2% |
| English | 3,865 | 18.0% |
| European | 583 | 2.7% |
| Finnish | 49 | 0.2% |
| French | 454 | 2.1% |
| French Canadian | 26 | 0.1% |
| German | 4,866 | 22.7% |
| Greek | 45 | 0.2% |
| Guamanian / Chamorro | 35 | 0.2% |
| Guatemalan | 35 | 0.2% |
| Haitian | 23 | 0.1% |
| Hungarian | 20 | 0.1% |
| Irish | 3,232 | 15.1% |
| Italian | 355 | 1.7% |
| Korean | 67 | 0.3% |
| Mexican | 675 | 3.2% |
| Norwegian | 419 | 1.9% |
| Pennsylvania German | 24 | 0.1% |
| Polish | 157 | 0.7% |
| Portuguese | 203 | 0.9% |
| Puerto Rican | 127 | 0.6% |
| Romanian | 21 | 0.1% |
| Russian | 57 | 0.3% |
| Scandinavian | 31 | 0.1% |
| Scotch-Irish | 170 | 0.8% |
| Scottish | 416 | 1.9% |
| Sioux | 1 | 0.0% |
| South American | 45 | 0.2% |
| Spaniard | 7 | 0.0% |
| Spanish | 74 | 0.3% |
| Sri Lankan | 2 | 0.0% |
| Subsaharan African | 62 | 0.3% |
| Swedish | 243 | 1.1% |
| Swiss | 99 | 0.5% |
| Trinidadian and Tobagonian | 36 | 0.2% |
| Ukrainian | 106 | 0.5% |
| Welsh | 9 | 0.0% | View All 52 Rows |
Immigrants in Ozark
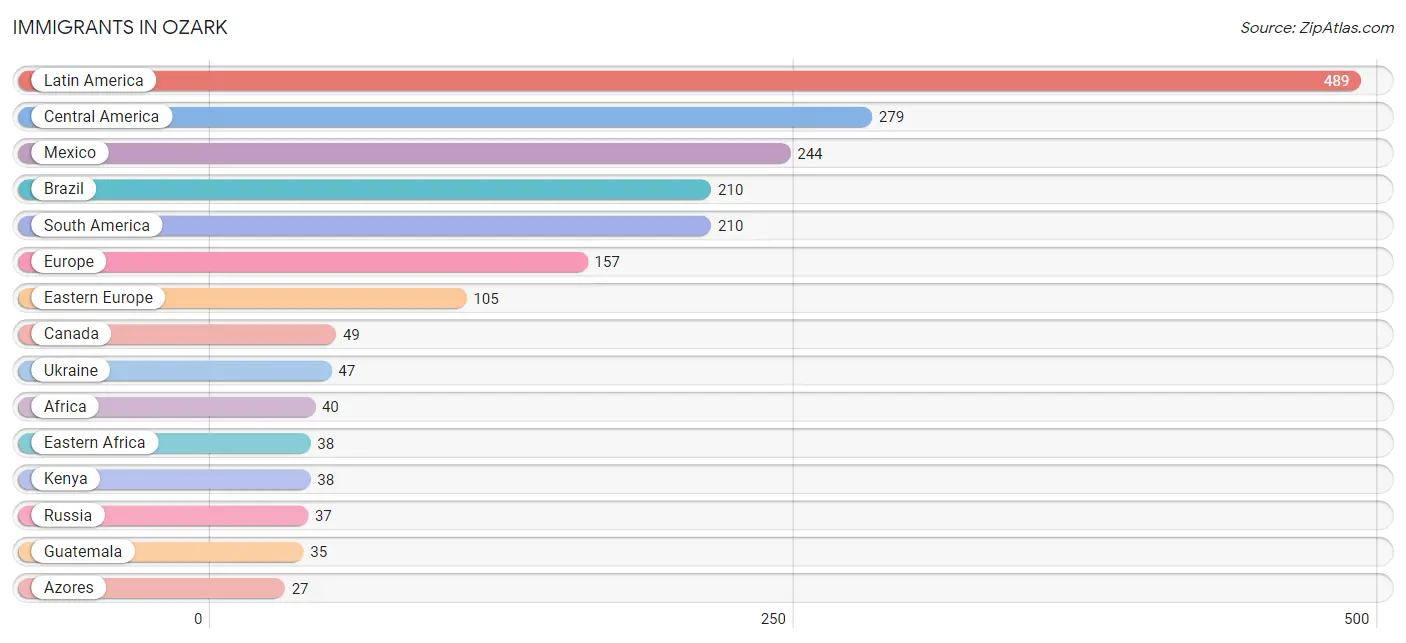
The most numerous immigrant groups reported in Ozark came from Latin America (489 | 2.3%), Central America (279 | 1.3%), Mexico (244 | 1.1%), Brazil (210 | 1.0%), and South America (210 | 1.0%), together accounting for 6.7% of all Ozark residents.
| Immigration Origin | # Population | % Population |
| Africa | 40 | 0.2% |
| Asia | 11 | 0.1% |
| Azores | 27 | 0.1% |
| Brazil | 210 | 1.0% |
| Canada | 49 | 0.2% |
| Central America | 279 | 1.3% |
| Eastern Africa | 38 | 0.2% |
| Eastern Asia | 9 | 0.0% |
| Eastern Europe | 105 | 0.5% |
| Europe | 157 | 0.7% |
| Guatemala | 35 | 0.2% |
| Kenya | 38 | 0.2% |
| Korea | 9 | 0.0% |
| Latin America | 489 | 2.3% |
| Mexico | 244 | 1.1% |
| Moldova | 21 | 0.1% |
| Netherlands | 4 | 0.0% |
| Nigeria | 2 | 0.0% |
| Northern Europe | 21 | 0.1% |
| Portugal | 27 | 0.1% |
| Russia | 37 | 0.2% |
| Scotland | 21 | 0.1% |
| South America | 210 | 1.0% |
| South Eastern Asia | 2 | 0.0% |
| Southern Europe | 27 | 0.1% |
| Ukraine | 47 | 0.2% |
| Vietnam | 2 | 0.0% |
| Western Africa | 2 | 0.0% |
| Western Europe | 4 | 0.0% | View All 29 Rows |
Sex and Age in Ozark
Sex and Age in Ozark
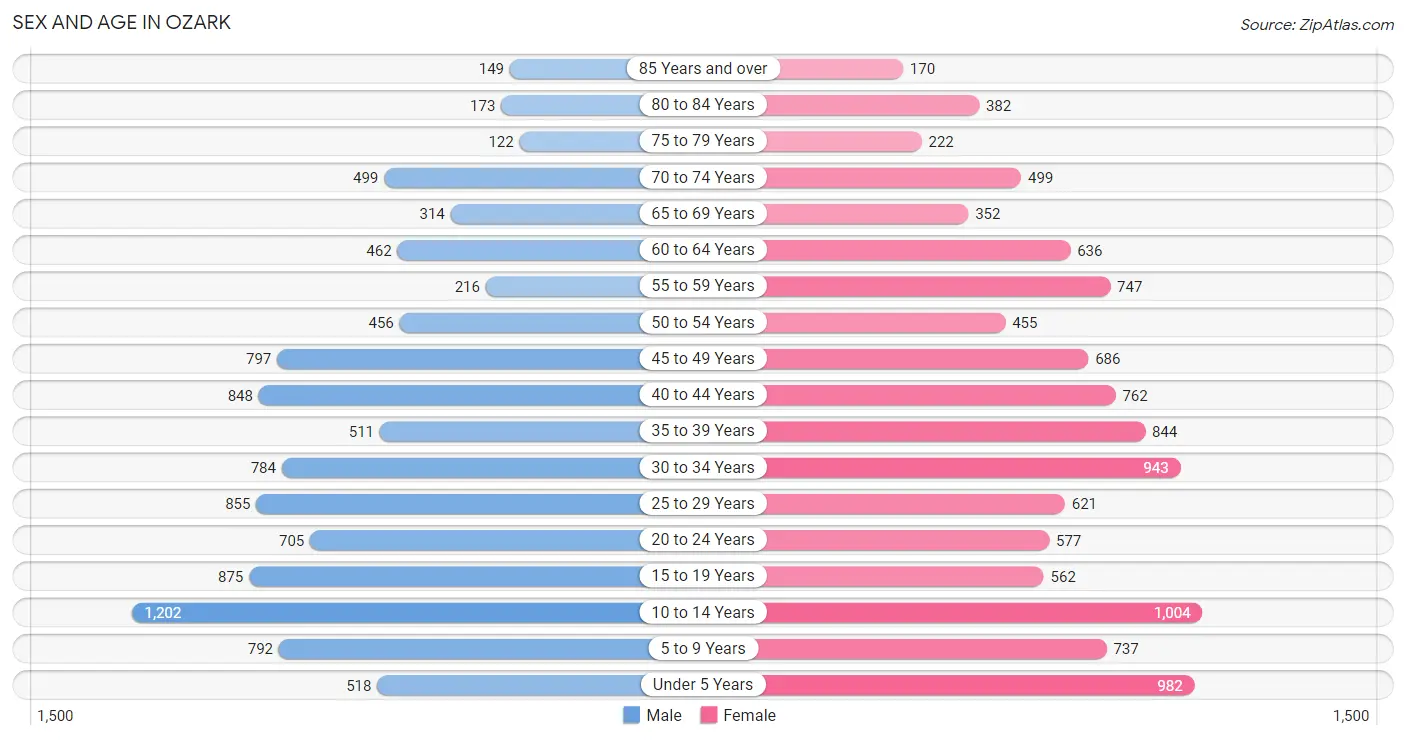
The most populous age groups in Ozark are 10 to 14 Years (1,202 | 11.7%) for men and 10 to 14 Years (1,004 | 9.0%) for women.
| Age Bracket | Male | Female |
| Under 5 Years | 518 (5.0%) | 982 (8.8%) |
| 5 to 9 Years | 792 (7.7%) | 737 (6.6%) |
| 10 to 14 Years | 1,202 (11.7%) | 1,004 (9.0%) |
| 15 to 19 Years | 875 (8.5%) | 562 (5.0%) |
| 20 to 24 Years | 705 (6.9%) | 577 (5.2%) |
| 25 to 29 Years | 855 (8.3%) | 621 (5.6%) |
| 30 to 34 Years | 784 (7.6%) | 943 (8.4%) |
| 35 to 39 Years | 511 (5.0%) | 844 (7.5%) |
| 40 to 44 Years | 848 (8.3%) | 762 (6.8%) |
| 45 to 49 Years | 797 (7.7%) | 686 (6.1%) |
| 50 to 54 Years | 456 (4.4%) | 455 (4.1%) |
| 55 to 59 Years | 216 (2.1%) | 747 (6.7%) |
| 60 to 64 Years | 462 (4.5%) | 636 (5.7%) |
| 65 to 69 Years | 314 (3.1%) | 352 (3.2%) |
| 70 to 74 Years | 499 (4.9%) | 499 (4.5%) |
| 75 to 79 Years | 122 (1.2%) | 222 (2.0%) |
| 80 to 84 Years | 173 (1.7%) | 382 (3.4%) |
| 85 Years and over | 149 (1.5%) | 170 (1.5%) |
| Total | 10,278 (100.0%) | 11,181 (100.0%) |
Families and Households in Ozark
Median Family Size in Ozark
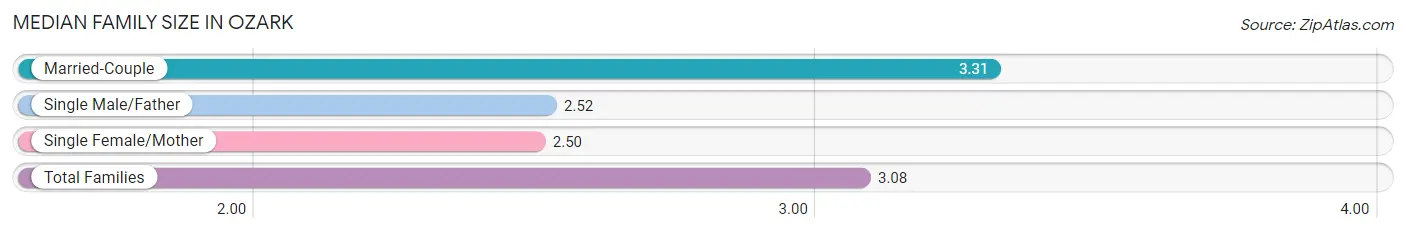
The median family size in Ozark is 3.08 persons per family, with married-couple families (3,994 | 71.4%) accounting for the largest median family size of 3.31 persons per family. On the other hand, single female/mother families (1,212 | 21.7%) represent the smallest median family size with 2.50 persons per family.
| Family Type | # Families | Family Size |
| Married-Couple | 3,994 (71.4%) | 3.31 |
| Single Male/Father | 387 (6.9%) | 2.52 |
| Single Female/Mother | 1,212 (21.7%) | 2.50 |
| Total Families | 5,593 (100.0%) | 3.08 |
Median Household Size in Ozark
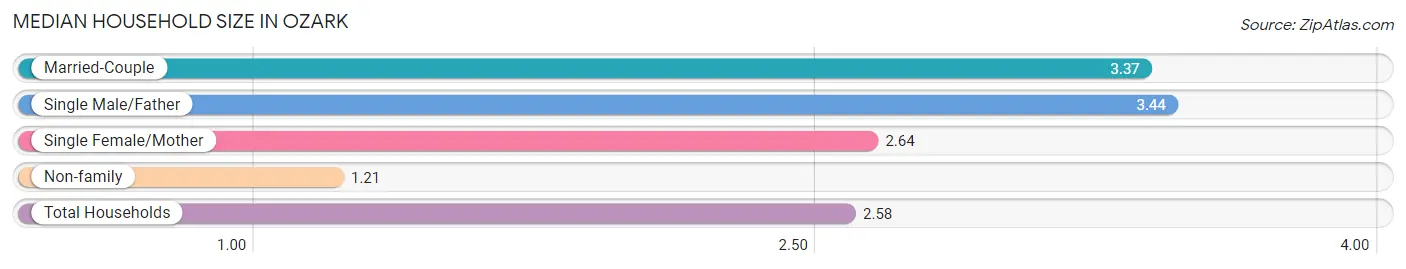
The median household size in Ozark is 2.58 persons per household, with single male/father households (387 | 4.7%) accounting for the largest median household size of 3.44 persons per household. non-family households (2,586 | 31.6%) represent the smallest median household size with 1.21 persons per household.
| Household Type | # Households | Household Size |
| Married-Couple | 3,994 (48.8%) | 3.37 |
| Single Male/Father | 387 (4.7%) | 3.44 |
| Single Female/Mother | 1,212 (14.8%) | 2.64 |
| Non-family | 2,586 (31.6%) | 1.21 |
| Total Households | 8,179 (100.0%) | 2.58 |
Household Size by Marriage Status in Ozark
Out of a total of 8,179 households in Ozark, 5,593 (68.4%) are family households, while 2,586 (31.6%) are nonfamily households. The most numerous type of family households are 2-person households, comprising 2,281, and the most common type of nonfamily households are 1-person households, comprising 2,234.
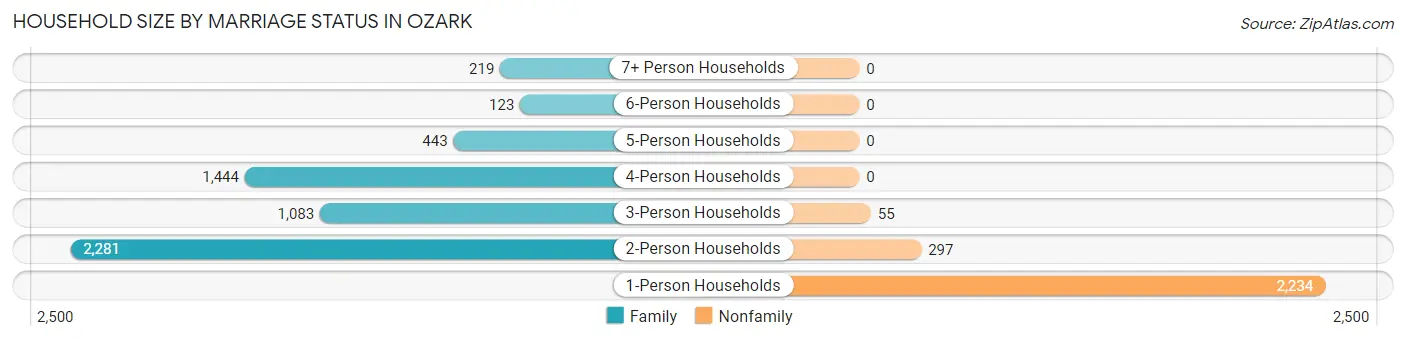
| Household Size | Family Households | Nonfamily Households |
| 1-Person Households | - | 2,234 (27.3%) |
| 2-Person Households | 2,281 (27.9%) | 297 (3.6%) |
| 3-Person Households | 1,083 (13.2%) | 55 (0.7%) |
| 4-Person Households | 1,444 (17.6%) | 0 (0.0%) |
| 5-Person Households | 443 (5.4%) | 0 (0.0%) |
| 6-Person Households | 123 (1.5%) | 0 (0.0%) |
| 7+ Person Households | 219 (2.7%) | 0 (0.0%) |
| Total | 5,593 (68.4%) | 2,586 (31.6%) |
Female Fertility in Ozark
Fertility by Age in Ozark
Average fertility rate in Ozark is 36.0 births per 1,000 women. Women in the age bracket of 20 to 34 years have the highest fertility rate with 59.0 births per 1,000 women. Women in the age bracket of 20 to 34 years acount for 69.2% of all women with births.
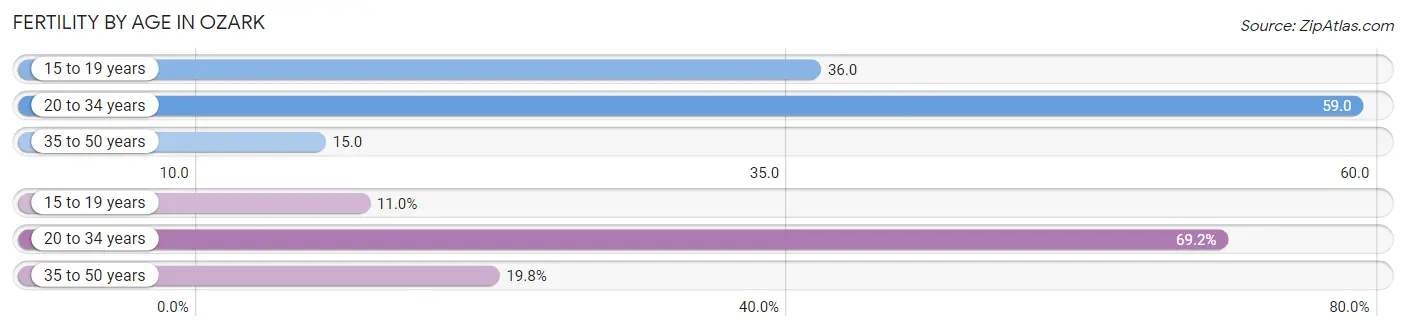
| Age Bracket | Women with Births | Births / 1,000 Women |
| 15 to 19 years | 20 (11.0%) | 36.0 |
| 20 to 34 years | 126 (69.2%) | 59.0 |
| 35 to 50 years | 36 (19.8%) | 15.0 |
| Total | 182 (100.0%) | 36.0 |
Fertility by Age by Marriage Status in Ozark
89.0% of women with births (182) in Ozark are married. The highest percentage of unmarried women with births falls into 15 to 19 years age bracket with 100.0% of them unmarried at the time of birth, while the lowest percentage of unmarried women with births belong to 20 to 34 years age bracket with 0.0% of them unmarried.
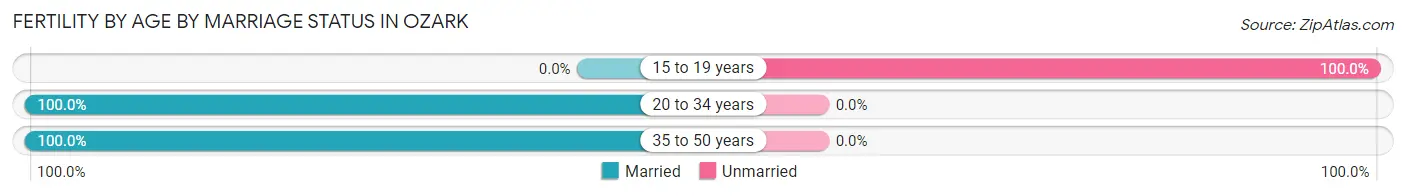
| Age Bracket | Married | Unmarried |
| 15 to 19 years | 0 (0.0%) | 20 (100.0%) |
| 20 to 34 years | 126 (100.0%) | 0 (0.0%) |
| 35 to 50 years | 36 (100.0%) | 0 (0.0%) |
| Total | 162 (89.0%) | 20 (11.0%) |
Fertility by Education in Ozark
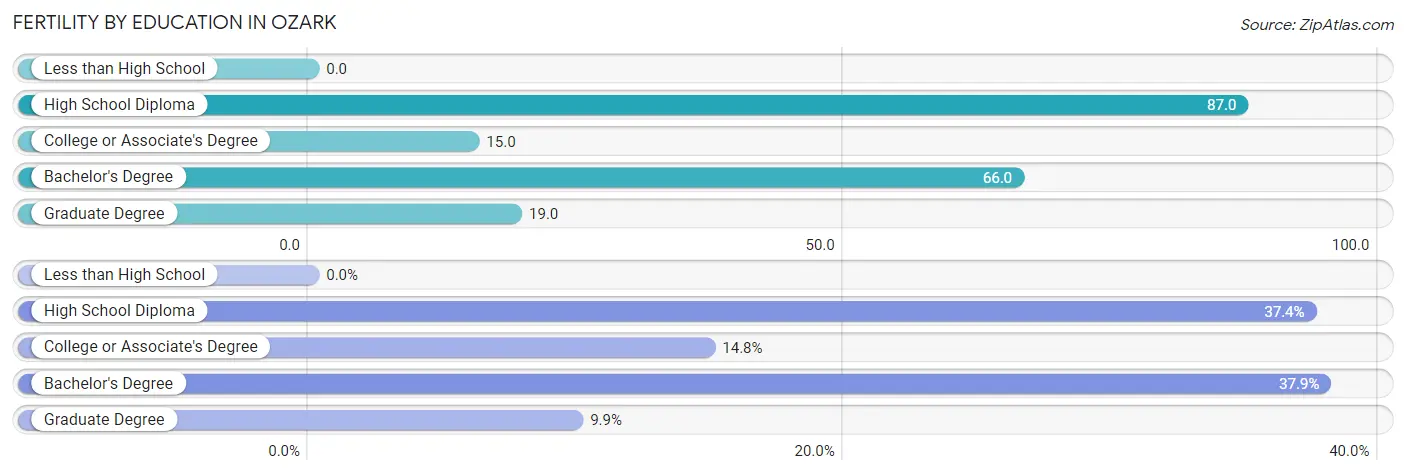
| Educational Attainment | Women with Births | Births / 1,000 Women |
| Less than High School | 0 (0.0%) | 0.0 |
| High School Diploma | 68 (37.4%) | 87.0 |
| College or Associate's Degree | 27 (14.8%) | 15.0 |
| Bachelor's Degree | 69 (37.9%) | 66.0 |
| Graduate Degree | 18 (9.9%) | 19.0 |
| Total | 182 (100.0%) | 36.0 |
Fertility by Education by Marriage Status in Ozark
11.0% of women with births in Ozark are unmarried. Women with the educational attainment of college or associate's degree are most likely to be married with 100.0% of them married at childbirth, while women with the educational attainment of high school diploma are least likely to be married with 29.4% of them unmarried at childbirth.
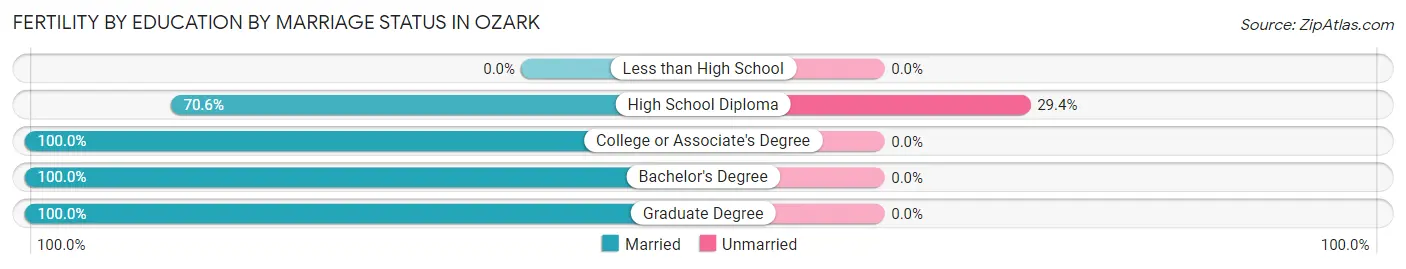
| Educational Attainment | Married | Unmarried |
| Less than High School | 0 (0.0%) | 0 (0.0%) |
| High School Diploma | 48 (70.6%) | 20 (29.4%) |
| College or Associate's Degree | 27 (100.0%) | 0 (0.0%) |
| Bachelor's Degree | 69 (100.0%) | 0 (0.0%) |
| Graduate Degree | 18 (100.0%) | 0 (0.0%) |
| Total | 162 (89.0%) | 20 (11.0%) |
Employment Characteristics in Ozark
Employment by Class of Employer in Ozark
Among the 10,188 employed individuals in Ozark, private company employees (6,324 | 62.1%), not-for-profit organizations (1,594 | 15.7%), and local government employees (686 | 6.7%) make up the most common classes of employment.
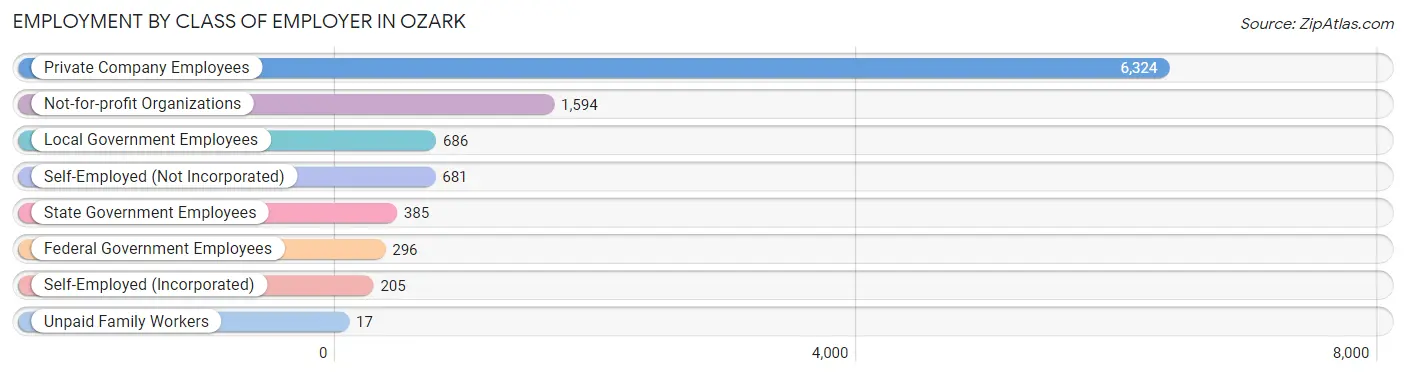
| Employer Class | # Employees | % Employees |
| Private Company Employees | 6,324 | 62.1% |
| Self-Employed (Incorporated) | 205 | 2.0% |
| Self-Employed (Not Incorporated) | 681 | 6.7% |
| Not-for-profit Organizations | 1,594 | 15.7% |
| Local Government Employees | 686 | 6.7% |
| State Government Employees | 385 | 3.8% |
| Federal Government Employees | 296 | 2.9% |
| Unpaid Family Workers | 17 | 0.2% |
| Total | 10,188 | 100.0% |
Employment Status by Age in Ozark
According to the labor force statistics for Ozark, out of the total population over 16 years of age (15,939), 67.0% or 10,679 individuals are in the labor force, with 3.6% or 384 of them unemployed. The age group with the highest labor force participation rate is 25 to 29 years, with 95.9% or 1,415 individuals in the labor force. Within the labor force, the 65 to 74 years age range has the highest percentage of unemployed individuals, with 12.5% or 43 of them being unemployed.
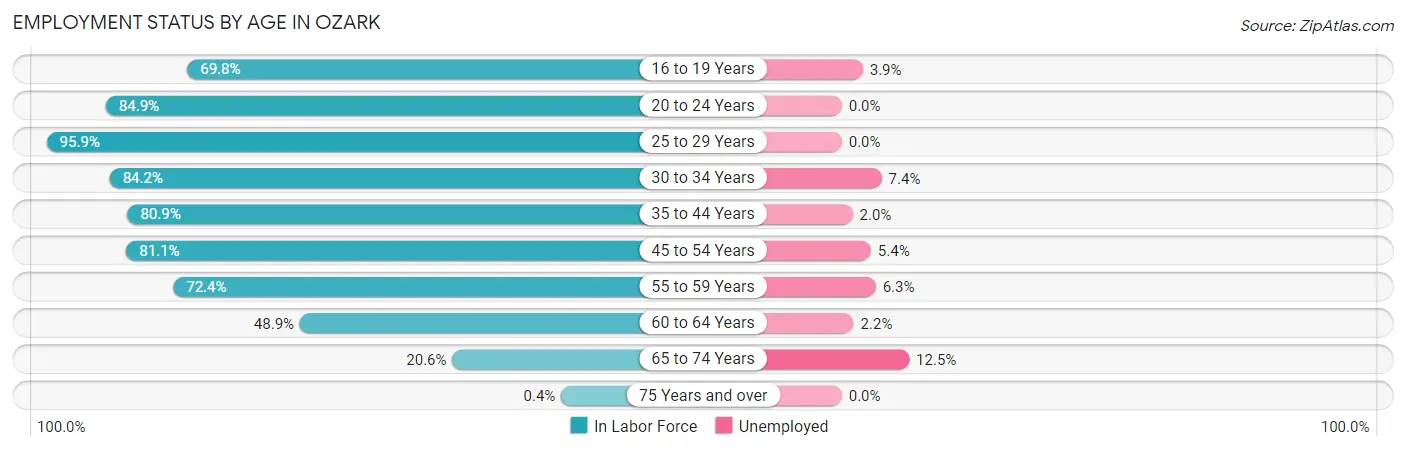
| Age Bracket | In Labor Force | Unemployed |
| 16 to 19 Years | 804 (69.8%) | 31 (3.9%) |
| 20 to 24 Years | 1,088 (84.9%) | 0 (0.0%) |
| 25 to 29 Years | 1,415 (95.9%) | 0 (0.0%) |
| 30 to 34 Years | 1,454 (84.2%) | 108 (7.4%) |
| 35 to 44 Years | 2,399 (80.9%) | 48 (2.0%) |
| 45 to 54 Years | 1,942 (81.1%) | 105 (5.4%) |
| 55 to 59 Years | 697 (72.4%) | 44 (6.3%) |
| 60 to 64 Years | 537 (48.9%) | 12 (2.2%) |
| 65 to 74 Years | 343 (20.6%) | 43 (12.5%) |
| 75 Years and over | 5 (0.4%) | 0 (0.0%) |
| Total | 10,679 (67.0%) | 384 (3.6%) |
Employment Status by Educational Attainment in Ozark
According to labor force statistics for Ozark, 79.5% of individuals (8,445) out of the total population between 25 and 64 years of age (10,623) are in the labor force, with 3.7% or 312 of them being unemployed. The group with the highest labor force participation rate are those with the educational attainment of bachelor's degree or higher, with 87.3% or 3,609 individuals in the labor force. Within the labor force, individuals with less than high school education have the highest percentage of unemployment, with 9.1% or 41 of them being unemployed.
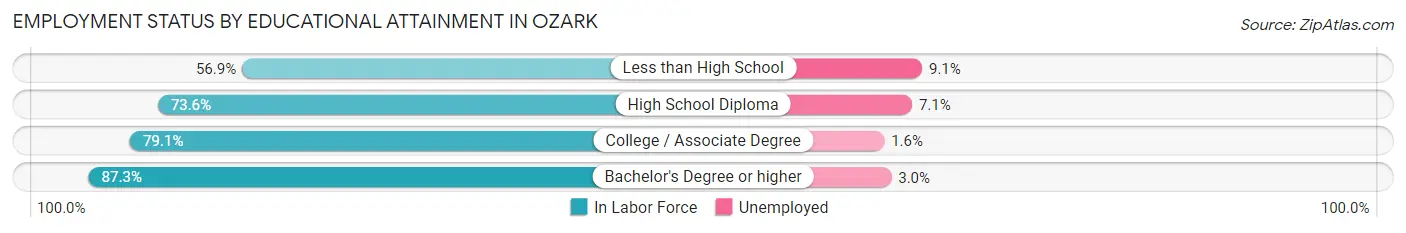
| Educational Attainment | In Labor Force | Unemployed |
| Less than High School | 449 (56.9%) | 72 (9.1%) |
| High School Diploma | 1,676 (73.6%) | 162 (7.1%) |
| College / Associate Degree | 2,708 (79.1%) | 55 (1.6%) |
| Bachelor's Degree or higher | 3,609 (87.3%) | 124 (3.0%) |
| Total | 8,445 (79.5%) | 393 (3.7%) |
Employment Occupations by Sex in Ozark
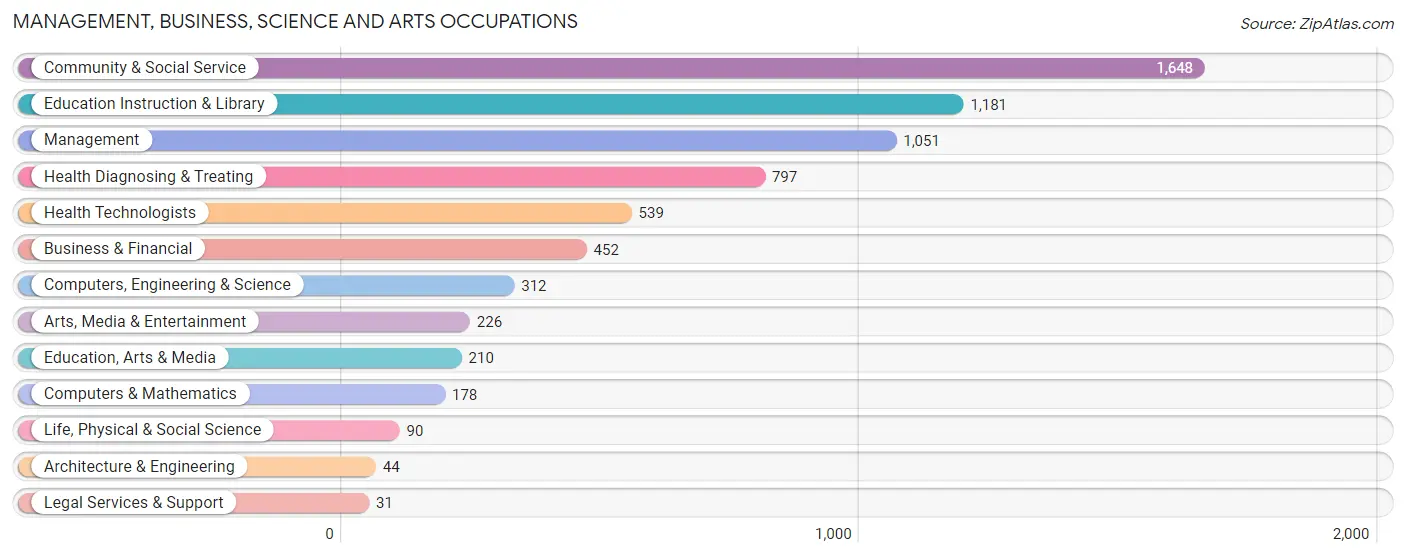
Management, Business, Science and Arts Occupations
The most common Management, Business, Science and Arts occupations in Ozark are Community & Social Service (1,648 | 16.1%), Education Instruction & Library (1,181 | 11.5%), Management (1,051 | 10.2%), Health Diagnosing & Treating (797 | 7.8%), and Health Technologists (539 | 5.2%).
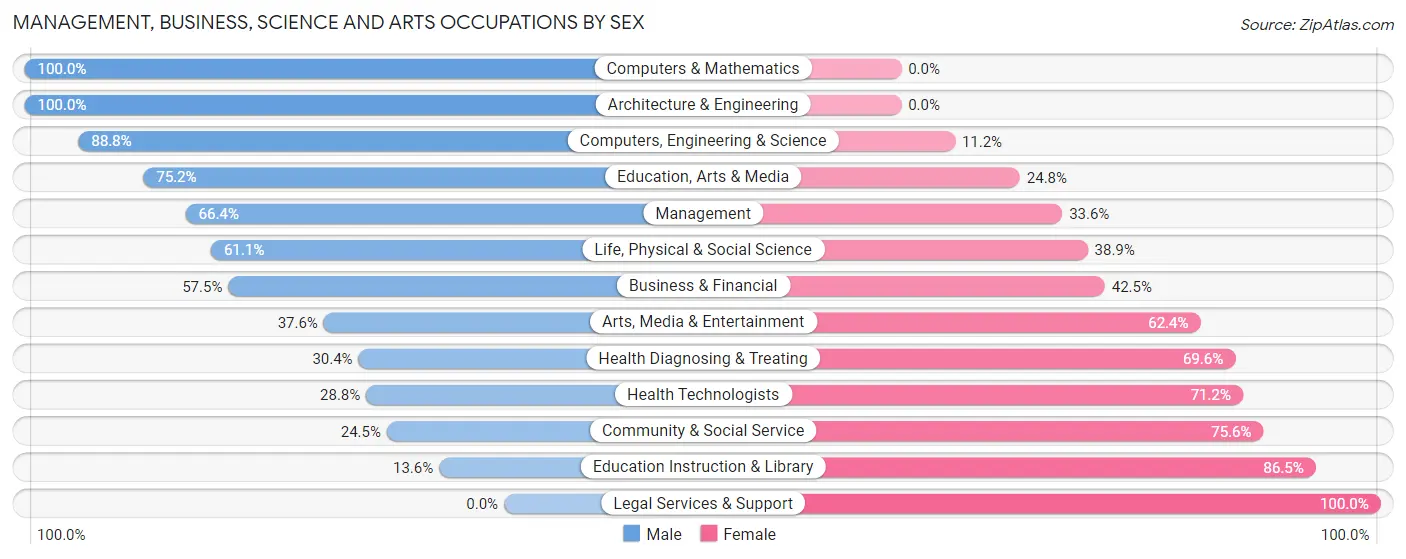
Management, Business, Science and Arts Occupations by Sex
Within the Management, Business, Science and Arts occupations in Ozark, the most male-oriented occupations are Computers & Mathematics (100.0%), Architecture & Engineering (100.0%), and Computers, Engineering & Science (88.8%), while the most female-oriented occupations are Legal Services & Support (100.0%), Education Instruction & Library (86.5%), and Community & Social Service (75.5%).
| Occupation | Male | Female |
| Management | 698 (66.4%) | 353 (33.6%) |
| Business & Financial | 260 (57.5%) | 192 (42.5%) |
| Computers, Engineering & Science | 277 (88.8%) | 35 (11.2%) |
| Computers & Mathematics | 178 (100.0%) | 0 (0.0%) |
| Architecture & Engineering | 44 (100.0%) | 0 (0.0%) |
| Life, Physical & Social Science | 55 (61.1%) | 35 (38.9%) |
| Community & Social Service | 403 (24.4%) | 1,245 (75.5%) |
| Education, Arts & Media | 158 (75.2%) | 52 (24.8%) |
| Legal Services & Support | 0 (0.0%) | 31 (100.0%) |
| Education Instruction & Library | 160 (13.6%) | 1,021 (86.5%) |
| Arts, Media & Entertainment | 85 (37.6%) | 141 (62.4%) |
| Health Diagnosing & Treating | 242 (30.4%) | 555 (69.6%) |
| Health Technologists | 155 (28.8%) | 384 (71.2%) |
| Total (Category) | 1,880 (44.1%) | 2,380 (55.9%) |
| Total (Overall) | 5,400 (52.6%) | 4,859 (47.4%) |
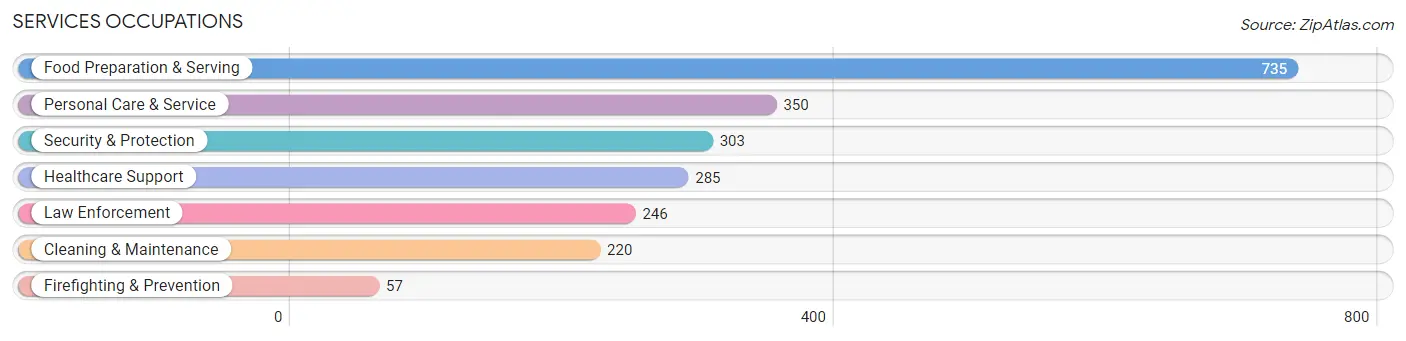
Services Occupations
The most common Services occupations in Ozark are Food Preparation & Serving (735 | 7.2%), Personal Care & Service (350 | 3.4%), Security & Protection (303 | 2.9%), Healthcare Support (285 | 2.8%), and Law Enforcement (246 | 2.4%).
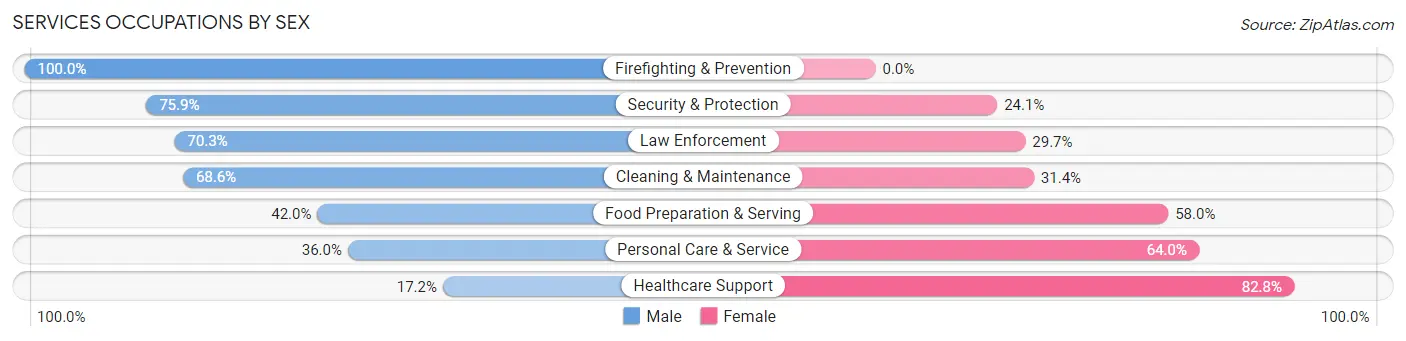
Services Occupations by Sex
Within the Services occupations in Ozark, the most male-oriented occupations are Firefighting & Prevention (100.0%), Security & Protection (75.9%), and Law Enforcement (70.3%), while the most female-oriented occupations are Healthcare Support (82.8%), Personal Care & Service (64.0%), and Food Preparation & Serving (58.0%).
| Occupation | Male | Female |
| Healthcare Support | 49 (17.2%) | 236 (82.8%) |
| Security & Protection | 230 (75.9%) | 73 (24.1%) |
| Firefighting & Prevention | 57 (100.0%) | 0 (0.0%) |
| Law Enforcement | 173 (70.3%) | 73 (29.7%) |
| Food Preparation & Serving | 309 (42.0%) | 426 (58.0%) |
| Cleaning & Maintenance | 151 (68.6%) | 69 (31.4%) |
| Personal Care & Service | 126 (36.0%) | 224 (64.0%) |
| Total (Category) | 865 (45.7%) | 1,028 (54.3%) |
| Total (Overall) | 5,400 (52.6%) | 4,859 (47.4%) |
Sales and Office Occupations
The most common Sales and Office occupations in Ozark are Office & Administration (1,197 | 11.7%), and Sales & Related (818 | 8.0%).

Sales and Office Occupations by Sex
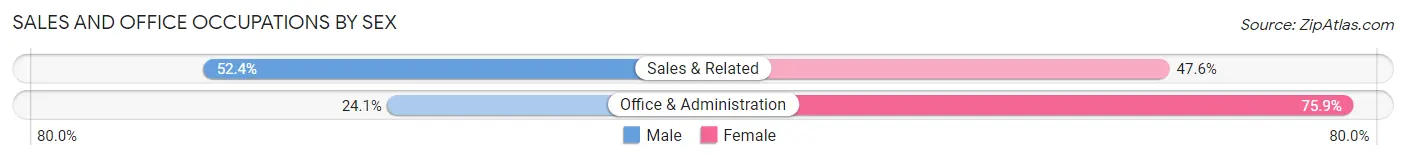
| Occupation | Male | Female |
| Sales & Related | 429 (52.4%) | 389 (47.6%) |
| Office & Administration | 289 (24.1%) | 908 (75.9%) |
| Total (Category) | 718 (35.6%) | 1,297 (64.4%) |
| Total (Overall) | 5,400 (52.6%) | 4,859 (47.4%) |
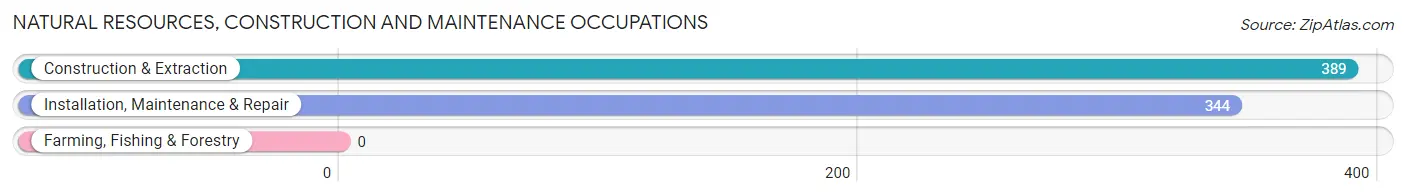
Natural Resources, Construction and Maintenance Occupations
The most common Natural Resources, Construction and Maintenance occupations in Ozark are Construction & Extraction (389 | 3.8%), and Installation, Maintenance & Repair (344 | 3.4%).
Natural Resources, Construction and Maintenance Occupations by Sex
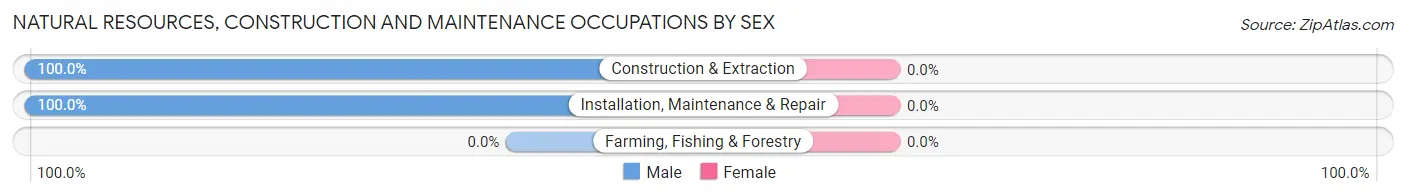
| Occupation | Male | Female |
| Farming, Fishing & Forestry | 0 (0.0%) | 0 (0.0%) |
| Construction & Extraction | 389 (100.0%) | 0 (0.0%) |
| Installation, Maintenance & Repair | 344 (100.0%) | 0 (0.0%) |
| Total (Category) | 733 (100.0%) | 0 (0.0%) |
| Total (Overall) | 5,400 (52.6%) | 4,859 (47.4%) |
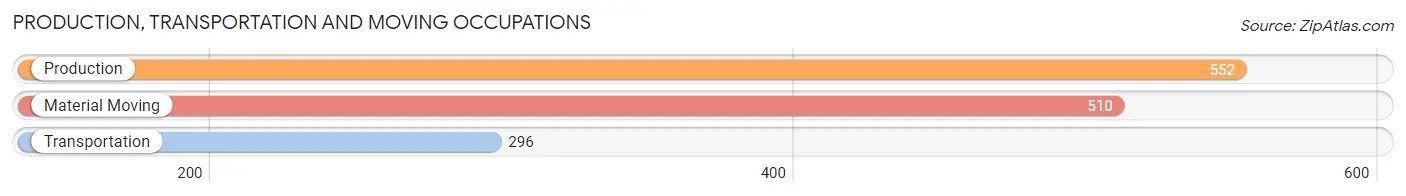
Production, Transportation and Moving Occupations
The most common Production, Transportation and Moving occupations in Ozark are Production (552 | 5.4%), Material Moving (510 | 5.0%), and Transportation (296 | 2.9%).
Production, Transportation and Moving Occupations by Sex
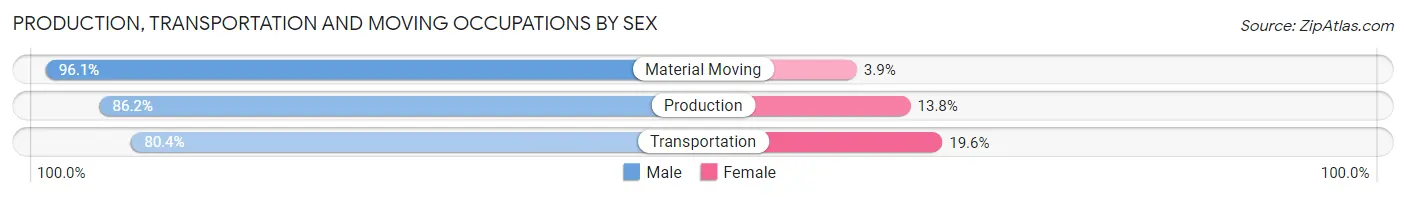
| Occupation | Male | Female |
| Production | 476 (86.2%) | 76 (13.8%) |
| Transportation | 238 (80.4%) | 58 (19.6%) |
| Material Moving | 490 (96.1%) | 20 (3.9%) |
| Total (Category) | 1,204 (88.7%) | 154 (11.3%) |
| Total (Overall) | 5,400 (52.6%) | 4,859 (47.4%) |
Employment Industries by Sex in Ozark
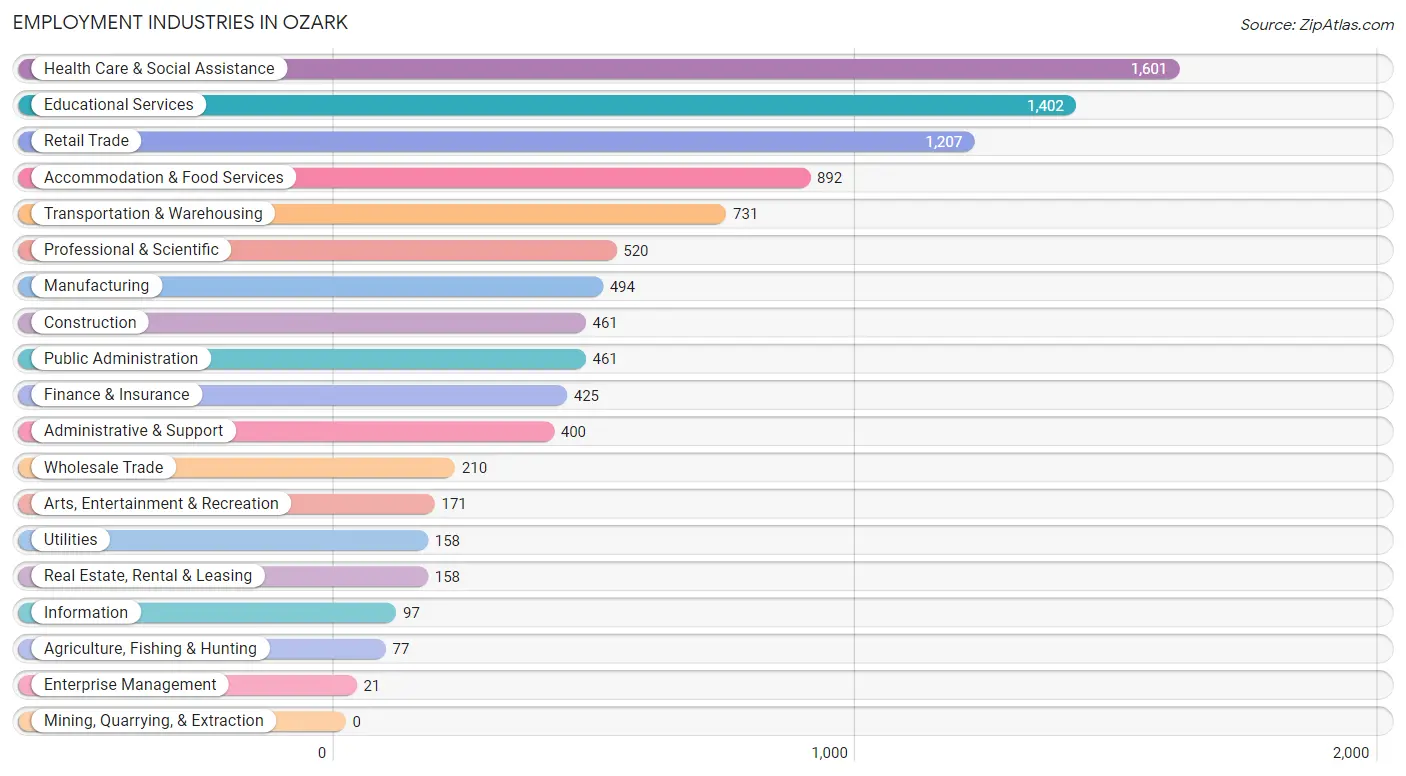
Employment Industries in Ozark
The major employment industries in Ozark include Health Care & Social Assistance (1,601 | 15.6%), Educational Services (1,402 | 13.7%), Retail Trade (1,207 | 11.8%), Accommodation & Food Services (892 | 8.7%), and Transportation & Warehousing (731 | 7.1%).
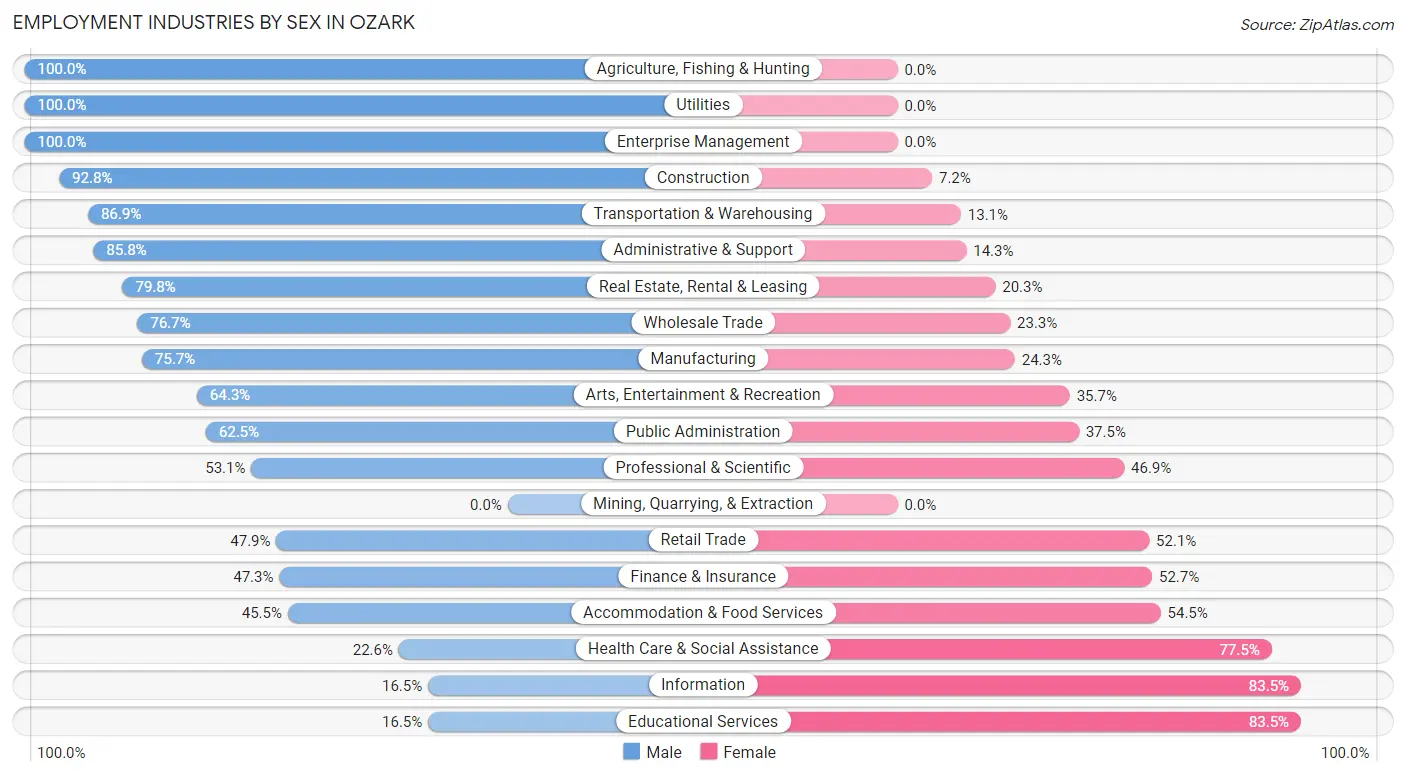
Employment Industries by Sex in Ozark
The Ozark industries that see more men than women are Agriculture, Fishing & Hunting (100.0%), Utilities (100.0%), and Enterprise Management (100.0%), whereas the industries that tend to have a higher number of women are Educational Services (83.5%), Information (83.5%), and Health Care & Social Assistance (77.4%).
| Industry | Male | Female |
| Agriculture, Fishing & Hunting | 77 (100.0%) | 0 (0.0%) |
| Mining, Quarrying, & Extraction | 0 (0.0%) | 0 (0.0%) |
| Construction | 428 (92.8%) | 33 (7.2%) |
| Manufacturing | 374 (75.7%) | 120 (24.3%) |
| Wholesale Trade | 161 (76.7%) | 49 (23.3%) |
| Retail Trade | 578 (47.9%) | 629 (52.1%) |
| Transportation & Warehousing | 635 (86.9%) | 96 (13.1%) |
| Utilities | 158 (100.0%) | 0 (0.0%) |
| Information | 16 (16.5%) | 81 (83.5%) |
| Finance & Insurance | 201 (47.3%) | 224 (52.7%) |
| Real Estate, Rental & Leasing | 126 (79.7%) | 32 (20.3%) |
| Professional & Scientific | 276 (53.1%) | 244 (46.9%) |
| Enterprise Management | 21 (100.0%) | 0 (0.0%) |
| Administrative & Support | 343 (85.8%) | 57 (14.2%) |
| Educational Services | 231 (16.5%) | 1,171 (83.5%) |
| Health Care & Social Assistance | 361 (22.6%) | 1,240 (77.4%) |
| Arts, Entertainment & Recreation | 110 (64.3%) | 61 (35.7%) |
| Accommodation & Food Services | 406 (45.5%) | 486 (54.5%) |
| Public Administration | 288 (62.5%) | 173 (37.5%) |
| Total | 5,400 (52.6%) | 4,859 (47.4%) |
Education in Ozark
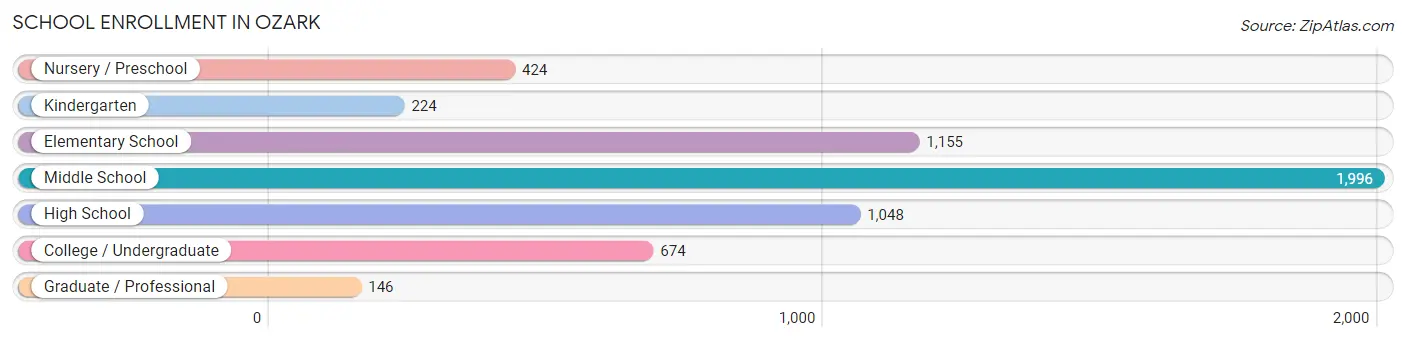
School Enrollment in Ozark
The most common levels of schooling among the 5,667 students in Ozark are middle school (1,996 | 35.2%), elementary school (1,155 | 20.4%), and high school (1,048 | 18.5%).
| School Level | # Students | % Students |
| Nursery / Preschool | 424 | 7.5% |
| Kindergarten | 224 | 4.0% |
| Elementary School | 1,155 | 20.4% |
| Middle School | 1,996 | 35.2% |
| High School | 1,048 | 18.5% |
| College / Undergraduate | 674 | 11.9% |
| Graduate / Professional | 146 | 2.6% |
| Total | 5,667 | 100.0% |
School Enrollment by Age by Funding Source in Ozark
Out of a total of 5,667 students who are enrolled in schools in Ozark, 1,003 (17.7%) attend a private institution, while the remaining 4,664 (82.3%) are enrolled in public schools. The age group of 35 years and over has the highest likelihood of being enrolled in private schools, with 70 (34.6% in the age bracket) enrolled. Conversely, the age group of 25 to 34 year olds has the lowest likelihood of being enrolled in a private school, with 113 (100.0% in the age bracket) attending a public institution.
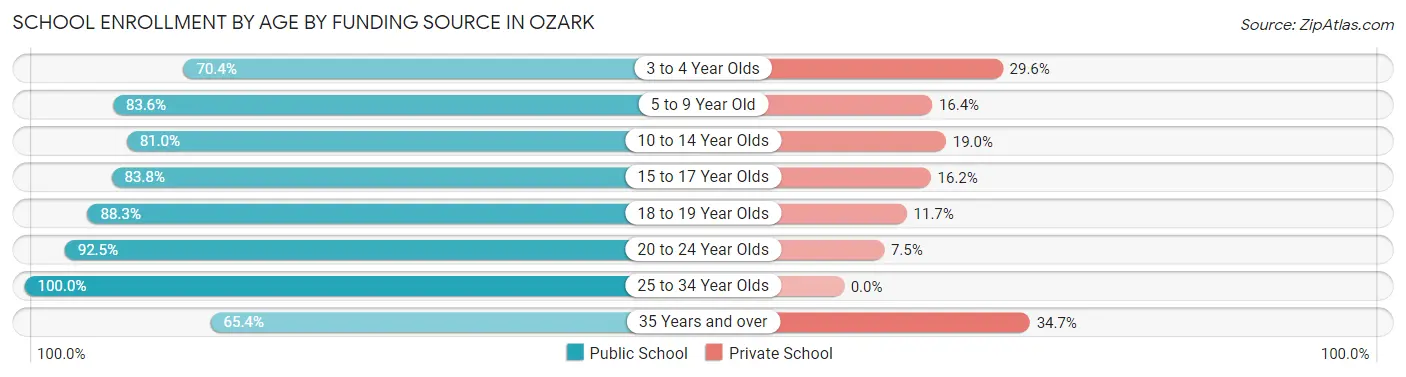
| Age Bracket | Public School | Private School |
| 3 to 4 Year Olds | 245 (70.4%) | 103 (29.6%) |
| 5 to 9 Year Old | 1,164 (83.6%) | 229 (16.4%) |
| 10 to 14 Year Olds | 1,710 (81.0%) | 402 (19.0%) |
| 15 to 17 Year Olds | 740 (83.8%) | 143 (16.2%) |
| 18 to 19 Year Olds | 226 (88.3%) | 30 (11.7%) |
| 20 to 24 Year Olds | 333 (92.5%) | 27 (7.5%) |
| 25 to 34 Year Olds | 113 (100.0%) | 0 (0.0%) |
| 35 Years and over | 132 (65.3%) | 70 (34.6%) |
| Total | 4,664 (82.3%) | 1,003 (17.7%) |
Educational Attainment by Field of Study in Ozark
Education (1,051 | 20.3%), business (880 | 17.0%), science & technology (629 | 12.2%), bio, nature & agricultural (576 | 11.1%), and communications (382 | 7.4%) are the most common fields of study among 5,173 individuals in Ozark who have obtained a bachelor's degree or higher.
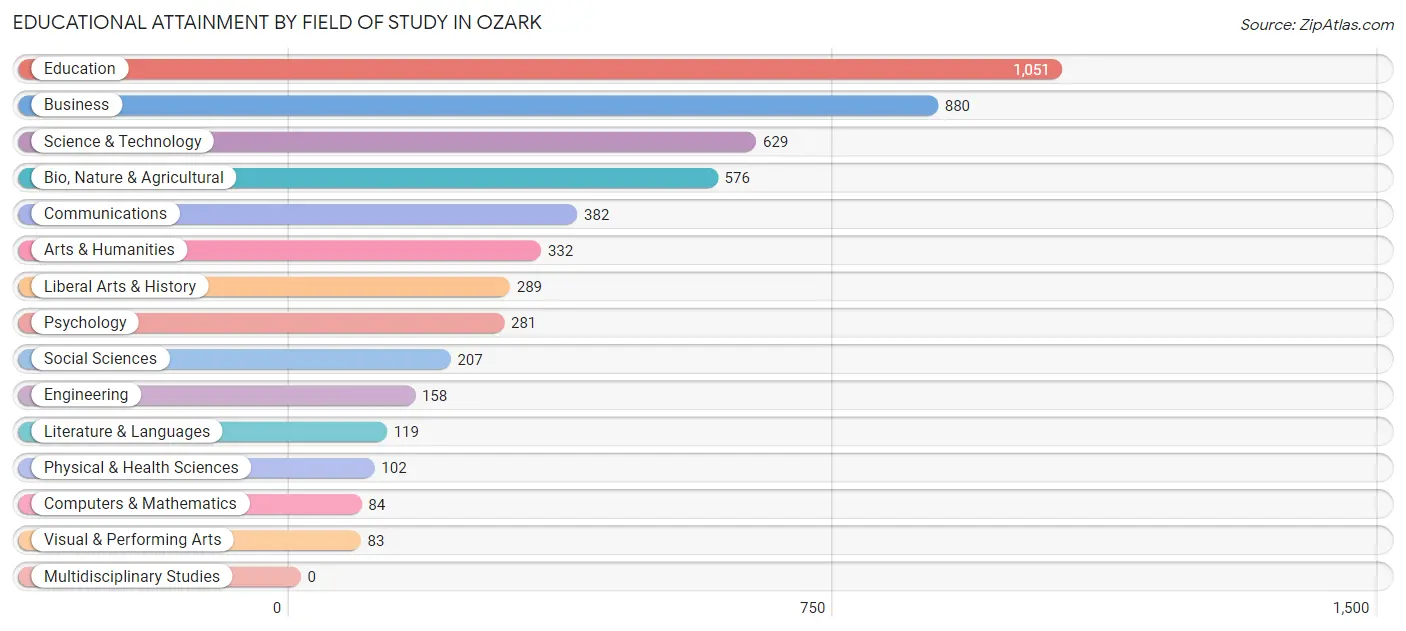
| Field of Study | # Graduates | % Graduates |
| Computers & Mathematics | 84 | 1.6% |
| Bio, Nature & Agricultural | 576 | 11.1% |
| Physical & Health Sciences | 102 | 2.0% |
| Psychology | 281 | 5.4% |
| Social Sciences | 207 | 4.0% |
| Engineering | 158 | 3.0% |
| Multidisciplinary Studies | 0 | 0.0% |
| Science & Technology | 629 | 12.2% |
| Business | 880 | 17.0% |
| Education | 1,051 | 20.3% |
| Literature & Languages | 119 | 2.3% |
| Liberal Arts & History | 289 | 5.6% |
| Visual & Performing Arts | 83 | 1.6% |
| Communications | 382 | 7.4% |
| Arts & Humanities | 332 | 6.4% |
| Total | 5,173 | 100.0% |
Transportation & Commute in Ozark
Vehicle Availability by Sex in Ozark
The most prevalent vehicle ownership categories in Ozark are males with 2 vehicles (2,417, accounting for 45.1%) and females with 2 vehicles (1,900, making up 50.2%).
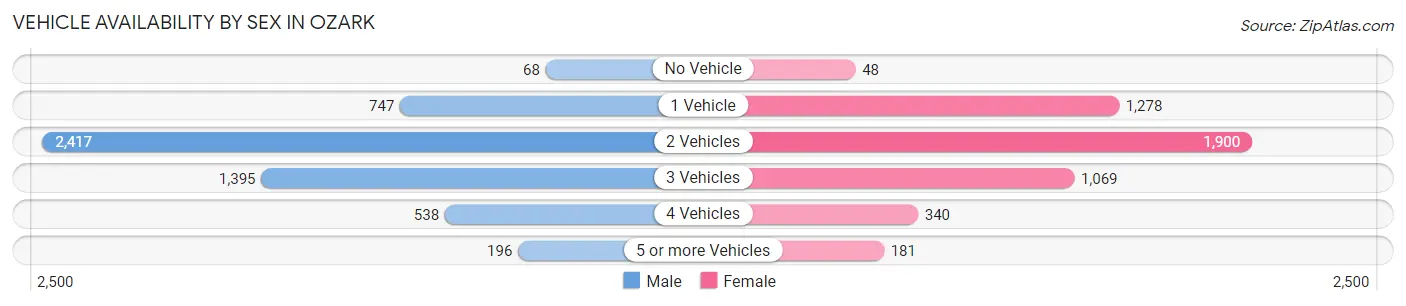
| Vehicles Available | Male | Female |
| No Vehicle | 68 (1.3%) | 48 (1.0%) |
| 1 Vehicle | 747 (13.9%) | 1,278 (26.5%) |
| 2 Vehicles | 2,417 (45.1%) | 1,900 (39.5%) |
| 3 Vehicles | 1,395 (26.0%) | 1,069 (22.2%) |
| 4 Vehicles | 538 (10.0%) | 340 (7.1%) |
| 5 or more Vehicles | 196 (3.7%) | 181 (3.8%) |
| Total | 5,361 (100.0%) | 4,816 (100.0%) |
Commute Time in Ozark
The most frequently occuring commute durations in Ozark are 15 to 19 minutes (1,987 commuters, 20.8%), 20 to 24 minutes (1,423 commuters, 14.9%), and 10 to 14 minutes (1,260 commuters, 13.2%).
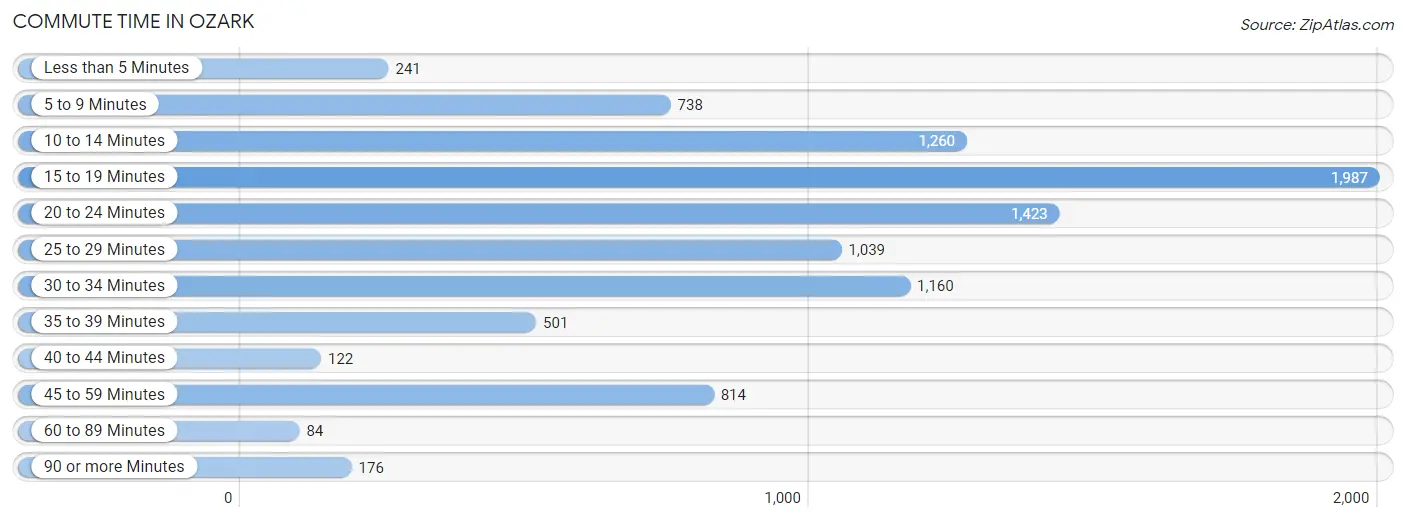
| Commute Time | # Commuters | % Commuters |
| Less than 5 Minutes | 241 | 2.5% |
| 5 to 9 Minutes | 738 | 7.7% |
| 10 to 14 Minutes | 1,260 | 13.2% |
| 15 to 19 Minutes | 1,987 | 20.8% |
| 20 to 24 Minutes | 1,423 | 14.9% |
| 25 to 29 Minutes | 1,039 | 10.9% |
| 30 to 34 Minutes | 1,160 | 12.1% |
| 35 to 39 Minutes | 501 | 5.2% |
| 40 to 44 Minutes | 122 | 1.3% |
| 45 to 59 Minutes | 814 | 8.5% |
| 60 to 89 Minutes | 84 | 0.9% |
| 90 or more Minutes | 176 | 1.8% |
Commute Time by Sex in Ozark
The most common commute times in Ozark are 10 to 14 minutes (946 commuters, 18.5%) for males and 15 to 19 minutes (1,262 commuters, 28.4%) for females.
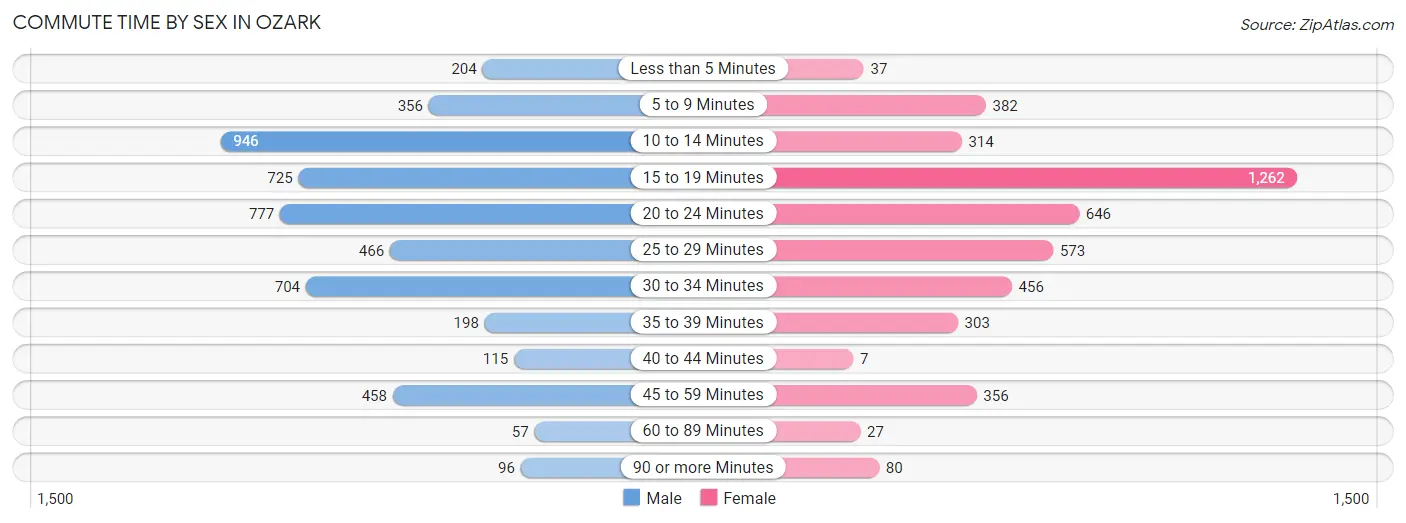
| Commute Time | Male | Female |
| Less than 5 Minutes | 204 (4.0%) | 37 (0.8%) |
| 5 to 9 Minutes | 356 (7.0%) | 382 (8.6%) |
| 10 to 14 Minutes | 946 (18.5%) | 314 (7.1%) |
| 15 to 19 Minutes | 725 (14.2%) | 1,262 (28.4%) |
| 20 to 24 Minutes | 777 (15.2%) | 646 (14.5%) |
| 25 to 29 Minutes | 466 (9.1%) | 573 (12.9%) |
| 30 to 34 Minutes | 704 (13.8%) | 456 (10.3%) |
| 35 to 39 Minutes | 198 (3.9%) | 303 (6.8%) |
| 40 to 44 Minutes | 115 (2.2%) | 7 (0.2%) |
| 45 to 59 Minutes | 458 (9.0%) | 356 (8.0%) |
| 60 to 89 Minutes | 57 (1.1%) | 27 (0.6%) |
| 90 or more Minutes | 96 (1.9%) | 80 (1.8%) |
Time of Departure to Work by Sex in Ozark
The most frequent times of departure to work in Ozark are 7:00 AM to 7:29 AM (834, 16.4%) for males and 7:00 AM to 7:29 AM (732, 16.5%) for females.
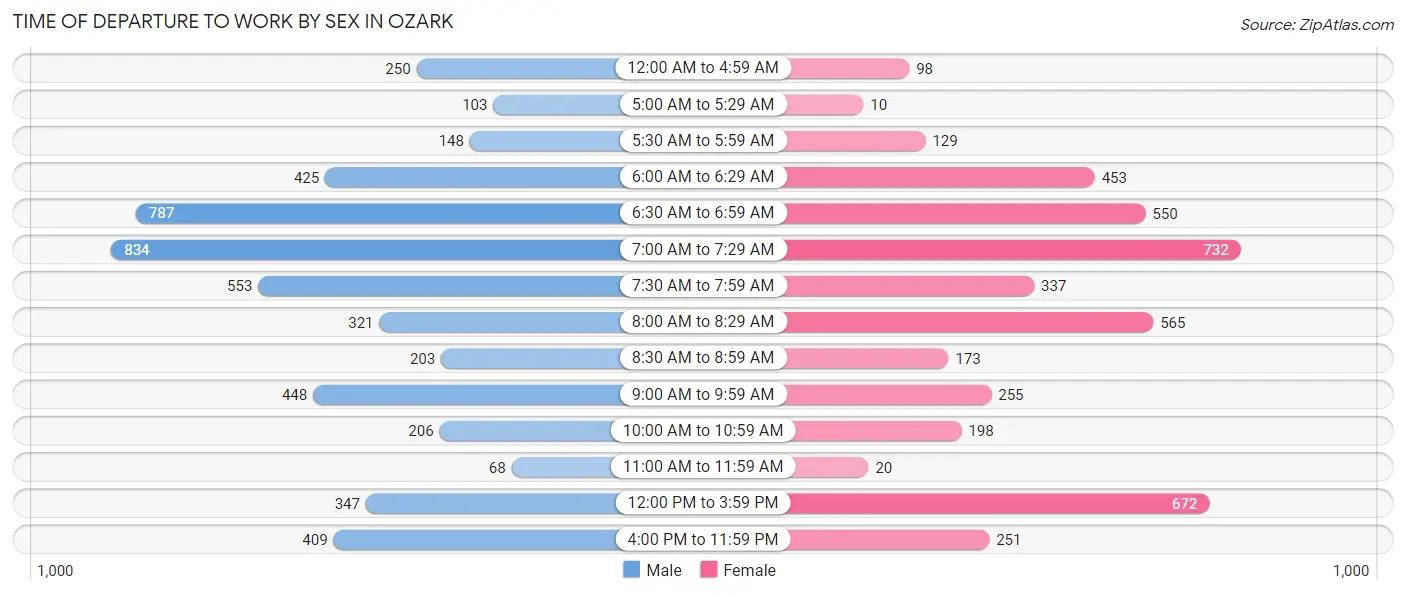
| Time of Departure | Male | Female |
| 12:00 AM to 4:59 AM | 250 (4.9%) | 98 (2.2%) |
| 5:00 AM to 5:29 AM | 103 (2.0%) | 10 (0.2%) |
| 5:30 AM to 5:59 AM | 148 (2.9%) | 129 (2.9%) |
| 6:00 AM to 6:29 AM | 425 (8.3%) | 453 (10.2%) |
| 6:30 AM to 6:59 AM | 787 (15.4%) | 550 (12.4%) |
| 7:00 AM to 7:29 AM | 834 (16.4%) | 732 (16.5%) |
| 7:30 AM to 7:59 AM | 553 (10.8%) | 337 (7.6%) |
| 8:00 AM to 8:29 AM | 321 (6.3%) | 565 (12.7%) |
| 8:30 AM to 8:59 AM | 203 (4.0%) | 173 (3.9%) |
| 9:00 AM to 9:59 AM | 448 (8.8%) | 255 (5.7%) |
| 10:00 AM to 10:59 AM | 206 (4.0%) | 198 (4.5%) |
| 11:00 AM to 11:59 AM | 68 (1.3%) | 20 (0.4%) |
| 12:00 PM to 3:59 PM | 347 (6.8%) | 672 (15.1%) |
| 4:00 PM to 11:59 PM | 409 (8.0%) | 251 (5.7%) |
| Total | 5,102 (100.0%) | 4,443 (100.0%) |
Housing Occupancy in Ozark
Occupancy by Ownership in Ozark
Of the total 8,179 dwellings in Ozark, owner-occupied units account for 5,506 (67.3%), while renter-occupied units make up 2,673 (32.7%).
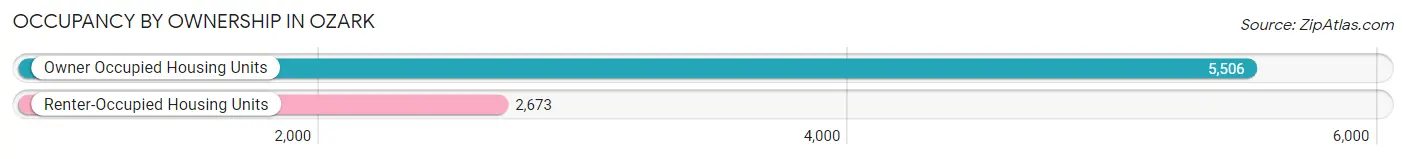
| Occupancy | # Housing Units | % Housing Units |
| Owner Occupied Housing Units | 5,506 | 67.3% |
| Renter-Occupied Housing Units | 2,673 | 32.7% |
| Total Occupied Housing Units | 8,179 | 100.0% |
Occupancy by Household Size in Ozark
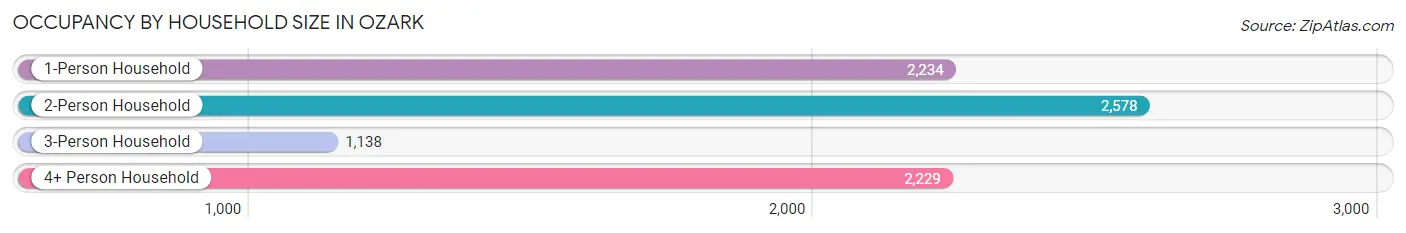
| Household Size | # Housing Units | % Housing Units |
| 1-Person Household | 2,234 | 27.3% |
| 2-Person Household | 2,578 | 31.5% |
| 3-Person Household | 1,138 | 13.9% |
| 4+ Person Household | 2,229 | 27.3% |
| Total Housing Units | 8,179 | 100.0% |
Occupancy by Ownership by Household Size in Ozark
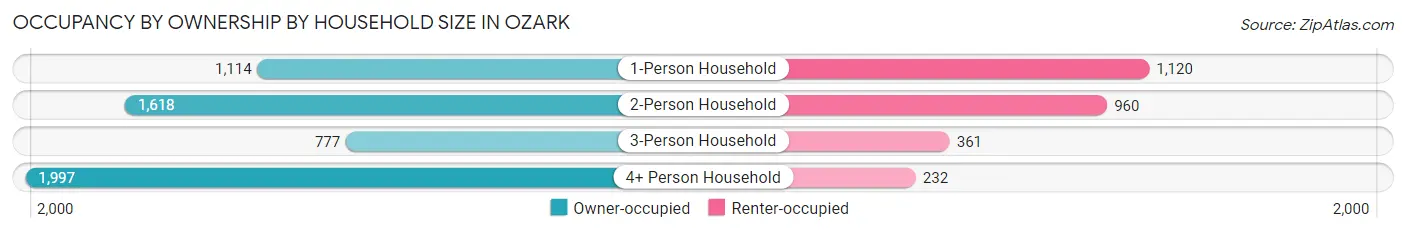
| Household Size | Owner-occupied | Renter-occupied |
| 1-Person Household | 1,114 (49.9%) | 1,120 (50.1%) |
| 2-Person Household | 1,618 (62.8%) | 960 (37.2%) |
| 3-Person Household | 777 (68.3%) | 361 (31.7%) |
| 4+ Person Household | 1,997 (89.6%) | 232 (10.4%) |
| Total Housing Units | 5,506 (67.3%) | 2,673 (32.7%) |
Occupancy by Educational Attainment in Ozark
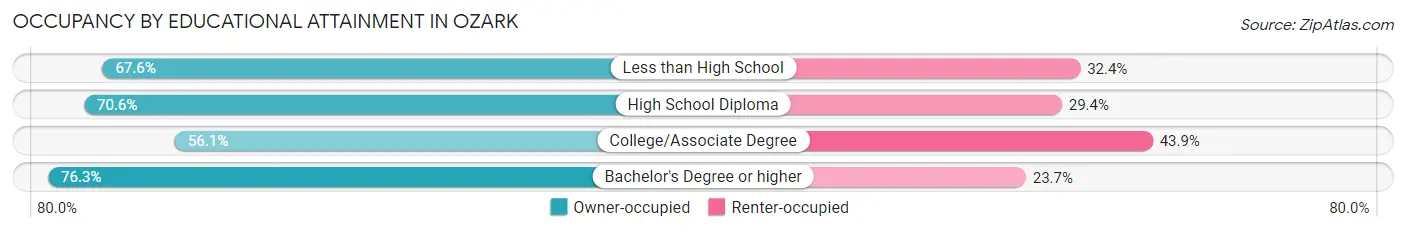
| Household Size | Owner-occupied | Renter-occupied |
| Less than High School | 372 (67.6%) | 178 (32.4%) |
| High School Diploma | 1,467 (70.6%) | 612 (29.4%) |
| College/Associate Degree | 1,578 (56.1%) | 1,233 (43.9%) |
| Bachelor's Degree or higher | 2,089 (76.3%) | 650 (23.7%) |
Occupancy by Age of Householder in Ozark
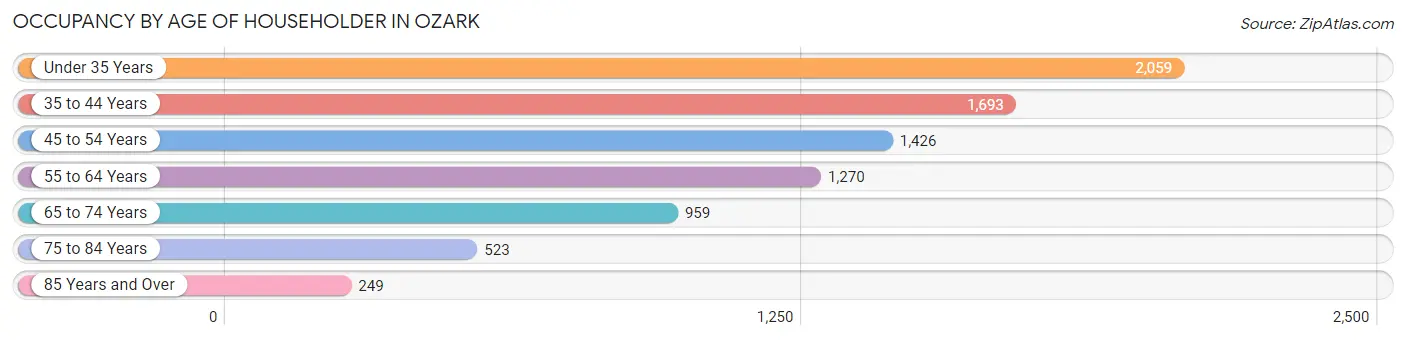
| Age Bracket | # Households | % Households |
| Under 35 Years | 2,059 | 25.2% |
| 35 to 44 Years | 1,693 | 20.7% |
| 45 to 54 Years | 1,426 | 17.4% |
| 55 to 64 Years | 1,270 | 15.5% |
| 65 to 74 Years | 959 | 11.7% |
| 75 to 84 Years | 523 | 6.4% |
| 85 Years and Over | 249 | 3.0% |
| Total | 8,179 | 100.0% |
Housing Finances in Ozark
Median Income by Occupancy in Ozark
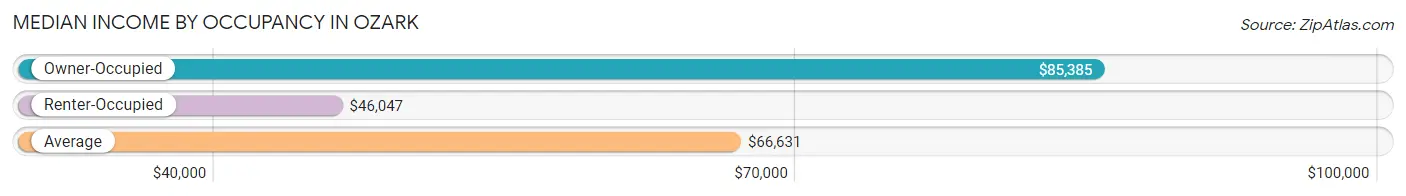
| Occupancy Type | # Households | Median Income |
| Owner-Occupied | 5,506 (67.3%) | $85,385 |
| Renter-Occupied | 2,673 (32.7%) | $46,047 |
| Average | 8,179 (100.0%) | $66,631 |
Occupancy by Householder Income Bracket in Ozark
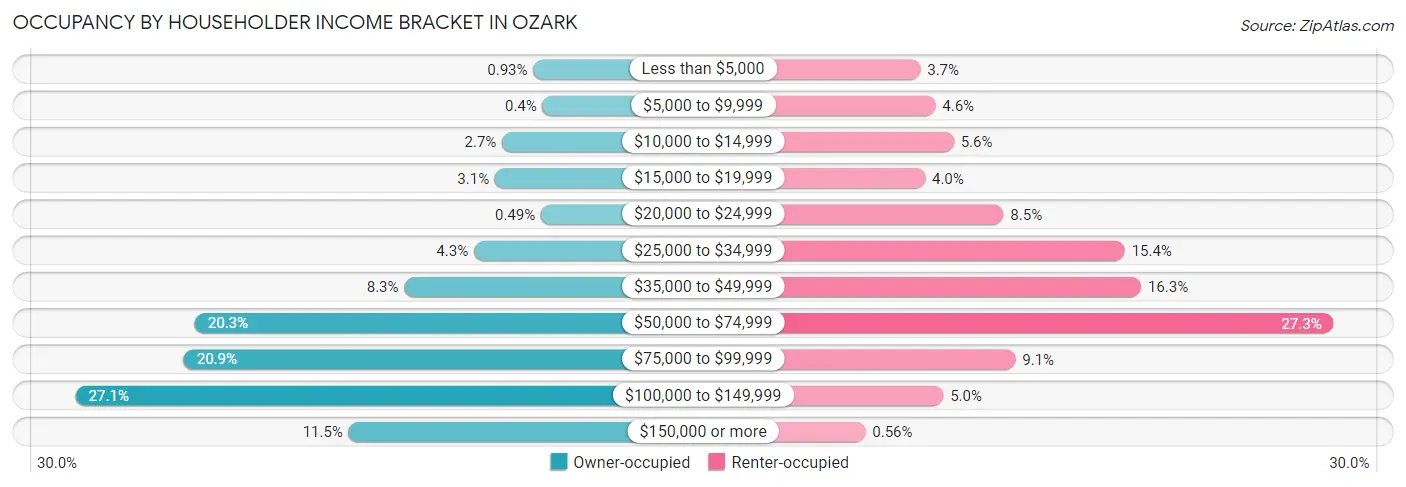
| Income Bracket | Owner-occupied | Renter-occupied |
| Less than $5,000 | 51 (0.9%) | 99 (3.7%) |
| $5,000 to $9,999 | 22 (0.4%) | 122 (4.6%) |
| $10,000 to $14,999 | 149 (2.7%) | 150 (5.6%) |
| $15,000 to $19,999 | 172 (3.1%) | 106 (4.0%) |
| $20,000 to $24,999 | 27 (0.5%) | 226 (8.5%) |
| $25,000 to $34,999 | 238 (4.3%) | 411 (15.4%) |
| $35,000 to $49,999 | 457 (8.3%) | 436 (16.3%) |
| $50,000 to $74,999 | 1,116 (20.3%) | 730 (27.3%) |
| $75,000 to $99,999 | 1,151 (20.9%) | 244 (9.1%) |
| $100,000 to $149,999 | 1,491 (27.1%) | 134 (5.0%) |
| $150,000 or more | 632 (11.5%) | 15 (0.6%) |
| Total | 5,506 (100.0%) | 2,673 (100.0%) |
Monthly Housing Cost Tiers in Ozark
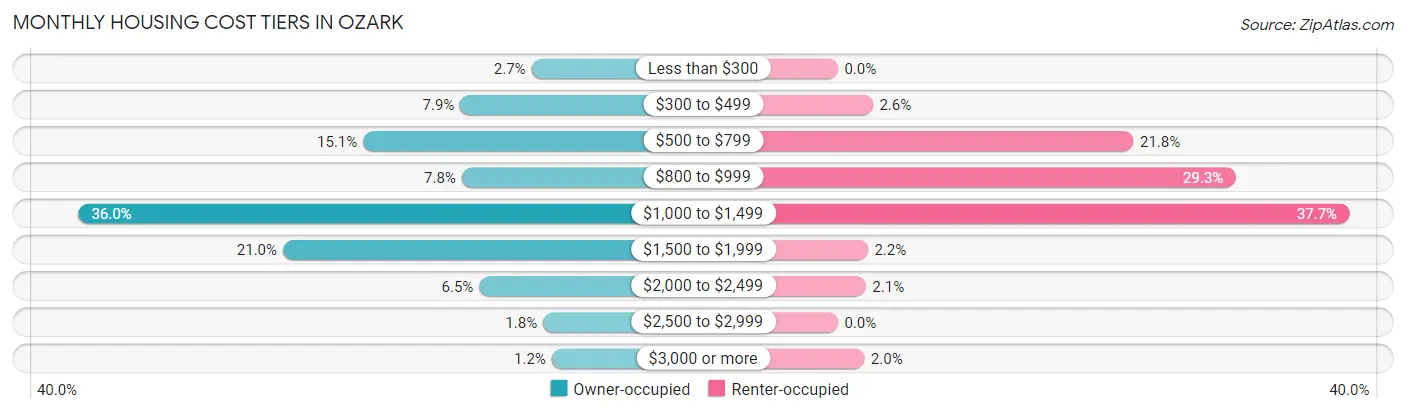
| Monthly Cost | Owner-occupied | Renter-occupied |
| Less than $300 | 147 (2.7%) | 0 (0.0%) |
| $300 to $499 | 436 (7.9%) | 69 (2.6%) |
| $500 to $799 | 830 (15.1%) | 582 (21.8%) |
| $800 to $999 | 430 (7.8%) | 783 (29.3%) |
| $1,000 to $1,499 | 1,984 (36.0%) | 1,007 (37.7%) |
| $1,500 to $1,999 | 1,155 (21.0%) | 59 (2.2%) |
| $2,000 to $2,499 | 359 (6.5%) | 55 (2.1%) |
| $2,500 to $2,999 | 100 (1.8%) | 0 (0.0%) |
| $3,000 or more | 65 (1.2%) | 52 (1.9%) |
| Total | 5,506 (100.0%) | 2,673 (100.0%) |
Physical Housing Characteristics in Ozark
Housing Structures in Ozark
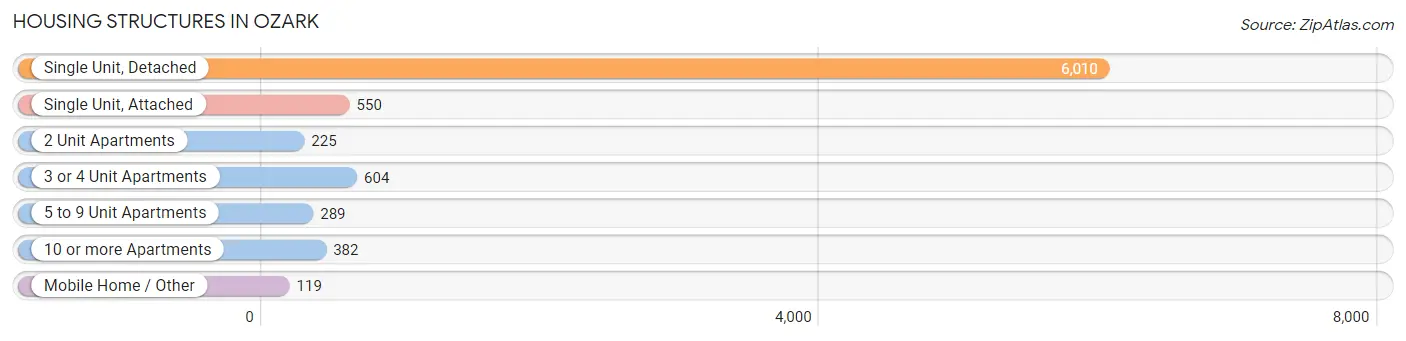
| Structure Type | # Housing Units | % Housing Units |
| Single Unit, Detached | 6,010 | 73.5% |
| Single Unit, Attached | 550 | 6.7% |
| 2 Unit Apartments | 225 | 2.8% |
| 3 or 4 Unit Apartments | 604 | 7.4% |
| 5 to 9 Unit Apartments | 289 | 3.5% |
| 10 or more Apartments | 382 | 4.7% |
| Mobile Home / Other | 119 | 1.5% |
| Total | 8,179 | 100.0% |
Housing Structures by Occupancy in Ozark
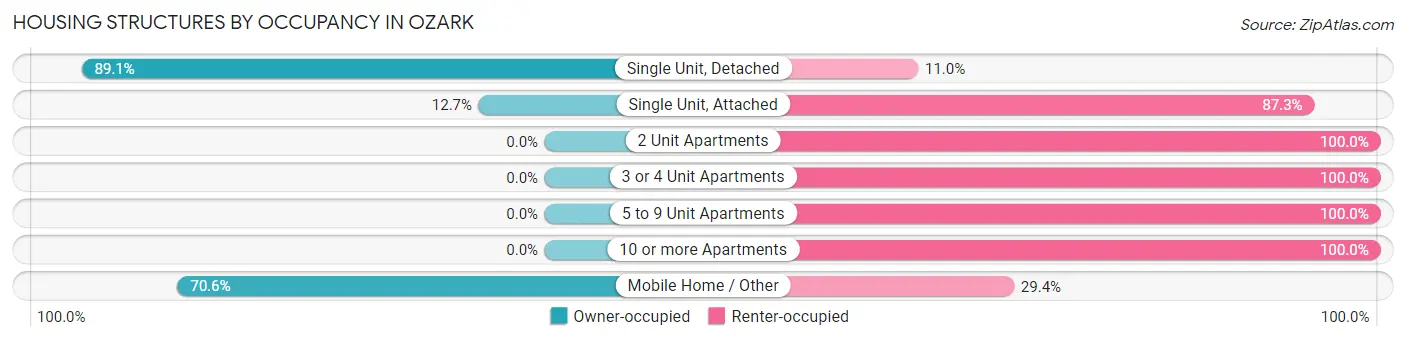
| Structure Type | Owner-occupied | Renter-occupied |
| Single Unit, Detached | 5,352 (89.0%) | 658 (11.0%) |
| Single Unit, Attached | 70 (12.7%) | 480 (87.3%) |
| 2 Unit Apartments | 0 (0.0%) | 225 (100.0%) |
| 3 or 4 Unit Apartments | 0 (0.0%) | 604 (100.0%) |
| 5 to 9 Unit Apartments | 0 (0.0%) | 289 (100.0%) |
| 10 or more Apartments | 0 (0.0%) | 382 (100.0%) |
| Mobile Home / Other | 84 (70.6%) | 35 (29.4%) |
| Total | 5,506 (67.3%) | 2,673 (32.7%) |
Housing Structures by Number of Rooms in Ozark
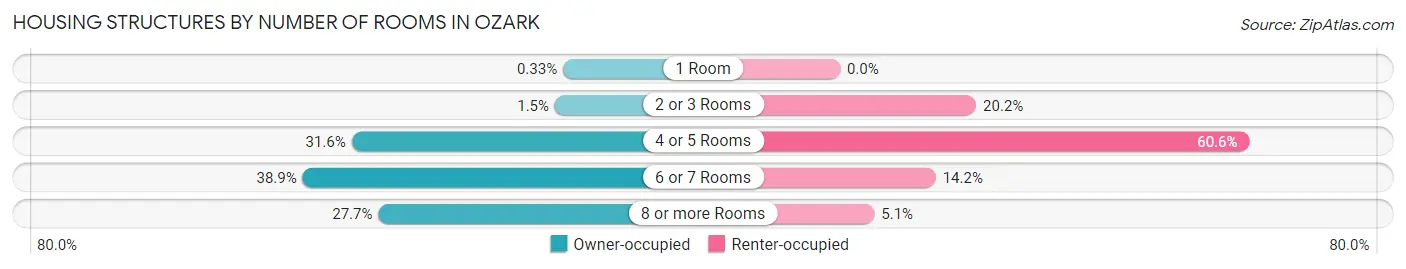
| Number of Rooms | Owner-occupied | Renter-occupied |
| 1 Room | 18 (0.3%) | 0 (0.0%) |
| 2 or 3 Rooms | 84 (1.5%) | 539 (20.2%) |
| 4 or 5 Rooms | 1,741 (31.6%) | 1,619 (60.6%) |
| 6 or 7 Rooms | 2,140 (38.9%) | 379 (14.2%) |
| 8 or more Rooms | 1,523 (27.7%) | 136 (5.1%) |
| Total | 5,506 (100.0%) | 2,673 (100.0%) |
Housing Structure by Heating Type in Ozark
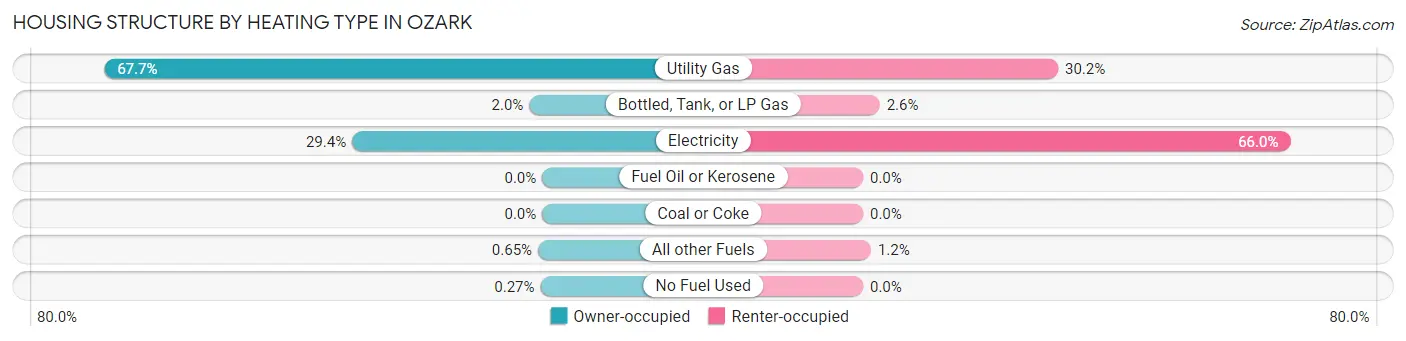
| Heating Type | Owner-occupied | Renter-occupied |
| Utility Gas | 3,727 (67.7%) | 806 (30.1%) |
| Bottled, Tank, or LP Gas | 110 (2.0%) | 69 (2.6%) |
| Electricity | 1,618 (29.4%) | 1,765 (66.0%) |
| Fuel Oil or Kerosene | 0 (0.0%) | 0 (0.0%) |
| Coal or Coke | 0 (0.0%) | 0 (0.0%) |
| All other Fuels | 36 (0.6%) | 33 (1.2%) |
| No Fuel Used | 15 (0.3%) | 0 (0.0%) |
| Total | 5,506 (100.0%) | 2,673 (100.0%) |
Household Vehicle Usage in Ozark
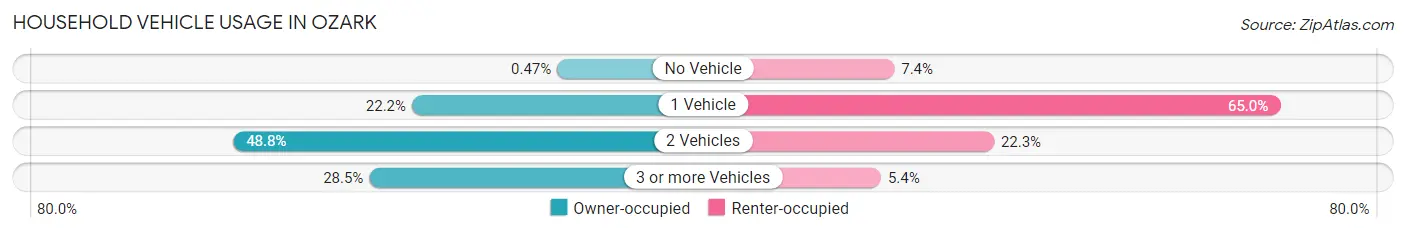
| Vehicles per Household | Owner-occupied | Renter-occupied |
| No Vehicle | 26 (0.5%) | 197 (7.4%) |
| 1 Vehicle | 1,220 (22.2%) | 1,737 (65.0%) |
| 2 Vehicles | 2,689 (48.8%) | 595 (22.3%) |
| 3 or more Vehicles | 1,571 (28.5%) | 144 (5.4%) |
| Total | 5,506 (100.0%) | 2,673 (100.0%) |
Real Estate & Mortgages in Ozark
Real Estate and Mortgage Overview in Ozark
| Characteristic | Without Mortgage | With Mortgage |
| Housing Units | 1,410 | 4,096 |
| Median Property Value | $220,700 | $214,400 |
| Median Household Income | $61,406 | $550 |
| Monthly Housing Costs | $561 | $65 |
| Real Estate Taxes | $1,606 | $136 |
Property Value by Mortgage Status in Ozark
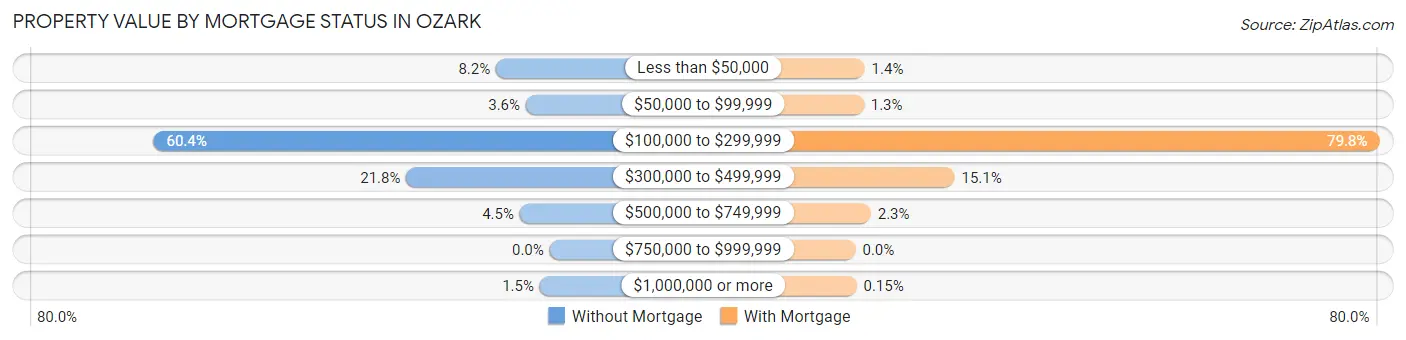
| Property Value | Without Mortgage | With Mortgage |
| Less than $50,000 | 115 (8.2%) | 57 (1.4%) |
| $50,000 to $99,999 | 51 (3.6%) | 51 (1.3%) |
| $100,000 to $299,999 | 851 (60.4%) | 3,269 (79.8%) |
| $300,000 to $499,999 | 308 (21.8%) | 618 (15.1%) |
| $500,000 to $749,999 | 64 (4.5%) | 95 (2.3%) |
| $750,000 to $999,999 | 0 (0.0%) | 0 (0.0%) |
| $1,000,000 or more | 21 (1.5%) | 6 (0.2%) |
| Total | 1,410 (100.0%) | 4,096 (100.0%) |
Household Income by Mortgage Status in Ozark
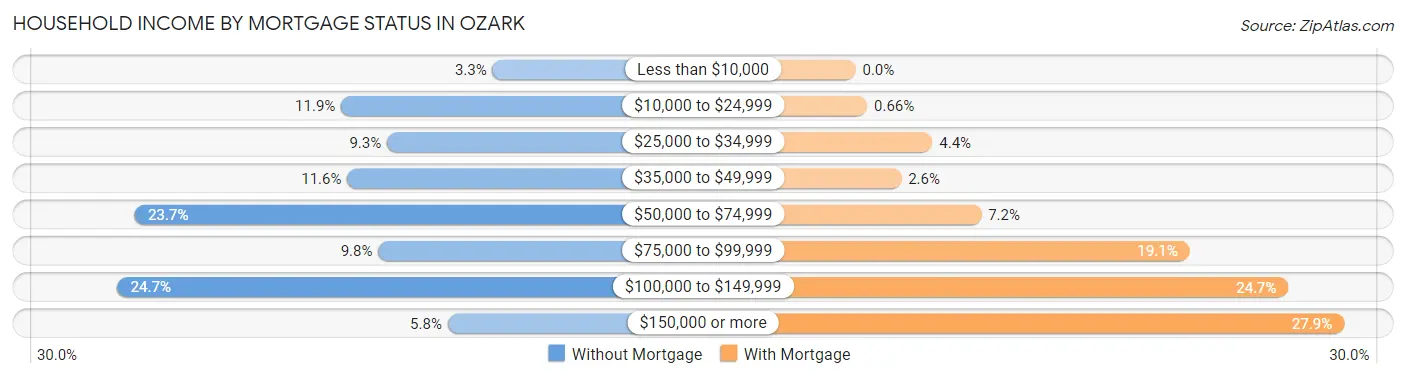
| Household Income | Without Mortgage | With Mortgage |
| Less than $10,000 | 46 (3.3%) | 0 (0.0%) |
| $10,000 to $24,999 | 168 (11.9%) | 27 (0.7%) |
| $25,000 to $34,999 | 131 (9.3%) | 180 (4.4%) |
| $35,000 to $49,999 | 163 (11.6%) | 107 (2.6%) |
| $50,000 to $74,999 | 334 (23.7%) | 294 (7.2%) |
| $75,000 to $99,999 | 138 (9.8%) | 782 (19.1%) |
| $100,000 to $149,999 | 348 (24.7%) | 1,013 (24.7%) |
| $150,000 or more | 82 (5.8%) | 1,143 (27.9%) |
| Total | 1,410 (100.0%) | 4,096 (100.0%) |
Property Value to Household Income Ratio in Ozark
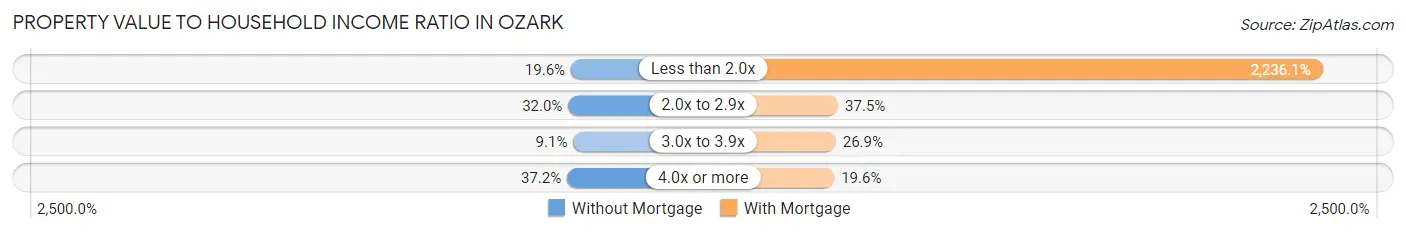
| Value-to-Income Ratio | Without Mortgage | With Mortgage |
| Less than 2.0x | 276 (19.6%) | 91,591 (2,236.1%) |
| 2.0x to 2.9x | 451 (32.0%) | 1,536 (37.5%) |
| 3.0x to 3.9x | 128 (9.1%) | 1,100 (26.9%) |
| 4.0x or more | 524 (37.2%) | 801 (19.6%) |
| Total | 1,410 (100.0%) | 4,096 (100.0%) |
Real Estate Taxes by Mortgage Status in Ozark
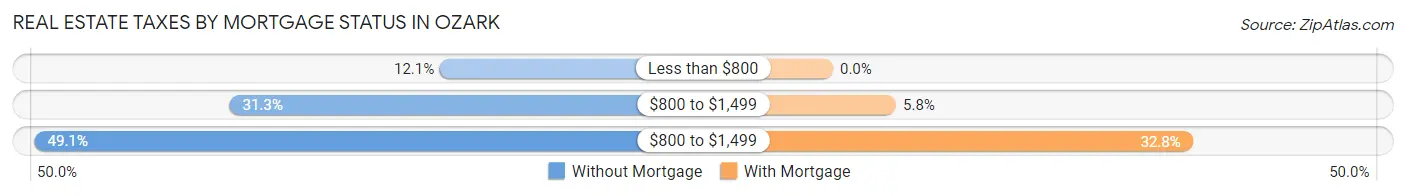
| Property Taxes | Without Mortgage | With Mortgage |
| Less than $800 | 170 (12.1%) | 0 (0.0%) |
| $800 to $1,499 | 441 (31.3%) | 236 (5.8%) |
| $800 to $1,499 | 692 (49.1%) | 1,345 (32.8%) |
| Total | 1,410 (100.0%) | 4,096 (100.0%) |
Health & Disability in Ozark
Health Insurance Coverage by Age in Ozark
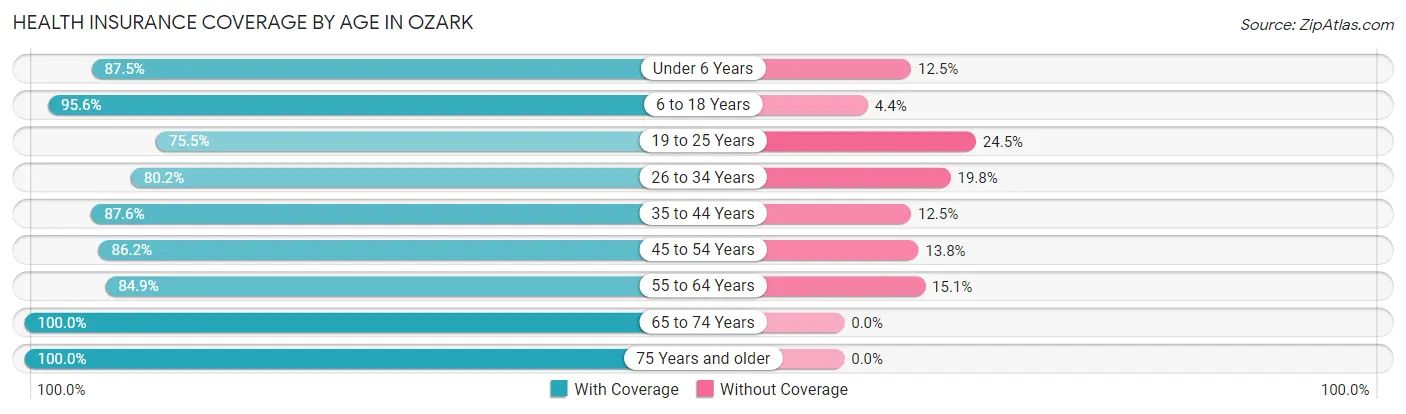
| Age Bracket | With Coverage | Without Coverage |
| Under 6 Years | 1,558 (87.5%) | 222 (12.5%) |
| 6 to 18 Years | 4,566 (95.6%) | 210 (4.4%) |
| 19 to 25 Years | 1,273 (75.5%) | 414 (24.5%) |
| 26 to 34 Years | 2,253 (80.2%) | 557 (19.8%) |
| 35 to 44 Years | 2,580 (87.5%) | 367 (12.4%) |
| 45 to 54 Years | 2,051 (86.2%) | 329 (13.8%) |
| 55 to 64 Years | 1,707 (84.9%) | 303 (15.1%) |
| 65 to 74 Years | 1,632 (100.0%) | 0 (0.0%) |
| 75 Years and older | 1,101 (100.0%) | 0 (0.0%) |
| Total | 18,721 (88.6%) | 2,402 (11.4%) |
Health Insurance Coverage by Citizenship Status in Ozark
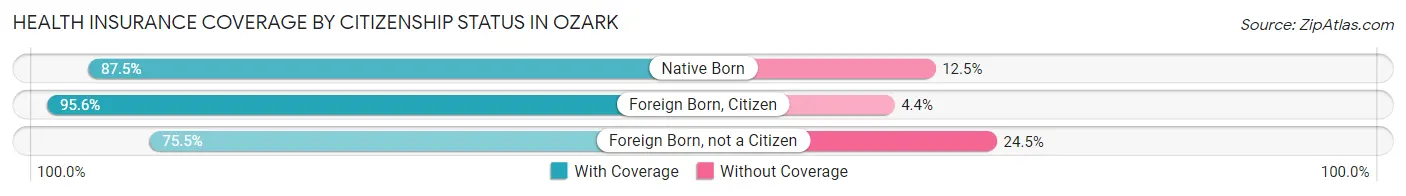
| Citizenship Status | With Coverage | Without Coverage |
| Native Born | 1,558 (87.5%) | 222 (12.5%) |
| Foreign Born, Citizen | 4,566 (95.6%) | 210 (4.4%) |
| Foreign Born, not a Citizen | 1,273 (75.5%) | 414 (24.5%) |
Health Insurance Coverage by Household Income in Ozark
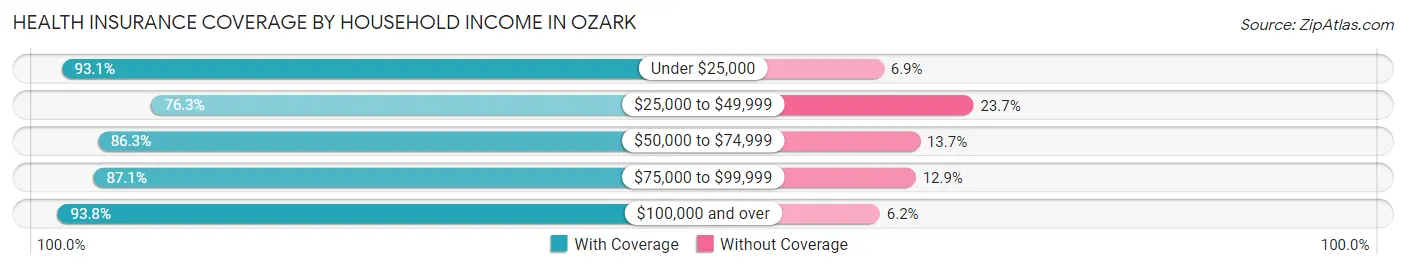
| Household Income | With Coverage | Without Coverage |
| Under $25,000 | 1,960 (93.1%) | 146 (6.9%) |
| $25,000 to $49,999 | 2,094 (76.3%) | 652 (23.7%) |
| $50,000 to $74,999 | 3,696 (86.3%) | 587 (13.7%) |
| $75,000 to $99,999 | 3,527 (87.1%) | 523 (12.9%) |
| $100,000 and over | 7,411 (93.8%) | 489 (6.2%) |
Public vs Private Health Insurance Coverage by Age in Ozark
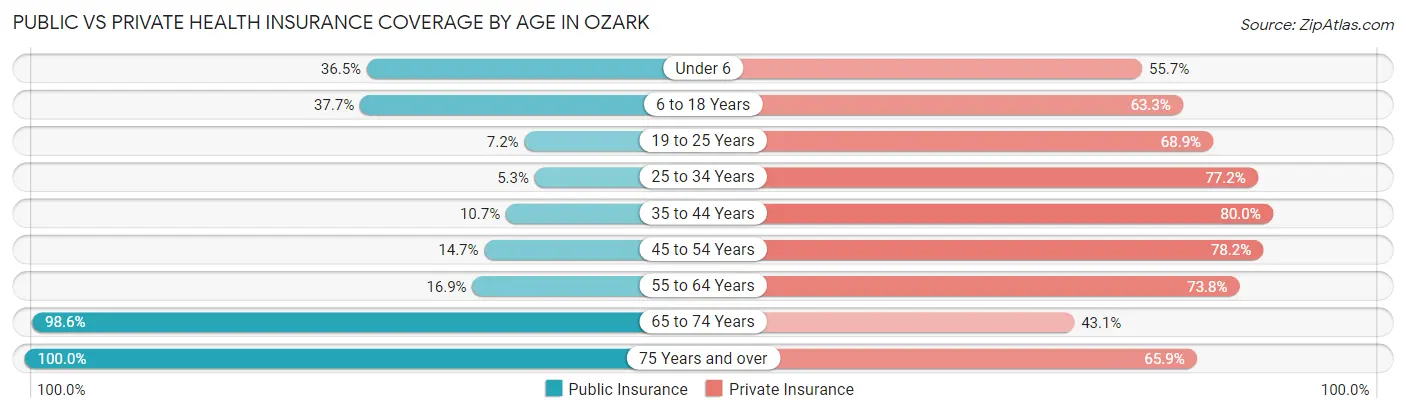
| Age Bracket | Public Insurance | Private Insurance |
| Under 6 | 649 (36.5%) | 992 (55.7%) |
| 6 to 18 Years | 1,802 (37.7%) | 3,022 (63.3%) |
| 19 to 25 Years | 122 (7.2%) | 1,162 (68.9%) |
| 25 to 34 Years | 149 (5.3%) | 2,168 (77.1%) |
| 35 to 44 Years | 314 (10.6%) | 2,356 (79.9%) |
| 45 to 54 Years | 349 (14.7%) | 1,861 (78.2%) |
| 55 to 64 Years | 339 (16.9%) | 1,483 (73.8%) |
| 65 to 74 Years | 1,609 (98.6%) | 704 (43.1%) |
| 75 Years and over | 1,101 (100.0%) | 725 (65.8%) |
| Total | 6,434 (30.5%) | 14,473 (68.5%) |
Disability Status by Sex by Age in Ozark
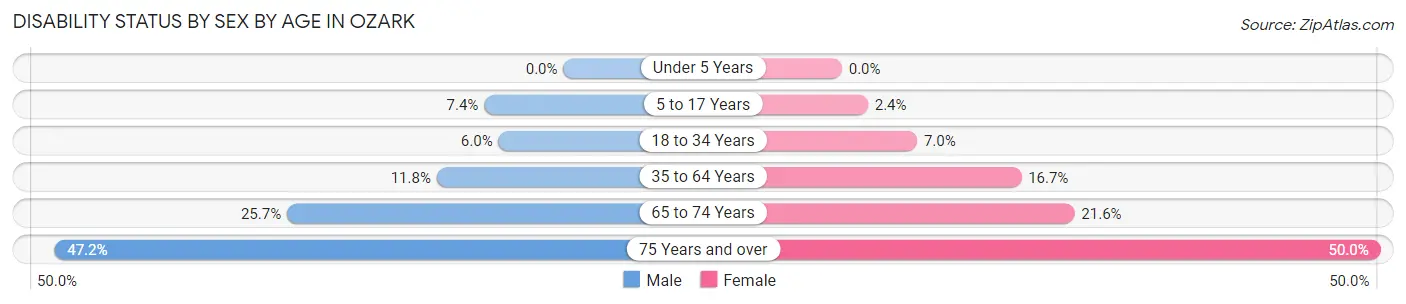
| Age Bracket | Male | Female |
| Under 5 Years | 0 (0.0%) | 0 (0.0%) |
| 5 to 17 Years | 185 (7.3%) | 51 (2.4%) |
| 18 to 34 Years | 160 (6.0%) | 158 (7.0%) |
| 35 to 64 Years | 378 (11.7%) | 686 (16.7%) |
| 65 to 74 Years | 206 (25.7%) | 179 (21.6%) |
| 75 Years and over | 197 (47.2%) | 342 (50.0%) |
Disability Class by Sex by Age in Ozark
Disability Class: Hearing Difficulty
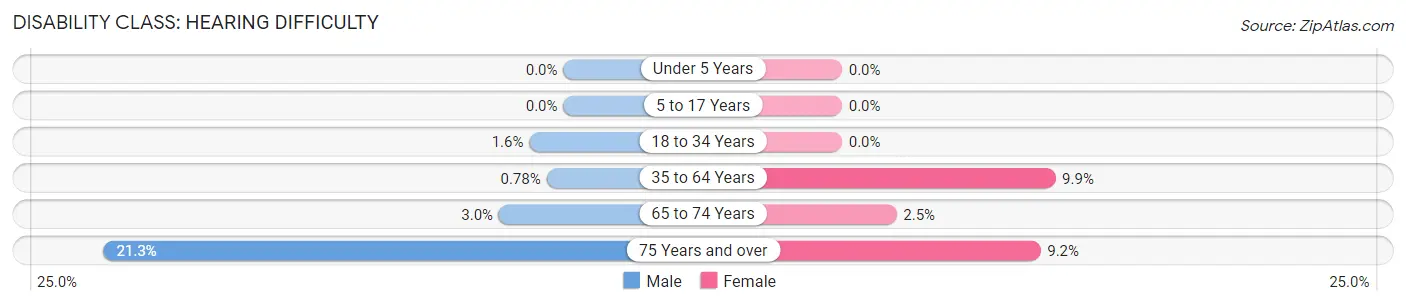
| Age Bracket | Male | Female |
| Under 5 Years | 0 (0.0%) | 0 (0.0%) |
| 5 to 17 Years | 0 (0.0%) | 0 (0.0%) |
| 18 to 34 Years | 42 (1.6%) | 0 (0.0%) |
| 35 to 64 Years | 25 (0.8%) | 408 (9.9%) |
| 65 to 74 Years | 24 (3.0%) | 21 (2.5%) |
| 75 Years and over | 89 (21.3%) | 63 (9.2%) |
Disability Class: Vision Difficulty
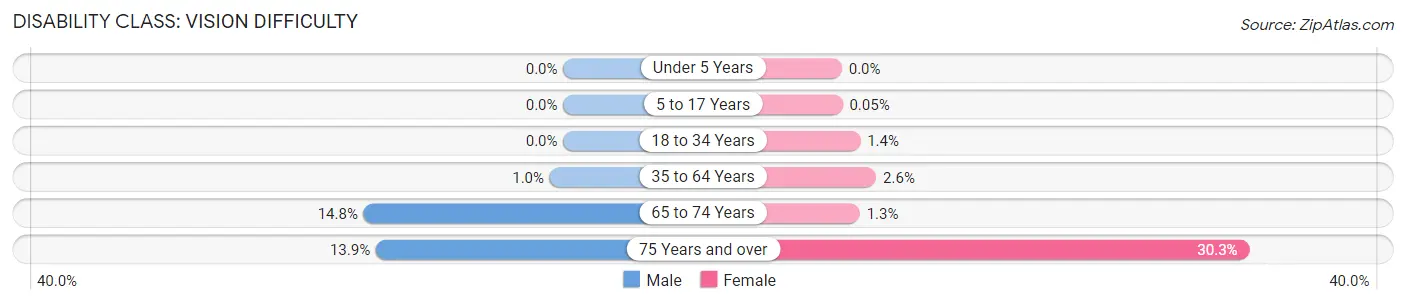
| Age Bracket | Male | Female |
| Under 5 Years | 0 (0.0%) | 0 (0.0%) |
| 5 to 17 Years | 0 (0.0%) | 1 (0.1%) |
| 18 to 34 Years | 0 (0.0%) | 31 (1.4%) |
| 35 to 64 Years | 32 (1.0%) | 105 (2.5%) |
| 65 to 74 Years | 119 (14.8%) | 11 (1.3%) |
| 75 Years and over | 58 (13.9%) | 207 (30.3%) |
Disability Class: Cognitive Difficulty
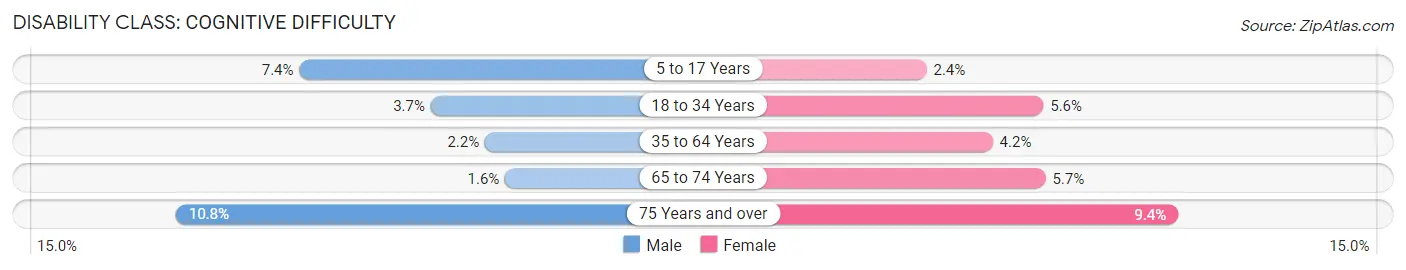
| Age Bracket | Male | Female |
| 5 to 17 Years | 185 (7.3%) | 50 (2.4%) |
| 18 to 34 Years | 98 (3.7%) | 127 (5.6%) |
| 35 to 64 Years | 70 (2.2%) | 173 (4.2%) |
| 65 to 74 Years | 13 (1.6%) | 47 (5.7%) |
| 75 Years and over | 45 (10.8%) | 64 (9.4%) |
Disability Class: Ambulatory Difficulty
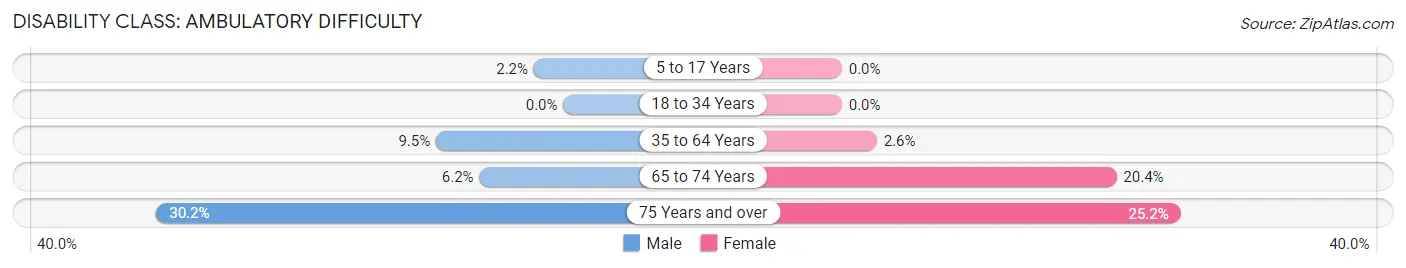
| Age Bracket | Male | Female |
| 5 to 17 Years | 55 (2.2%) | 0 (0.0%) |
| 18 to 34 Years | 0 (0.0%) | 0 (0.0%) |
| 35 to 64 Years | 304 (9.5%) | 107 (2.6%) |
| 65 to 74 Years | 50 (6.2%) | 169 (20.4%) |
| 75 Years and over | 126 (30.2%) | 172 (25.2%) |
Disability Class: Self-Care Difficulty
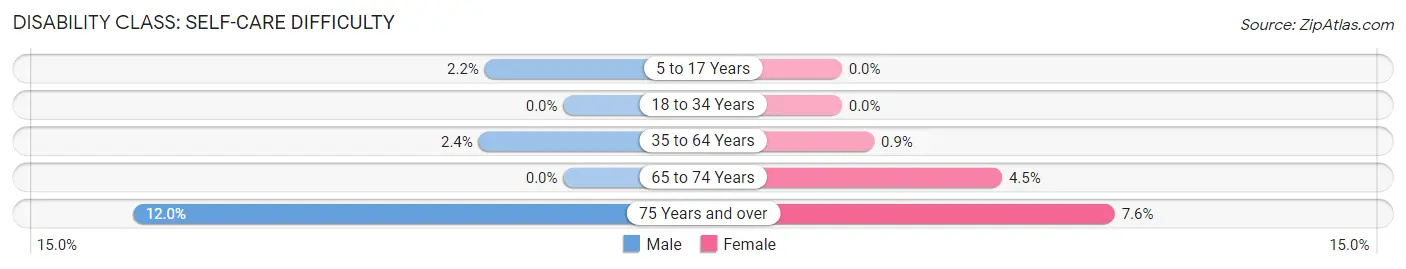
| Age Bracket | Male | Female |
| 5 to 17 Years | 55 (2.2%) | 0 (0.0%) |
| 18 to 34 Years | 0 (0.0%) | 0 (0.0%) |
| 35 to 64 Years | 76 (2.4%) | 37 (0.9%) |
| 65 to 74 Years | 0 (0.0%) | 37 (4.5%) |
| 75 Years and over | 50 (12.0%) | 52 (7.6%) |
Technology Access in Ozark
Computing Device Access in Ozark
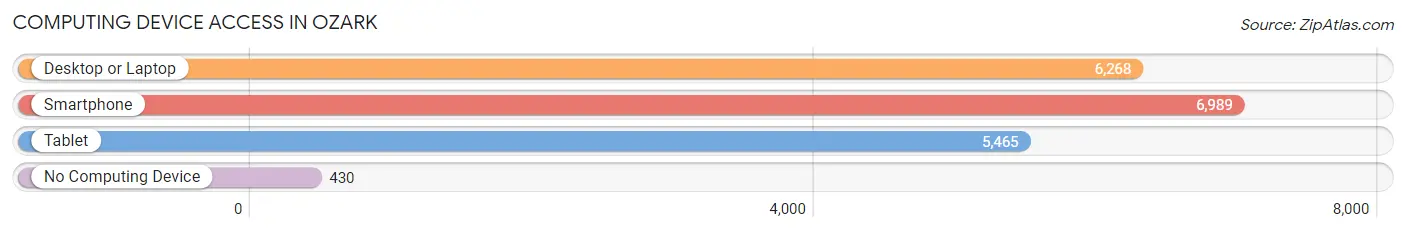
| Device Type | # Households | % Households |
| Desktop or Laptop | 6,268 | 76.6% |
| Smartphone | 6,989 | 85.5% |
| Tablet | 5,465 | 66.8% |
| No Computing Device | 430 | 5.3% |
| Total | 8,179 | 100.0% |
Internet Access in Ozark
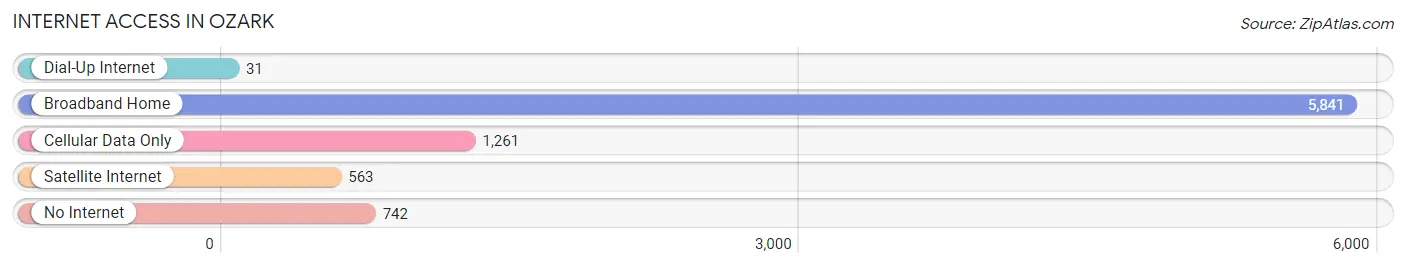
| Internet Type | # Households | % Households |
| Dial-Up Internet | 31 | 0.4% |
| Broadband Home | 5,841 | 71.4% |
| Cellular Data Only | 1,261 | 15.4% |
| Satellite Internet | 563 | 6.9% |
| No Internet | 742 | 9.1% |
| Total | 8,179 | 100.0% |
Ozark Summary
Ozark, Missouri is a small city located in Christian County, Missouri, United States. It is situated on the banks of the Finley River, and is part of the Springfield Metropolitan Statistical Area. The city has a population of approximately 17,000 people, and is the county seat of Christian County.
History
Ozark was founded in 1837 by a group of settlers from Tennessee. The city was named after the Ozark Mountains, which are located in the nearby region. The city was originally a trading post, and was later incorporated in 1855.
In the late 19th century, Ozark was a thriving agricultural community, with a variety of crops being grown in the area. The city was also home to a number of businesses, including a flour mill, a sawmill, and a brickyard.
In the early 20th century, Ozark experienced a period of growth and development. The city was connected to the railroad in 1906, and the first paved road was built in 1910. The city also saw the construction of a number of new buildings, including a courthouse, a hospital, and a school.
Geography
Ozark is located in the Ozark Plateau region of Missouri. The city is situated on the banks of the Finley River, and is surrounded by rolling hills and forests. The city has a total area of 8.3 square miles, and has an elevation of 890 feet.
The climate in Ozark is humid subtropical, with hot, humid summers and mild winters. The average annual temperature is around 57 degrees Fahrenheit, and the average annual precipitation is around 40 inches.
Economy
Ozark’s economy is largely based on agriculture and manufacturing. The city is home to a number of agricultural businesses, including dairy farms, poultry farms, and vegetable farms. The city is also home to a number of manufacturing businesses, including a furniture factory, a plastics factory, and a metal fabrication plant.
The city is also home to a number of retail businesses, including a variety of restaurants, shops, and stores. The city is also home to a number of medical facilities, including a hospital and a number of clinics.
Demographics
As of the 2010 census, the population of Ozark was 17,039. The racial makeup of the city was 94.3% White, 1.3% African American, 0.4% Native American, 0.7% Asian, 0.1% Pacific Islander, 1.2% from other races, and 2.0% from two or more races. Hispanic or Latino of any race were 3.2% of the population.
The median household income in Ozark was $41,945, and the median family income was $50,945. The per capita income in Ozark was $20,945. About 11.3% of the population was below the poverty line.
Conclusion
Ozark, Missouri is a small city located in Christian County, Missouri, United States. It is situated on the banks of the Finley River, and is part of the Springfield Metropolitan Statistical Area. The city has a population of approximately 17,000 people, and is the county seat of Christian County. Ozark was founded in 1837 by a group of settlers from Tennessee, and has since grown into a thriving agricultural and manufacturing community. The city is home to a variety of businesses, including a furniture factory, a plastics factory, and a metal fabrication plant. The population of Ozark is largely White, with a small percentage of African American, Native American, Asian, and Pacific Islander residents. The median household income in Ozark is $41,945, and the median family income is $50,945.
Common Questions
What is Per Capita Income in Ozark?
Per Capita income in Ozark is $30,317.
What is the Median Family Income in Ozark?
Median Family Income in Ozark is $82,538.
What is the Median Household income in Ozark?
Median Household Income in Ozark is $66,631.
What is Income or Wage Gap in Ozark?
Income or Wage Gap in Ozark is 24.0%.
Women in Ozark earn 76.0 cents for every dollar earned by a man.
What is Family Income Deficit in Ozark?
Family Income Deficit in Ozark is $14,226.
Families that are below poverty line in Ozark earn $14,226 less on average than the poverty threshold level.
What is Inequality or Gini Index in Ozark?
Inequality or Gini Index in Ozark is 0.38.
What is the Total Population of Ozark?
Total Population of Ozark is 21,459.
What is the Total Male Population of Ozark?
Total Male Population of Ozark is 10,278.
What is the Total Female Population of Ozark?
Total Female Population of Ozark is 11,181.
What is the Ratio of Males per 100 Females in Ozark?
There are 91.92 Males per 100 Females in Ozark.
What is the Ratio of Females per 100 Males in Ozark?
There are 108.79 Females per 100 Males in Ozark.
What is the Median Population Age in Ozark?
Median Population Age in Ozark is 33.1 Years.
What is the Average Family Size in Ozark
Average Family Size in Ozark is 3.1 People.
What is the Average Household Size in Ozark
Average Household Size in Ozark is 2.6 People.
How Large is the Labor Force in Ozark?
There are 10,679 People in the Labor Forcein in Ozark.
What is the Percentage of People in the Labor Force in Ozark?
67.0% of People are in the Labor Force in Ozark.
What is the Unemployment Rate in Ozark?
Unemployment Rate in Ozark is 3.6%.