Fairfax, MO Map & Demographics
Fairfax Map
Fairfax Overview
$32,167
PER CAPITA INCOME
$60,197
AVG FAMILY INCOME
$49,583
AVG HOUSEHOLD INCOME
65.8%
WAGE / INCOME GAP [ % ]
34.2¢/ $1
WAGE / INCOME GAP [ $ ]
0.42
INEQUALITY / GINI INDEX
646
TOTAL POPULATION
316
MALE POPULATION
330
FEMALE POPULATION
95.76
MALES / 100 FEMALES
104.43
FEMALES / 100 MALES
53.3
MEDIAN AGE
2.4
AVG FAMILY SIZE
2.0
AVG HOUSEHOLD SIZE
344
LABOR FORCE [ PEOPLE ]
61.3%
PERCENT IN LABOR FORCE
3.5%
UNEMPLOYMENT RATE
Fairfax Zip Codes
Fairfax Area Codes
Income in Fairfax
Income Overview in Fairfax
Per Capita Income in Fairfax is $32,167, while median incomes of families and households are $60,197 and $49,583 respectively.
| Characteristic | Number | Measure |
| Per Capita Income | 646 | $32,167 |
| Median Family Income | 193 | $60,197 |
| Mean Family Income | 193 | $69,980 |
| Median Household Income | 323 | $49,583 |
| Mean Household Income | 323 | $62,734 |
| Income Deficit | 193 | $0 |
| Wage / Income Gap (%) | 646 | 65.79% |
| Wage / Income Gap ($) | 646 | 34.21¢ per $1 |
| Gini / Inequality Index | 646 | 0.42 |
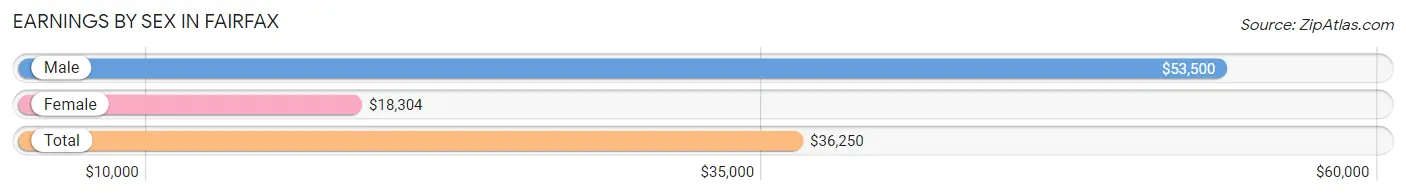
Earnings by Sex in Fairfax
Average Earnings in Fairfax are $36,250, $53,500 for men and $18,304 for women, a difference of 65.8%.
| Sex | Number | Average Earnings |
| Male | 192 (52.9%) | $53,500 |
| Female | 171 (47.1%) | $18,304 |
| Total | 363 (100.0%) | $36,250 |
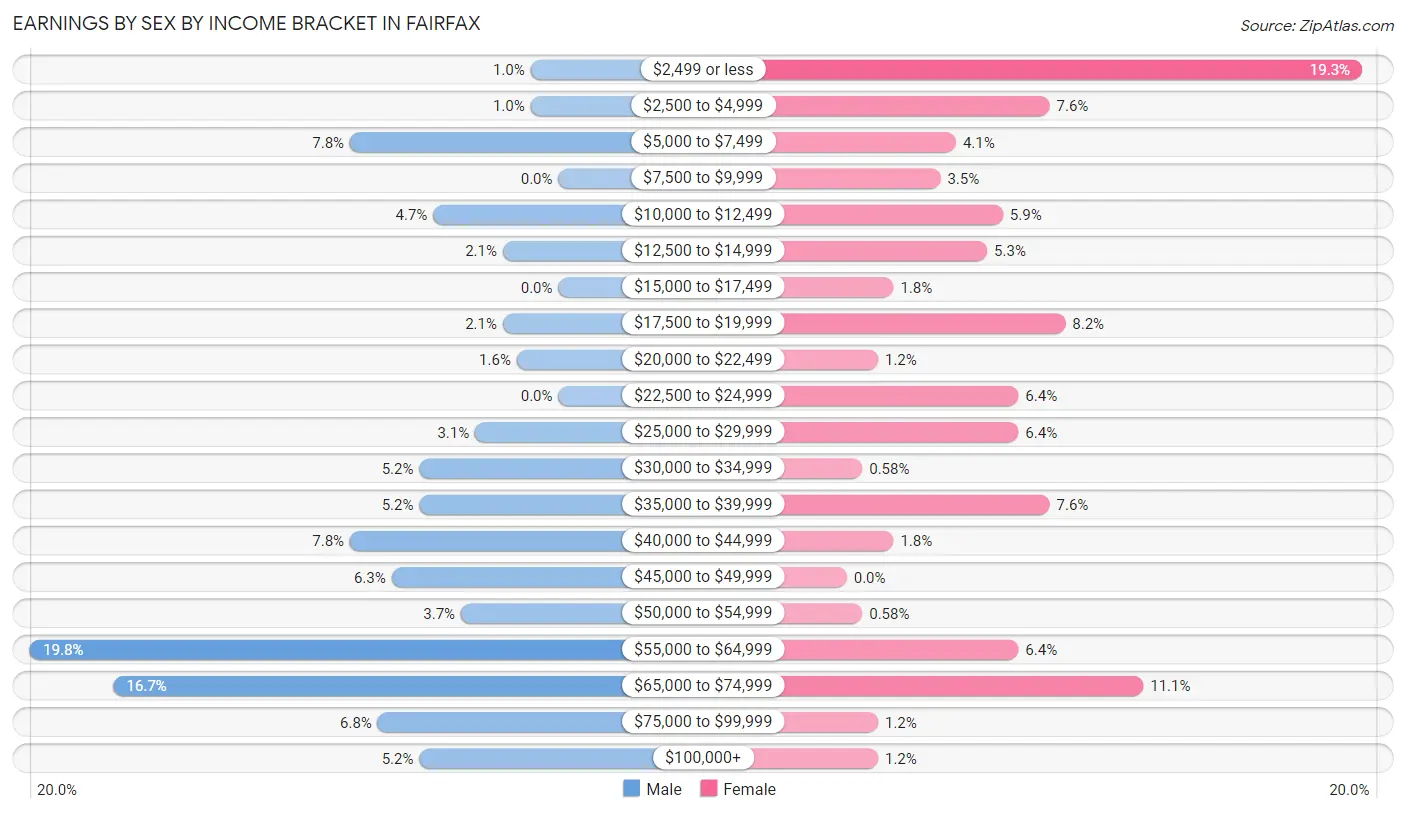
Earnings by Sex by Income Bracket in Fairfax
The most common earnings brackets in Fairfax are $55,000 to $64,999 for men (38 | 19.8%) and $2,499 or less for women (33 | 19.3%).
| Income | Male | Female |
| $2,499 or less | 2 (1.0%) | 33 (19.3%) |
| $2,500 to $4,999 | 2 (1.0%) | 13 (7.6%) |
| $5,000 to $7,499 | 15 (7.8%) | 7 (4.1%) |
| $7,500 to $9,999 | 0 (0.0%) | 6 (3.5%) |
| $10,000 to $12,499 | 9 (4.7%) | 10 (5.9%) |
| $12,500 to $14,999 | 4 (2.1%) | 9 (5.3%) |
| $15,000 to $17,499 | 0 (0.0%) | 3 (1.8%) |
| $17,500 to $19,999 | 4 (2.1%) | 14 (8.2%) |
| $20,000 to $22,499 | 3 (1.6%) | 2 (1.2%) |
| $22,500 to $24,999 | 0 (0.0%) | 11 (6.4%) |
| $25,000 to $29,999 | 6 (3.1%) | 11 (6.4%) |
| $30,000 to $34,999 | 10 (5.2%) | 1 (0.6%) |
| $35,000 to $39,999 | 10 (5.2%) | 13 (7.6%) |
| $40,000 to $44,999 | 15 (7.8%) | 3 (1.8%) |
| $45,000 to $49,999 | 12 (6.2%) | 0 (0.0%) |
| $50,000 to $54,999 | 7 (3.6%) | 1 (0.6%) |
| $55,000 to $64,999 | 38 (19.8%) | 11 (6.4%) |
| $65,000 to $74,999 | 32 (16.7%) | 19 (11.1%) |
| $75,000 to $99,999 | 13 (6.8%) | 2 (1.2%) |
| $100,000+ | 10 (5.2%) | 2 (1.2%) |
| Total | 192 (100.0%) | 171 (100.0%) |
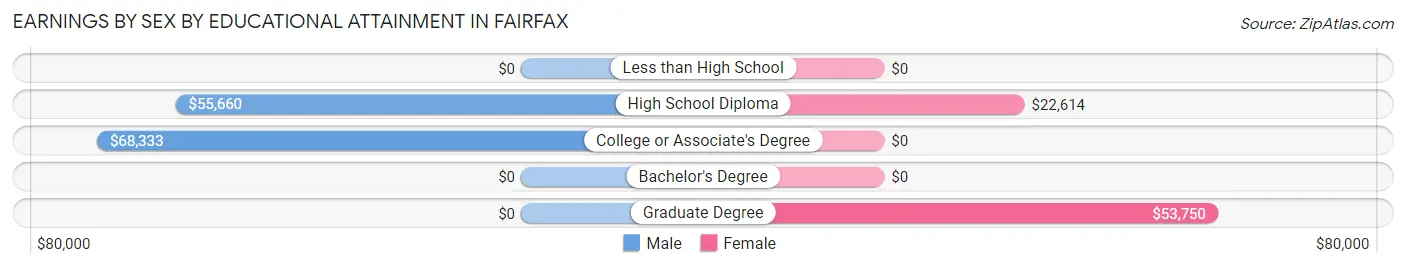
Earnings by Sex by Educational Attainment in Fairfax
Average earnings in Fairfax are $55,278 for men and $20,000 for women, a difference of 63.8%. Men with an educational attainment of college or associate's degree enjoy the highest average annual earnings of $68,333, while those with high school diploma education earn the least with $55,660. Women with an educational attainment of graduate degree earn the most with the average annual earnings of $53,750, while those with high school diploma education have the smallest earnings of $22,614.
| Educational Attainment | Male Income | Female Income |
| Less than High School | - | - |
| High School Diploma | $55,660 | $22,614 |
| College or Associate's Degree | $68,333 | $0 |
| Bachelor's Degree | - | - |
| Graduate Degree | - | - |
| Total | $55,278 | $20,000 |
Family Income in Fairfax
Family Income Brackets in Fairfax
According to the Fairfax family income data, there are 50 families falling into the $100,000 to $149,999 income range, which is the most common income bracket and makes up 25.9% of all families.
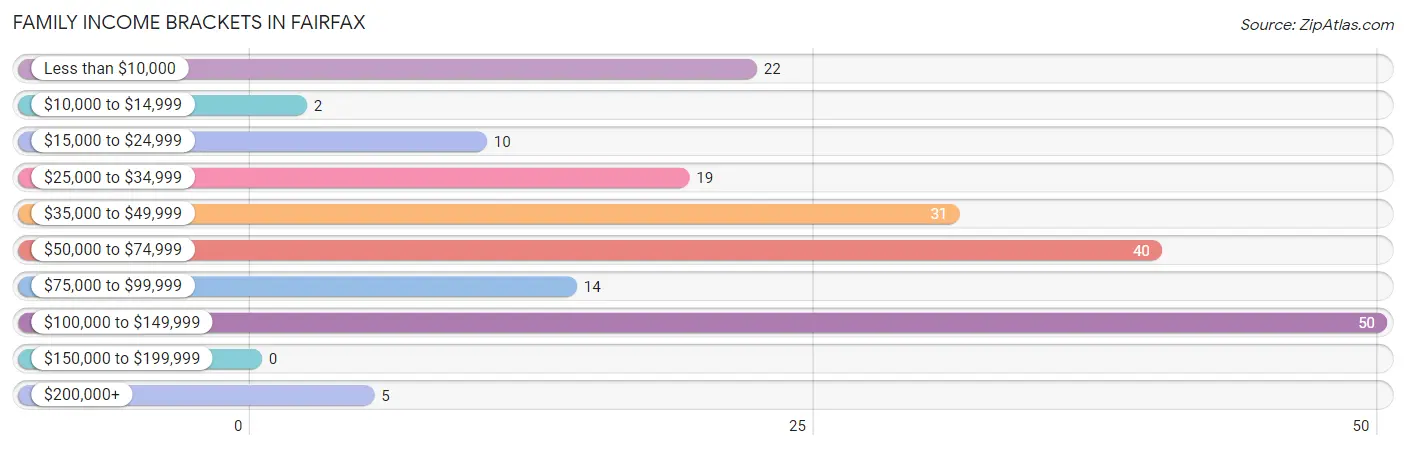
| Income Bracket | # Families | % Families |
| Less than $10,000 | 22 | 11.4% |
| $10,000 to $14,999 | 2 | 1.0% |
| $15,000 to $24,999 | 10 | 5.2% |
| $25,000 to $34,999 | 19 | 9.8% |
| $35,000 to $49,999 | 31 | 16.1% |
| $50,000 to $74,999 | 40 | 20.7% |
| $75,000 to $99,999 | 14 | 7.3% |
| $100,000 to $149,999 | 50 | 25.9% |
| $150,000 to $199,999 | 0 | 0.0% |
| $200,000+ | 5 | 2.6% |
Family Income by Famaliy Size in Fairfax
4-person families (10 | 5.2%) account for the highest median family income in Fairfax with $125,833 per family, while 4-person families (10 | 5.2%) have the highest median income of $31,458 per family member.
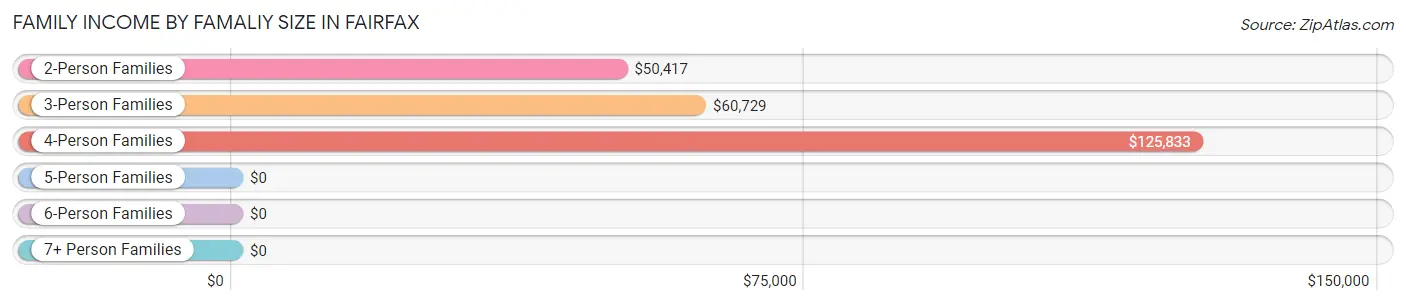
| Income Bracket | # Families | Median Income |
| 2-Person Families | 128 (66.3%) | $50,417 |
| 3-Person Families | 45 (23.3%) | $60,729 |
| 4-Person Families | 10 (5.2%) | $125,833 |
| 5-Person Families | 9 (4.7%) | $0 |
| 6-Person Families | 1 (0.5%) | $0 |
| 7+ Person Families | 0 (0.0%) | $0 |
| Total | 193 (100.0%) | $60,197 |
Family Income by Number of Earners in Fairfax
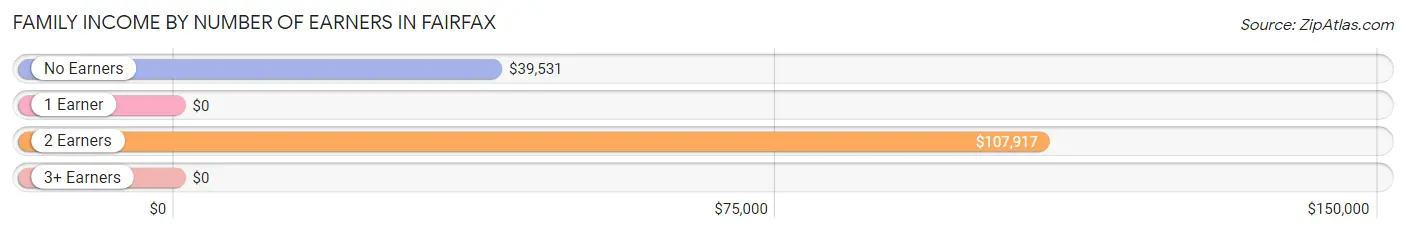
| Number of Earners | # Families | Median Income |
| No Earners | 41 (21.2%) | $39,531 |
| 1 Earner | 56 (29.0%) | $0 |
| 2 Earners | 85 (44.0%) | $107,917 |
| 3+ Earners | 11 (5.7%) | $0 |
| Total | 193 (100.0%) | $60,197 |
Household Income in Fairfax
Household Income Brackets in Fairfax
With 75 households falling in the category, the $50,000 to $74,999 income range is the most frequent in Fairfax, accounting for 23.2% of all households.
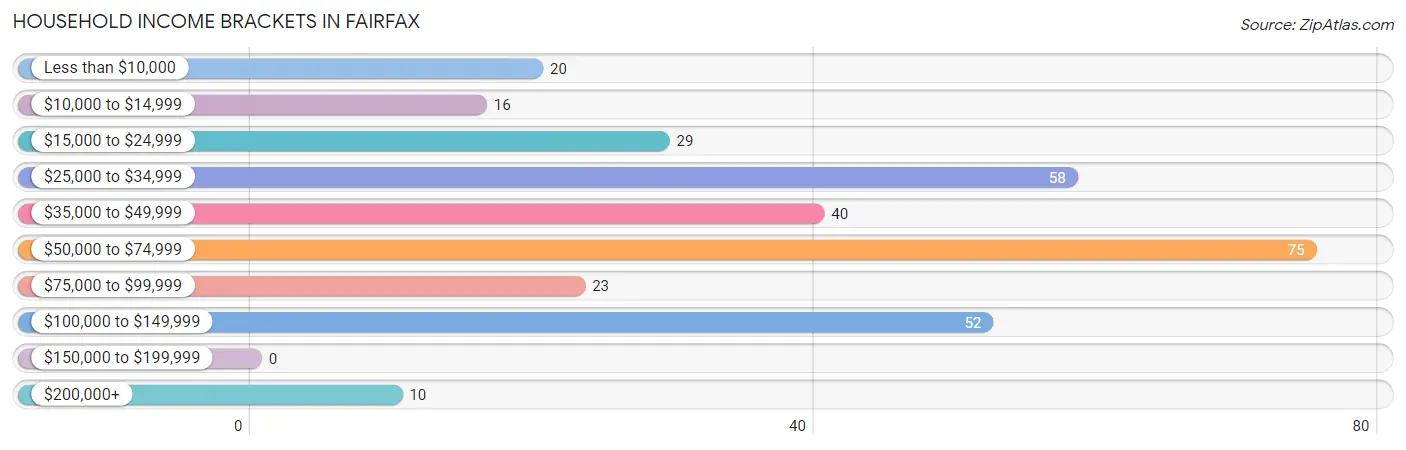
| Income Bracket | # Households | % Households |
| Less than $10,000 | 20 | 6.2% |
| $10,000 to $14,999 | 16 | 5.0% |
| $15,000 to $24,999 | 29 | 9.0% |
| $25,000 to $34,999 | 58 | 18.0% |
| $35,000 to $49,999 | 40 | 12.4% |
| $50,000 to $74,999 | 75 | 23.2% |
| $75,000 to $99,999 | 23 | 7.1% |
| $100,000 to $149,999 | 52 | 16.1% |
| $150,000 to $199,999 | 0 | 0.0% |
| $200,000+ | 10 | 3.1% |
Household Income by Householder Age in Fairfax
The median household income in Fairfax is $49,583, with the highest median household income of $67,625 found in the 25 to 44 years age bracket for the primary householder. A total of 90 households (27.9%) fall into this category. Meanwhile, the 65+ years age bracket for the primary householder has the lowest median household income of $32,969, with 117 households (36.2%) in this group.
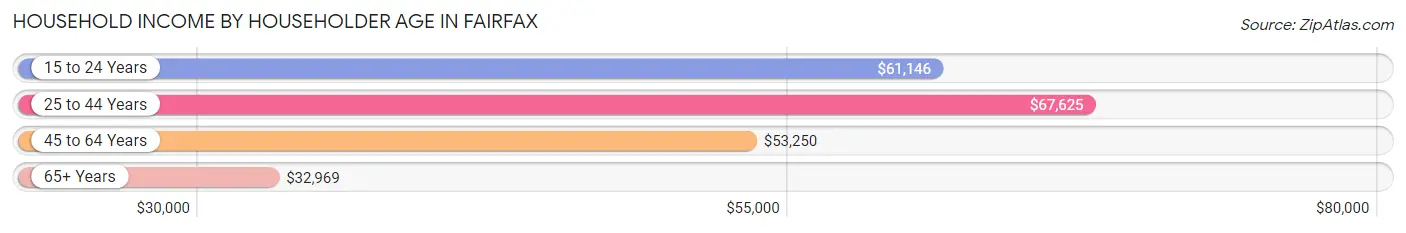
| Income Bracket | # Households | Median Income |
| 15 to 24 Years | 17 (5.3%) | $61,146 |
| 25 to 44 Years | 90 (27.9%) | $67,625 |
| 45 to 64 Years | 99 (30.6%) | $53,250 |
| 65+ Years | 117 (36.2%) | $32,969 |
| Total | 323 (100.0%) | $49,583 |
Poverty in Fairfax
Income Below Poverty by Sex and Age in Fairfax
With 4.1% poverty level for males and 24.8% for females among the residents of Fairfax, under 5 year old males and under 5 year old females are the most vulnerable to poverty, with 4 males (80.0%) and 18 females (62.1%) in their respective age groups living below the poverty level.
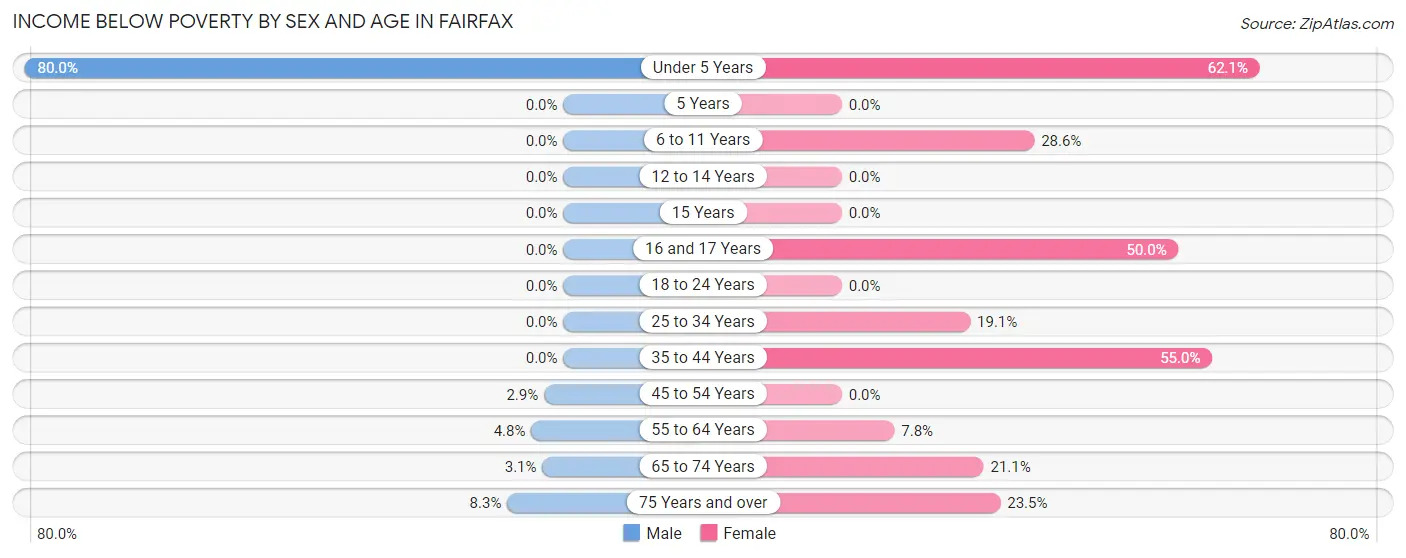
| Age Bracket | Male | Female |
| Under 5 Years | 4 (80.0%) | 18 (62.1%) |
| 5 Years | 0 (0.0%) | 0 (0.0%) |
| 6 to 11 Years | 0 (0.0%) | 4 (28.6%) |
| 12 to 14 Years | 0 (0.0%) | 0 (0.0%) |
| 15 Years | 0 (0.0%) | 0 (0.0%) |
| 16 and 17 Years | 0 (0.0%) | 5 (50.0%) |
| 18 to 24 Years | 0 (0.0%) | 0 (0.0%) |
| 25 to 34 Years | 0 (0.0%) | 8 (19.1%) |
| 35 to 44 Years | 0 (0.0%) | 22 (55.0%) |
| 45 to 54 Years | 1 (2.9%) | 0 (0.0%) |
| 55 to 64 Years | 2 (4.8%) | 5 (7.8%) |
| 65 to 74 Years | 2 (3.1%) | 12 (21.0%) |
| 75 Years and over | 4 (8.3%) | 8 (23.5%) |
| Total | 13 (4.1%) | 82 (24.8%) |
Income Above Poverty by Sex and Age in Fairfax
According to the poverty statistics in Fairfax, males aged 5 years and females aged 5 years are the age groups that are most secure financially, with 100.0% of males and 100.0% of females in these age groups living above the poverty line.
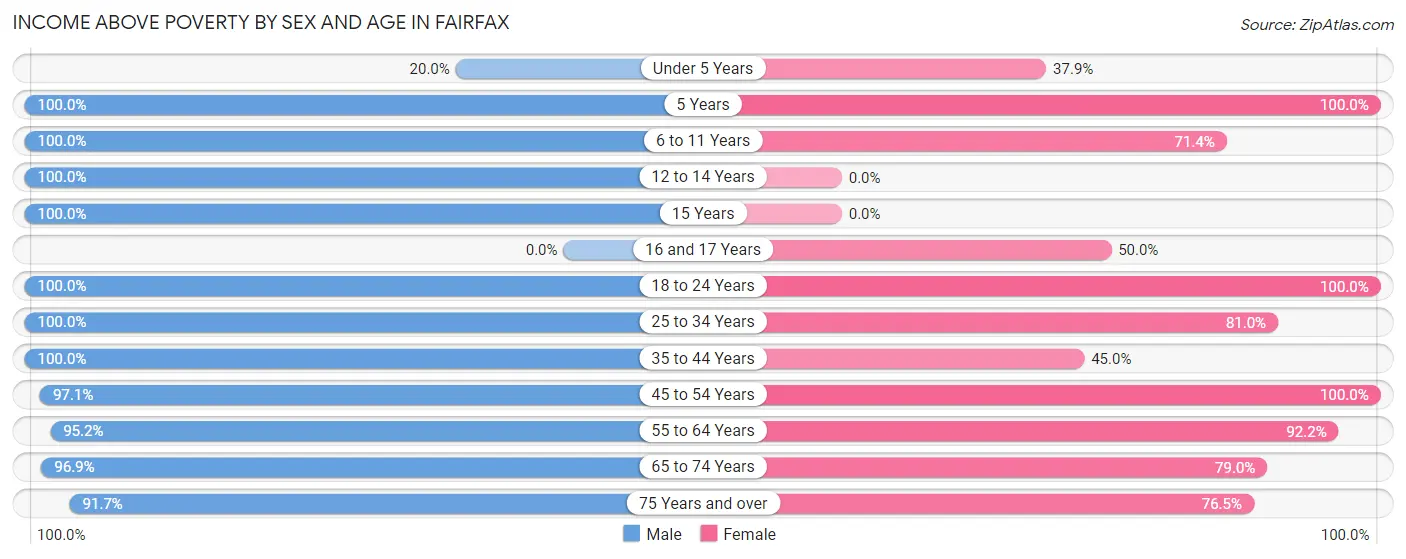
| Age Bracket | Male | Female |
| Under 5 Years | 1 (20.0%) | 11 (37.9%) |
| 5 Years | 1 (100.0%) | 8 (100.0%) |
| 6 to 11 Years | 13 (100.0%) | 10 (71.4%) |
| 12 to 14 Years | 5 (100.0%) | 0 (0.0%) |
| 15 Years | 10 (100.0%) | 0 (0.0%) |
| 16 and 17 Years | 0 (0.0%) | 5 (50.0%) |
| 18 to 24 Years | 14 (100.0%) | 15 (100.0%) |
| 25 to 34 Years | 70 (100.0%) | 34 (80.9%) |
| 35 to 44 Years | 9 (100.0%) | 18 (45.0%) |
| 45 to 54 Years | 34 (97.1%) | 17 (100.0%) |
| 55 to 64 Years | 40 (95.2%) | 59 (92.2%) |
| 65 to 74 Years | 62 (96.9%) | 45 (78.9%) |
| 75 Years and over | 44 (91.7%) | 26 (76.5%) |
| Total | 303 (95.9%) | 248 (75.1%) |
Income Below Poverty Among Married-Couple Families in Fairfax
The poverty statistics for married-couple families in Fairfax show that 1.3% or 2 of the total 148 families live below the poverty line. Families with no children have the highest poverty rate of 1.9%, comprising of 2 families. On the other hand, families with 1 or 2 children have the lowest poverty rate of 0.0%, which includes 0 families.
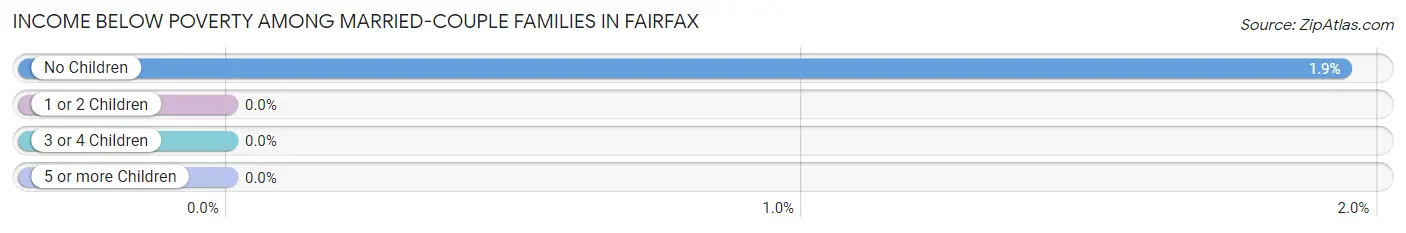
| Children | Above Poverty | Below Poverty |
| No Children | 101 (98.1%) | 2 (1.9%) |
| 1 or 2 Children | 35 (100.0%) | 0 (0.0%) |
| 3 or 4 Children | 10 (100.0%) | 0 (0.0%) |
| 5 or more Children | 0 (0.0%) | 0 (0.0%) |
| Total | 146 (98.7%) | 2 (1.3%) |
Income Below Poverty Among Single-Parent Households in Fairfax
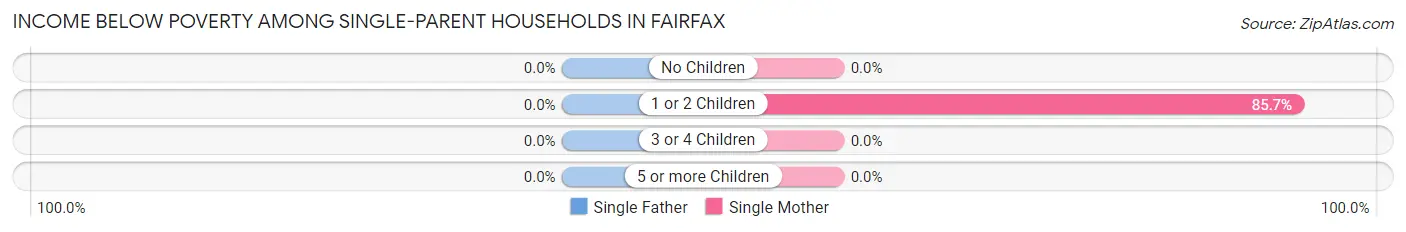
| Children | Single Father | Single Mother |
| No Children | 0 (0.0%) | 0 (0.0%) |
| 1 or 2 Children | 0 (0.0%) | 24 (85.7%) |
| 3 or 4 Children | 0 (0.0%) | 0 (0.0%) |
| 5 or more Children | 0 (0.0%) | 0 (0.0%) |
| Total | 0 (0.0%) | 24 (63.2%) |
Income Below Poverty Among Married-Couple vs Single-Parent Households in Fairfax
The poverty data for Fairfax shows that 2 of the married-couple family households (1.3%) and 24 of the single-parent households (53.3%) are living below the poverty level. Within the married-couple family households, those with no children have the highest poverty rate, with 2 households (1.9%) falling below the poverty line. Among the single-parent households, those with 1 or 2 children have the highest poverty rate, with 24 household (68.6%) living below poverty.
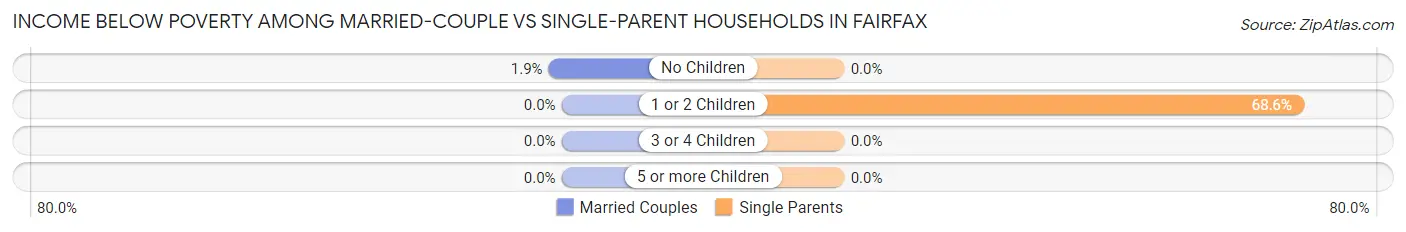
| Children | Married-Couple Families | Single-Parent Households |
| No Children | 2 (1.9%) | 0 (0.0%) |
| 1 or 2 Children | 0 (0.0%) | 24 (68.6%) |
| 3 or 4 Children | 0 (0.0%) | 0 (0.0%) |
| 5 or more Children | 0 (0.0%) | 0 (0.0%) |
| Total | 2 (1.3%) | 24 (53.3%) |
Race in Fairfax
The most populous races in Fairfax are White / Caucasian (579 | 89.6%), Two or more Races (57 | 8.8%), and Hispanic or Latino (10 | 1.5%).
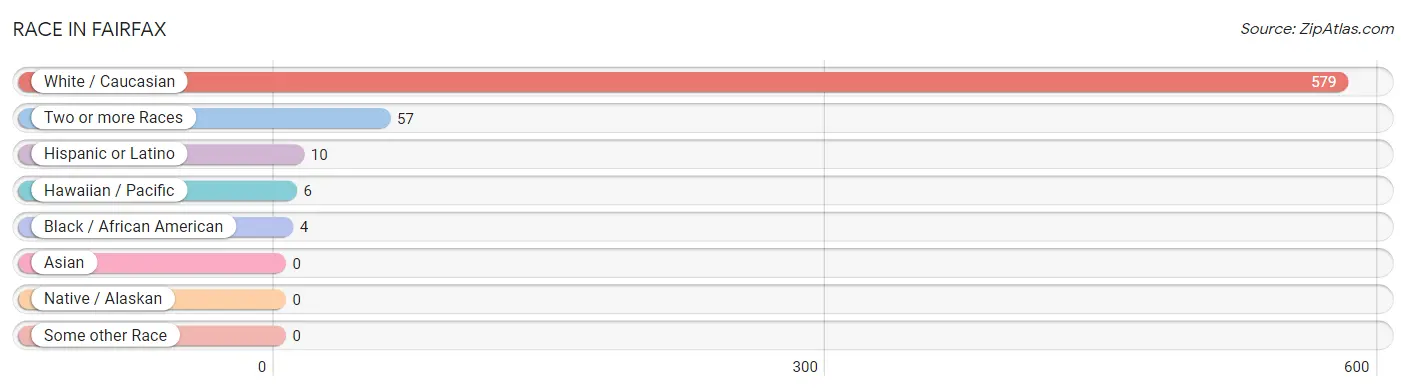
| Race | # Population | % Population |
| Asian | 0 | 0.0% |
| Black / African American | 4 | 0.6% |
| Hawaiian / Pacific | 6 | 0.9% |
| Hispanic or Latino | 10 | 1.5% |
| Native / Alaskan | 0 | 0.0% |
| White / Caucasian | 579 | 89.6% |
| Two or more Races | 57 | 8.8% |
| Some other Race | 0 | 0.0% |
| Total | 646 | 100.0% |
Ancestry in Fairfax
The most populous ancestries reported in Fairfax are German (176 | 27.2%), Irish (139 | 21.5%), English (49 | 7.6%), American (39 | 6.0%), and French (22 | 3.4%), together accounting for 65.8% of all Fairfax residents.
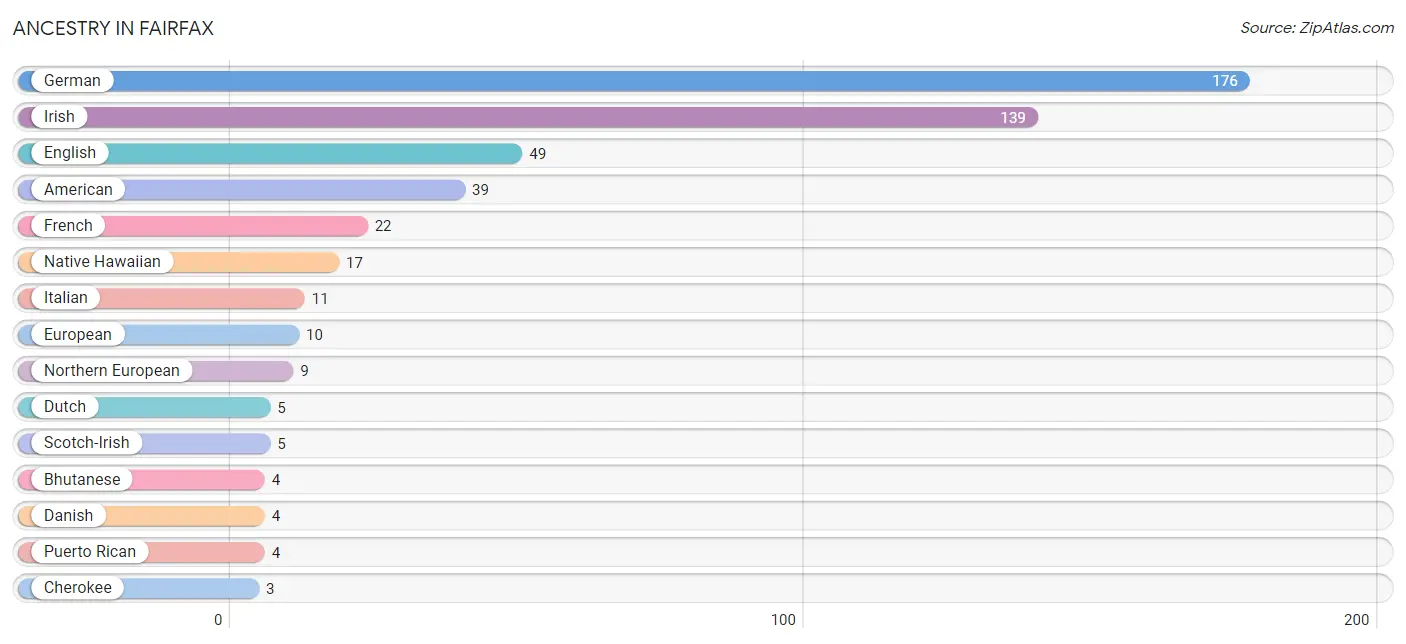
| Ancestry | # Population | % Population |
| American | 39 | 6.0% |
| Bhutanese | 4 | 0.6% |
| Blackfeet | 1 | 0.2% |
| Cherokee | 3 | 0.5% |
| Cheyenne | 3 | 0.5% |
| Danish | 4 | 0.6% |
| Dutch | 5 | 0.8% |
| English | 49 | 7.6% |
| European | 10 | 1.5% |
| French | 22 | 3.4% |
| German | 176 | 27.2% |
| Irish | 139 | 21.5% |
| Italian | 11 | 1.7% |
| Native Hawaiian | 17 | 2.6% |
| Northern European | 9 | 1.4% |
| Polish | 1 | 0.2% |
| Puerto Rican | 4 | 0.6% |
| Russian | 2 | 0.3% |
| Scotch-Irish | 5 | 0.8% |
| Scottish | 2 | 0.3% |
| Sioux | 3 | 0.5% |
| Welsh | 2 | 0.3% | View All 22 Rows |
Immigrants in Fairfax
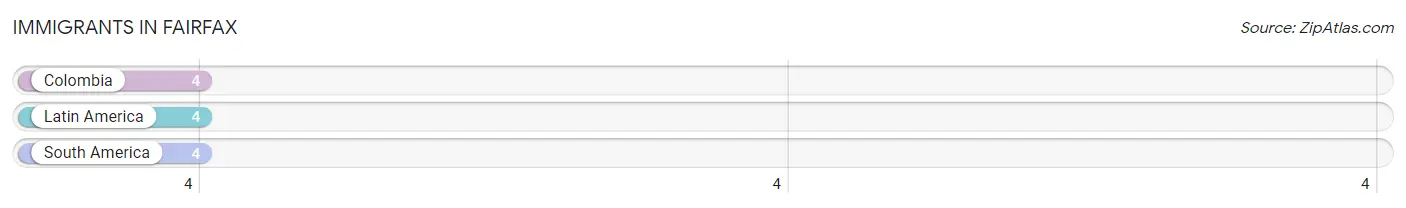
The most numerous immigrant groups reported in Fairfax came from Colombia (4 | 0.6%), Latin America (4 | 0.6%), and South America (4 | 0.6%), together accounting for 1.9% of all Fairfax residents.
| Immigration Origin | # Population | % Population |
| Colombia | 4 | 0.6% |
| Latin America | 4 | 0.6% |
| South America | 4 | 0.6% | View All 3 Rows |
Sex and Age in Fairfax
Sex and Age in Fairfax
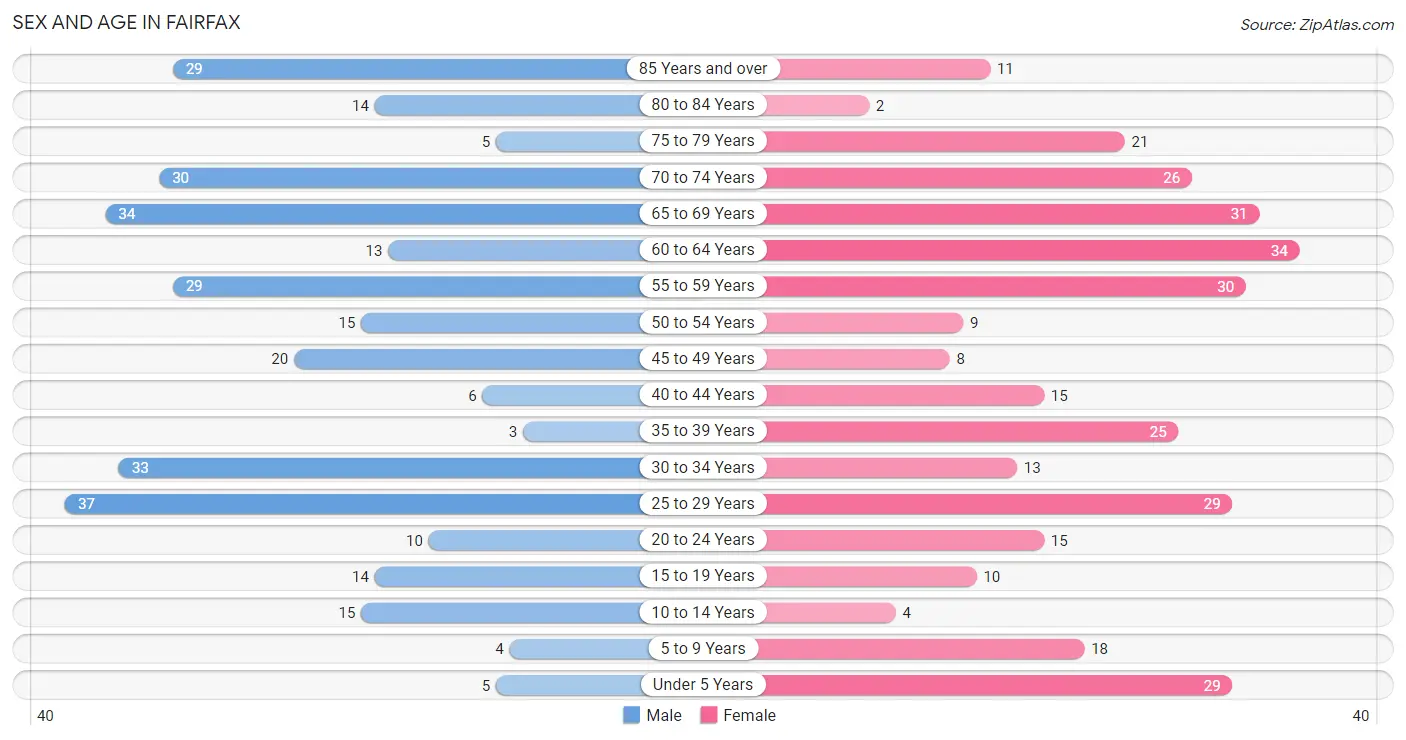
The most populous age groups in Fairfax are 25 to 29 Years (37 | 11.7%) for men and 60 to 64 Years (34 | 10.3%) for women.
| Age Bracket | Male | Female |
| Under 5 Years | 5 (1.6%) | 29 (8.8%) |
| 5 to 9 Years | 4 (1.3%) | 18 (5.4%) |
| 10 to 14 Years | 15 (4.8%) | 4 (1.2%) |
| 15 to 19 Years | 14 (4.4%) | 10 (3.0%) |
| 20 to 24 Years | 10 (3.2%) | 15 (4.5%) |
| 25 to 29 Years | 37 (11.7%) | 29 (8.8%) |
| 30 to 34 Years | 33 (10.4%) | 13 (3.9%) |
| 35 to 39 Years | 3 (0.9%) | 25 (7.6%) |
| 40 to 44 Years | 6 (1.9%) | 15 (4.5%) |
| 45 to 49 Years | 20 (6.3%) | 8 (2.4%) |
| 50 to 54 Years | 15 (4.8%) | 9 (2.7%) |
| 55 to 59 Years | 29 (9.2%) | 30 (9.1%) |
| 60 to 64 Years | 13 (4.1%) | 34 (10.3%) |
| 65 to 69 Years | 34 (10.8%) | 31 (9.4%) |
| 70 to 74 Years | 30 (9.5%) | 26 (7.9%) |
| 75 to 79 Years | 5 (1.6%) | 21 (6.4%) |
| 80 to 84 Years | 14 (4.4%) | 2 (0.6%) |
| 85 Years and over | 29 (9.2%) | 11 (3.3%) |
| Total | 316 (100.0%) | 330 (100.0%) |
Families and Households in Fairfax
Median Family Size in Fairfax
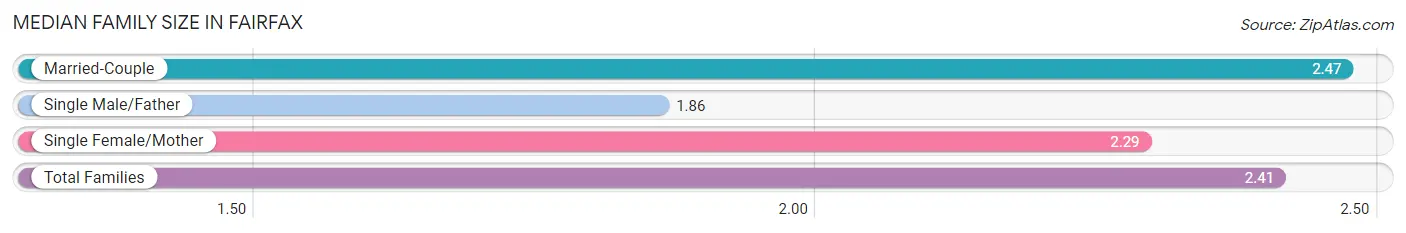
The median family size in Fairfax is 2.41 persons per family, with married-couple families (148 | 76.7%) accounting for the largest median family size of 2.47 persons per family. On the other hand, single male/father families (7 | 3.6%) represent the smallest median family size with 1.86 persons per family.
| Family Type | # Families | Family Size |
| Married-Couple | 148 (76.7%) | 2.47 |
| Single Male/Father | 7 (3.6%) | 1.86 |
| Single Female/Mother | 38 (19.7%) | 2.29 |
| Total Families | 193 (100.0%) | 2.41 |
Median Household Size in Fairfax
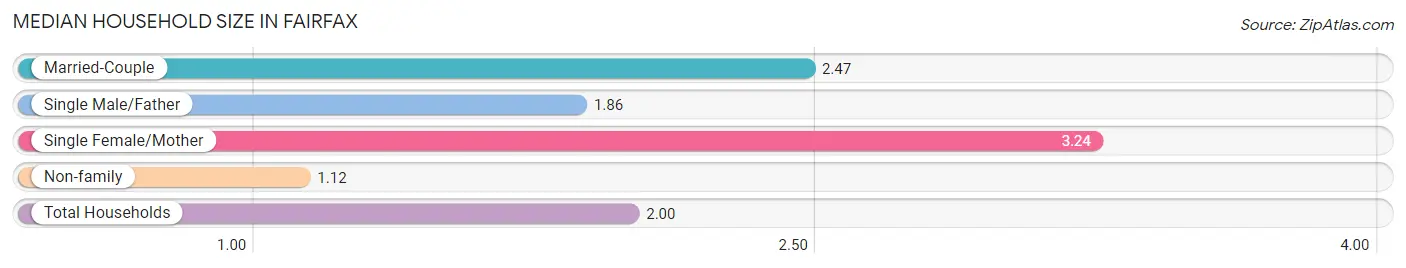
The median household size in Fairfax is 2.00 persons per household, with single female/mother households (38 | 11.8%) accounting for the largest median household size of 3.24 persons per household. non-family households (130 | 40.3%) represent the smallest median household size with 1.12 persons per household.
| Household Type | # Households | Household Size |
| Married-Couple | 148 (45.8%) | 2.47 |
| Single Male/Father | 7 (2.2%) | 1.86 |
| Single Female/Mother | 38 (11.8%) | 3.24 |
| Non-family | 130 (40.3%) | 1.12 |
| Total Households | 323 (100.0%) | 2.00 |
Household Size by Marriage Status in Fairfax
Out of a total of 323 households in Fairfax, 193 (59.8%) are family households, while 130 (40.3%) are nonfamily households. The most numerous type of family households are 2-person households, comprising 103, and the most common type of nonfamily households are 1-person households, comprising 119.
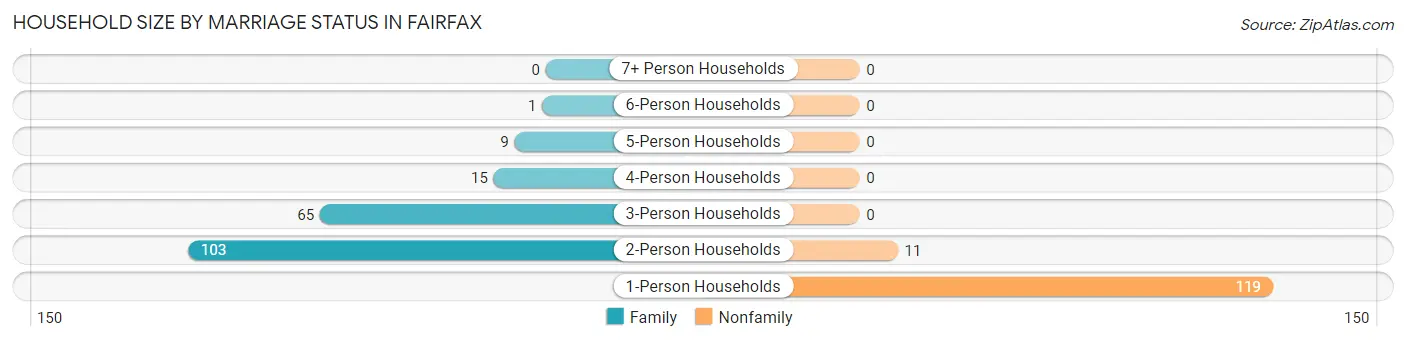
| Household Size | Family Households | Nonfamily Households |
| 1-Person Households | - | 119 (36.8%) |
| 2-Person Households | 103 (31.9%) | 11 (3.4%) |
| 3-Person Households | 65 (20.1%) | 0 (0.0%) |
| 4-Person Households | 15 (4.6%) | 0 (0.0%) |
| 5-Person Households | 9 (2.8%) | 0 (0.0%) |
| 6-Person Households | 1 (0.3%) | 0 (0.0%) |
| 7+ Person Households | 0 (0.0%) | 0 (0.0%) |
| Total | 193 (59.8%) | 130 (40.3%) |
Female Fertility in Fairfax
Fertility by Age in Fairfax
| Age Bracket | Women with Births | Births / 1,000 Women |
| 15 to 19 years | 0 (0.0%) | 0.0 |
| 20 to 34 years | 0 (0.0%) | 0.0 |
| 35 to 50 years | 0 (0.0%) | 0.0 |
| Total | 0 (0.0%) | 0.0 |
Fertility by Age by Marriage Status in Fairfax
| Age Bracket | Married | Unmarried |
| 15 to 19 years | 0 (0.0%) | 0 (0.0%) |
| 20 to 34 years | 0 (0.0%) | 0 (0.0%) |
| 35 to 50 years | 0 (0.0%) | 0 (0.0%) |
| Total | 0 (0.0%) | 0 (0.0%) |
Fertility by Education in Fairfax
| Educational Attainment | Women with Births | Births / 1,000 Women |
| Less than High School | 0 (0.0%) | 0.0 |
| High School Diploma | 0 (0.0%) | 0.0 |
| College or Associate's Degree | 0 (0.0%) | 0.0 |
| Bachelor's Degree | 0 (0.0%) | 0.0 |
| Graduate Degree | 0 (0.0%) | 0.0 |
| Total | 0 (0.0%) | 0.0 |
Fertility by Education by Marriage Status in Fairfax
| Educational Attainment | Married | Unmarried |
| Less than High School | 0 (0.0%) | 0 (0.0%) |
| High School Diploma | 0 (0.0%) | 0 (0.0%) |
| College or Associate's Degree | 0 (0.0%) | 0 (0.0%) |
| Bachelor's Degree | 0 (0.0%) | 0 (0.0%) |
| Graduate Degree | 0 (0.0%) | 0 (0.0%) |
| Total | 0 (0.0%) | 0 (0.0%) |
Employment Characteristics in Fairfax
Employment by Class of Employer in Fairfax
Among the 332 employed individuals in Fairfax, private company employees (167 | 50.3%), self-employed (not incorporated) (53 | 16.0%), and state government employees (36 | 10.8%) make up the most common classes of employment.
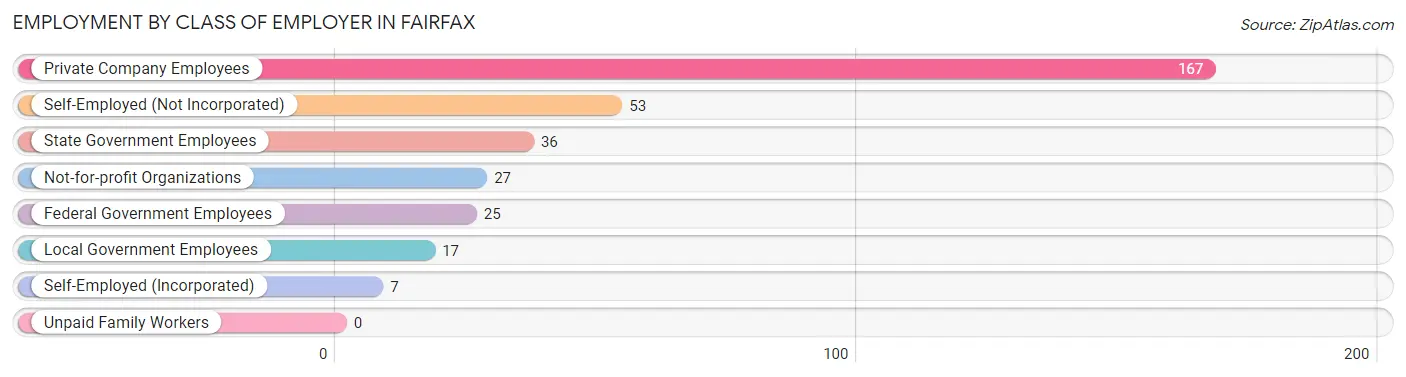
| Employer Class | # Employees | % Employees |
| Private Company Employees | 167 | 50.3% |
| Self-Employed (Incorporated) | 7 | 2.1% |
| Self-Employed (Not Incorporated) | 53 | 16.0% |
| Not-for-profit Organizations | 27 | 8.1% |
| Local Government Employees | 17 | 5.1% |
| State Government Employees | 36 | 10.8% |
| Federal Government Employees | 25 | 7.5% |
| Unpaid Family Workers | 0 | 0.0% |
| Total | 332 | 100.0% |
Employment Status by Age in Fairfax
According to the labor force statistics for Fairfax, out of the total population over 16 years of age (561), 61.3% or 344 individuals are in the labor force, with 3.5% or 12 of them unemployed. The age group with the highest labor force participation rate is 16 to 19 years, with 100.0% or 14 individuals in the labor force. Within the labor force, the 20 to 24 years age range has the highest percentage of unemployed individuals, with 48.0% or 12 of them being unemployed.
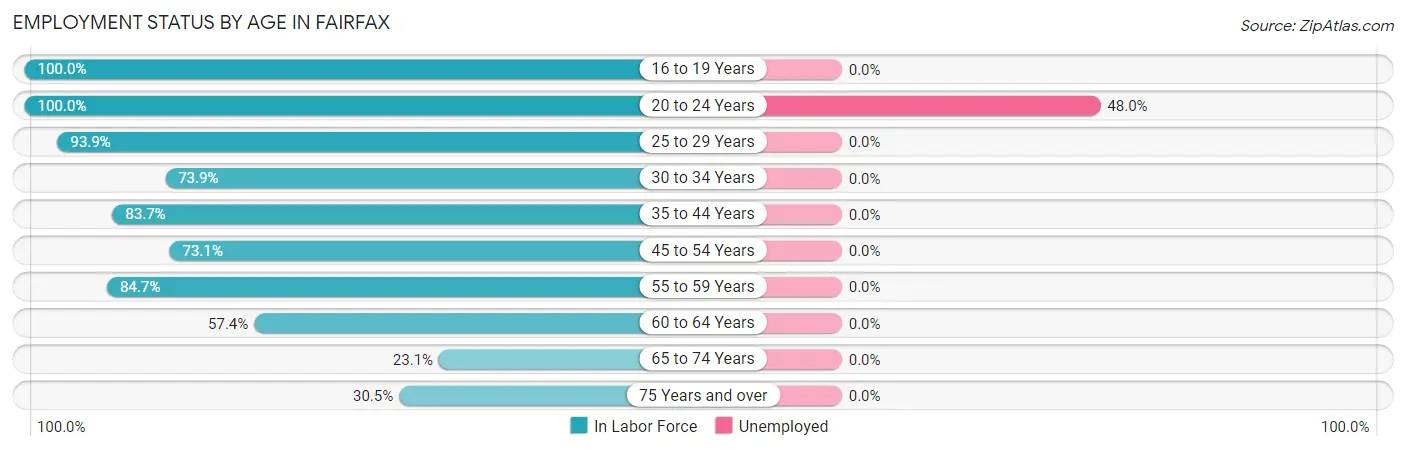
| Age Bracket | In Labor Force | Unemployed |
| 16 to 19 Years | 14 (100.0%) | 0 (0.0%) |
| 20 to 24 Years | 25 (100.0%) | 12 (48.0%) |
| 25 to 29 Years | 62 (93.9%) | 0 (0.0%) |
| 30 to 34 Years | 34 (73.9%) | 0 (0.0%) |
| 35 to 44 Years | 41 (83.7%) | 0 (0.0%) |
| 45 to 54 Years | 38 (73.1%) | 0 (0.0%) |
| 55 to 59 Years | 50 (84.7%) | 0 (0.0%) |
| 60 to 64 Years | 27 (57.4%) | 0 (0.0%) |
| 65 to 74 Years | 28 (23.1%) | 0 (0.0%) |
| 75 Years and over | 25 (30.5%) | 0 (0.0%) |
| Total | 344 (61.3%) | 12 (3.5%) |
Employment Status by Educational Attainment in Fairfax
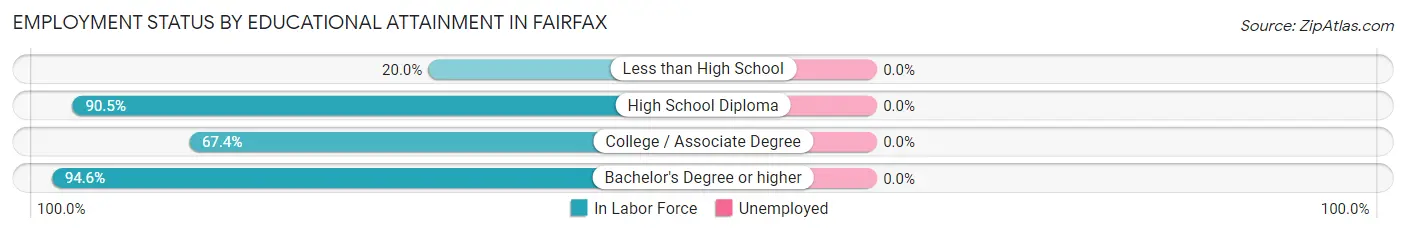
| Educational Attainment | In Labor Force | Unemployed |
| Less than High School | 5 (20.0%) | 0 (0.0%) |
| High School Diploma | 152 (90.5%) | 0 (0.0%) |
| College / Associate Degree | 60 (67.4%) | 0 (0.0%) |
| Bachelor's Degree or higher | 35 (94.6%) | 0 (0.0%) |
| Total | 252 (79.0%) | 0 (0.0%) |
Employment Occupations by Sex in Fairfax
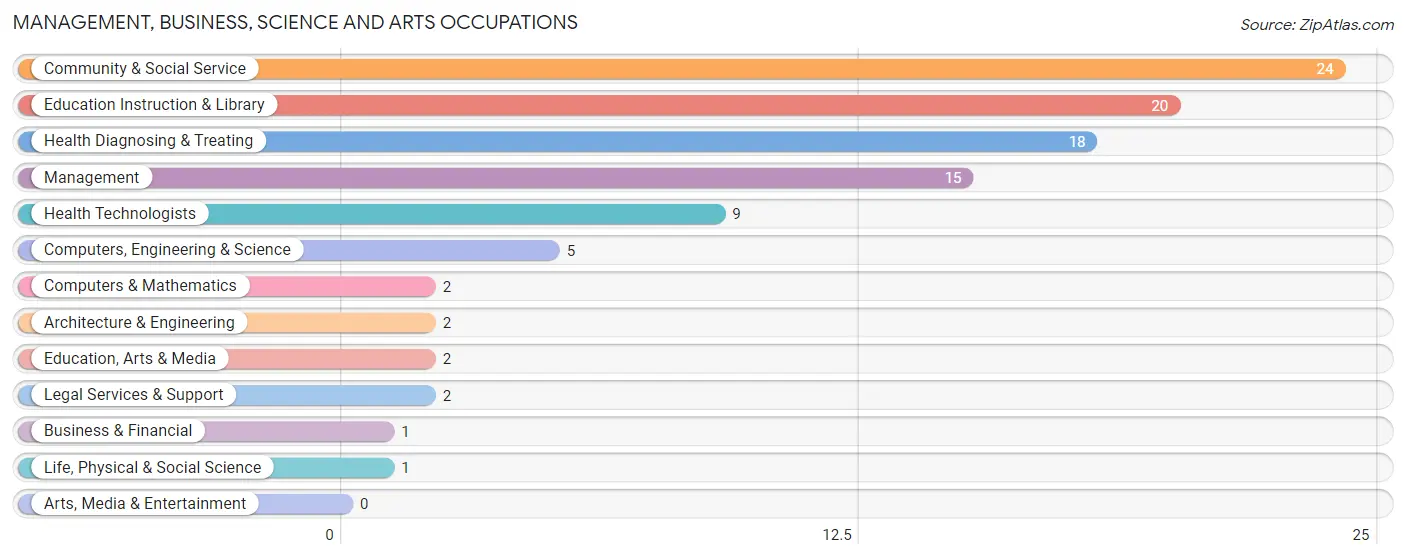
Management, Business, Science and Arts Occupations
The most common Management, Business, Science and Arts occupations in Fairfax are Community & Social Service (24 | 7.2%), Education Instruction & Library (20 | 6.0%), Health Diagnosing & Treating (18 | 5.4%), Management (15 | 4.5%), and Health Technologists (9 | 2.7%).
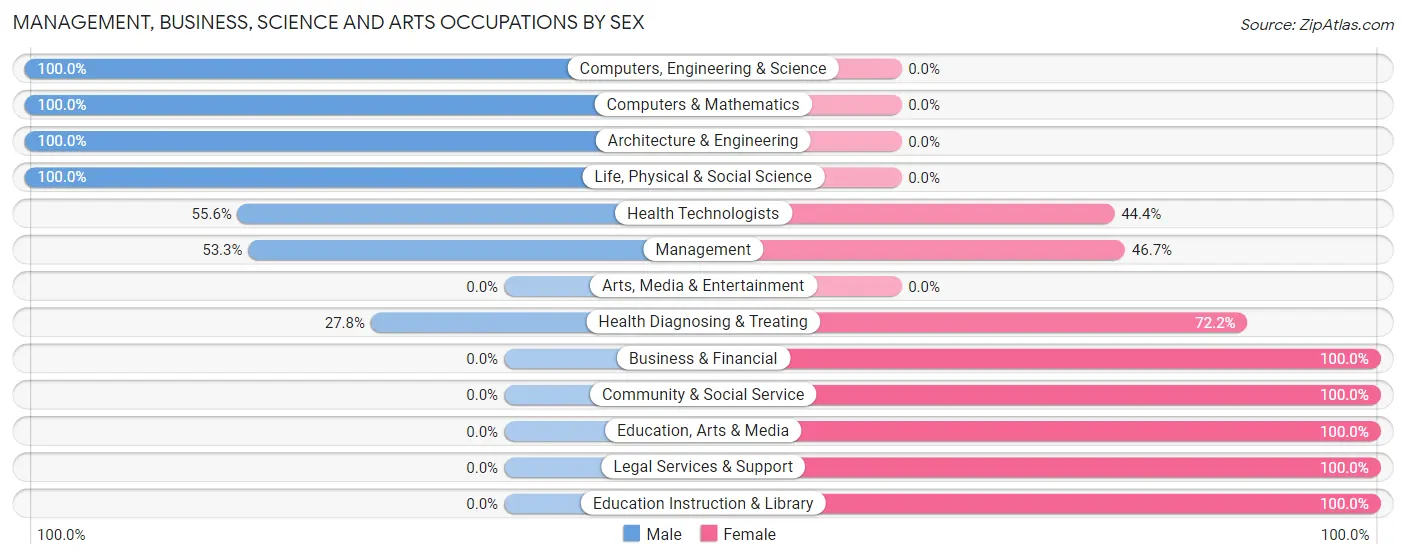
Management, Business, Science and Arts Occupations by Sex
Within the Management, Business, Science and Arts occupations in Fairfax, the most male-oriented occupations are Computers, Engineering & Science (100.0%), Computers & Mathematics (100.0%), and Architecture & Engineering (100.0%), while the most female-oriented occupations are Business & Financial (100.0%), Community & Social Service (100.0%), and Education, Arts & Media (100.0%).
| Occupation | Male | Female |
| Management | 8 (53.3%) | 7 (46.7%) |
| Business & Financial | 0 (0.0%) | 1 (100.0%) |
| Computers, Engineering & Science | 5 (100.0%) | 0 (0.0%) |
| Computers & Mathematics | 2 (100.0%) | 0 (0.0%) |
| Architecture & Engineering | 2 (100.0%) | 0 (0.0%) |
| Life, Physical & Social Science | 1 (100.0%) | 0 (0.0%) |
| Community & Social Service | 0 (0.0%) | 24 (100.0%) |
| Education, Arts & Media | 0 (0.0%) | 2 (100.0%) |
| Legal Services & Support | 0 (0.0%) | 2 (100.0%) |
| Education Instruction & Library | 0 (0.0%) | 20 (100.0%) |
| Arts, Media & Entertainment | 0 (0.0%) | 0 (0.0%) |
| Health Diagnosing & Treating | 5 (27.8%) | 13 (72.2%) |
| Health Technologists | 5 (55.6%) | 4 (44.4%) |
| Total (Category) | 18 (28.6%) | 45 (71.4%) |
| Total (Overall) | 184 (55.4%) | 148 (44.6%) |
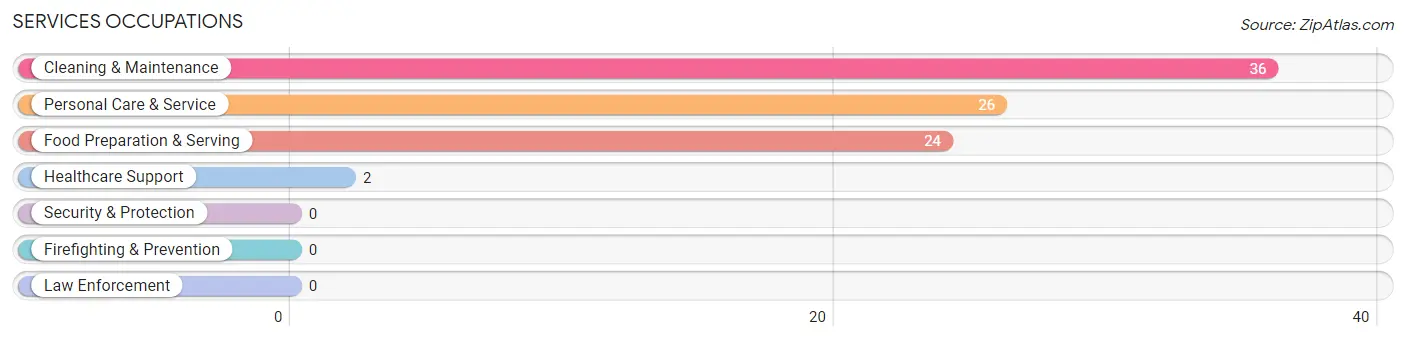
Services Occupations
The most common Services occupations in Fairfax are Cleaning & Maintenance (36 | 10.8%), Personal Care & Service (26 | 7.8%), Food Preparation & Serving (24 | 7.2%), and Healthcare Support (2 | 0.6%).
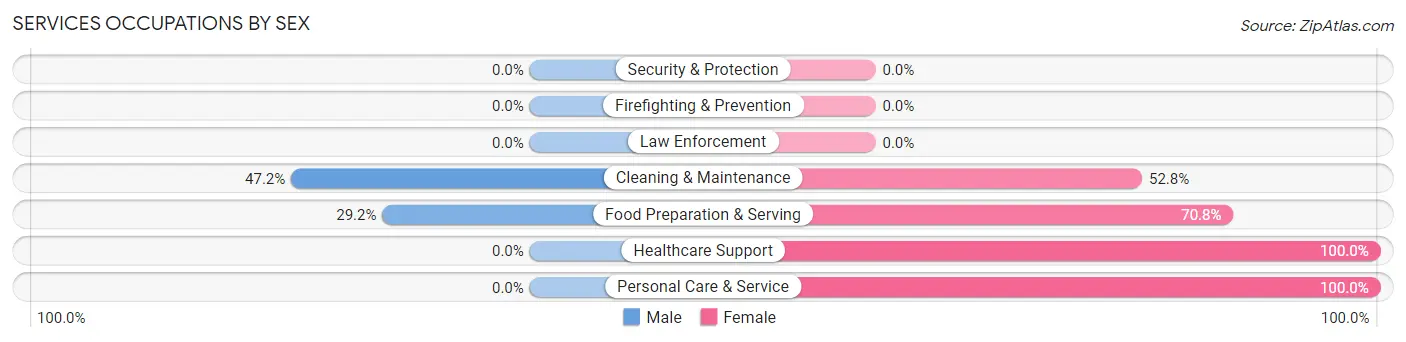
Services Occupations by Sex
Within the Services occupations in Fairfax, the most male-oriented occupations are Cleaning & Maintenance (47.2%), and Food Preparation & Serving (29.2%), while the most female-oriented occupations are Healthcare Support (100.0%), Personal Care & Service (100.0%), and Food Preparation & Serving (70.8%).
| Occupation | Male | Female |
| Healthcare Support | 0 (0.0%) | 2 (100.0%) |
| Security & Protection | 0 (0.0%) | 0 (0.0%) |
| Firefighting & Prevention | 0 (0.0%) | 0 (0.0%) |
| Law Enforcement | 0 (0.0%) | 0 (0.0%) |
| Food Preparation & Serving | 7 (29.2%) | 17 (70.8%) |
| Cleaning & Maintenance | 17 (47.2%) | 19 (52.8%) |
| Personal Care & Service | 0 (0.0%) | 26 (100.0%) |
| Total (Category) | 24 (27.3%) | 64 (72.7%) |
| Total (Overall) | 184 (55.4%) | 148 (44.6%) |
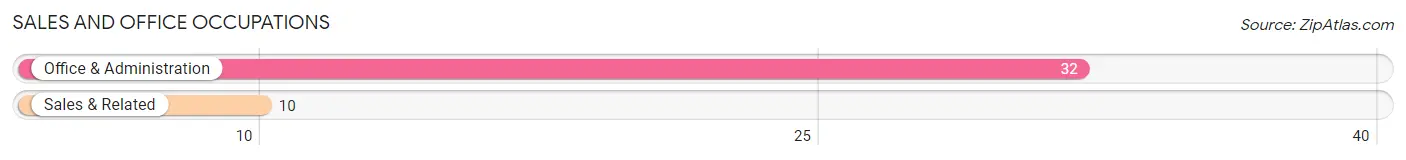
Sales and Office Occupations
The most common Sales and Office occupations in Fairfax are Office & Administration (32 | 9.6%), and Sales & Related (10 | 3.0%).
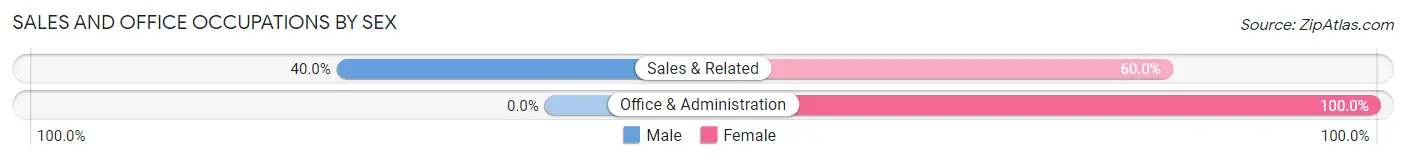
Sales and Office Occupations by Sex
| Occupation | Male | Female |
| Sales & Related | 4 (40.0%) | 6 (60.0%) |
| Office & Administration | 0 (0.0%) | 32 (100.0%) |
| Total (Category) | 4 (9.5%) | 38 (90.5%) |
| Total (Overall) | 184 (55.4%) | 148 (44.6%) |
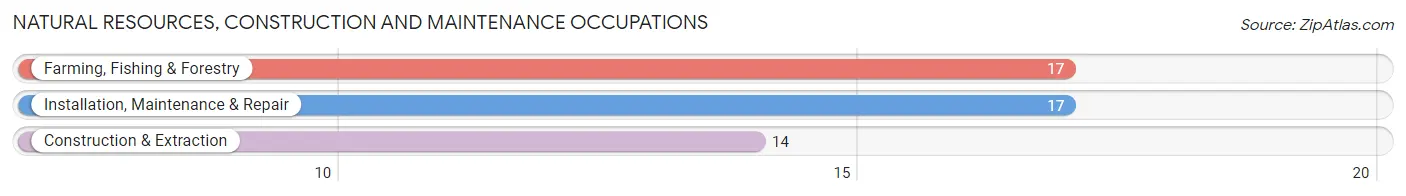
Natural Resources, Construction and Maintenance Occupations
The most common Natural Resources, Construction and Maintenance occupations in Fairfax are Farming, Fishing & Forestry (17 | 5.1%), Installation, Maintenance & Repair (17 | 5.1%), and Construction & Extraction (14 | 4.2%).
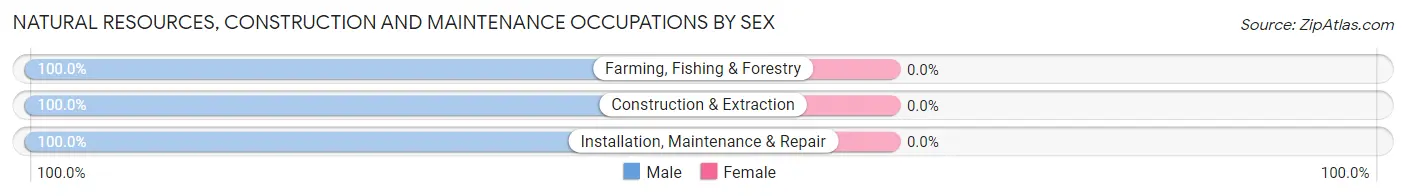
Natural Resources, Construction and Maintenance Occupations by Sex
| Occupation | Male | Female |
| Farming, Fishing & Forestry | 17 (100.0%) | 0 (0.0%) |
| Construction & Extraction | 14 (100.0%) | 0 (0.0%) |
| Installation, Maintenance & Repair | 17 (100.0%) | 0 (0.0%) |
| Total (Category) | 48 (100.0%) | 0 (0.0%) |
| Total (Overall) | 184 (55.4%) | 148 (44.6%) |
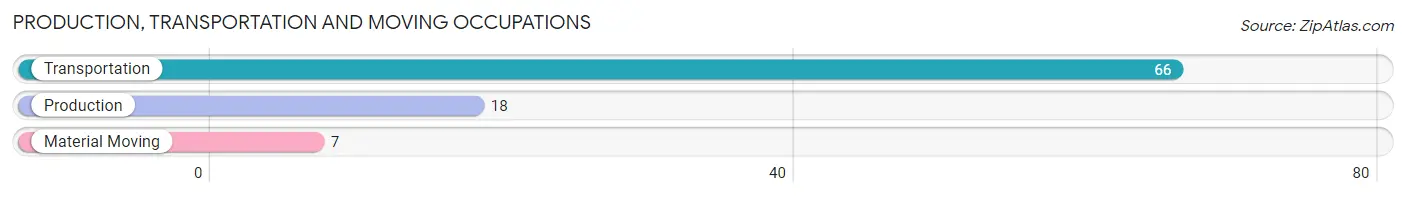
Production, Transportation and Moving Occupations
The most common Production, Transportation and Moving occupations in Fairfax are Transportation (66 | 19.9%), Production (18 | 5.4%), and Material Moving (7 | 2.1%).
Production, Transportation and Moving Occupations by Sex

| Occupation | Male | Female |
| Production | 18 (100.0%) | 0 (0.0%) |
| Transportation | 66 (100.0%) | 0 (0.0%) |
| Material Moving | 6 (85.7%) | 1 (14.3%) |
| Total (Category) | 90 (98.9%) | 1 (1.1%) |
| Total (Overall) | 184 (55.4%) | 148 (44.6%) |
Employment Industries by Sex in Fairfax
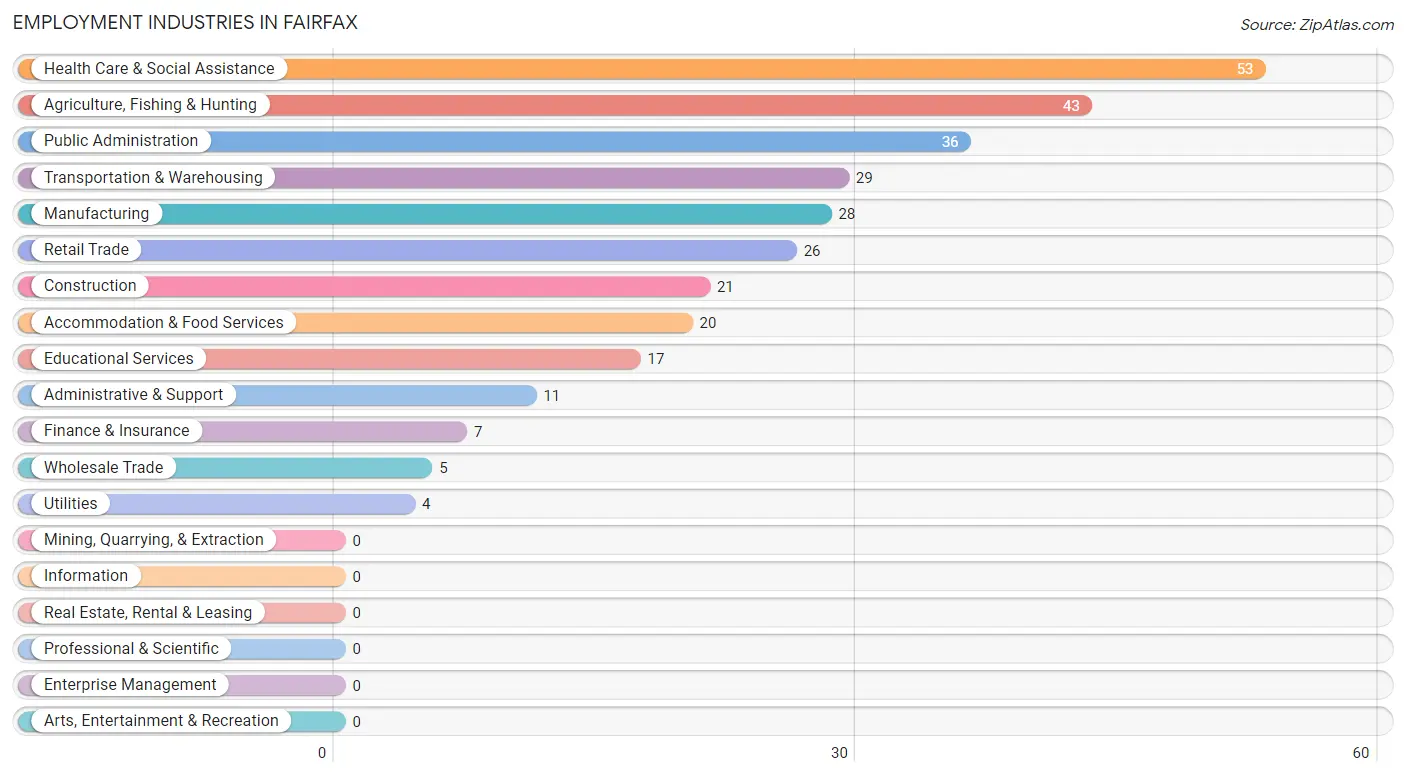
Employment Industries in Fairfax
The major employment industries in Fairfax include Health Care & Social Assistance (53 | 16.0%), Agriculture, Fishing & Hunting (43 | 13.0%), Public Administration (36 | 10.8%), Transportation & Warehousing (29 | 8.7%), and Manufacturing (28 | 8.4%).
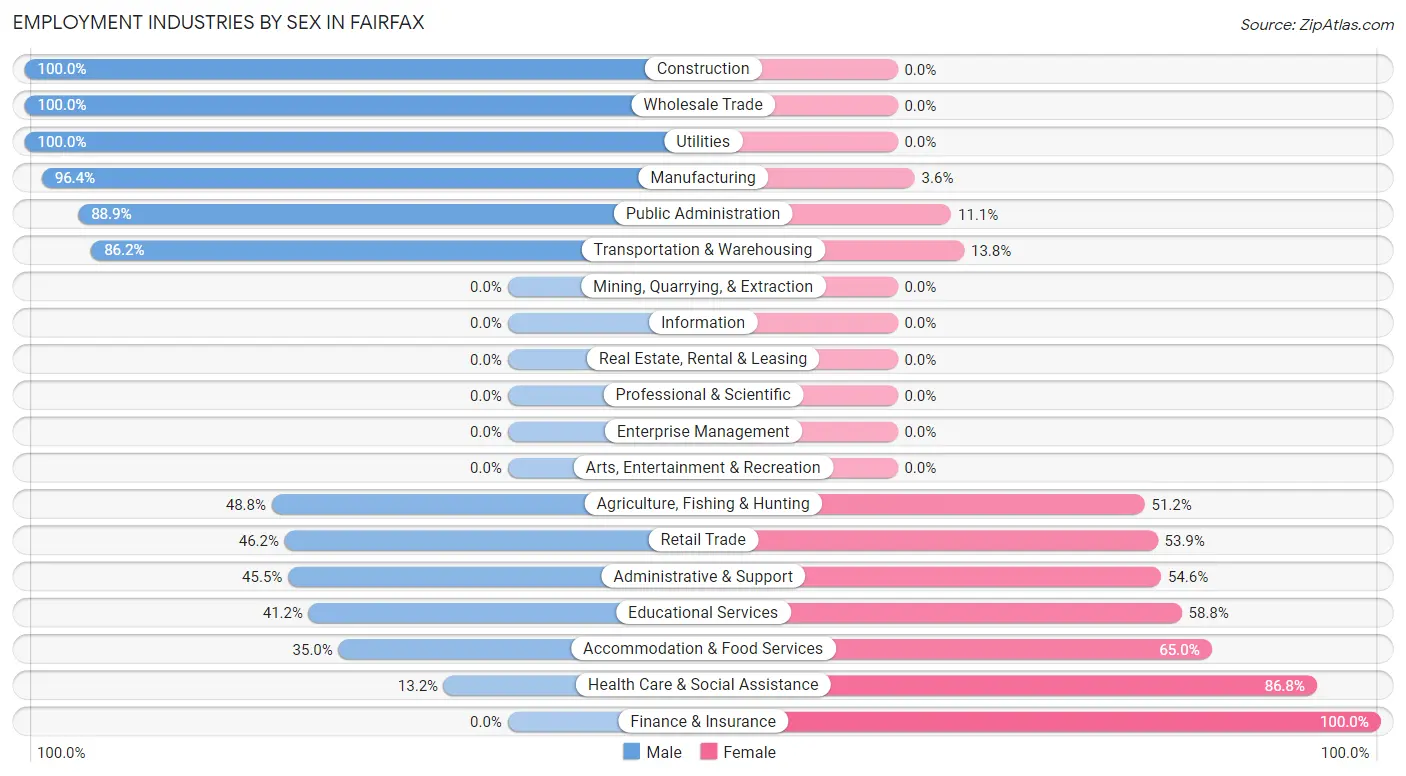
Employment Industries by Sex in Fairfax
The Fairfax industries that see more men than women are Construction (100.0%), Wholesale Trade (100.0%), and Utilities (100.0%), whereas the industries that tend to have a higher number of women are Finance & Insurance (100.0%), Health Care & Social Assistance (86.8%), and Accommodation & Food Services (65.0%).
| Industry | Male | Female |
| Agriculture, Fishing & Hunting | 21 (48.8%) | 22 (51.2%) |
| Mining, Quarrying, & Extraction | 0 (0.0%) | 0 (0.0%) |
| Construction | 21 (100.0%) | 0 (0.0%) |
| Manufacturing | 27 (96.4%) | 1 (3.6%) |
| Wholesale Trade | 5 (100.0%) | 0 (0.0%) |
| Retail Trade | 12 (46.2%) | 14 (53.8%) |
| Transportation & Warehousing | 25 (86.2%) | 4 (13.8%) |
| Utilities | 4 (100.0%) | 0 (0.0%) |
| Information | 0 (0.0%) | 0 (0.0%) |
| Finance & Insurance | 0 (0.0%) | 7 (100.0%) |
| Real Estate, Rental & Leasing | 0 (0.0%) | 0 (0.0%) |
| Professional & Scientific | 0 (0.0%) | 0 (0.0%) |
| Enterprise Management | 0 (0.0%) | 0 (0.0%) |
| Administrative & Support | 5 (45.5%) | 6 (54.5%) |
| Educational Services | 7 (41.2%) | 10 (58.8%) |
| Health Care & Social Assistance | 7 (13.2%) | 46 (86.8%) |
| Arts, Entertainment & Recreation | 0 (0.0%) | 0 (0.0%) |
| Accommodation & Food Services | 7 (35.0%) | 13 (65.0%) |
| Public Administration | 32 (88.9%) | 4 (11.1%) |
| Total | 184 (55.4%) | 148 (44.6%) |
Education in Fairfax
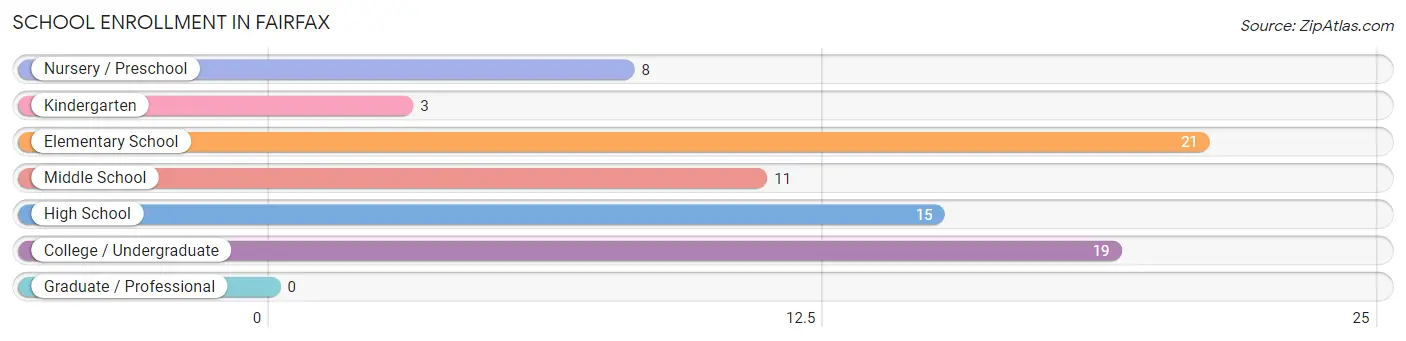
School Enrollment in Fairfax
The most common levels of schooling among the 77 students in Fairfax are elementary school (21 | 27.3%), college / undergraduate (19 | 24.7%), and high school (15 | 19.5%).
| School Level | # Students | % Students |
| Nursery / Preschool | 8 | 10.4% |
| Kindergarten | 3 | 3.9% |
| Elementary School | 21 | 27.3% |
| Middle School | 11 | 14.3% |
| High School | 15 | 19.5% |
| College / Undergraduate | 19 | 24.7% |
| Graduate / Professional | 0 | 0.0% |
| Total | 77 | 100.0% |
School Enrollment by Age by Funding Source in Fairfax
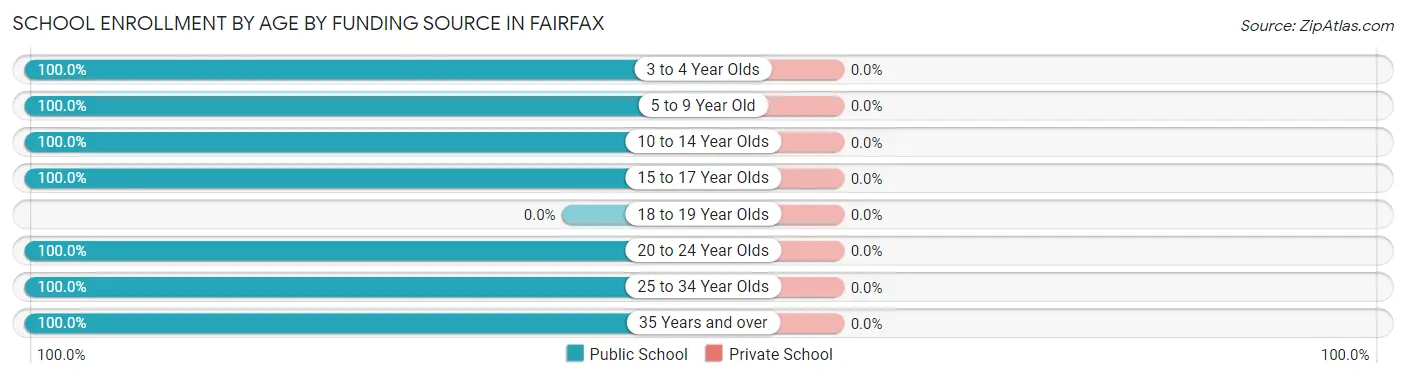
| Age Bracket | Public School | Private School |
| 3 to 4 Year Olds | 2 (100.0%) | 0 (0.0%) |
| 5 to 9 Year Old | 22 (100.0%) | 0 (0.0%) |
| 10 to 14 Year Olds | 19 (100.0%) | 0 (0.0%) |
| 15 to 17 Year Olds | 15 (100.0%) | 0 (0.0%) |
| 18 to 19 Year Olds | 0 (0.0%) | 0 (0.0%) |
| 20 to 24 Year Olds | 15 (100.0%) | 0 (0.0%) |
| 25 to 34 Year Olds | 2 (100.0%) | 0 (0.0%) |
| 35 Years and over | 2 (100.0%) | 0 (0.0%) |
| Total | 77 (100.0%) | 0 (0.0%) |
Educational Attainment by Field of Study in Fairfax
Education (33 | 51.6%), business (20 | 31.2%), psychology (3 | 4.7%), science & technology (3 | 4.7%), and physical & health sciences (2 | 3.1%) are the most common fields of study among 64 individuals in Fairfax who have obtained a bachelor's degree or higher.
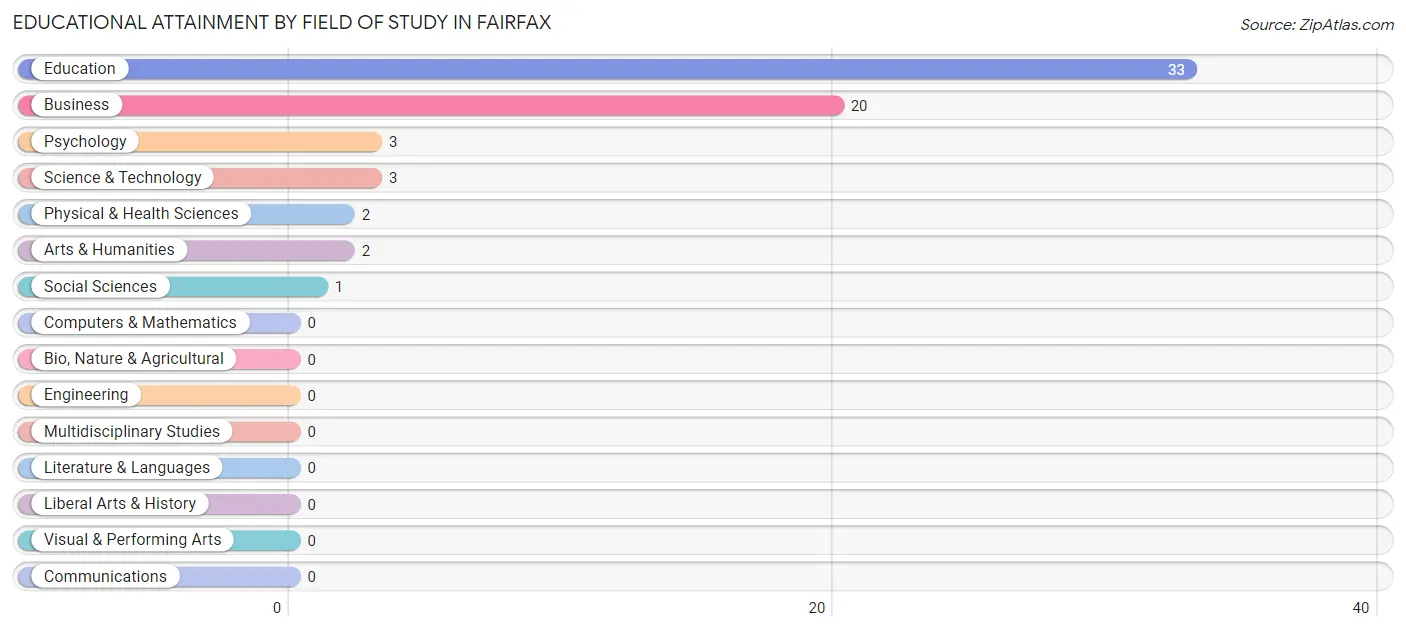
| Field of Study | # Graduates | % Graduates |
| Computers & Mathematics | 0 | 0.0% |
| Bio, Nature & Agricultural | 0 | 0.0% |
| Physical & Health Sciences | 2 | 3.1% |
| Psychology | 3 | 4.7% |
| Social Sciences | 1 | 1.6% |
| Engineering | 0 | 0.0% |
| Multidisciplinary Studies | 0 | 0.0% |
| Science & Technology | 3 | 4.7% |
| Business | 20 | 31.2% |
| Education | 33 | 51.6% |
| Literature & Languages | 0 | 0.0% |
| Liberal Arts & History | 0 | 0.0% |
| Visual & Performing Arts | 0 | 0.0% |
| Communications | 0 | 0.0% |
| Arts & Humanities | 2 | 3.1% |
| Total | 64 | 100.0% |
Transportation & Commute in Fairfax
Vehicle Availability by Sex in Fairfax
The most prevalent vehicle ownership categories in Fairfax are males with 2 vehicles (108, accounting for 58.7%) and females with 2 vehicles (80, making up 73.0%).
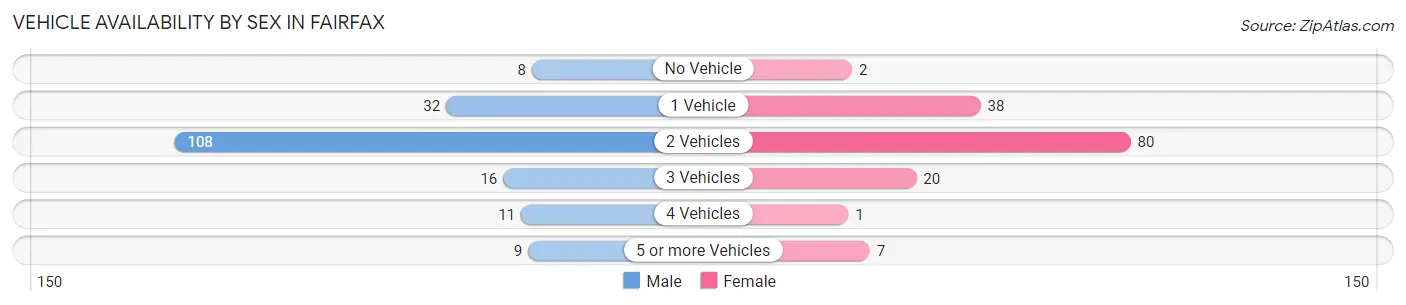
| Vehicles Available | Male | Female |
| No Vehicle | 8 (4.3%) | 2 (1.3%) |
| 1 Vehicle | 32 (17.4%) | 38 (25.7%) |
| 2 Vehicles | 108 (58.7%) | 80 (54.0%) |
| 3 Vehicles | 16 (8.7%) | 20 (13.5%) |
| 4 Vehicles | 11 (6.0%) | 1 (0.7%) |
| 5 or more Vehicles | 9 (4.9%) | 7 (4.7%) |
| Total | 184 (100.0%) | 148 (100.0%) |
Commute Time in Fairfax
The most frequently occuring commute durations in Fairfax are 5 to 9 minutes (54 commuters, 17.8%), 20 to 24 minutes (41 commuters, 13.5%), and 10 to 14 minutes (39 commuters, 12.9%).
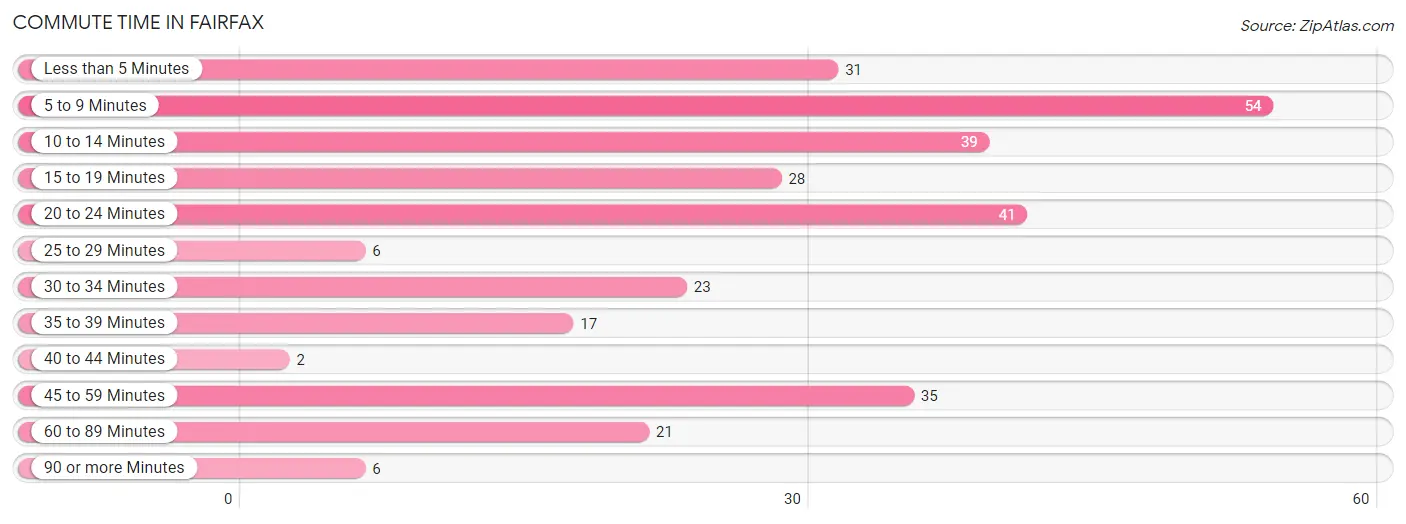
| Commute Time | # Commuters | % Commuters |
| Less than 5 Minutes | 31 | 10.2% |
| 5 to 9 Minutes | 54 | 17.8% |
| 10 to 14 Minutes | 39 | 12.9% |
| 15 to 19 Minutes | 28 | 9.2% |
| 20 to 24 Minutes | 41 | 13.5% |
| 25 to 29 Minutes | 6 | 2.0% |
| 30 to 34 Minutes | 23 | 7.6% |
| 35 to 39 Minutes | 17 | 5.6% |
| 40 to 44 Minutes | 2 | 0.7% |
| 45 to 59 Minutes | 35 | 11.6% |
| 60 to 89 Minutes | 21 | 6.9% |
| 90 or more Minutes | 6 | 2.0% |
Commute Time by Sex in Fairfax
The most common commute times in Fairfax are 45 to 59 minutes (35 commuters, 20.5%) for males and 10 to 14 minutes (33 commuters, 25.0%) for females.
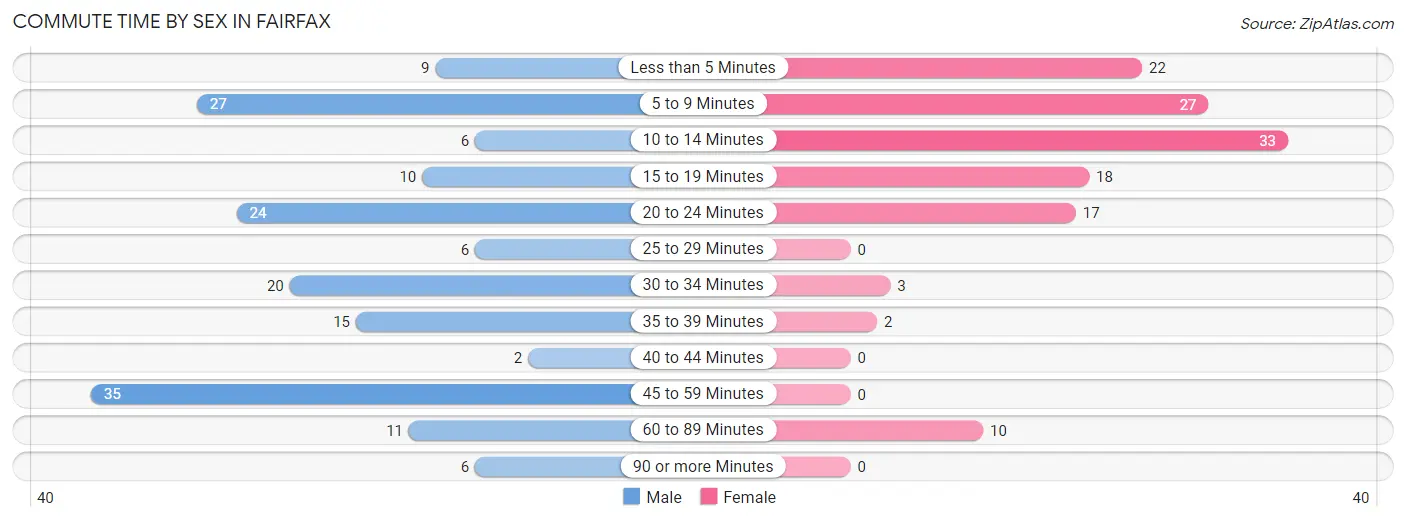
| Commute Time | Male | Female |
| Less than 5 Minutes | 9 (5.3%) | 22 (16.7%) |
| 5 to 9 Minutes | 27 (15.8%) | 27 (20.4%) |
| 10 to 14 Minutes | 6 (3.5%) | 33 (25.0%) |
| 15 to 19 Minutes | 10 (5.9%) | 18 (13.6%) |
| 20 to 24 Minutes | 24 (14.0%) | 17 (12.9%) |
| 25 to 29 Minutes | 6 (3.5%) | 0 (0.0%) |
| 30 to 34 Minutes | 20 (11.7%) | 3 (2.3%) |
| 35 to 39 Minutes | 15 (8.8%) | 2 (1.5%) |
| 40 to 44 Minutes | 2 (1.2%) | 0 (0.0%) |
| 45 to 59 Minutes | 35 (20.5%) | 0 (0.0%) |
| 60 to 89 Minutes | 11 (6.4%) | 10 (7.6%) |
| 90 or more Minutes | 6 (3.5%) | 0 (0.0%) |
Time of Departure to Work by Sex in Fairfax
The most frequent times of departure to work in Fairfax are 5:00 AM to 5:29 AM (34, 19.9%) for males and 7:30 AM to 7:59 AM (35, 26.5%) for females.
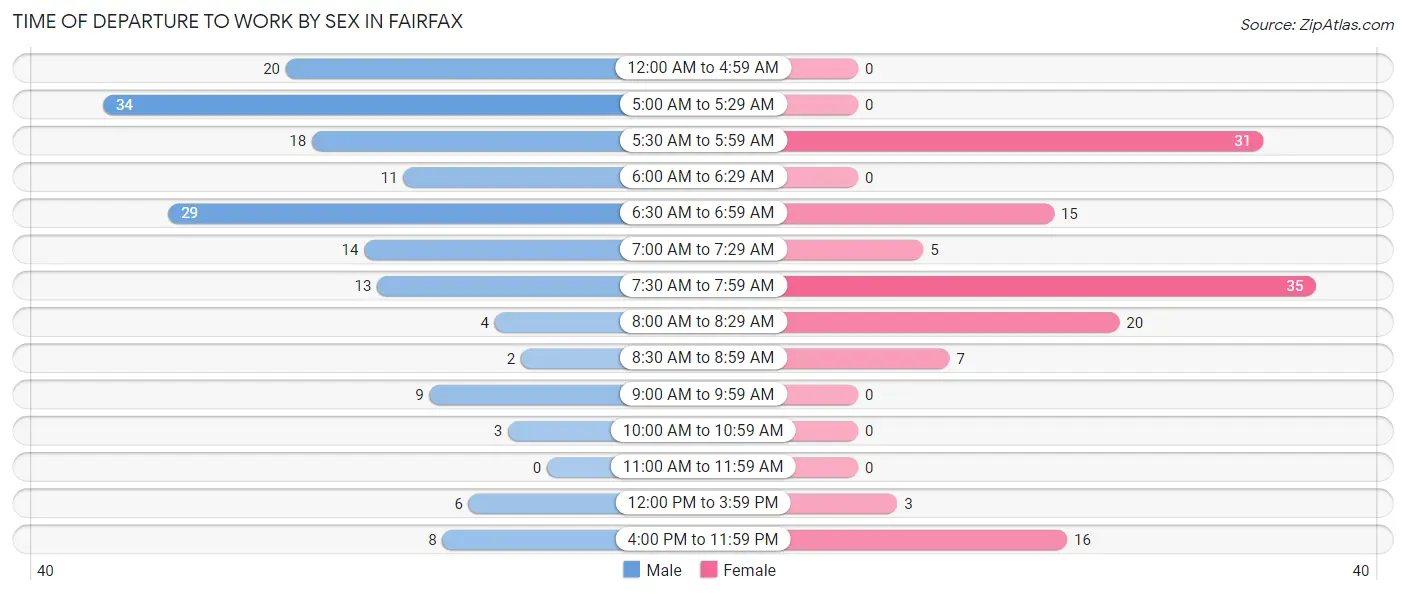
| Time of Departure | Male | Female |
| 12:00 AM to 4:59 AM | 20 (11.7%) | 0 (0.0%) |
| 5:00 AM to 5:29 AM | 34 (19.9%) | 0 (0.0%) |
| 5:30 AM to 5:59 AM | 18 (10.5%) | 31 (23.5%) |
| 6:00 AM to 6:29 AM | 11 (6.4%) | 0 (0.0%) |
| 6:30 AM to 6:59 AM | 29 (17.0%) | 15 (11.4%) |
| 7:00 AM to 7:29 AM | 14 (8.2%) | 5 (3.8%) |
| 7:30 AM to 7:59 AM | 13 (7.6%) | 35 (26.5%) |
| 8:00 AM to 8:29 AM | 4 (2.3%) | 20 (15.1%) |
| 8:30 AM to 8:59 AM | 2 (1.2%) | 7 (5.3%) |
| 9:00 AM to 9:59 AM | 9 (5.3%) | 0 (0.0%) |
| 10:00 AM to 10:59 AM | 3 (1.8%) | 0 (0.0%) |
| 11:00 AM to 11:59 AM | 0 (0.0%) | 0 (0.0%) |
| 12:00 PM to 3:59 PM | 6 (3.5%) | 3 (2.3%) |
| 4:00 PM to 11:59 PM | 8 (4.7%) | 16 (12.1%) |
| Total | 171 (100.0%) | 132 (100.0%) |
Housing Occupancy in Fairfax
Occupancy by Ownership in Fairfax
Of the total 323 dwellings in Fairfax, owner-occupied units account for 221 (68.4%), while renter-occupied units make up 102 (31.6%).
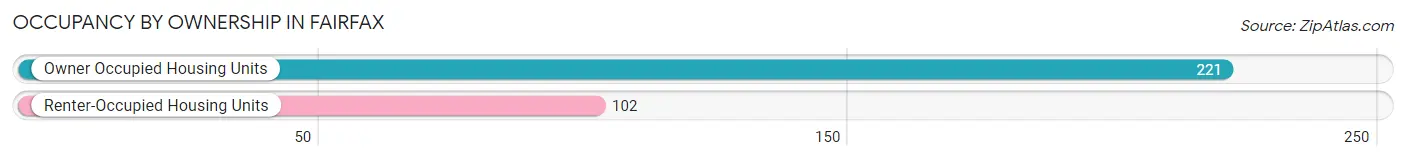
| Occupancy | # Housing Units | % Housing Units |
| Owner Occupied Housing Units | 221 | 68.4% |
| Renter-Occupied Housing Units | 102 | 31.6% |
| Total Occupied Housing Units | 323 | 100.0% |
Occupancy by Household Size in Fairfax
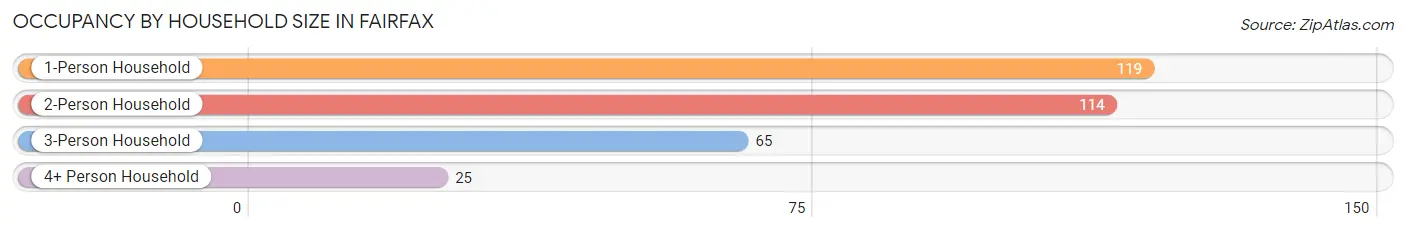
| Household Size | # Housing Units | % Housing Units |
| 1-Person Household | 119 | 36.8% |
| 2-Person Household | 114 | 35.3% |
| 3-Person Household | 65 | 20.1% |
| 4+ Person Household | 25 | 7.7% |
| Total Housing Units | 323 | 100.0% |
Occupancy by Ownership by Household Size in Fairfax
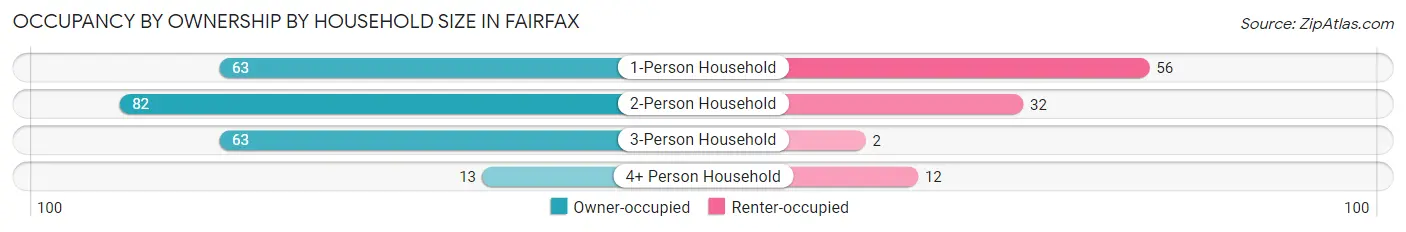
| Household Size | Owner-occupied | Renter-occupied |
| 1-Person Household | 63 (52.9%) | 56 (47.1%) |
| 2-Person Household | 82 (71.9%) | 32 (28.1%) |
| 3-Person Household | 63 (96.9%) | 2 (3.1%) |
| 4+ Person Household | 13 (52.0%) | 12 (48.0%) |
| Total Housing Units | 221 (68.4%) | 102 (31.6%) |
Occupancy by Educational Attainment in Fairfax
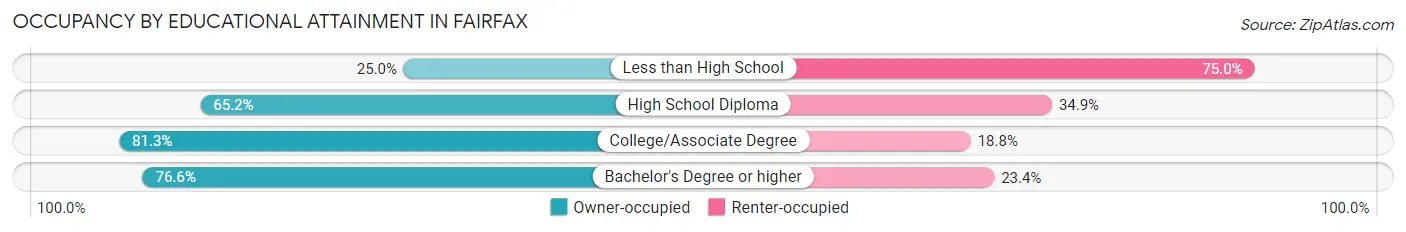
| Household Size | Owner-occupied | Renter-occupied |
| Less than High School | 8 (25.0%) | 24 (75.0%) |
| High School Diploma | 86 (65.1%) | 46 (34.8%) |
| College/Associate Degree | 91 (81.2%) | 21 (18.8%) |
| Bachelor's Degree or higher | 36 (76.6%) | 11 (23.4%) |
Occupancy by Age of Householder in Fairfax
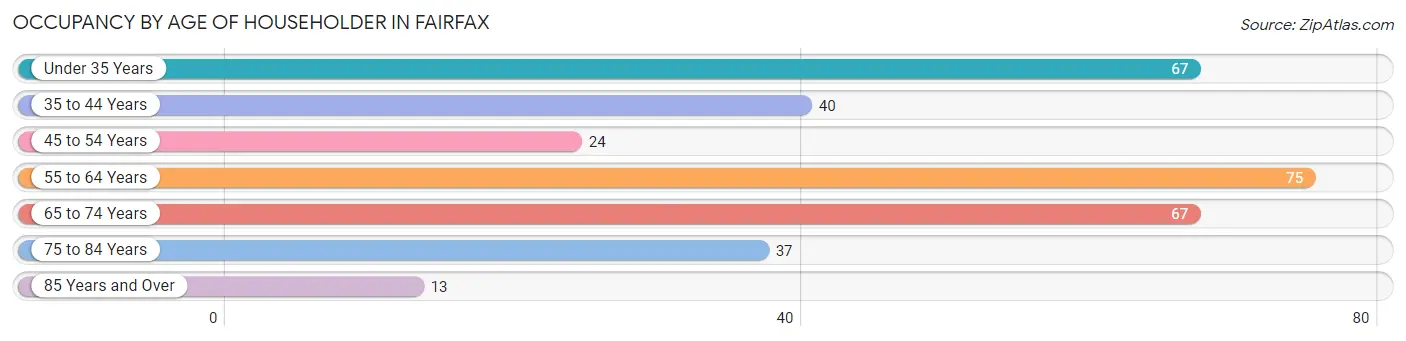
| Age Bracket | # Households | % Households |
| Under 35 Years | 67 | 20.7% |
| 35 to 44 Years | 40 | 12.4% |
| 45 to 54 Years | 24 | 7.4% |
| 55 to 64 Years | 75 | 23.2% |
| 65 to 74 Years | 67 | 20.7% |
| 75 to 84 Years | 37 | 11.5% |
| 85 Years and Over | 13 | 4.0% |
| Total | 323 | 100.0% |
Housing Finances in Fairfax
Median Income by Occupancy in Fairfax
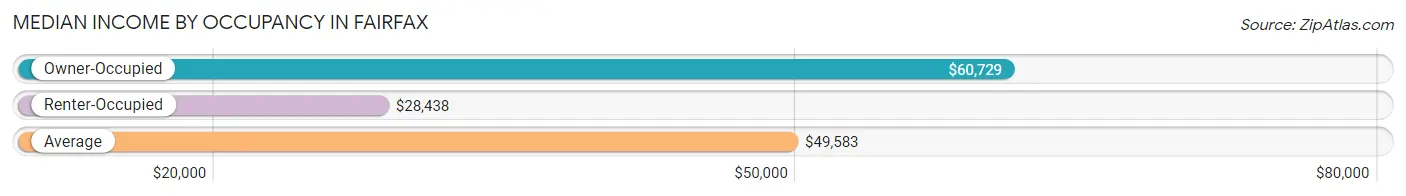
| Occupancy Type | # Households | Median Income |
| Owner-Occupied | 221 (68.4%) | $60,729 |
| Renter-Occupied | 102 (31.6%) | $28,438 |
| Average | 323 (100.0%) | $49,583 |
Occupancy by Householder Income Bracket in Fairfax
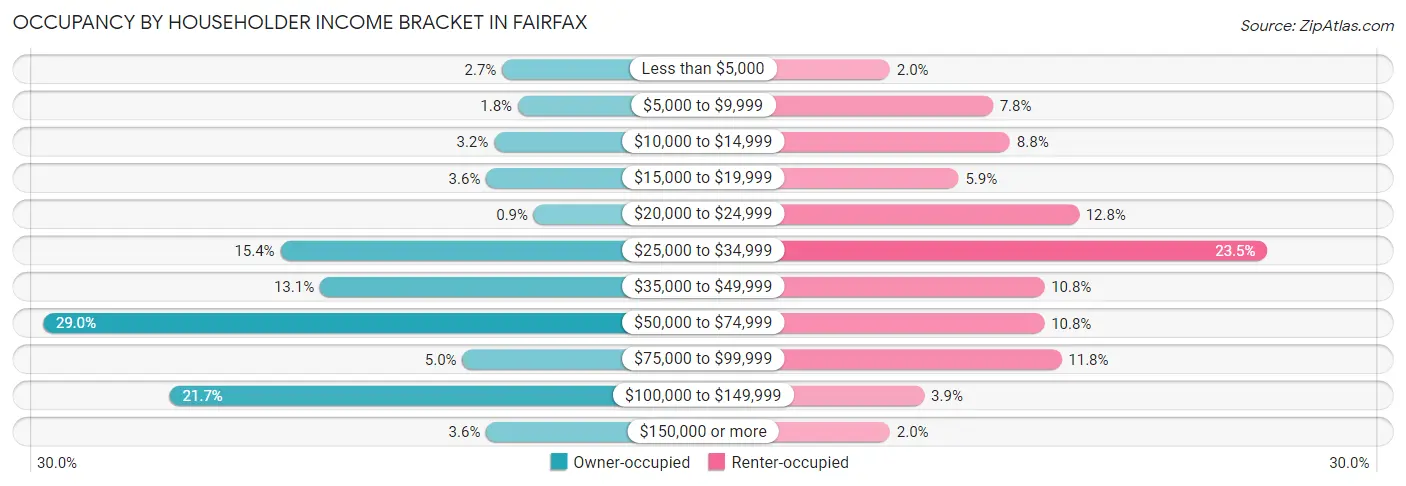
| Income Bracket | Owner-occupied | Renter-occupied |
| Less than $5,000 | 6 (2.7%) | 2 (2.0%) |
| $5,000 to $9,999 | 4 (1.8%) | 8 (7.8%) |
| $10,000 to $14,999 | 7 (3.2%) | 9 (8.8%) |
| $15,000 to $19,999 | 8 (3.6%) | 6 (5.9%) |
| $20,000 to $24,999 | 2 (0.9%) | 13 (12.8%) |
| $25,000 to $34,999 | 34 (15.4%) | 24 (23.5%) |
| $35,000 to $49,999 | 29 (13.1%) | 11 (10.8%) |
| $50,000 to $74,999 | 64 (29.0%) | 11 (10.8%) |
| $75,000 to $99,999 | 11 (5.0%) | 12 (11.8%) |
| $100,000 to $149,999 | 48 (21.7%) | 4 (3.9%) |
| $150,000 or more | 8 (3.6%) | 2 (2.0%) |
| Total | 221 (100.0%) | 102 (100.0%) |
Monthly Housing Cost Tiers in Fairfax
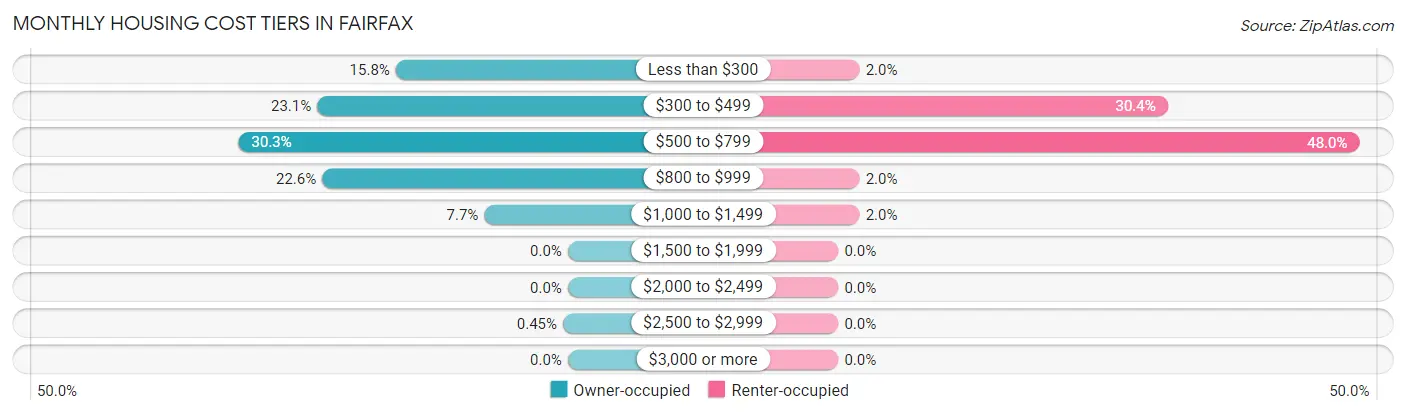
| Monthly Cost | Owner-occupied | Renter-occupied |
| Less than $300 | 35 (15.8%) | 2 (2.0%) |
| $300 to $499 | 51 (23.1%) | 31 (30.4%) |
| $500 to $799 | 67 (30.3%) | 49 (48.0%) |
| $800 to $999 | 50 (22.6%) | 2 (2.0%) |
| $1,000 to $1,499 | 17 (7.7%) | 2 (2.0%) |
| $1,500 to $1,999 | 0 (0.0%) | 0 (0.0%) |
| $2,000 to $2,499 | 0 (0.0%) | 0 (0.0%) |
| $2,500 to $2,999 | 1 (0.4%) | 0 (0.0%) |
| $3,000 or more | 0 (0.0%) | 0 (0.0%) |
| Total | 221 (100.0%) | 102 (100.0%) |
Physical Housing Characteristics in Fairfax
Housing Structures in Fairfax
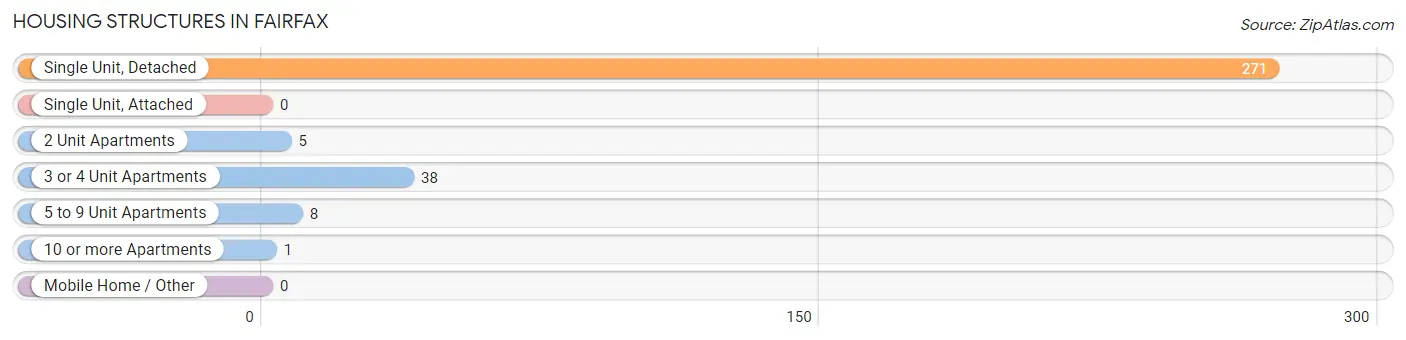
| Structure Type | # Housing Units | % Housing Units |
| Single Unit, Detached | 271 | 83.9% |
| Single Unit, Attached | 0 | 0.0% |
| 2 Unit Apartments | 5 | 1.5% |
| 3 or 4 Unit Apartments | 38 | 11.8% |
| 5 to 9 Unit Apartments | 8 | 2.5% |
| 10 or more Apartments | 1 | 0.3% |
| Mobile Home / Other | 0 | 0.0% |
| Total | 323 | 100.0% |
Housing Structures by Occupancy in Fairfax
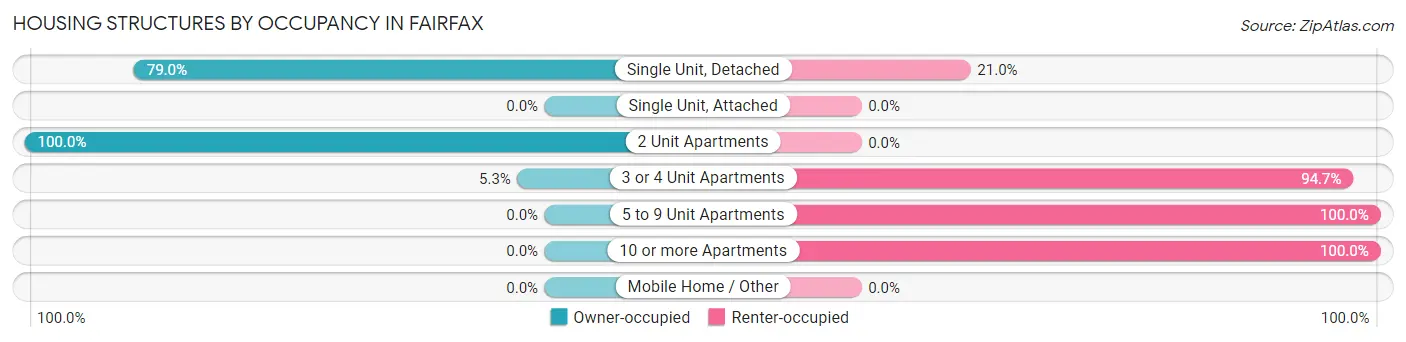
| Structure Type | Owner-occupied | Renter-occupied |
| Single Unit, Detached | 214 (79.0%) | 57 (21.0%) |
| Single Unit, Attached | 0 (0.0%) | 0 (0.0%) |
| 2 Unit Apartments | 5 (100.0%) | 0 (0.0%) |
| 3 or 4 Unit Apartments | 2 (5.3%) | 36 (94.7%) |
| 5 to 9 Unit Apartments | 0 (0.0%) | 8 (100.0%) |
| 10 or more Apartments | 0 (0.0%) | 1 (100.0%) |
| Mobile Home / Other | 0 (0.0%) | 0 (0.0%) |
| Total | 221 (68.4%) | 102 (31.6%) |
Housing Structures by Number of Rooms in Fairfax
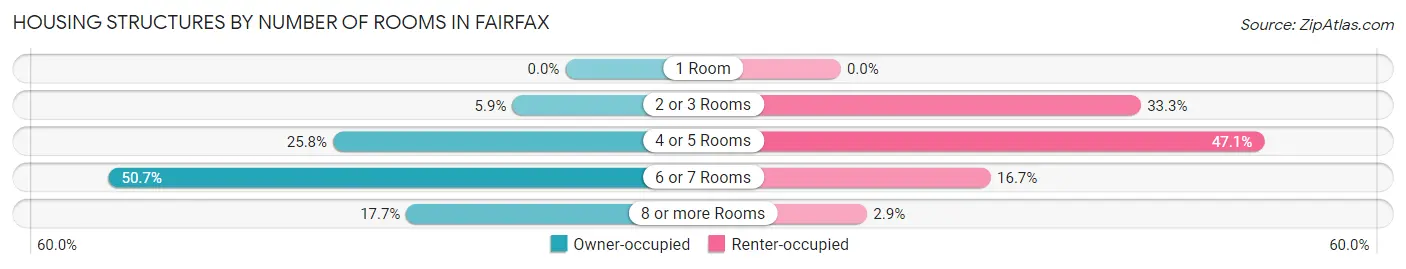
| Number of Rooms | Owner-occupied | Renter-occupied |
| 1 Room | 0 (0.0%) | 0 (0.0%) |
| 2 or 3 Rooms | 13 (5.9%) | 34 (33.3%) |
| 4 or 5 Rooms | 57 (25.8%) | 48 (47.1%) |
| 6 or 7 Rooms | 112 (50.7%) | 17 (16.7%) |
| 8 or more Rooms | 39 (17.6%) | 3 (2.9%) |
| Total | 221 (100.0%) | 102 (100.0%) |
Housing Structure by Heating Type in Fairfax
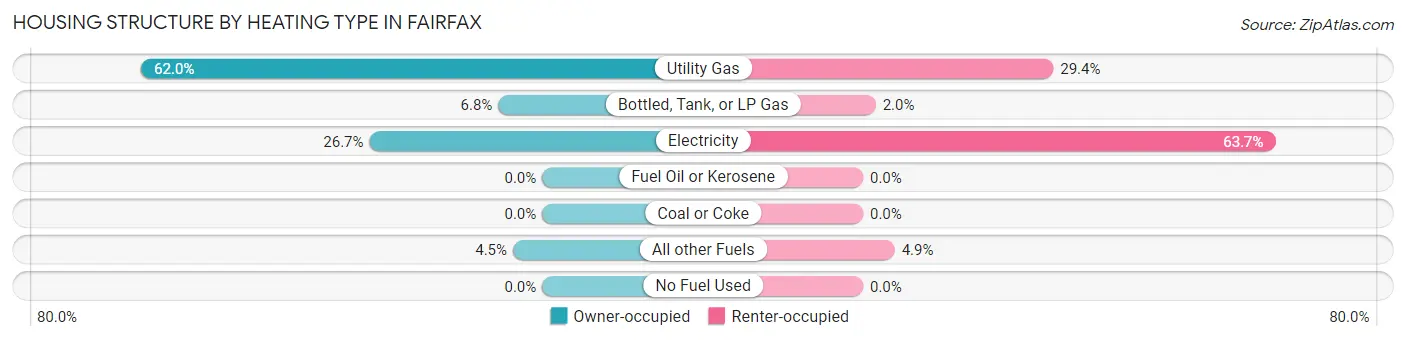
| Heating Type | Owner-occupied | Renter-occupied |
| Utility Gas | 137 (62.0%) | 30 (29.4%) |
| Bottled, Tank, or LP Gas | 15 (6.8%) | 2 (2.0%) |
| Electricity | 59 (26.7%) | 65 (63.7%) |
| Fuel Oil or Kerosene | 0 (0.0%) | 0 (0.0%) |
| Coal or Coke | 0 (0.0%) | 0 (0.0%) |
| All other Fuels | 10 (4.5%) | 5 (4.9%) |
| No Fuel Used | 0 (0.0%) | 0 (0.0%) |
| Total | 221 (100.0%) | 102 (100.0%) |
Household Vehicle Usage in Fairfax
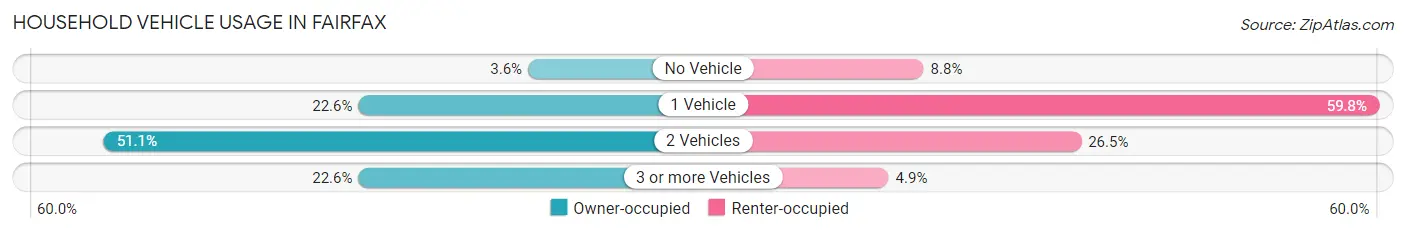
| Vehicles per Household | Owner-occupied | Renter-occupied |
| No Vehicle | 8 (3.6%) | 9 (8.8%) |
| 1 Vehicle | 50 (22.6%) | 61 (59.8%) |
| 2 Vehicles | 113 (51.1%) | 27 (26.5%) |
| 3 or more Vehicles | 50 (22.6%) | 5 (4.9%) |
| Total | 221 (100.0%) | 102 (100.0%) |
Real Estate & Mortgages in Fairfax
Real Estate and Mortgage Overview in Fairfax
| Characteristic | Without Mortgage | With Mortgage |
| Housing Units | 117 | 104 |
| Median Property Value | $67,000 | $90,000 |
| Median Household Income | $47,813 | $3 |
| Monthly Housing Costs | $416 | $0 |
| Real Estate Taxes | $678 | $12 |
Property Value by Mortgage Status in Fairfax
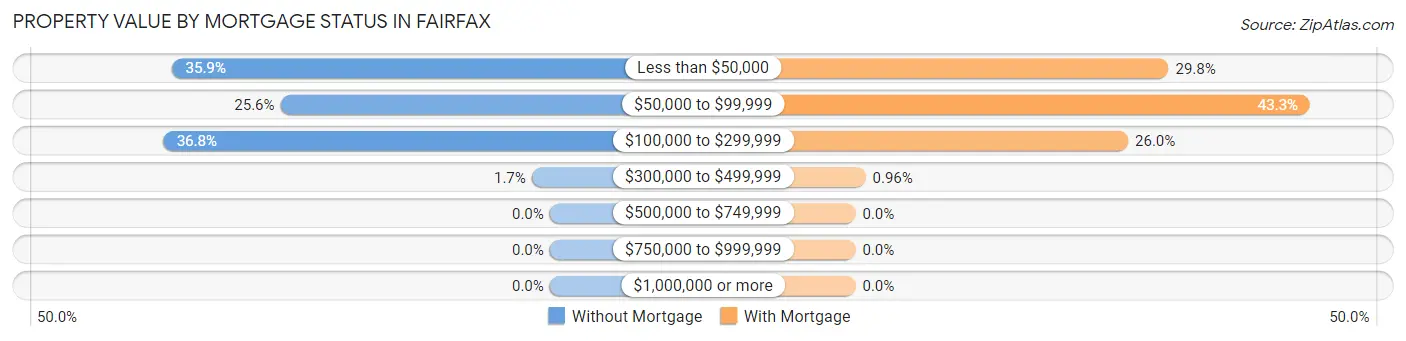
| Property Value | Without Mortgage | With Mortgage |
| Less than $50,000 | 42 (35.9%) | 31 (29.8%) |
| $50,000 to $99,999 | 30 (25.6%) | 45 (43.3%) |
| $100,000 to $299,999 | 43 (36.7%) | 27 (26.0%) |
| $300,000 to $499,999 | 2 (1.7%) | 1 (1.0%) |
| $500,000 to $749,999 | 0 (0.0%) | 0 (0.0%) |
| $750,000 to $999,999 | 0 (0.0%) | 0 (0.0%) |
| $1,000,000 or more | 0 (0.0%) | 0 (0.0%) |
| Total | 117 (100.0%) | 104 (100.0%) |
Household Income by Mortgage Status in Fairfax
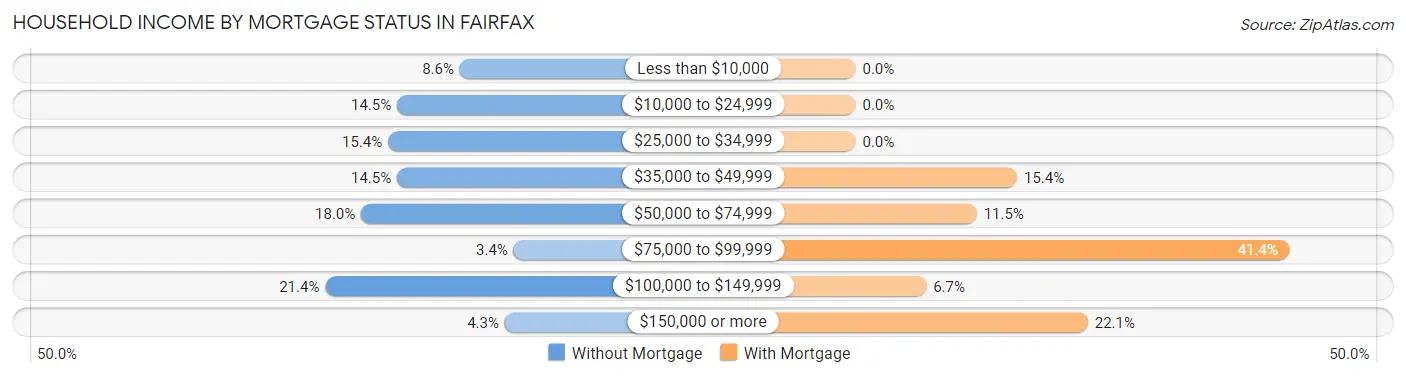
| Household Income | Without Mortgage | With Mortgage |
| Less than $10,000 | 10 (8.6%) | 0 (0.0%) |
| $10,000 to $24,999 | 17 (14.5%) | 0 (0.0%) |
| $25,000 to $34,999 | 18 (15.4%) | 0 (0.0%) |
| $35,000 to $49,999 | 17 (14.5%) | 16 (15.4%) |
| $50,000 to $74,999 | 21 (17.9%) | 12 (11.5%) |
| $75,000 to $99,999 | 4 (3.4%) | 43 (41.3%) |
| $100,000 to $149,999 | 25 (21.4%) | 7 (6.7%) |
| $150,000 or more | 5 (4.3%) | 23 (22.1%) |
| Total | 117 (100.0%) | 104 (100.0%) |
Property Value to Household Income Ratio in Fairfax
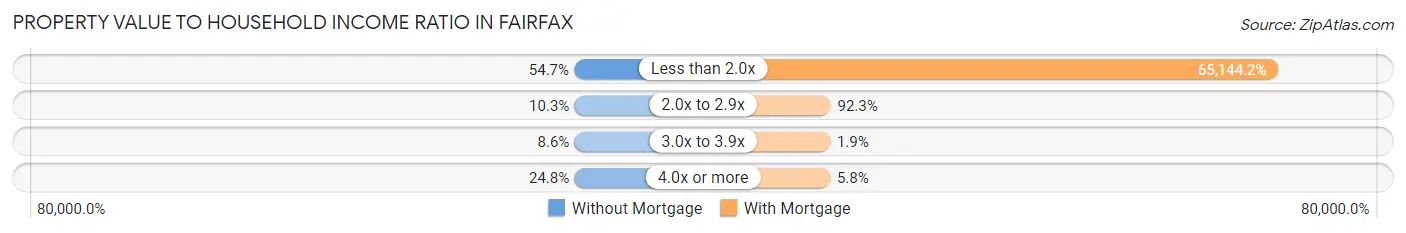
| Value-to-Income Ratio | Without Mortgage | With Mortgage |
| Less than 2.0x | 64 (54.7%) | 67,750 (65,144.2%) |
| 2.0x to 2.9x | 12 (10.3%) | 96 (92.3%) |
| 3.0x to 3.9x | 10 (8.6%) | 2 (1.9%) |
| 4.0x or more | 29 (24.8%) | 6 (5.8%) |
| Total | 117 (100.0%) | 104 (100.0%) |
Real Estate Taxes by Mortgage Status in Fairfax
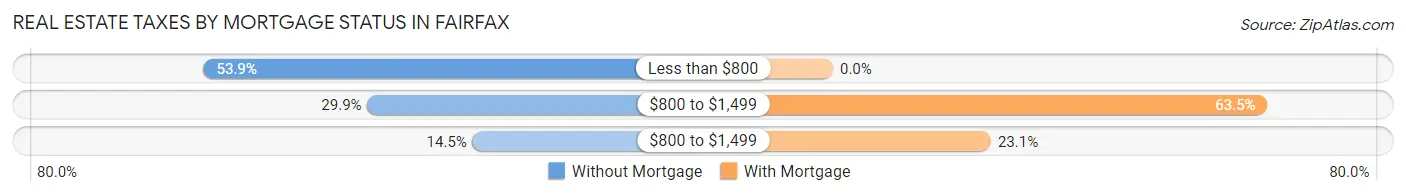
| Property Taxes | Without Mortgage | With Mortgage |
| Less than $800 | 63 (53.8%) | 0 (0.0%) |
| $800 to $1,499 | 35 (29.9%) | 66 (63.5%) |
| $800 to $1,499 | 17 (14.5%) | 24 (23.1%) |
| Total | 117 (100.0%) | 104 (100.0%) |
Health & Disability in Fairfax
Health Insurance Coverage by Age in Fairfax
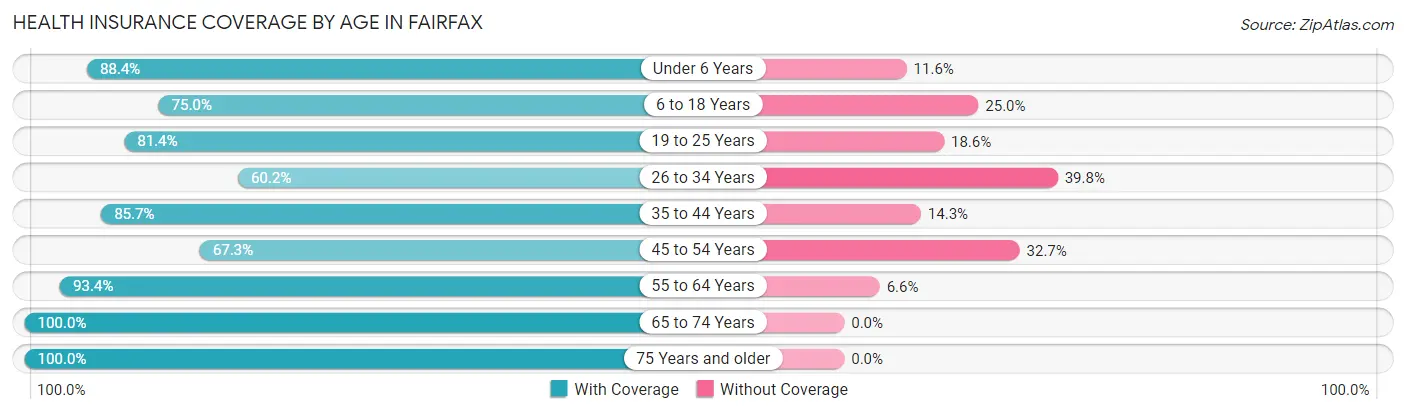
| Age Bracket | With Coverage | Without Coverage |
| Under 6 Years | 38 (88.4%) | 5 (11.6%) |
| 6 to 18 Years | 39 (75.0%) | 13 (25.0%) |
| 19 to 25 Years | 35 (81.4%) | 8 (18.6%) |
| 26 to 34 Years | 59 (60.2%) | 39 (39.8%) |
| 35 to 44 Years | 42 (85.7%) | 7 (14.3%) |
| 45 to 54 Years | 35 (67.3%) | 17 (32.7%) |
| 55 to 64 Years | 99 (93.4%) | 7 (6.6%) |
| 65 to 74 Years | 121 (100.0%) | 0 (0.0%) |
| 75 Years and older | 82 (100.0%) | 0 (0.0%) |
| Total | 550 (85.1%) | 96 (14.9%) |
Health Insurance Coverage by Citizenship Status in Fairfax
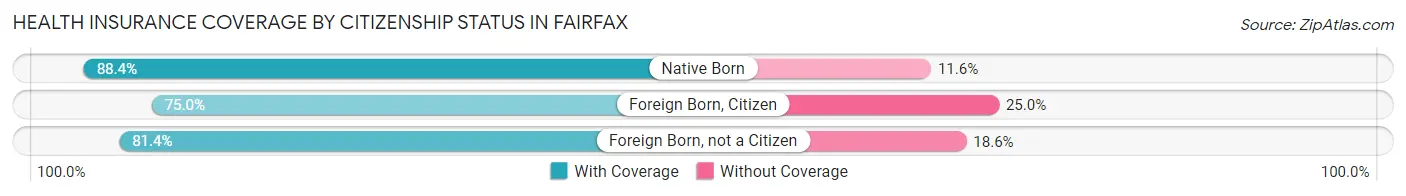
| Citizenship Status | With Coverage | Without Coverage |
| Native Born | 38 (88.4%) | 5 (11.6%) |
| Foreign Born, Citizen | 39 (75.0%) | 13 (25.0%) |
| Foreign Born, not a Citizen | 35 (81.4%) | 8 (18.6%) |
Health Insurance Coverage by Household Income in Fairfax
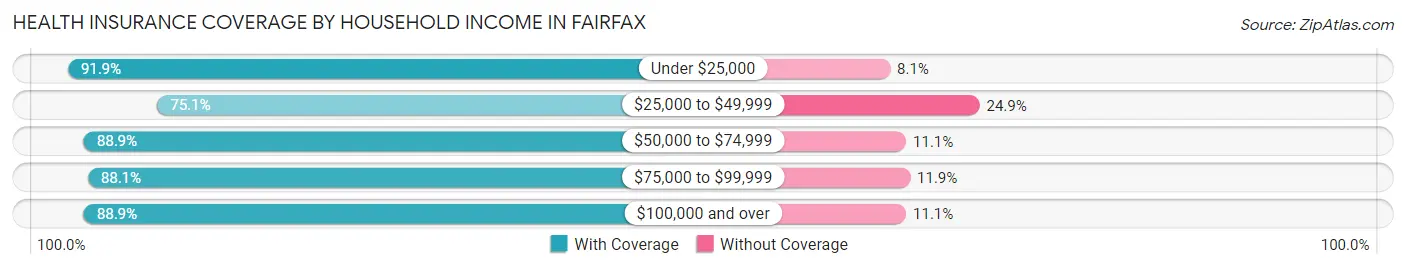
| Household Income | With Coverage | Without Coverage |
| Under $25,000 | 68 (91.9%) | 6 (8.1%) |
| $25,000 to $49,999 | 142 (75.1%) | 47 (24.9%) |
| $50,000 to $74,999 | 160 (88.9%) | 20 (11.1%) |
| $75,000 to $99,999 | 52 (88.1%) | 7 (11.9%) |
| $100,000 and over | 128 (88.9%) | 16 (11.1%) |
Public vs Private Health Insurance Coverage by Age in Fairfax
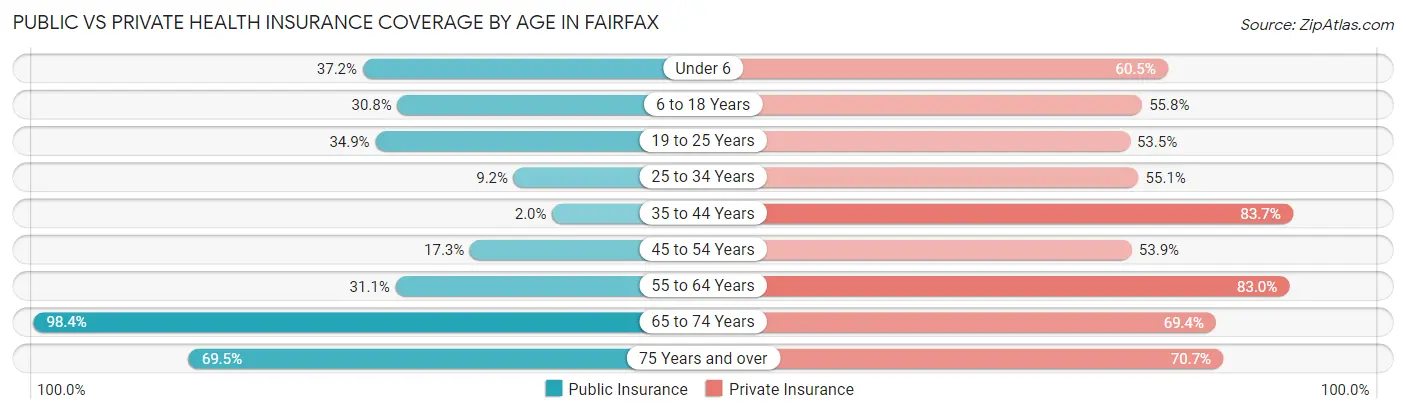
| Age Bracket | Public Insurance | Private Insurance |
| Under 6 | 16 (37.2%) | 26 (60.5%) |
| 6 to 18 Years | 16 (30.8%) | 29 (55.8%) |
| 19 to 25 Years | 15 (34.9%) | 23 (53.5%) |
| 25 to 34 Years | 9 (9.2%) | 54 (55.1%) |
| 35 to 44 Years | 1 (2.0%) | 41 (83.7%) |
| 45 to 54 Years | 9 (17.3%) | 28 (53.8%) |
| 55 to 64 Years | 33 (31.1%) | 88 (83.0%) |
| 65 to 74 Years | 119 (98.4%) | 84 (69.4%) |
| 75 Years and over | 57 (69.5%) | 58 (70.7%) |
| Total | 275 (42.6%) | 431 (66.7%) |
Disability Status by Sex by Age in Fairfax
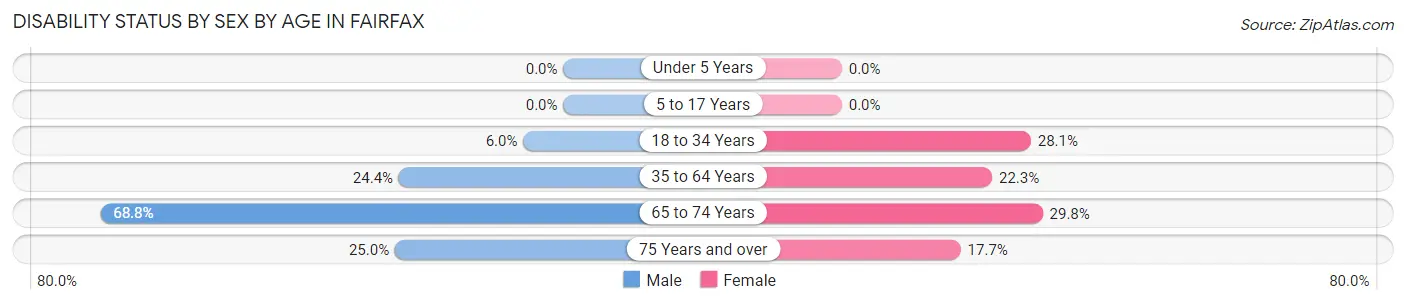
| Age Bracket | Male | Female |
| Under 5 Years | 0 (0.0%) | 0 (0.0%) |
| 5 to 17 Years | 0 (0.0%) | 0 (0.0%) |
| 18 to 34 Years | 5 (5.9%) | 16 (28.1%) |
| 35 to 64 Years | 21 (24.4%) | 27 (22.3%) |
| 65 to 74 Years | 44 (68.8%) | 17 (29.8%) |
| 75 Years and over | 12 (25.0%) | 6 (17.6%) |
Disability Class by Sex by Age in Fairfax
Disability Class: Hearing Difficulty
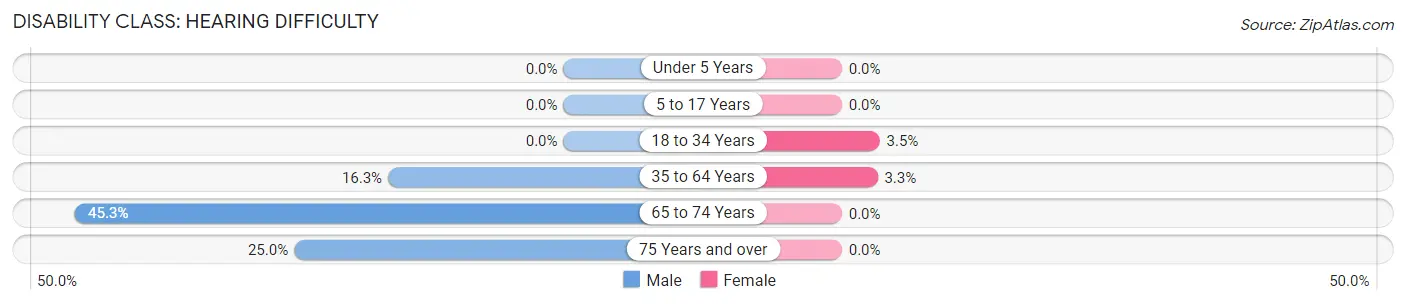
| Age Bracket | Male | Female |
| Under 5 Years | 0 (0.0%) | 0 (0.0%) |
| 5 to 17 Years | 0 (0.0%) | 0 (0.0%) |
| 18 to 34 Years | 0 (0.0%) | 2 (3.5%) |
| 35 to 64 Years | 14 (16.3%) | 4 (3.3%) |
| 65 to 74 Years | 29 (45.3%) | 0 (0.0%) |
| 75 Years and over | 12 (25.0%) | 0 (0.0%) |
Disability Class: Vision Difficulty
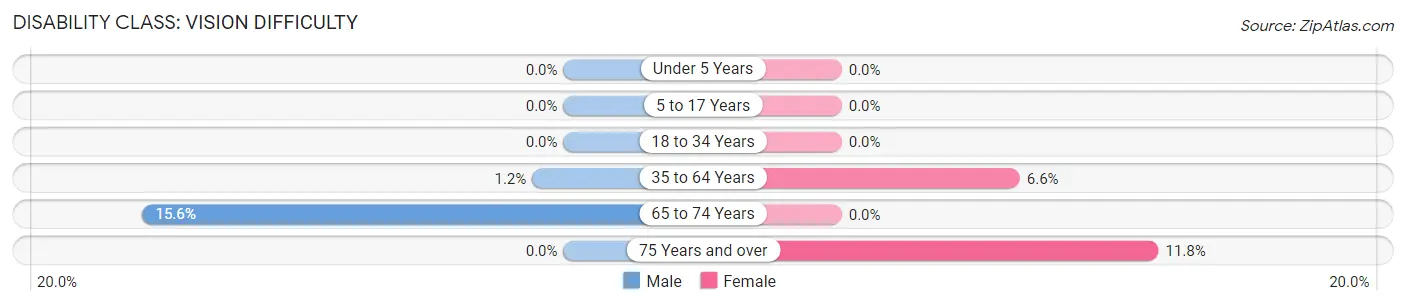
| Age Bracket | Male | Female |
| Under 5 Years | 0 (0.0%) | 0 (0.0%) |
| 5 to 17 Years | 0 (0.0%) | 0 (0.0%) |
| 18 to 34 Years | 0 (0.0%) | 0 (0.0%) |
| 35 to 64 Years | 1 (1.2%) | 8 (6.6%) |
| 65 to 74 Years | 10 (15.6%) | 0 (0.0%) |
| 75 Years and over | 0 (0.0%) | 4 (11.8%) |
Disability Class: Cognitive Difficulty
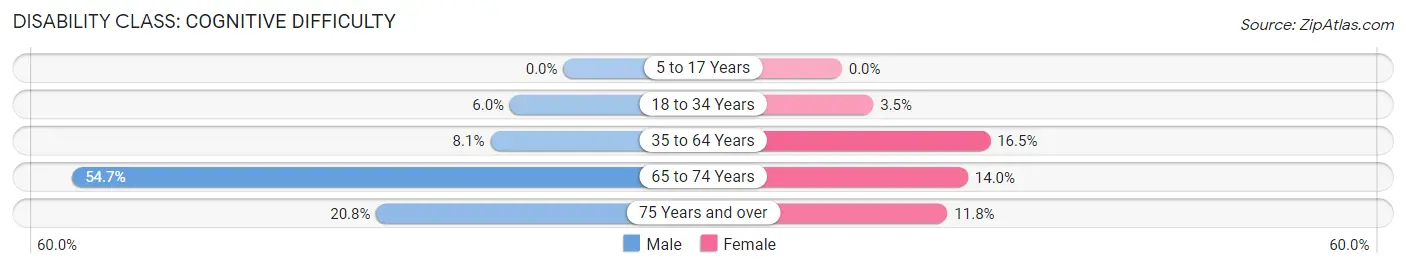
| Age Bracket | Male | Female |
| 5 to 17 Years | 0 (0.0%) | 0 (0.0%) |
| 18 to 34 Years | 5 (5.9%) | 2 (3.5%) |
| 35 to 64 Years | 7 (8.1%) | 20 (16.5%) |
| 65 to 74 Years | 35 (54.7%) | 8 (14.0%) |
| 75 Years and over | 10 (20.8%) | 4 (11.8%) |
Disability Class: Ambulatory Difficulty
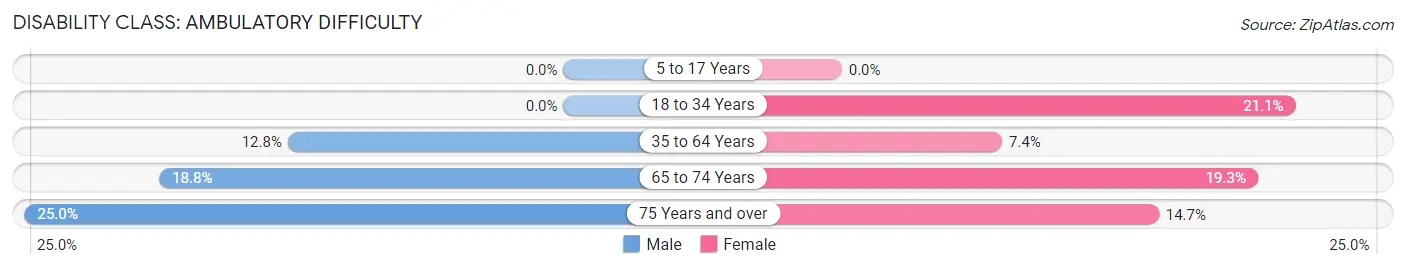
| Age Bracket | Male | Female |
| 5 to 17 Years | 0 (0.0%) | 0 (0.0%) |
| 18 to 34 Years | 0 (0.0%) | 12 (21.0%) |
| 35 to 64 Years | 11 (12.8%) | 9 (7.4%) |
| 65 to 74 Years | 12 (18.8%) | 11 (19.3%) |
| 75 Years and over | 12 (25.0%) | 5 (14.7%) |
Disability Class: Self-Care Difficulty
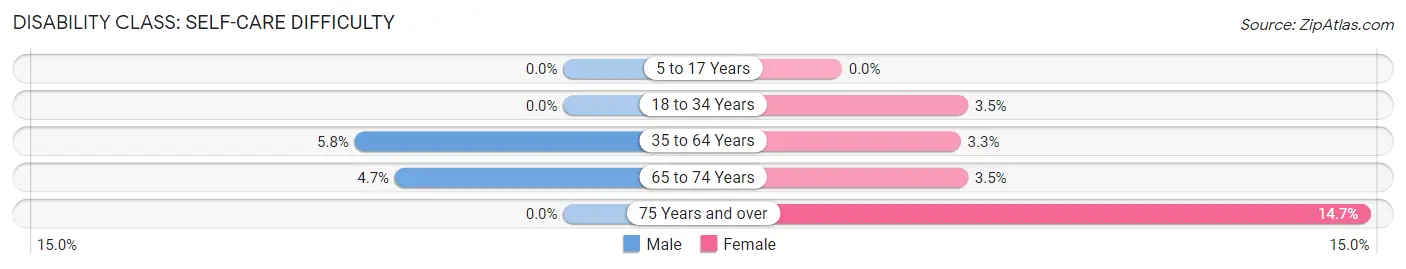
| Age Bracket | Male | Female |
| 5 to 17 Years | 0 (0.0%) | 0 (0.0%) |
| 18 to 34 Years | 0 (0.0%) | 2 (3.5%) |
| 35 to 64 Years | 5 (5.8%) | 4 (3.3%) |
| 65 to 74 Years | 3 (4.7%) | 2 (3.5%) |
| 75 Years and over | 0 (0.0%) | 5 (14.7%) |
Technology Access in Fairfax
Computing Device Access in Fairfax
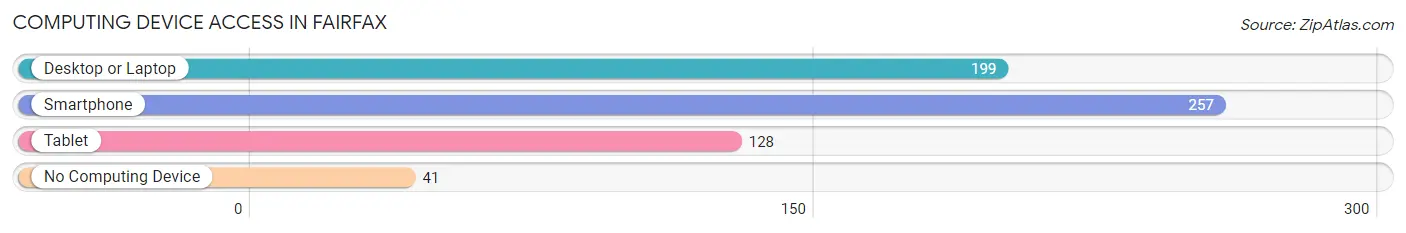
| Device Type | # Households | % Households |
| Desktop or Laptop | 199 | 61.6% |
| Smartphone | 257 | 79.6% |
| Tablet | 128 | 39.6% |
| No Computing Device | 41 | 12.7% |
| Total | 323 | 100.0% |
Internet Access in Fairfax
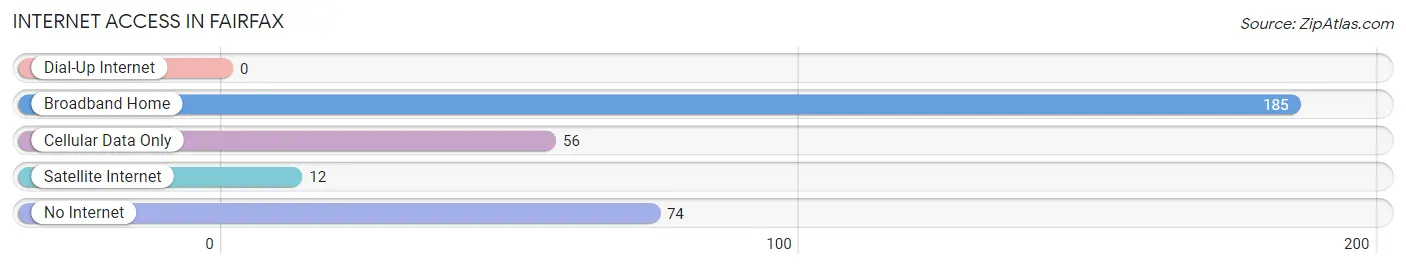
| Internet Type | # Households | % Households |
| Dial-Up Internet | 0 | 0.0% |
| Broadband Home | 185 | 57.3% |
| Cellular Data Only | 56 | 17.3% |
| Satellite Internet | 12 | 3.7% |
| No Internet | 74 | 22.9% |
| Total | 323 | 100.0% |
Fairfax Summary
Fairfax, Missouri is a small town located in Atchison County in the northwest corner of the state. It is situated on the banks of the Missouri River, and is part of the St. Joseph metropolitan area. The town has a population of just over 1,000 people, and is known for its rural charm and friendly atmosphere.
History
Fairfax was founded in 1845 by a group of settlers from Virginia. The town was named after Fairfax County, Virginia, and was originally intended to be a trading post for the local Native American tribes. The town quickly grew, and by the late 19th century, it had become a thriving agricultural center. The town was also home to a number of businesses, including a flour mill, a sawmill, and a brickyard.
In the early 20th century, Fairfax began to decline as the railroad bypassed the town. The population dwindled, and the town was nearly abandoned by the 1950s. However, in the late 1970s, the town began to experience a resurgence as people began to move back to the area. Today, Fairfax is a small but vibrant community, with a population of just over 1,000 people.
Geography
Fairfax is located in Atchison County, in the northwest corner of Missouri. It is situated on the banks of the Missouri River, and is part of the St. Joseph metropolitan area. The town is surrounded by rolling hills and farmland, and is located just a few miles from the Iowa border. The climate in Fairfax is humid continental, with hot summers and cold winters.
Economy
The economy of Fairfax is largely based on agriculture. The town is home to several farms, and the surrounding area is known for its production of corn, soybeans, and wheat. In addition, Fairfax is home to a number of small businesses, including a grocery store, a hardware store, and a few restaurants. The town also has a few manufacturing plants, which produce a variety of products, including furniture and clothing.
Demographics
As of the 2010 census, the population of Fairfax was 1,039. The racial makeup of the town was 97.3% White, 0.7% African American, 0.3% Native American, 0.2% Asian, and 1.5% from other races. The median household income in Fairfax was $37,917, and the median home value was $90,000. The town has a poverty rate of 16.3%, and the unemployment rate is 5.2%.
Conclusion
Fairfax, Missouri is a small town located in Atchison County in the northwest corner of the state. It is situated on the banks of the Missouri River, and is part of the St. Joseph metropolitan area. The town has a population of just over 1,000 people, and is known for its rural charm and friendly atmosphere. The economy of Fairfax is largely based on agriculture, and the town is home to several farms and small businesses. The population of Fairfax is predominantly White, with a median household income of $37,917 and a median home value of $90,000.
Common Questions
What is Per Capita Income in Fairfax?
Per Capita income in Fairfax is $32,167.
What is the Median Family Income in Fairfax?
Median Family Income in Fairfax is $60,197.
What is the Median Household income in Fairfax?
Median Household Income in Fairfax is $49,583.
What is Income or Wage Gap in Fairfax?
Income or Wage Gap in Fairfax is 65.8%.
Women in Fairfax earn 34.2 cents for every dollar earned by a man.
What is Inequality or Gini Index in Fairfax?
Inequality or Gini Index in Fairfax is 0.42.
What is the Total Population of Fairfax?
Total Population of Fairfax is 646.
What is the Total Male Population of Fairfax?
Total Male Population of Fairfax is 316.
What is the Total Female Population of Fairfax?
Total Female Population of Fairfax is 330.
What is the Ratio of Males per 100 Females in Fairfax?
There are 95.76 Males per 100 Females in Fairfax.
What is the Ratio of Females per 100 Males in Fairfax?
There are 104.43 Females per 100 Males in Fairfax.
What is the Median Population Age in Fairfax?
Median Population Age in Fairfax is 53.3 Years.
What is the Average Family Size in Fairfax
Average Family Size in Fairfax is 2.4 People.
What is the Average Household Size in Fairfax
Average Household Size in Fairfax is 2.0 People.
How Large is the Labor Force in Fairfax?
There are 344 People in the Labor Forcein in Fairfax.
What is the Percentage of People in the Labor Force in Fairfax?
61.3% of People are in the Labor Force in Fairfax.
What is the Unemployment Rate in Fairfax?
Unemployment Rate in Fairfax is 3.5%.