Moberly, MO Map & Demographics
Moberly Map
Moberly Overview
$21,760
PER CAPITA INCOME
$52,545
AVG FAMILY INCOME
$39,332
AVG HOUSEHOLD INCOME
0.6%
WAGE / INCOME GAP [ % ]
99.4¢/ $1
WAGE / INCOME GAP [ $ ]
$9,411
FAMILY INCOME DEFICIT
0.44
INEQUALITY / GINI INDEX
13,708
TOTAL POPULATION
7,355
MALE POPULATION
6,353
FEMALE POPULATION
115.77
MALES / 100 FEMALES
86.38
FEMALES / 100 MALES
37.5
MEDIAN AGE
3.0
AVG FAMILY SIZE
2.4
AVG HOUSEHOLD SIZE
5,752
LABOR FORCE [ PEOPLE ]
52.4%
PERCENT IN LABOR FORCE
7.5%
UNEMPLOYMENT RATE
Moberly Zip Codes
Income in Moberly
Income Overview in Moberly
Per Capita Income in Moberly is $21,760, while median incomes of families and households are $52,545 and $39,332 respectively.
| Characteristic | Number | Measure |
| Per Capita Income | 13,708 | $21,760 |
| Median Family Income | 3,081 | $52,545 |
| Mean Family Income | 3,081 | $65,822 |
| Median Household Income | 4,935 | $39,332 |
| Mean Household Income | 4,935 | $56,270 |
| Income Deficit | 3,081 | $9,411 |
| Wage / Income Gap (%) | 13,708 | 0.60% |
| Wage / Income Gap ($) | 13,708 | 99.40¢ per $1 |
| Gini / Inequality Index | 13,708 | 0.44 |
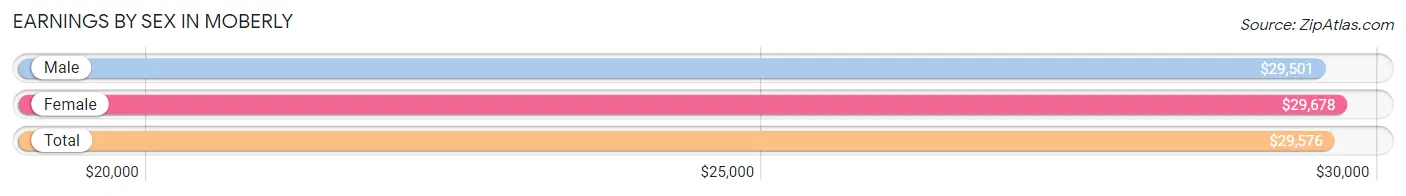
Earnings by Sex in Moberly
Average Earnings in Moberly are $29,576, $29,501 for men and $29,678 for women, a difference of 0.6%.
| Sex | Number | Average Earnings |
| Male | 2,767 (46.9%) | $29,501 |
| Female | 3,127 (53.0%) | $29,678 |
| Total | 5,894 (100.0%) | $29,576 |
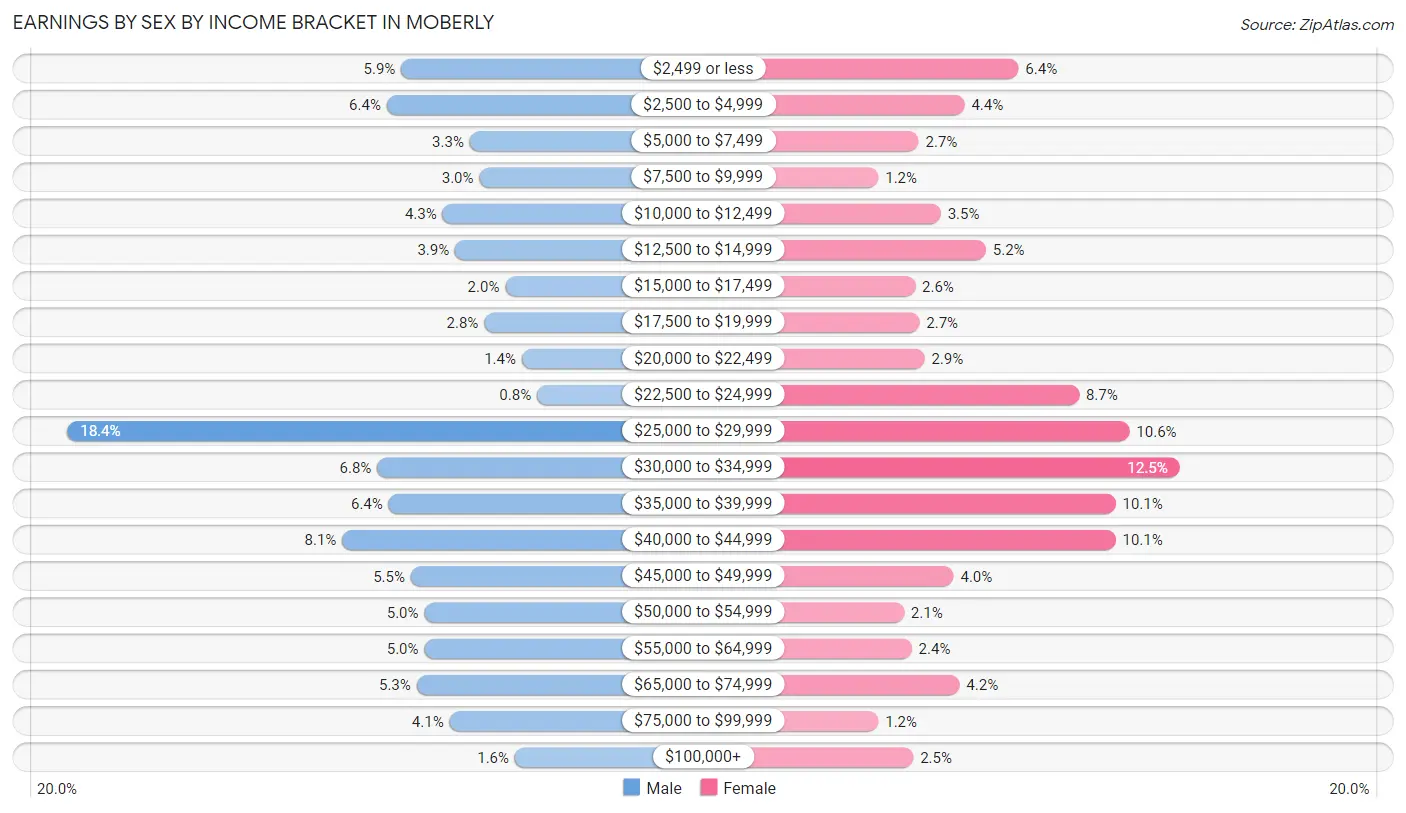
Earnings by Sex by Income Bracket in Moberly
The most common earnings brackets in Moberly are $25,000 to $29,999 for men (509 | 18.4%) and $30,000 to $34,999 for women (390 | 12.5%).
| Income | Male | Female |
| $2,499 or less | 163 (5.9%) | 201 (6.4%) |
| $2,500 to $4,999 | 178 (6.4%) | 138 (4.4%) |
| $5,000 to $7,499 | 92 (3.3%) | 84 (2.7%) |
| $7,500 to $9,999 | 82 (3.0%) | 37 (1.2%) |
| $10,000 to $12,499 | 120 (4.3%) | 110 (3.5%) |
| $12,500 to $14,999 | 107 (3.9%) | 163 (5.2%) |
| $15,000 to $17,499 | 55 (2.0%) | 80 (2.6%) |
| $17,500 to $19,999 | 77 (2.8%) | 85 (2.7%) |
| $20,000 to $22,499 | 38 (1.4%) | 91 (2.9%) |
| $22,500 to $24,999 | 22 (0.8%) | 272 (8.7%) |
| $25,000 to $29,999 | 509 (18.4%) | 331 (10.6%) |
| $30,000 to $34,999 | 188 (6.8%) | 390 (12.5%) |
| $35,000 to $39,999 | 176 (6.4%) | 315 (10.1%) |
| $40,000 to $44,999 | 224 (8.1%) | 315 (10.1%) |
| $45,000 to $49,999 | 153 (5.5%) | 125 (4.0%) |
| $50,000 to $54,999 | 139 (5.0%) | 67 (2.1%) |
| $55,000 to $64,999 | 139 (5.0%) | 76 (2.4%) |
| $65,000 to $74,999 | 147 (5.3%) | 132 (4.2%) |
| $75,000 to $99,999 | 113 (4.1%) | 37 (1.2%) |
| $100,000+ | 45 (1.6%) | 78 (2.5%) |
| Total | 2,767 (100.0%) | 3,127 (100.0%) |
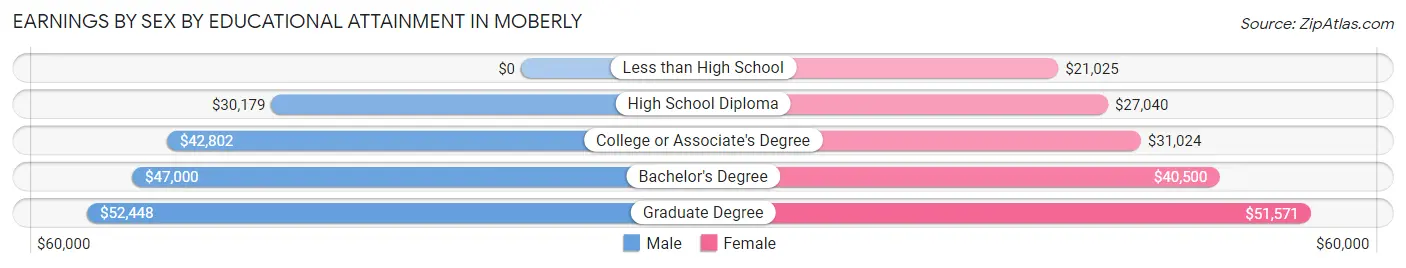
Earnings by Sex by Educational Attainment in Moberly
Average earnings in Moberly are $36,716 for men and $32,343 for women, a difference of 11.9%. Men with an educational attainment of graduate degree enjoy the highest average annual earnings of $52,448, while those with high school diploma education earn the least with $30,179. Women with an educational attainment of graduate degree earn the most with the average annual earnings of $51,571, while those with less than high school education have the smallest earnings of $21,025.
| Educational Attainment | Male Income | Female Income |
| Less than High School | - | - |
| High School Diploma | $30,179 | $27,040 |
| College or Associate's Degree | $42,802 | $31,024 |
| Bachelor's Degree | $47,000 | $40,500 |
| Graduate Degree | $52,448 | $51,571 |
| Total | $36,716 | $32,343 |
Family Income in Moberly
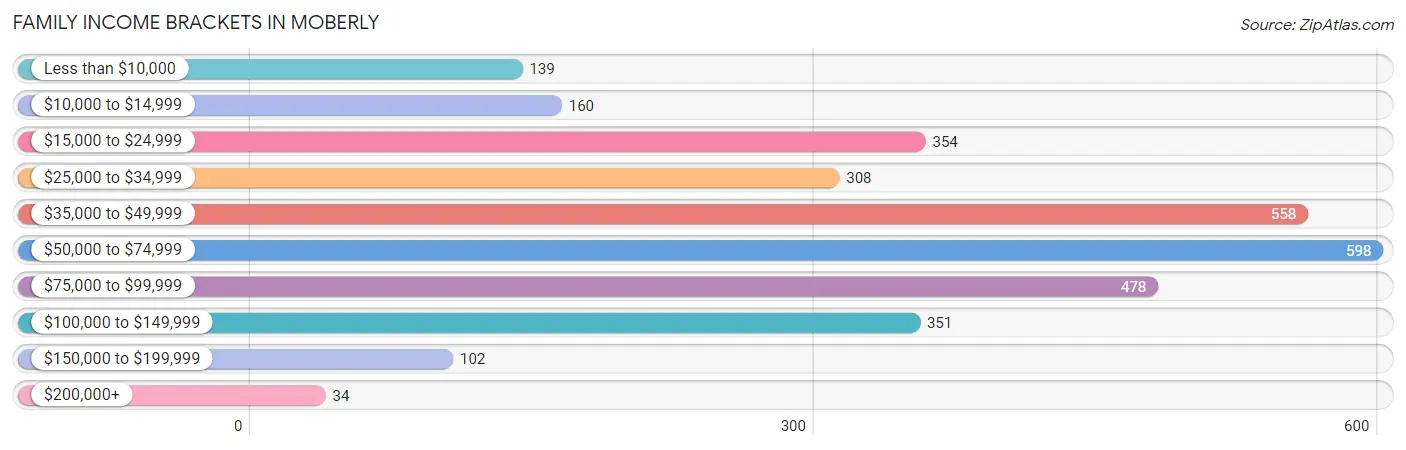
Family Income Brackets in Moberly
According to the Moberly family income data, there are 598 families falling into the $50,000 to $74,999 income range, which is the most common income bracket and makes up 19.4% of all families. Conversely, the $200,000+ income bracket is the least frequent group with only 34 families (1.1%) belonging to this category.
| Income Bracket | # Families | % Families |
| Less than $10,000 | 139 | 4.5% |
| $10,000 to $14,999 | 160 | 5.2% |
| $15,000 to $24,999 | 354 | 11.5% |
| $25,000 to $34,999 | 308 | 10.0% |
| $35,000 to $49,999 | 558 | 18.1% |
| $50,000 to $74,999 | 598 | 19.4% |
| $75,000 to $99,999 | 478 | 15.5% |
| $100,000 to $149,999 | 351 | 11.4% |
| $150,000 to $199,999 | 102 | 3.3% |
| $200,000+ | 34 | 1.1% |
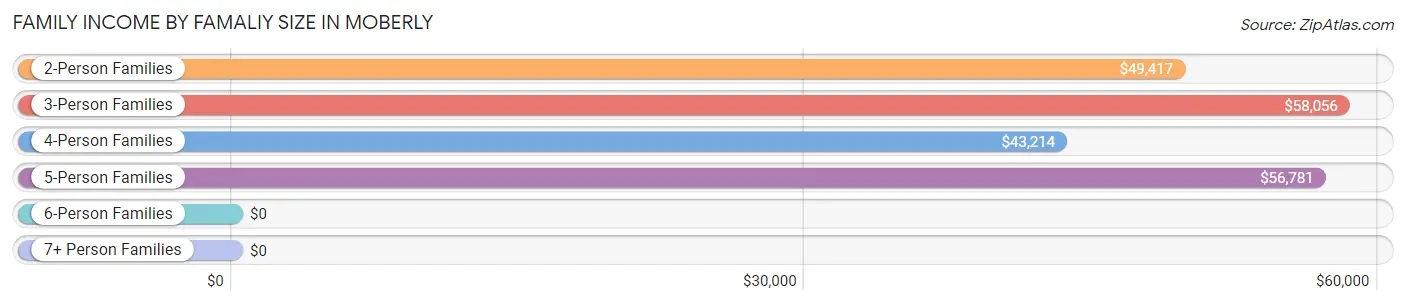
Family Income by Famaliy Size in Moberly
3-person families (704 | 22.9%) account for the highest median family income in Moberly with $58,056 per family, while 2-person families (1,566 | 50.8%) have the highest median income of $24,708 per family member.
| Income Bracket | # Families | Median Income |
| 2-Person Families | 1,566 (50.8%) | $49,417 |
| 3-Person Families | 704 (22.9%) | $58,056 |
| 4-Person Families | 586 (19.0%) | $43,214 |
| 5-Person Families | 111 (3.6%) | $56,781 |
| 6-Person Families | 70 (2.3%) | $0 |
| 7+ Person Families | 44 (1.4%) | $0 |
| Total | 3,081 (100.0%) | $52,545 |
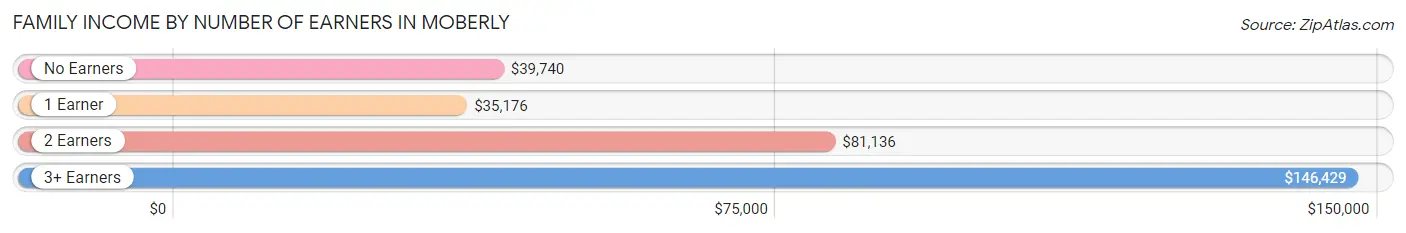
Family Income by Number of Earners in Moberly
The median family income in Moberly is $52,545, with families comprising 3+ earners (134) having the highest median family income of $146,429, while families with 1 earner (1,324) have the lowest median family income of $35,176, accounting for 4.3% and 43.0% of families, respectively.
| Number of Earners | # Families | Median Income |
| No Earners | 469 (15.2%) | $39,740 |
| 1 Earner | 1,324 (43.0%) | $35,176 |
| 2 Earners | 1,154 (37.5%) | $81,136 |
| 3+ Earners | 134 (4.3%) | $146,429 |
| Total | 3,081 (100.0%) | $52,545 |
Household Income in Moberly
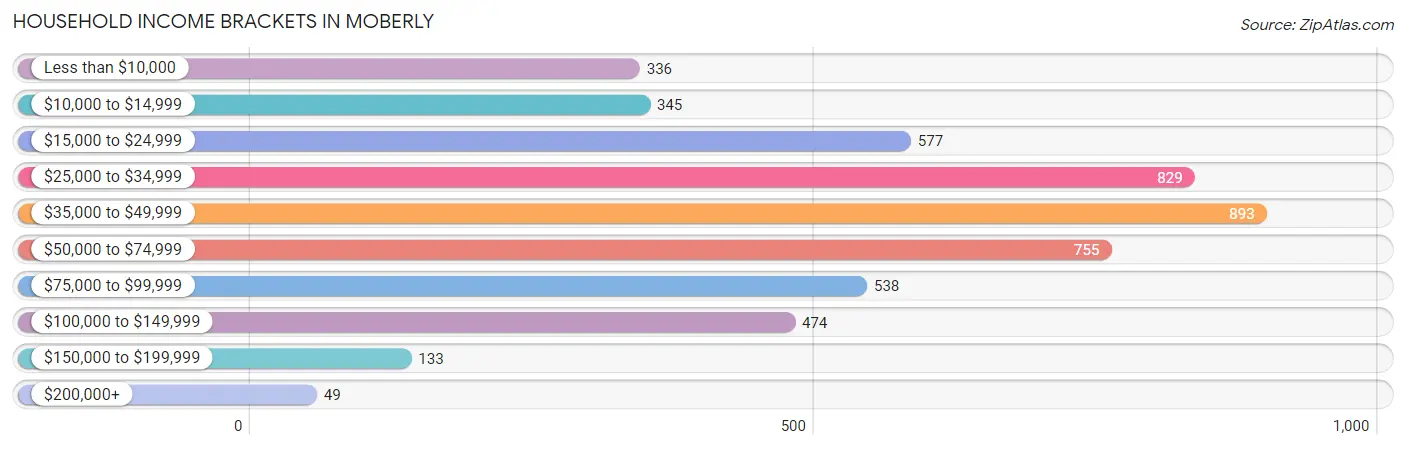
Household Income Brackets in Moberly
With 893 households falling in the category, the $35,000 to $49,999 income range is the most frequent in Moberly, accounting for 18.1% of all households. In contrast, only 49 households (1.0%) fall into the $200,000+ income bracket, making it the least populous group.
| Income Bracket | # Households | % Households |
| Less than $10,000 | 336 | 6.8% |
| $10,000 to $14,999 | 345 | 7.0% |
| $15,000 to $24,999 | 577 | 11.7% |
| $25,000 to $34,999 | 829 | 16.8% |
| $35,000 to $49,999 | 893 | 18.1% |
| $50,000 to $74,999 | 755 | 15.3% |
| $75,000 to $99,999 | 538 | 10.9% |
| $100,000 to $149,999 | 474 | 9.6% |
| $150,000 to $199,999 | 133 | 2.7% |
| $200,000+ | 49 | 1.0% |
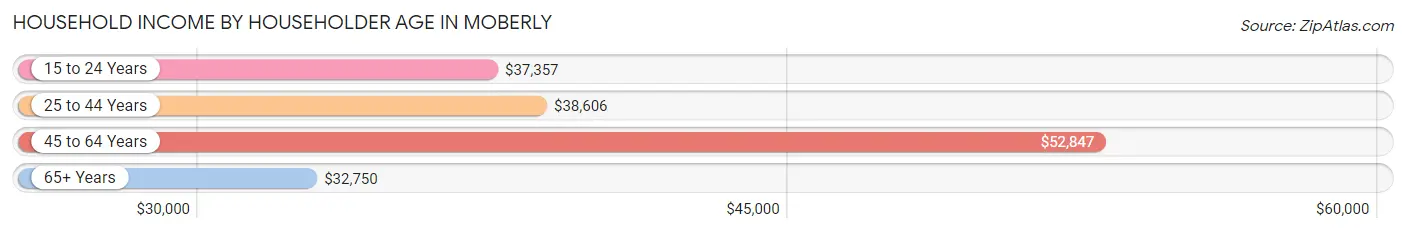
Household Income by Householder Age in Moberly
The median household income in Moberly is $39,332, with the highest median household income of $52,847 found in the 45 to 64 years age bracket for the primary householder. A total of 1,603 households (32.5%) fall into this category. Meanwhile, the 65+ years age bracket for the primary householder has the lowest median household income of $32,750, with 1,216 households (24.6%) in this group.
| Income Bracket | # Households | Median Income |
| 15 to 24 Years | 340 (6.9%) | $37,357 |
| 25 to 44 Years | 1,776 (36.0%) | $38,606 |
| 45 to 64 Years | 1,603 (32.5%) | $52,847 |
| 65+ Years | 1,216 (24.6%) | $32,750 |
| Total | 4,935 (100.0%) | $39,332 |
Poverty in Moberly
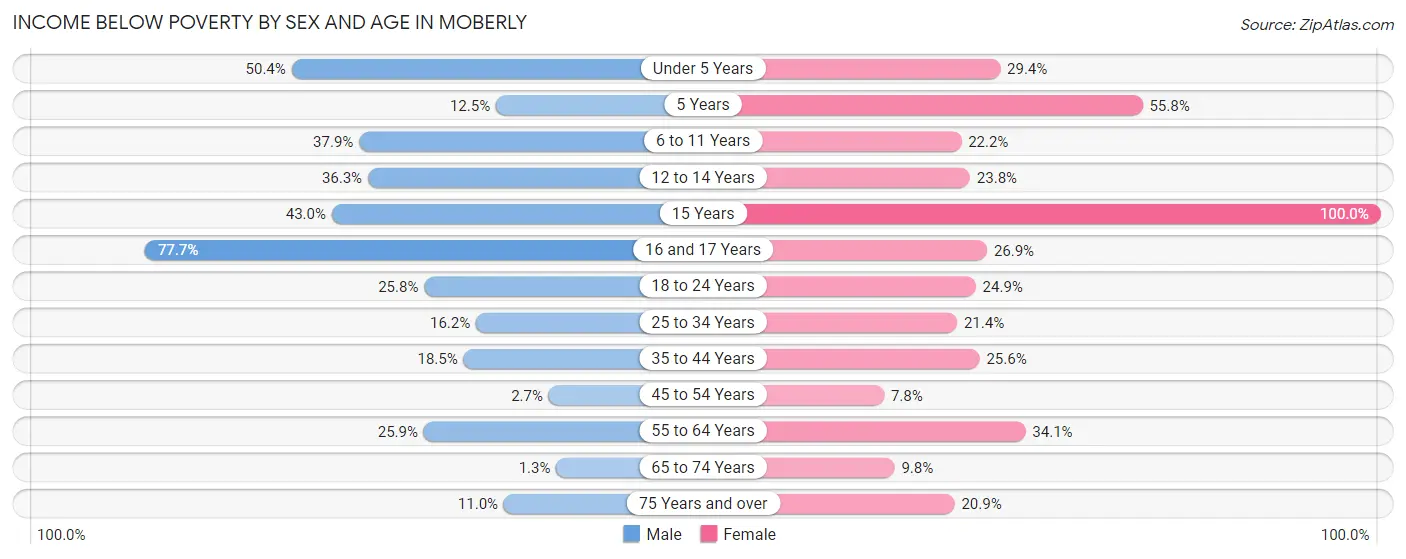
Income Below Poverty by Sex and Age in Moberly
With 23.8% poverty level for males and 22.9% for females among the residents of Moberly, 16 and 17 year old males and 15 year old females are the most vulnerable to poverty, with 66 males (77.6%) and 19 females (100.0%) in their respective age groups living below the poverty level.
| Age Bracket | Male | Female |
| Under 5 Years | 229 (50.4%) | 102 (29.4%) |
| 5 Years | 15 (12.5%) | 48 (55.8%) |
| 6 to 11 Years | 199 (37.9%) | 113 (22.2%) |
| 12 to 14 Years | 140 (36.3%) | 39 (23.8%) |
| 15 Years | 49 (43.0%) | 19 (100.0%) |
| 16 and 17 Years | 66 (77.6%) | 66 (26.9%) |
| 18 to 24 Years | 149 (25.8%) | 82 (24.8%) |
| 25 to 34 Years | 146 (16.2%) | 208 (21.4%) |
| 35 to 44 Years | 136 (18.5%) | 204 (25.6%) |
| 45 to 54 Years | 12 (2.7%) | 45 (7.8%) |
| 55 to 64 Years | 173 (25.9%) | 305 (34.1%) |
| 65 to 74 Years | 5 (1.3%) | 66 (9.8%) |
| 75 Years and over | 31 (11.0%) | 118 (20.9%) |
| Total | 1,350 (23.8%) | 1,415 (22.9%) |
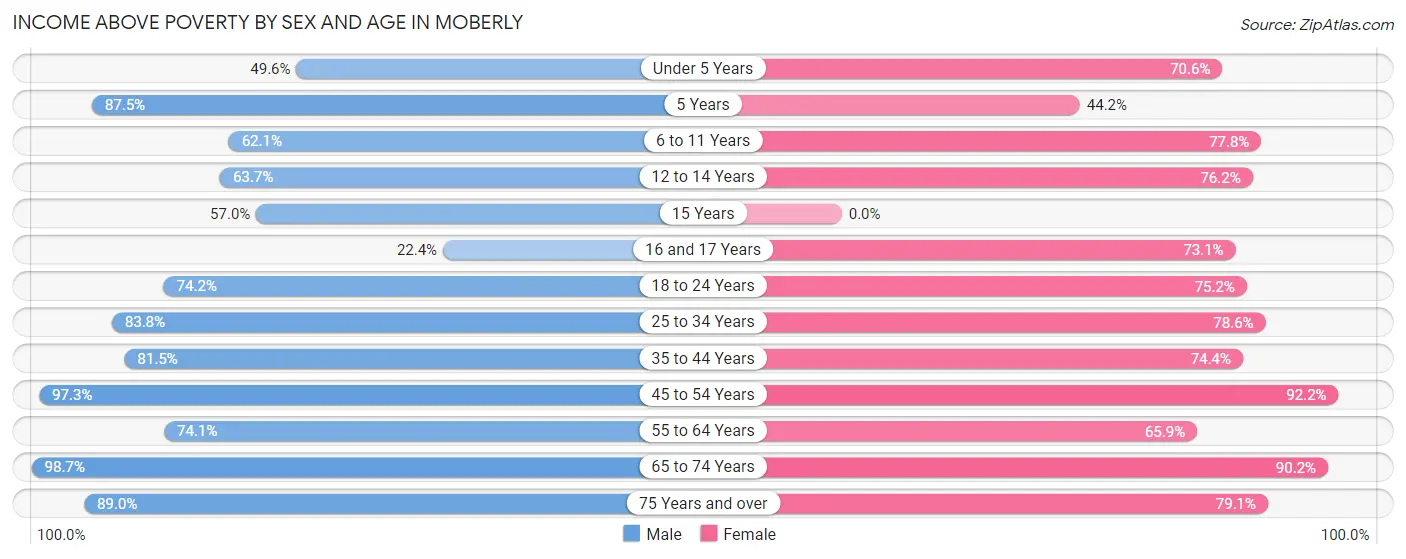
Income Above Poverty by Sex and Age in Moberly
According to the poverty statistics in Moberly, males aged 65 to 74 years and females aged 45 to 54 years are the age groups that are most secure financially, with 98.7% of males and 92.2% of females in these age groups living above the poverty line.
| Age Bracket | Male | Female |
| Under 5 Years | 225 (49.6%) | 245 (70.6%) |
| 5 Years | 105 (87.5%) | 38 (44.2%) |
| 6 to 11 Years | 326 (62.1%) | 397 (77.8%) |
| 12 to 14 Years | 246 (63.7%) | 125 (76.2%) |
| 15 Years | 65 (57.0%) | 0 (0.0%) |
| 16 and 17 Years | 19 (22.4%) | 179 (73.1%) |
| 18 to 24 Years | 428 (74.2%) | 248 (75.1%) |
| 25 to 34 Years | 755 (83.8%) | 765 (78.6%) |
| 35 to 44 Years | 598 (81.5%) | 594 (74.4%) |
| 45 to 54 Years | 433 (97.3%) | 530 (92.2%) |
| 55 to 64 Years | 495 (74.1%) | 590 (65.9%) |
| 65 to 74 Years | 376 (98.7%) | 609 (90.2%) |
| 75 Years and over | 250 (89.0%) | 446 (79.1%) |
| Total | 4,321 (76.2%) | 4,766 (77.1%) |
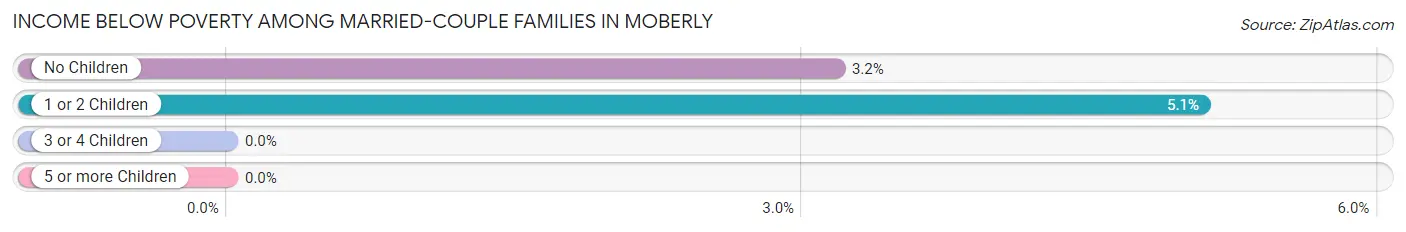
Income Below Poverty Among Married-Couple Families in Moberly
The poverty statistics for married-couple families in Moberly show that 3.7% or 57 of the total 1,555 families live below the poverty line. Families with 1 or 2 children have the highest poverty rate of 5.1%, comprising of 28 families. On the other hand, families with 3 or 4 children have the lowest poverty rate of 0.0%, which includes 0 families.
| Children | Above Poverty | Below Poverty |
| No Children | 887 (96.8%) | 29 (3.2%) |
| 1 or 2 Children | 523 (94.9%) | 28 (5.1%) |
| 3 or 4 Children | 72 (100.0%) | 0 (0.0%) |
| 5 or more Children | 16 (100.0%) | 0 (0.0%) |
| Total | 1,498 (96.3%) | 57 (3.7%) |
Income Below Poverty Among Single-Parent Households in Moberly
According to the poverty data in Moberly, 23.4% or 83 single-father households and 36.2% or 424 single-mother households are living below the poverty line. Among single-father households, those with 3 or 4 children have the highest poverty rate, with 24 households (100.0%) experiencing poverty. Likewise, among single-mother households, those with 3 or 4 children have the highest poverty rate, with 247 households (100.0%) falling below the poverty line.
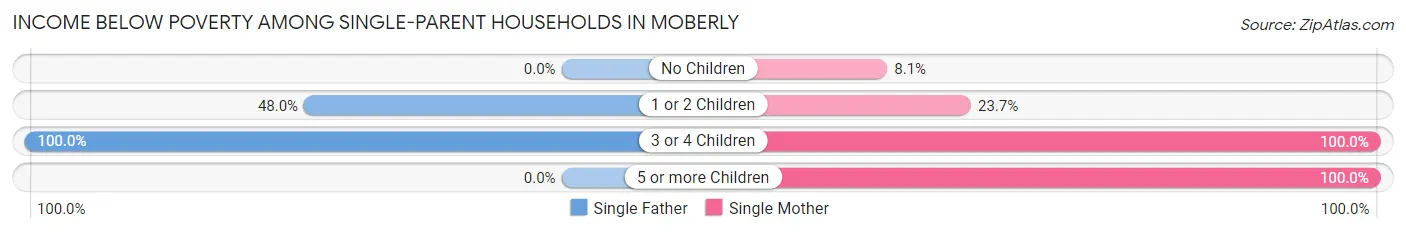
| Children | Single Father | Single Mother |
| No Children | 0 (0.0%) | 25 (8.1%) |
| 1 or 2 Children | 59 (48.0%) | 145 (23.7%) |
| 3 or 4 Children | 24 (100.0%) | 247 (100.0%) |
| 5 or more Children | 0 (0.0%) | 7 (100.0%) |
| Total | 83 (23.4%) | 424 (36.2%) |
Income Below Poverty Among Married-Couple vs Single-Parent Households in Moberly
The poverty data for Moberly shows that 57 of the married-couple family households (3.7%) and 507 of the single-parent households (33.2%) are living below the poverty level. Within the married-couple family households, those with 1 or 2 children have the highest poverty rate, with 28 households (5.1%) falling below the poverty line. Among the single-parent households, those with 3 or 4 children have the highest poverty rate, with 271 household (100.0%) living below poverty.
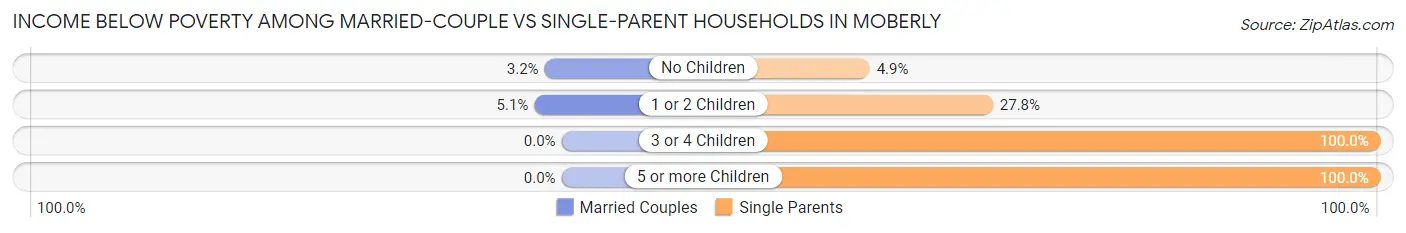
| Children | Married-Couple Families | Single-Parent Households |
| No Children | 29 (3.2%) | 25 (4.9%) |
| 1 or 2 Children | 28 (5.1%) | 204 (27.8%) |
| 3 or 4 Children | 0 (0.0%) | 271 (100.0%) |
| 5 or more Children | 0 (0.0%) | 7 (100.0%) |
| Total | 57 (3.7%) | 507 (33.2%) |
Race in Moberly
The most populous races in Moberly are White / Caucasian (11,473 | 83.7%), Black / African American (1,183 | 8.6%), and Two or more Races (775 | 5.7%).
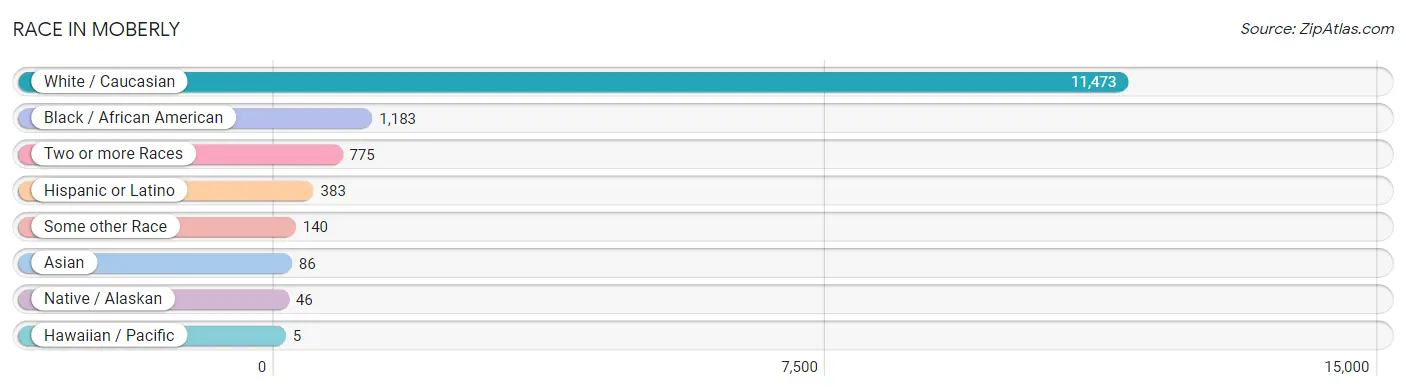
| Race | # Population | % Population |
| Asian | 86 | 0.6% |
| Black / African American | 1,183 | 8.6% |
| Hawaiian / Pacific | 5 | 0.0% |
| Hispanic or Latino | 383 | 2.8% |
| Native / Alaskan | 46 | 0.3% |
| White / Caucasian | 11,473 | 83.7% |
| Two or more Races | 775 | 5.7% |
| Some other Race | 140 | 1.0% |
| Total | 13,708 | 100.0% |
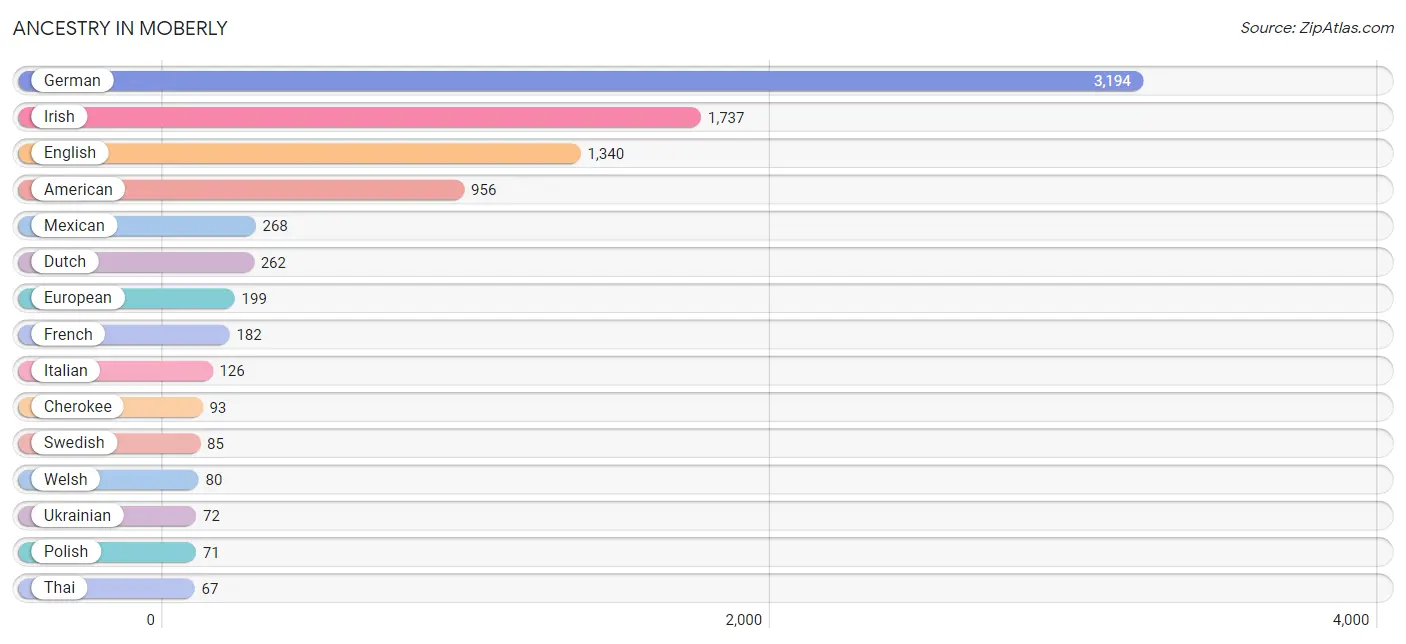
Ancestry in Moberly
The most populous ancestries reported in Moberly are German (3,194 | 23.3%), Irish (1,737 | 12.7%), English (1,340 | 9.8%), American (956 | 7.0%), and Mexican (268 | 2.0%), together accounting for 54.7% of all Moberly residents.
| Ancestry | # Population | % Population |
| African | 29 | 0.2% |
| American | 956 | 7.0% |
| Arab | 39 | 0.3% |
| Belgian | 19 | 0.1% |
| Bhutanese | 12 | 0.1% |
| Blackfeet | 10 | 0.1% |
| Burmese | 38 | 0.3% |
| Cherokee | 93 | 0.7% |
| Chickasaw | 24 | 0.2% |
| Colombian | 43 | 0.3% |
| Cuban | 63 | 0.5% |
| Danish | 8 | 0.1% |
| Dutch | 262 | 1.9% |
| Eastern European | 33 | 0.2% |
| English | 1,340 | 9.8% |
| European | 199 | 1.5% |
| French | 182 | 1.3% |
| French Canadian | 41 | 0.3% |
| German | 3,194 | 23.3% |
| Indian (Asian) | 44 | 0.3% |
| Iraqi | 39 | 0.3% |
| Irish | 1,737 | 12.7% |
| Italian | 126 | 0.9% |
| Korean | 6 | 0.0% |
| Mexican | 268 | 2.0% |
| Native Hawaiian | 5 | 0.0% |
| Northern European | 9 | 0.1% |
| Norwegian | 18 | 0.1% |
| Polish | 71 | 0.5% |
| Portuguese | 2 | 0.0% |
| Russian | 8 | 0.1% |
| Samoan | 37 | 0.3% |
| Scandinavian | 24 | 0.2% |
| Scotch-Irish | 47 | 0.3% |
| Scottish | 56 | 0.4% |
| Sioux | 25 | 0.2% |
| South American | 43 | 0.3% |
| Spaniard | 6 | 0.0% |
| Spanish | 3 | 0.0% |
| Subsaharan African | 38 | 0.3% |
| Swedish | 85 | 0.6% |
| Swiss | 32 | 0.2% |
| Thai | 67 | 0.5% |
| Ukrainian | 72 | 0.5% |
| Welsh | 80 | 0.6% | View All 45 Rows |
Immigrants in Moberly
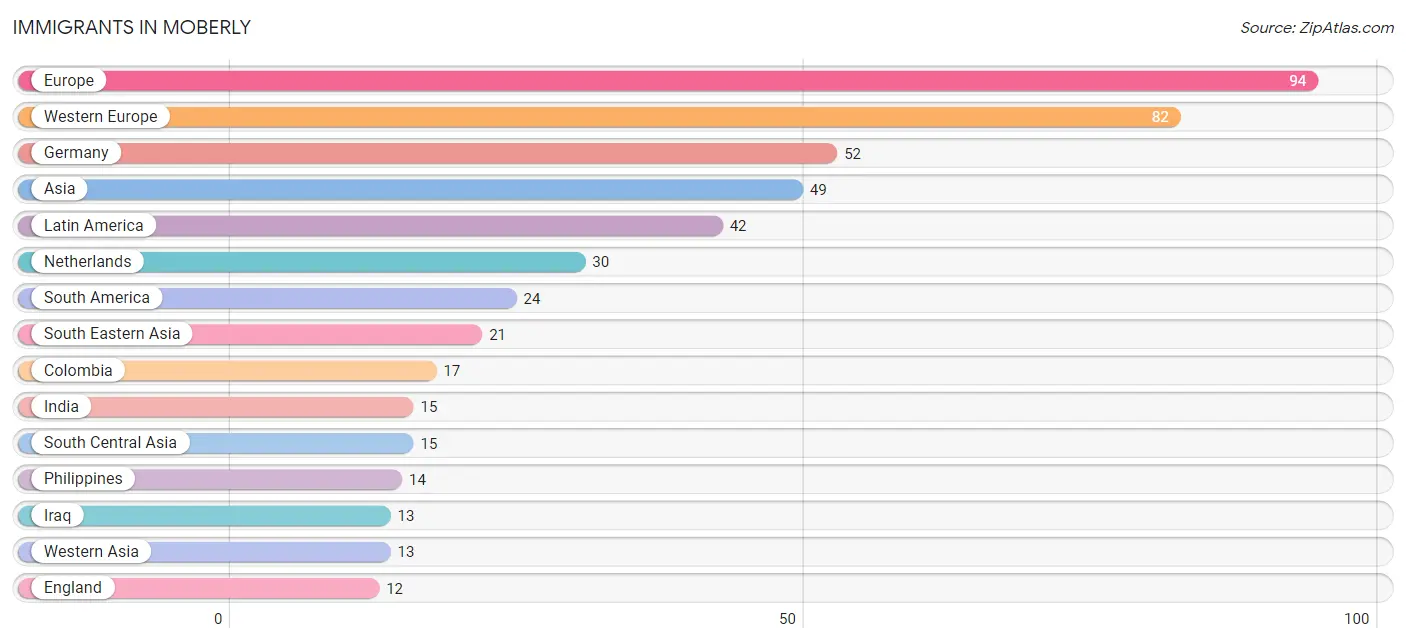
The most numerous immigrant groups reported in Moberly came from Europe (94 | 0.7%), Western Europe (82 | 0.6%), Germany (52 | 0.4%), Asia (49 | 0.4%), and Latin America (42 | 0.3%), together accounting for 2.3% of all Moberly residents.
| Immigration Origin | # Population | % Population |
| Asia | 49 | 0.4% |
| Brazil | 7 | 0.1% |
| Caribbean | 7 | 0.1% |
| Central America | 11 | 0.1% |
| Colombia | 17 | 0.1% |
| Cuba | 7 | 0.1% |
| England | 12 | 0.1% |
| Europe | 94 | 0.7% |
| Germany | 52 | 0.4% |
| India | 15 | 0.1% |
| Indonesia | 7 | 0.1% |
| Iraq | 13 | 0.1% |
| Latin America | 42 | 0.3% |
| Mexico | 11 | 0.1% |
| Netherlands | 30 | 0.2% |
| Northern Europe | 12 | 0.1% |
| Philippines | 14 | 0.1% |
| South America | 24 | 0.2% |
| South Central Asia | 15 | 0.1% |
| South Eastern Asia | 21 | 0.2% |
| Western Asia | 13 | 0.1% |
| Western Europe | 82 | 0.6% | View All 22 Rows |
Sex and Age in Moberly
Sex and Age in Moberly
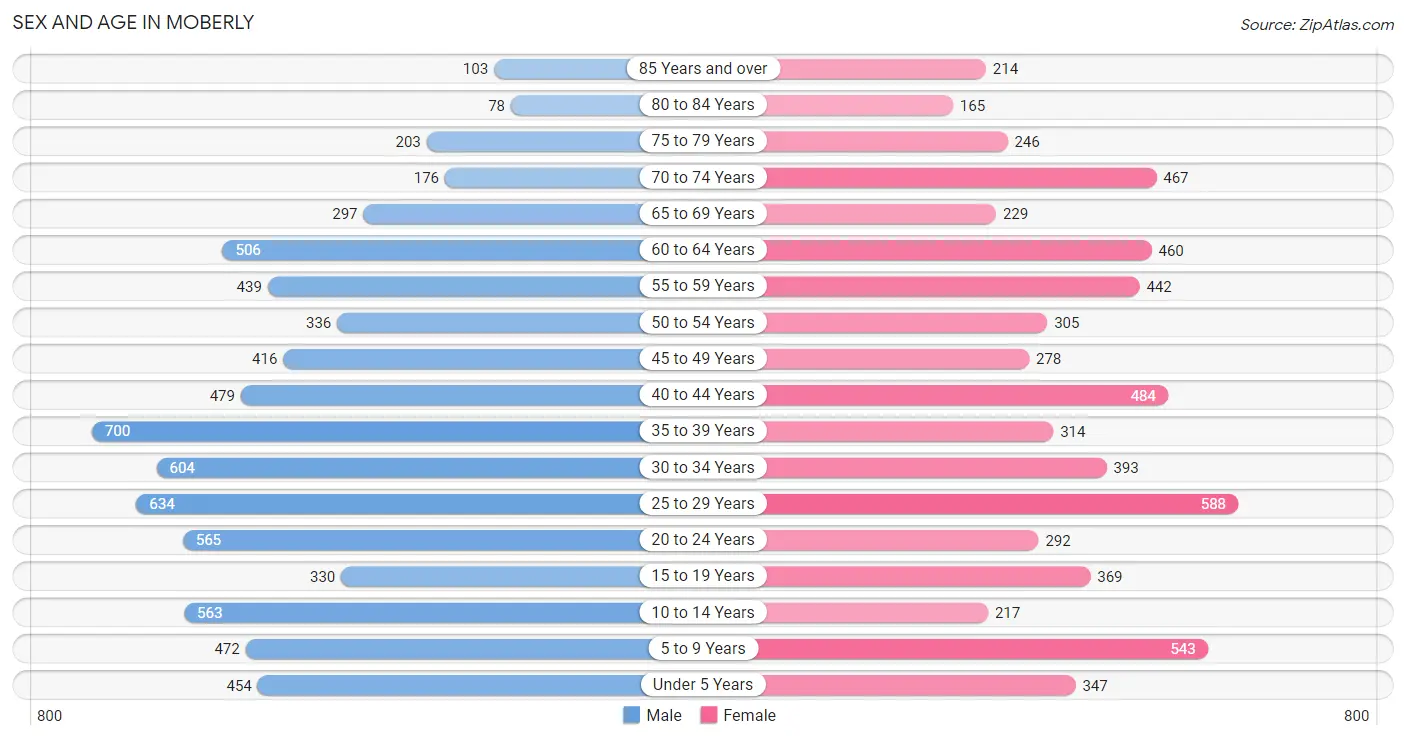
The most populous age groups in Moberly are 35 to 39 Years (700 | 9.5%) for men and 25 to 29 Years (588 | 9.3%) for women.
| Age Bracket | Male | Female |
| Under 5 Years | 454 (6.2%) | 347 (5.5%) |
| 5 to 9 Years | 472 (6.4%) | 543 (8.6%) |
| 10 to 14 Years | 563 (7.6%) | 217 (3.4%) |
| 15 to 19 Years | 330 (4.5%) | 369 (5.8%) |
| 20 to 24 Years | 565 (7.7%) | 292 (4.6%) |
| 25 to 29 Years | 634 (8.6%) | 588 (9.3%) |
| 30 to 34 Years | 604 (8.2%) | 393 (6.2%) |
| 35 to 39 Years | 700 (9.5%) | 314 (4.9%) |
| 40 to 44 Years | 479 (6.5%) | 484 (7.6%) |
| 45 to 49 Years | 416 (5.7%) | 278 (4.4%) |
| 50 to 54 Years | 336 (4.6%) | 305 (4.8%) |
| 55 to 59 Years | 439 (6.0%) | 442 (7.0%) |
| 60 to 64 Years | 506 (6.9%) | 460 (7.2%) |
| 65 to 69 Years | 297 (4.0%) | 229 (3.6%) |
| 70 to 74 Years | 176 (2.4%) | 467 (7.3%) |
| 75 to 79 Years | 203 (2.8%) | 246 (3.9%) |
| 80 to 84 Years | 78 (1.1%) | 165 (2.6%) |
| 85 Years and over | 103 (1.4%) | 214 (3.4%) |
| Total | 7,355 (100.0%) | 6,353 (100.0%) |
Families and Households in Moberly
Median Family Size in Moberly
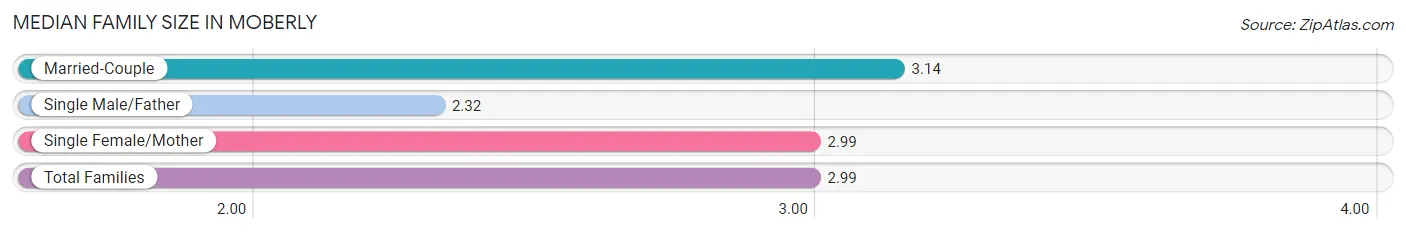
The median family size in Moberly is 2.99 persons per family, with married-couple families (1,555 | 50.5%) accounting for the largest median family size of 3.14 persons per family. On the other hand, single male/father families (354 | 11.5%) represent the smallest median family size with 2.32 persons per family.
| Family Type | # Families | Family Size |
| Married-Couple | 1,555 (50.5%) | 3.14 |
| Single Male/Father | 354 (11.5%) | 2.32 |
| Single Female/Mother | 1,172 (38.0%) | 2.99 |
| Total Families | 3,081 (100.0%) | 2.99 |
Median Household Size in Moberly
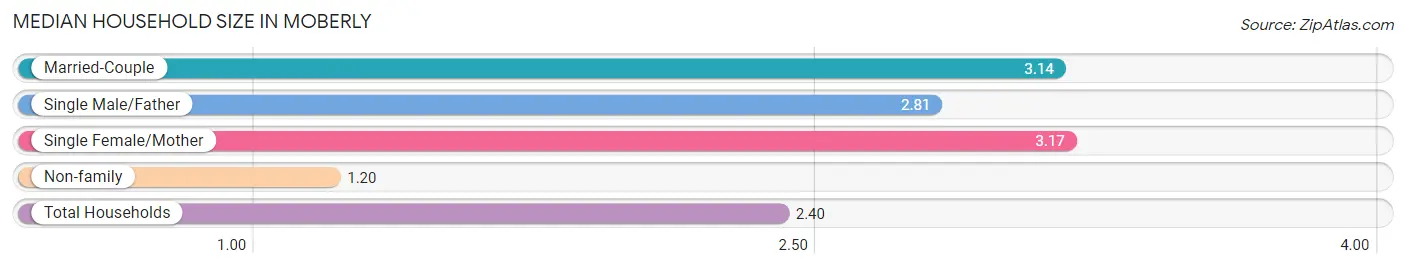
The median household size in Moberly is 2.40 persons per household, with single female/mother households (1,172 | 23.7%) accounting for the largest median household size of 3.17 persons per household. non-family households (1,854 | 37.6%) represent the smallest median household size with 1.20 persons per household.
| Household Type | # Households | Household Size |
| Married-Couple | 1,555 (31.5%) | 3.14 |
| Single Male/Father | 354 (7.2%) | 2.81 |
| Single Female/Mother | 1,172 (23.7%) | 3.17 |
| Non-family | 1,854 (37.6%) | 1.20 |
| Total Households | 4,935 (100.0%) | 2.40 |
Household Size by Marriage Status in Moberly
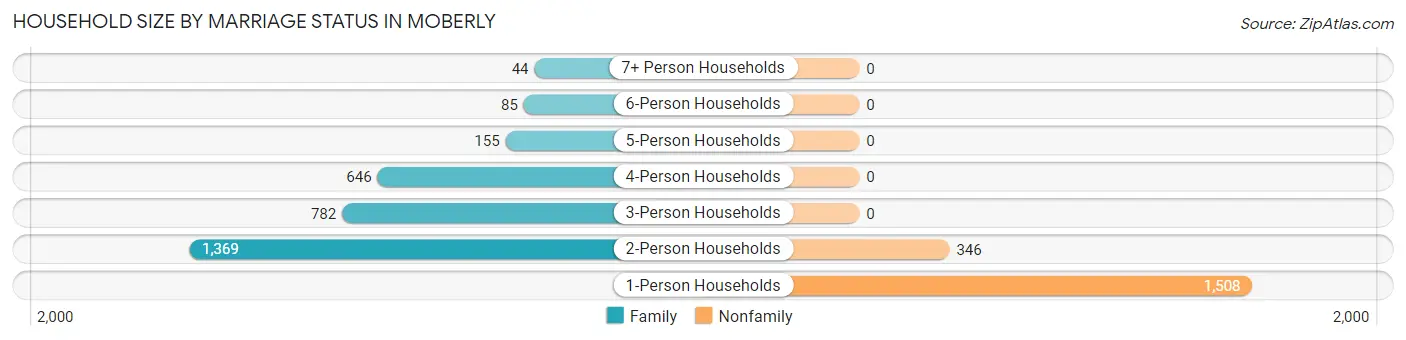
Out of a total of 4,935 households in Moberly, 3,081 (62.4%) are family households, while 1,854 (37.6%) are nonfamily households. The most numerous type of family households are 2-person households, comprising 1,369, and the most common type of nonfamily households are 1-person households, comprising 1,508.
| Household Size | Family Households | Nonfamily Households |
| 1-Person Households | - | 1,508 (30.6%) |
| 2-Person Households | 1,369 (27.7%) | 346 (7.0%) |
| 3-Person Households | 782 (15.9%) | 0 (0.0%) |
| 4-Person Households | 646 (13.1%) | 0 (0.0%) |
| 5-Person Households | 155 (3.1%) | 0 (0.0%) |
| 6-Person Households | 85 (1.7%) | 0 (0.0%) |
| 7+ Person Households | 44 (0.9%) | 0 (0.0%) |
| Total | 3,081 (62.4%) | 1,854 (37.6%) |
Female Fertility in Moberly
Fertility by Age in Moberly
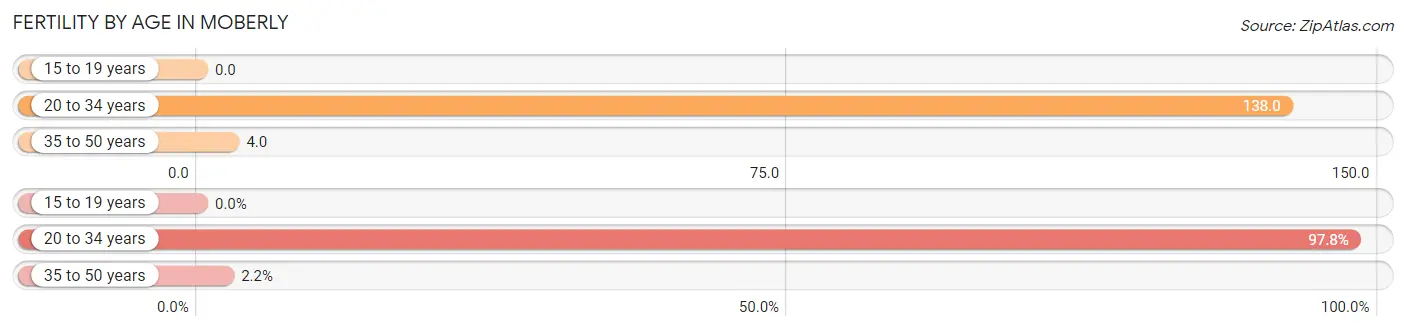
Average fertility rate in Moberly is 65.0 births per 1,000 women. Women in the age bracket of 20 to 34 years have the highest fertility rate with 138.0 births per 1,000 women. Women in the age bracket of 20 to 34 years acount for 97.8% of all women with births.
| Age Bracket | Women with Births | Births / 1,000 Women |
| 15 to 19 years | 0 (0.0%) | 0.0 |
| 20 to 34 years | 176 (97.8%) | 138.0 |
| 35 to 50 years | 4 (2.2%) | 4.0 |
| Total | 180 (100.0%) | 65.0 |
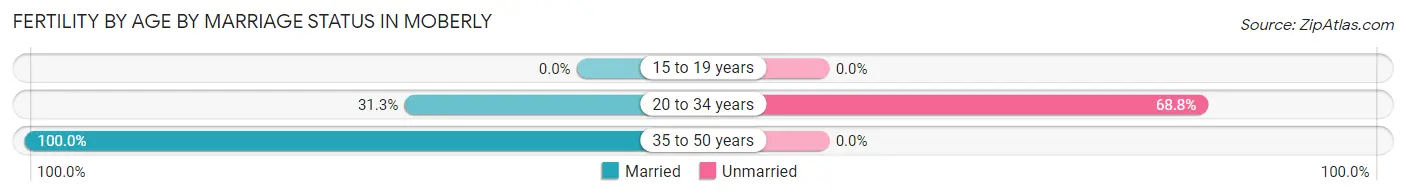
Fertility by Age by Marriage Status in Moberly
32.8% of women with births (180) in Moberly are married. The highest percentage of unmarried women with births falls into 20 to 34 years age bracket with 68.8% of them unmarried at the time of birth, while the lowest percentage of unmarried women with births belong to 35 to 50 years age bracket with 0.0% of them unmarried.
| Age Bracket | Married | Unmarried |
| 15 to 19 years | 0 (0.0%) | 0 (0.0%) |
| 20 to 34 years | 55 (31.2%) | 121 (68.8%) |
| 35 to 50 years | 4 (100.0%) | 0 (0.0%) |
| Total | 59 (32.8%) | 121 (67.2%) |
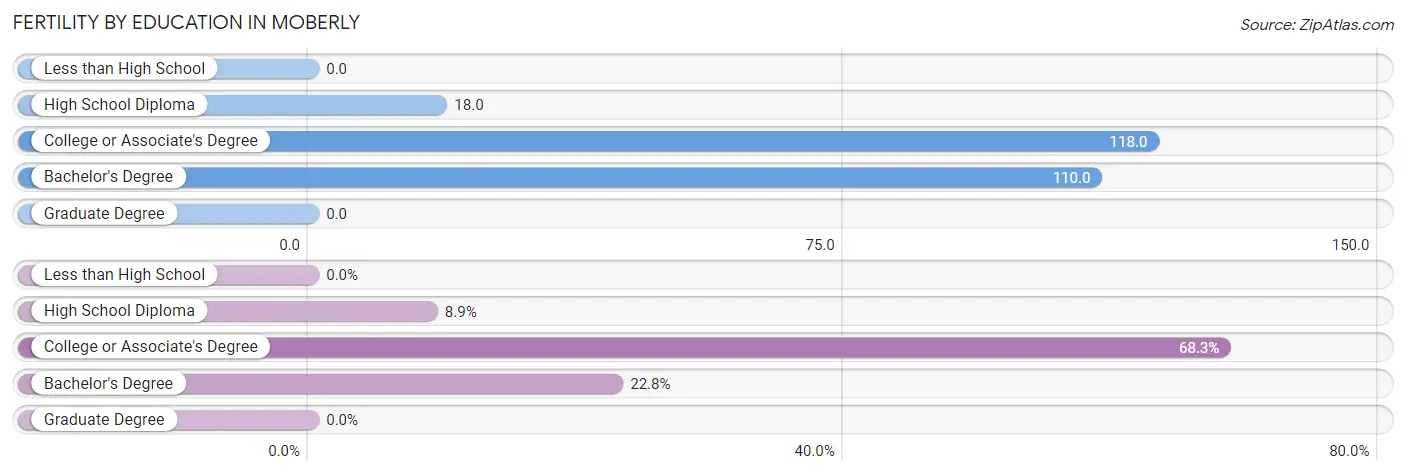
Fertility by Education in Moberly
| Educational Attainment | Women with Births | Births / 1,000 Women |
| Less than High School | 0 (0.0%) | 0.0 |
| High School Diploma | 16 (8.9%) | 18.0 |
| College or Associate's Degree | 123 (68.3%) | 118.0 |
| Bachelor's Degree | 41 (22.8%) | 110.0 |
| Graduate Degree | 0 (0.0%) | 0.0 |
| Total | 180 (100.0%) | 65.0 |
Fertility by Education by Marriage Status in Moberly
67.2% of women with births in Moberly are unmarried. Women with the educational attainment of high school diploma are most likely to be married with 100.0% of them married at childbirth, while women with the educational attainment of college or associate's degree are least likely to be married with 86.2% of them unmarried at childbirth.
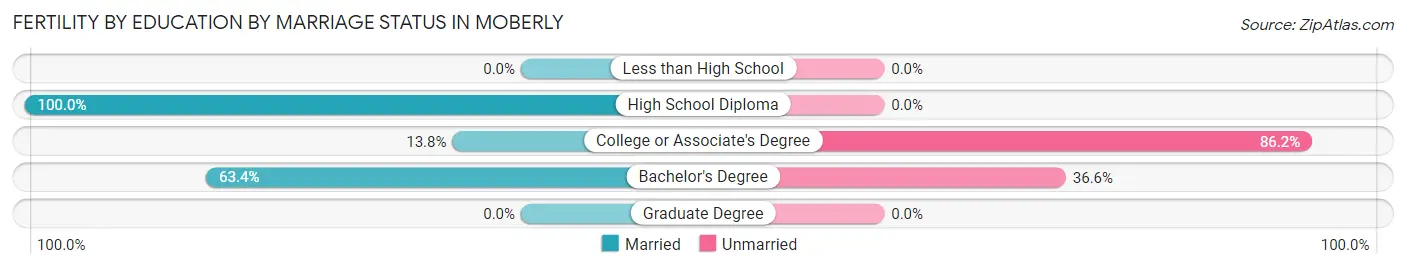
| Educational Attainment | Married | Unmarried |
| Less than High School | 0 (0.0%) | 0 (0.0%) |
| High School Diploma | 16 (100.0%) | 0 (0.0%) |
| College or Associate's Degree | 17 (13.8%) | 106 (86.2%) |
| Bachelor's Degree | 26 (63.4%) | 15 (36.6%) |
| Graduate Degree | 0 (0.0%) | 0 (0.0%) |
| Total | 59 (32.8%) | 121 (67.2%) |
Employment Characteristics in Moberly
Employment by Class of Employer in Moberly
Among the 5,304 employed individuals in Moberly, private company employees (3,473 | 65.5%), not-for-profit organizations (555 | 10.5%), and local government employees (456 | 8.6%) make up the most common classes of employment.
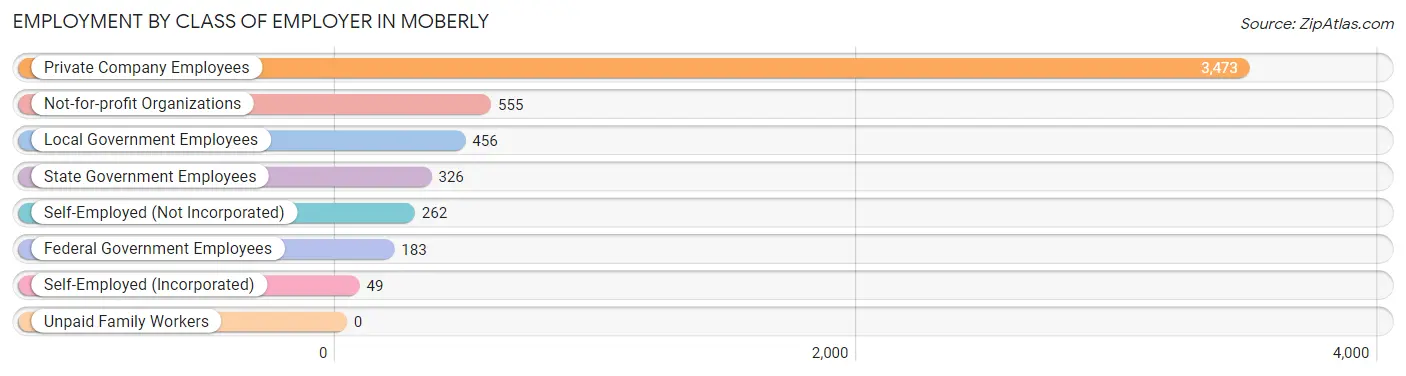
| Employer Class | # Employees | % Employees |
| Private Company Employees | 3,473 | 65.5% |
| Self-Employed (Incorporated) | 49 | 0.9% |
| Self-Employed (Not Incorporated) | 262 | 4.9% |
| Not-for-profit Organizations | 555 | 10.5% |
| Local Government Employees | 456 | 8.6% |
| State Government Employees | 326 | 6.1% |
| Federal Government Employees | 183 | 3.5% |
| Unpaid Family Workers | 0 | 0.0% |
| Total | 5,304 | 100.0% |
Employment Status by Age in Moberly
According to the labor force statistics for Moberly, out of the total population over 16 years of age (10,978), 52.4% or 5,752 individuals are in the labor force, with 7.5% or 431 of them unemployed. The age group with the highest labor force participation rate is 20 to 24 years, with 86.2% or 739 individuals in the labor force. Within the labor force, the 35 to 44 years age range has the highest percentage of unemployed individuals, with 14.5% or 185 of them being unemployed.
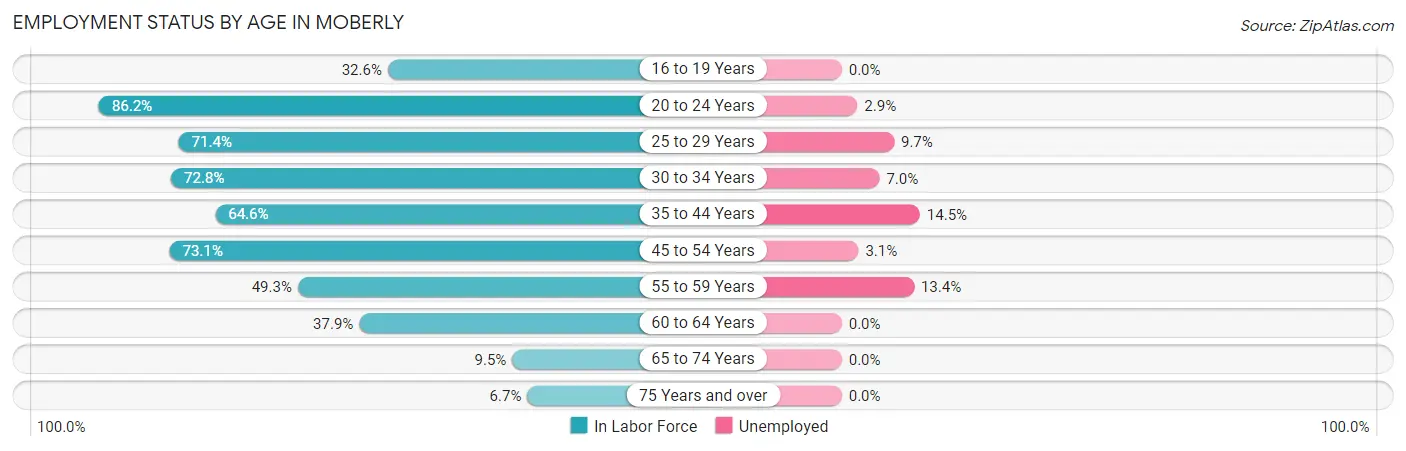
| Age Bracket | In Labor Force | Unemployed |
| 16 to 19 Years | 184 (32.6%) | 0 (0.0%) |
| 20 to 24 Years | 739 (86.2%) | 21 (2.9%) |
| 25 to 29 Years | 873 (71.4%) | 85 (9.7%) |
| 30 to 34 Years | 726 (72.8%) | 51 (7.0%) |
| 35 to 44 Years | 1,277 (64.6%) | 185 (14.5%) |
| 45 to 54 Years | 976 (73.1%) | 30 (3.1%) |
| 55 to 59 Years | 434 (49.3%) | 58 (13.4%) |
| 60 to 64 Years | 366 (37.9%) | 0 (0.0%) |
| 65 to 74 Years | 111 (9.5%) | 0 (0.0%) |
| 75 Years and over | 68 (6.7%) | 0 (0.0%) |
| Total | 5,752 (52.4%) | 431 (7.5%) |
Employment Status by Educational Attainment in Moberly
According to labor force statistics for Moberly, 63.0% of individuals (4,648) out of the total population between 25 and 64 years of age (7,378) are in the labor force, with 8.8% or 409 of them being unemployed. The group with the highest labor force participation rate are those with the educational attainment of bachelor's degree or higher, with 89.4% or 1,033 individuals in the labor force. Within the labor force, individuals with college / associate degree education have the highest percentage of unemployment, with 12.2% or 199 of them being unemployed.
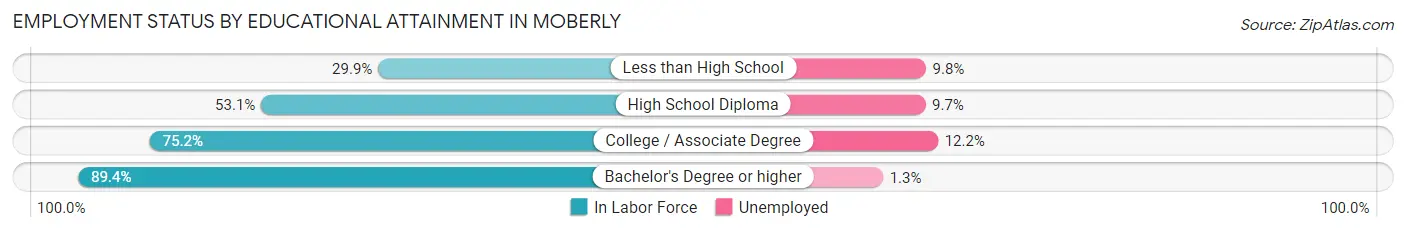
| Educational Attainment | In Labor Force | Unemployed |
| Less than High School | 214 (29.9%) | 70 (9.8%) |
| High School Diploma | 1,774 (53.1%) | 324 (9.7%) |
| College / Associate Degree | 1,629 (75.2%) | 264 (12.2%) |
| Bachelor's Degree or higher | 1,033 (89.4%) | 15 (1.3%) |
| Total | 4,648 (63.0%) | 649 (8.8%) |
Employment Occupations by Sex in Moberly
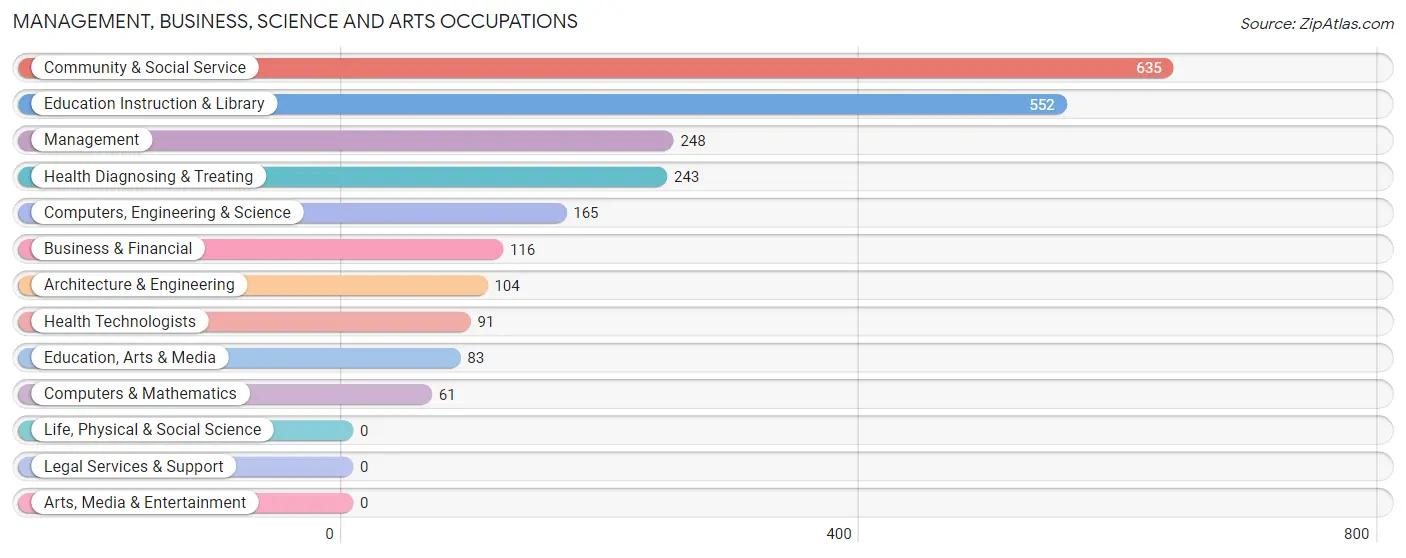
Management, Business, Science and Arts Occupations
The most common Management, Business, Science and Arts occupations in Moberly are Community & Social Service (635 | 12.0%), Education Instruction & Library (552 | 10.5%), Management (248 | 4.7%), Health Diagnosing & Treating (243 | 4.6%), and Computers, Engineering & Science (165 | 3.1%).
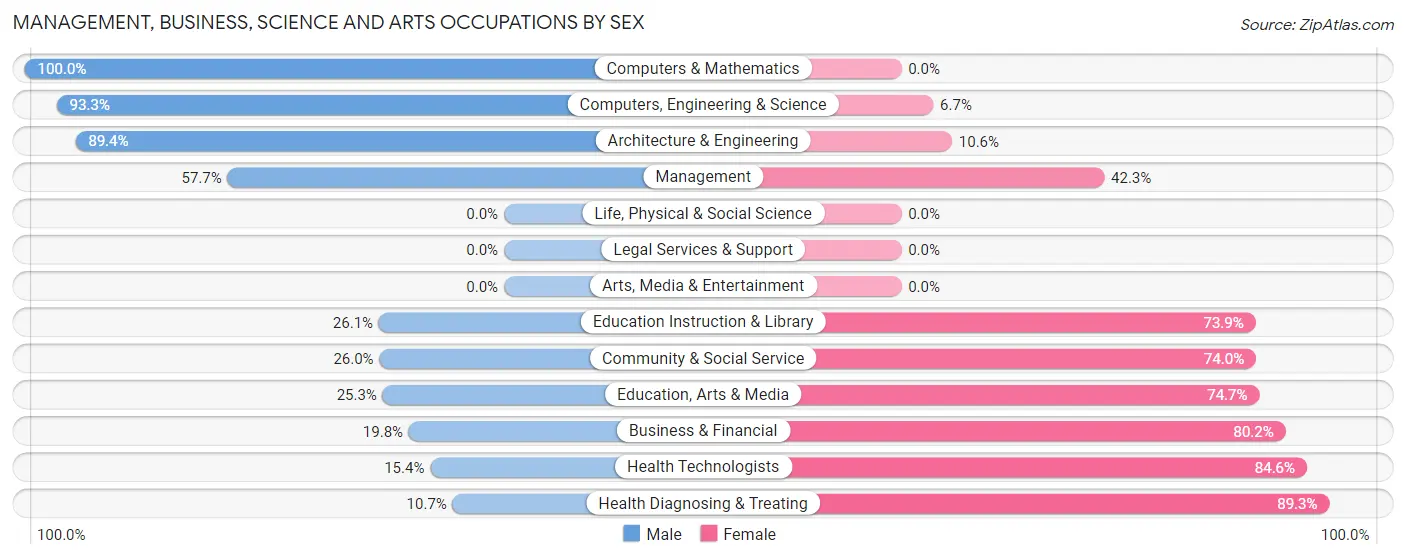
Management, Business, Science and Arts Occupations by Sex
Within the Management, Business, Science and Arts occupations in Moberly, the most male-oriented occupations are Computers & Mathematics (100.0%), Computers, Engineering & Science (93.3%), and Architecture & Engineering (89.4%), while the most female-oriented occupations are Health Diagnosing & Treating (89.3%), Health Technologists (84.6%), and Business & Financial (80.2%).
| Occupation | Male | Female |
| Management | 143 (57.7%) | 105 (42.3%) |
| Business & Financial | 23 (19.8%) | 93 (80.2%) |
| Computers, Engineering & Science | 154 (93.3%) | 11 (6.7%) |
| Computers & Mathematics | 61 (100.0%) | 0 (0.0%) |
| Architecture & Engineering | 93 (89.4%) | 11 (10.6%) |
| Life, Physical & Social Science | 0 (0.0%) | 0 (0.0%) |
| Community & Social Service | 165 (26.0%) | 470 (74.0%) |
| Education, Arts & Media | 21 (25.3%) | 62 (74.7%) |
| Legal Services & Support | 0 (0.0%) | 0 (0.0%) |
| Education Instruction & Library | 144 (26.1%) | 408 (73.9%) |
| Arts, Media & Entertainment | 0 (0.0%) | 0 (0.0%) |
| Health Diagnosing & Treating | 26 (10.7%) | 217 (89.3%) |
| Health Technologists | 14 (15.4%) | 77 (84.6%) |
| Total (Category) | 511 (36.3%) | 896 (63.7%) |
| Total (Overall) | 2,439 (46.2%) | 2,839 (53.8%) |
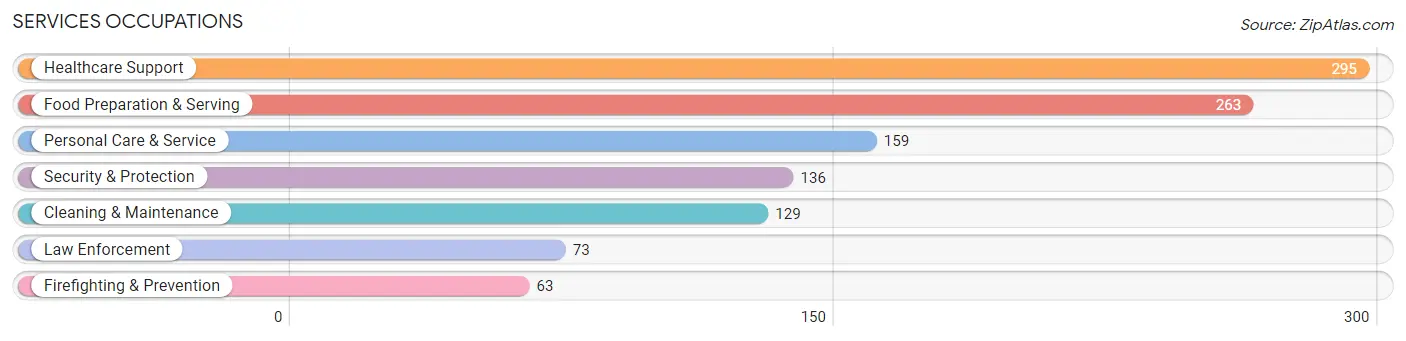
Services Occupations
The most common Services occupations in Moberly are Healthcare Support (295 | 5.6%), Food Preparation & Serving (263 | 5.0%), Personal Care & Service (159 | 3.0%), Security & Protection (136 | 2.6%), and Cleaning & Maintenance (129 | 2.4%).
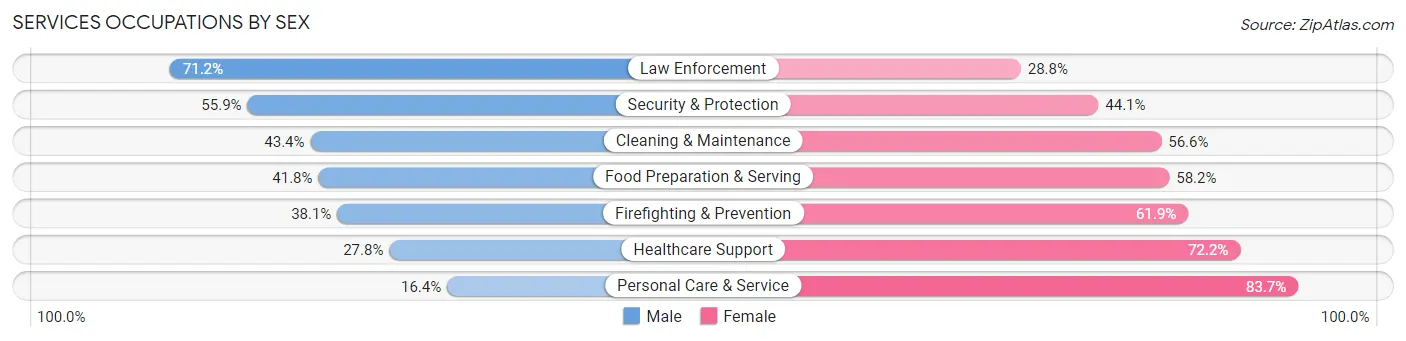
Services Occupations by Sex
Within the Services occupations in Moberly, the most male-oriented occupations are Law Enforcement (71.2%), Security & Protection (55.9%), and Cleaning & Maintenance (43.4%), while the most female-oriented occupations are Personal Care & Service (83.7%), Healthcare Support (72.2%), and Firefighting & Prevention (61.9%).
| Occupation | Male | Female |
| Healthcare Support | 82 (27.8%) | 213 (72.2%) |
| Security & Protection | 76 (55.9%) | 60 (44.1%) |
| Firefighting & Prevention | 24 (38.1%) | 39 (61.9%) |
| Law Enforcement | 52 (71.2%) | 21 (28.8%) |
| Food Preparation & Serving | 110 (41.8%) | 153 (58.2%) |
| Cleaning & Maintenance | 56 (43.4%) | 73 (56.6%) |
| Personal Care & Service | 26 (16.4%) | 133 (83.7%) |
| Total (Category) | 350 (35.6%) | 632 (64.4%) |
| Total (Overall) | 2,439 (46.2%) | 2,839 (53.8%) |
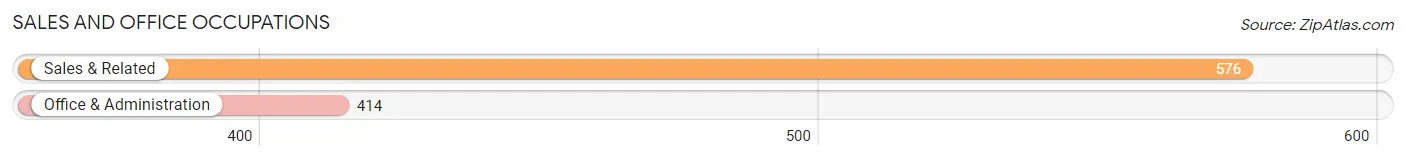
Sales and Office Occupations
The most common Sales and Office occupations in Moberly are Sales & Related (576 | 10.9%), and Office & Administration (414 | 7.8%).
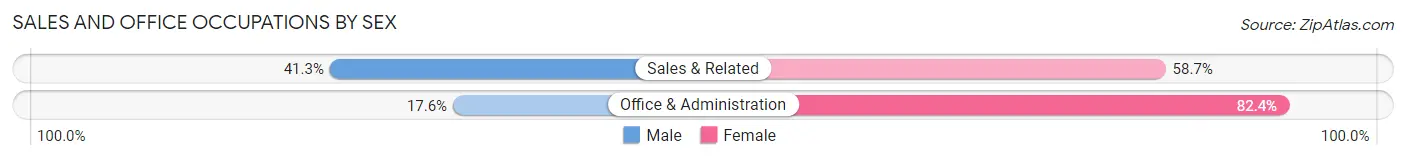
Sales and Office Occupations by Sex
| Occupation | Male | Female |
| Sales & Related | 238 (41.3%) | 338 (58.7%) |
| Office & Administration | 73 (17.6%) | 341 (82.4%) |
| Total (Category) | 311 (31.4%) | 679 (68.6%) |
| Total (Overall) | 2,439 (46.2%) | 2,839 (53.8%) |
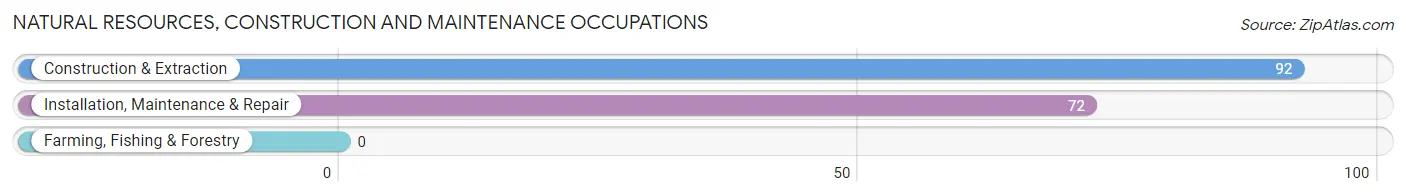
Natural Resources, Construction and Maintenance Occupations
The most common Natural Resources, Construction and Maintenance occupations in Moberly are Construction & Extraction (92 | 1.7%), and Installation, Maintenance & Repair (72 | 1.4%).
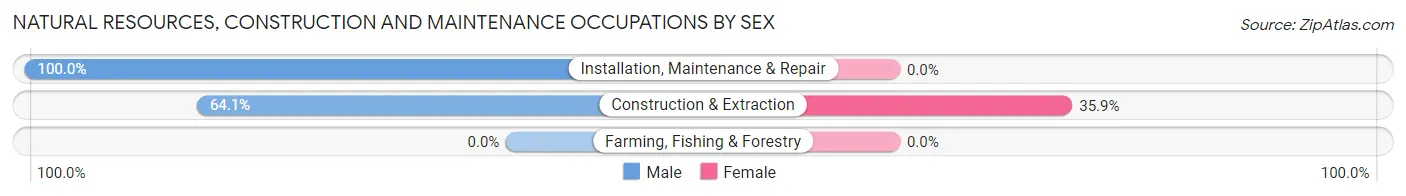
Natural Resources, Construction and Maintenance Occupations by Sex
| Occupation | Male | Female |
| Farming, Fishing & Forestry | 0 (0.0%) | 0 (0.0%) |
| Construction & Extraction | 59 (64.1%) | 33 (35.9%) |
| Installation, Maintenance & Repair | 72 (100.0%) | 0 (0.0%) |
| Total (Category) | 131 (79.9%) | 33 (20.1%) |
| Total (Overall) | 2,439 (46.2%) | 2,839 (53.8%) |
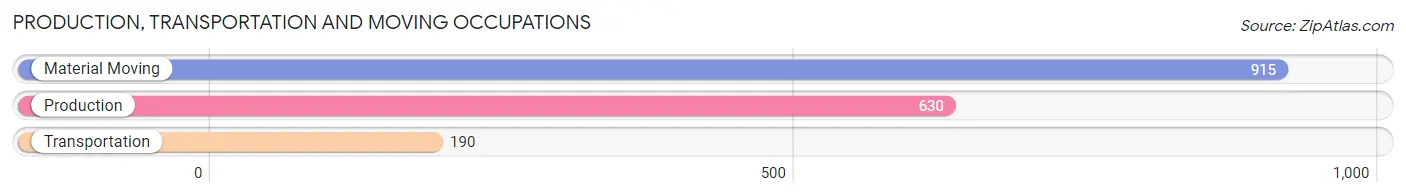
Production, Transportation and Moving Occupations
The most common Production, Transportation and Moving occupations in Moberly are Material Moving (915 | 17.3%), Production (630 | 11.9%), and Transportation (190 | 3.6%).
Production, Transportation and Moving Occupations by Sex
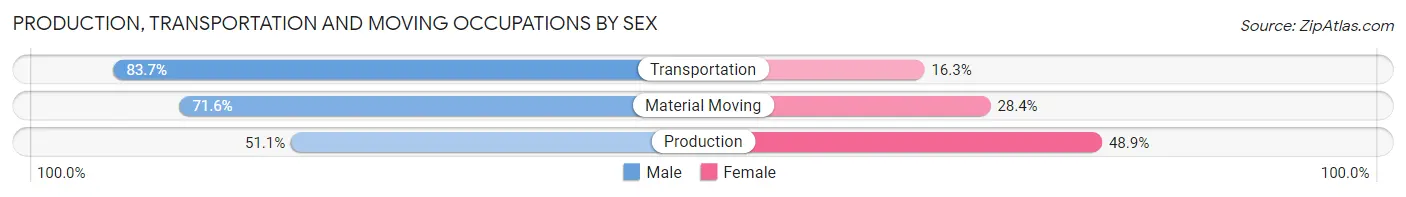
| Occupation | Male | Female |
| Production | 322 (51.1%) | 308 (48.9%) |
| Transportation | 159 (83.7%) | 31 (16.3%) |
| Material Moving | 655 (71.6%) | 260 (28.4%) |
| Total (Category) | 1,136 (65.5%) | 599 (34.5%) |
| Total (Overall) | 2,439 (46.2%) | 2,839 (53.8%) |
Employment Industries by Sex in Moberly
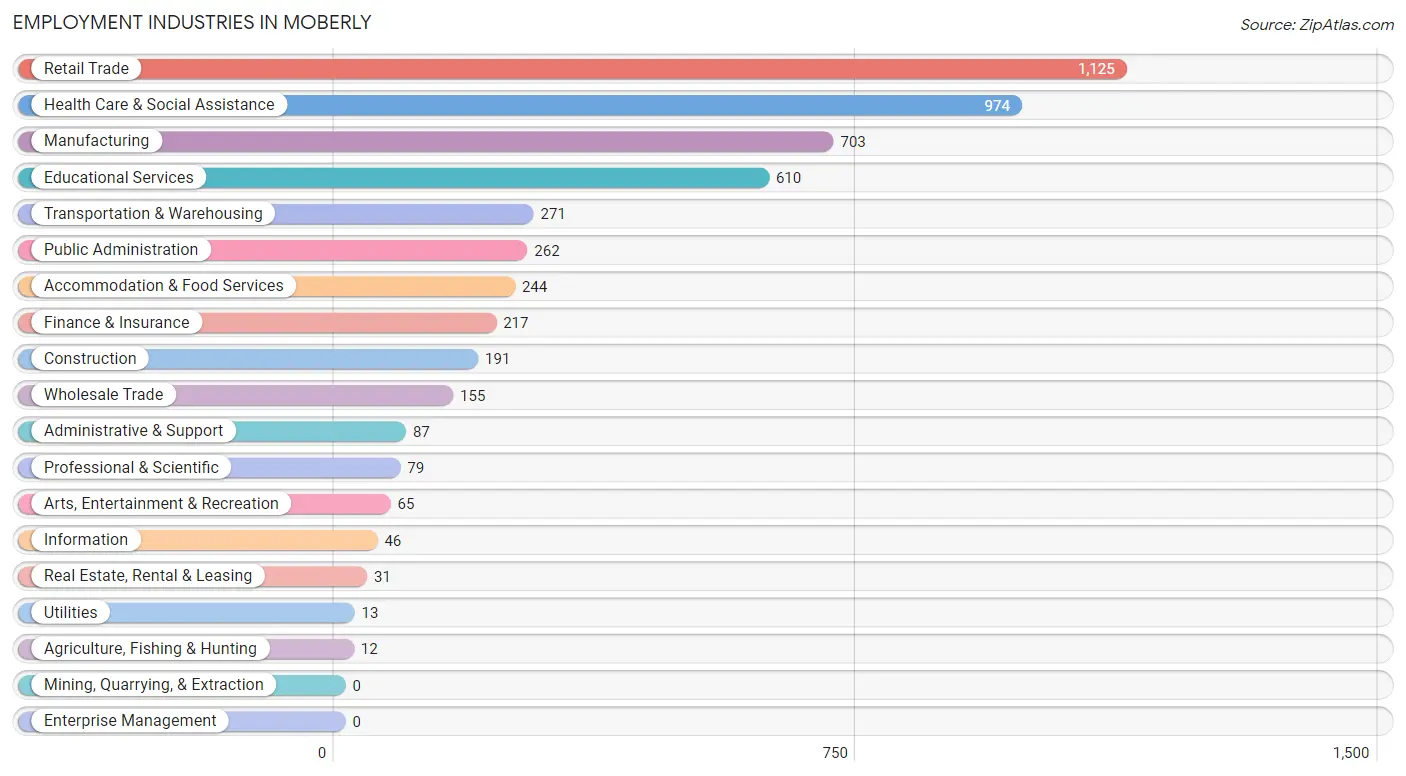
Employment Industries in Moberly
The major employment industries in Moberly include Retail Trade (1,125 | 21.3%), Health Care & Social Assistance (974 | 18.4%), Manufacturing (703 | 13.3%), Educational Services (610 | 11.6%), and Transportation & Warehousing (271 | 5.1%).
Employment Industries by Sex in Moberly
The Moberly industries that see more men than women are Agriculture, Fishing & Hunting (100.0%), Utilities (100.0%), and Arts, Entertainment & Recreation (100.0%), whereas the industries that tend to have a higher number of women are Real Estate, Rental & Leasing (100.0%), Health Care & Social Assistance (81.9%), and Finance & Insurance (77.4%).
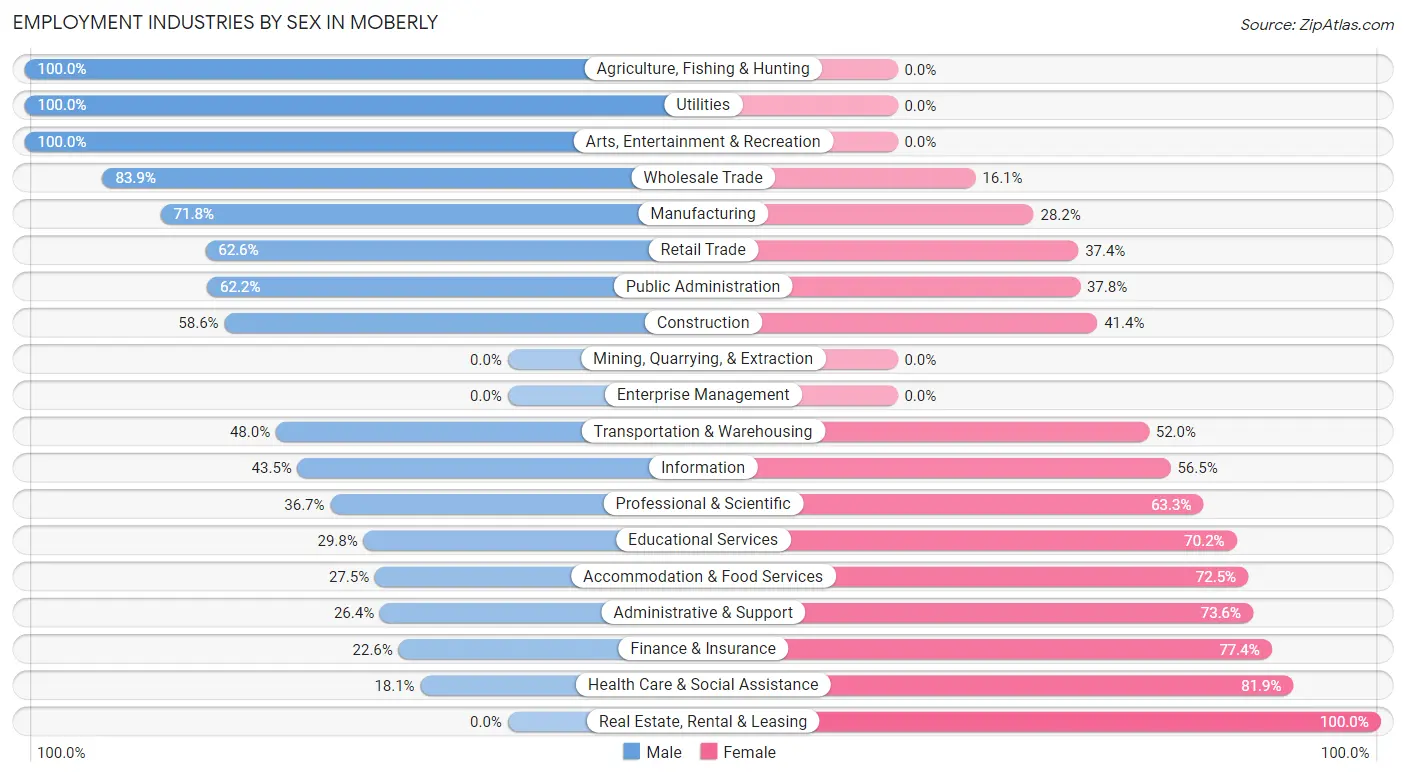
| Industry | Male | Female |
| Agriculture, Fishing & Hunting | 12 (100.0%) | 0 (0.0%) |
| Mining, Quarrying, & Extraction | 0 (0.0%) | 0 (0.0%) |
| Construction | 112 (58.6%) | 79 (41.4%) |
| Manufacturing | 505 (71.8%) | 198 (28.2%) |
| Wholesale Trade | 130 (83.9%) | 25 (16.1%) |
| Retail Trade | 704 (62.6%) | 421 (37.4%) |
| Transportation & Warehousing | 130 (48.0%) | 141 (52.0%) |
| Utilities | 13 (100.0%) | 0 (0.0%) |
| Information | 20 (43.5%) | 26 (56.5%) |
| Finance & Insurance | 49 (22.6%) | 168 (77.4%) |
| Real Estate, Rental & Leasing | 0 (0.0%) | 31 (100.0%) |
| Professional & Scientific | 29 (36.7%) | 50 (63.3%) |
| Enterprise Management | 0 (0.0%) | 0 (0.0%) |
| Administrative & Support | 23 (26.4%) | 64 (73.6%) |
| Educational Services | 182 (29.8%) | 428 (70.2%) |
| Health Care & Social Assistance | 176 (18.1%) | 798 (81.9%) |
| Arts, Entertainment & Recreation | 65 (100.0%) | 0 (0.0%) |
| Accommodation & Food Services | 67 (27.5%) | 177 (72.5%) |
| Public Administration | 163 (62.2%) | 99 (37.8%) |
| Total | 2,439 (46.2%) | 2,839 (53.8%) |
Education in Moberly
School Enrollment in Moberly
The most common levels of schooling among the 2,842 students in Moberly are elementary school (841 | 29.6%), middle school (618 | 21.7%), and high school (512 | 18.0%).
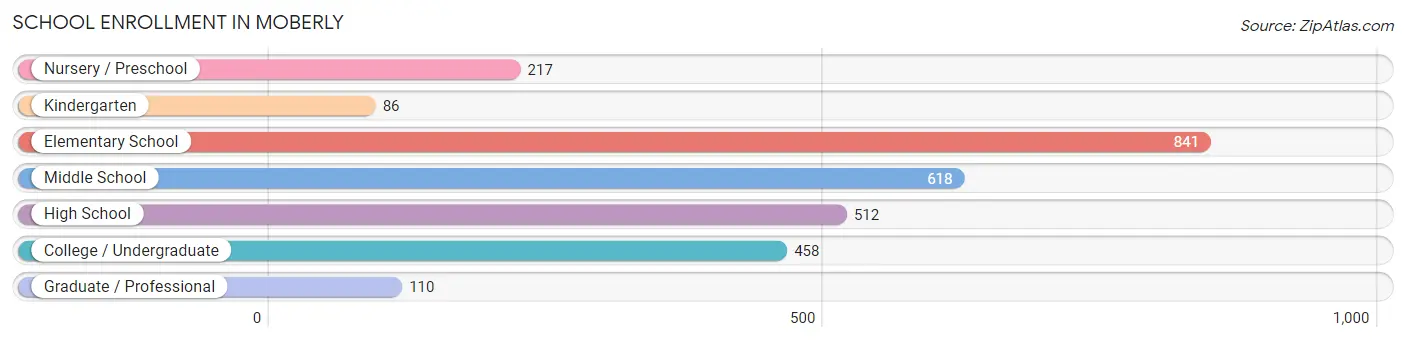
| School Level | # Students | % Students |
| Nursery / Preschool | 217 | 7.6% |
| Kindergarten | 86 | 3.0% |
| Elementary School | 841 | 29.6% |
| Middle School | 618 | 21.7% |
| High School | 512 | 18.0% |
| College / Undergraduate | 458 | 16.1% |
| Graduate / Professional | 110 | 3.9% |
| Total | 2,842 | 100.0% |
School Enrollment by Age by Funding Source in Moberly
Out of a total of 2,842 students who are enrolled in schools in Moberly, 409 (14.4%) attend a private institution, while the remaining 2,433 (85.6%) are enrolled in public schools. The age group of 35 years and over has the highest likelihood of being enrolled in private schools, with 26 (31.3% in the age bracket) enrolled. Conversely, the age group of 15 to 17 year olds has the lowest likelihood of being enrolled in a private school, with 335 (98.0% in the age bracket) attending a public institution.
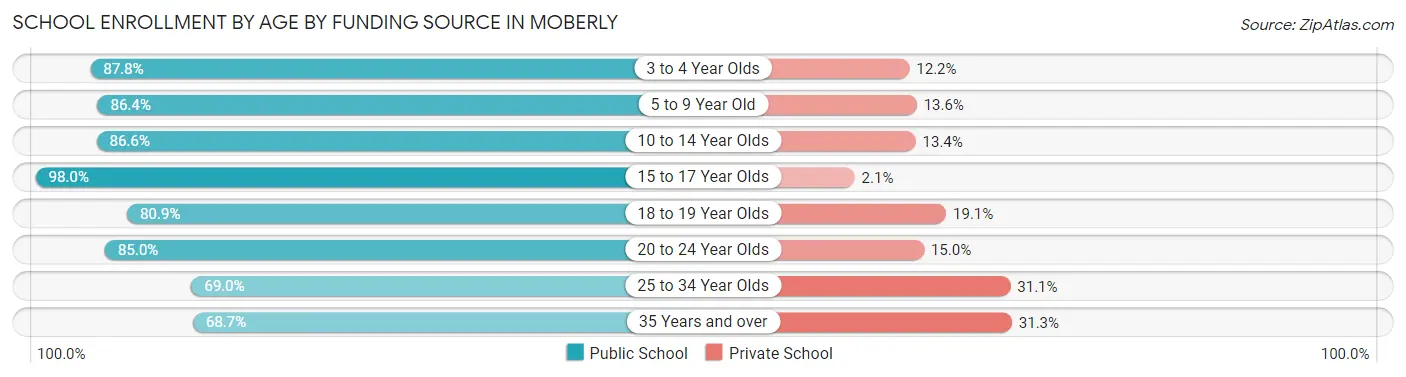
| Age Bracket | Public School | Private School |
| 3 to 4 Year Olds | 86 (87.8%) | 12 (12.2%) |
| 5 to 9 Year Old | 864 (86.4%) | 136 (13.6%) |
| 10 to 14 Year Olds | 601 (86.6%) | 93 (13.4%) |
| 15 to 17 Year Olds | 335 (98.0%) | 7 (2.1%) |
| 18 to 19 Year Olds | 123 (80.9%) | 29 (19.1%) |
| 20 to 24 Year Olds | 216 (85.0%) | 38 (15.0%) |
| 25 to 34 Year Olds | 151 (69.0%) | 68 (31.0%) |
| 35 Years and over | 57 (68.7%) | 26 (31.3%) |
| Total | 2,433 (85.6%) | 409 (14.4%) |
Educational Attainment by Field of Study in Moberly
Education (441 | 27.5%), business (426 | 26.5%), bio, nature & agricultural (153 | 9.5%), science & technology (107 | 6.7%), and arts & humanities (85 | 5.3%) are the most common fields of study among 1,606 individuals in Moberly who have obtained a bachelor's degree or higher.
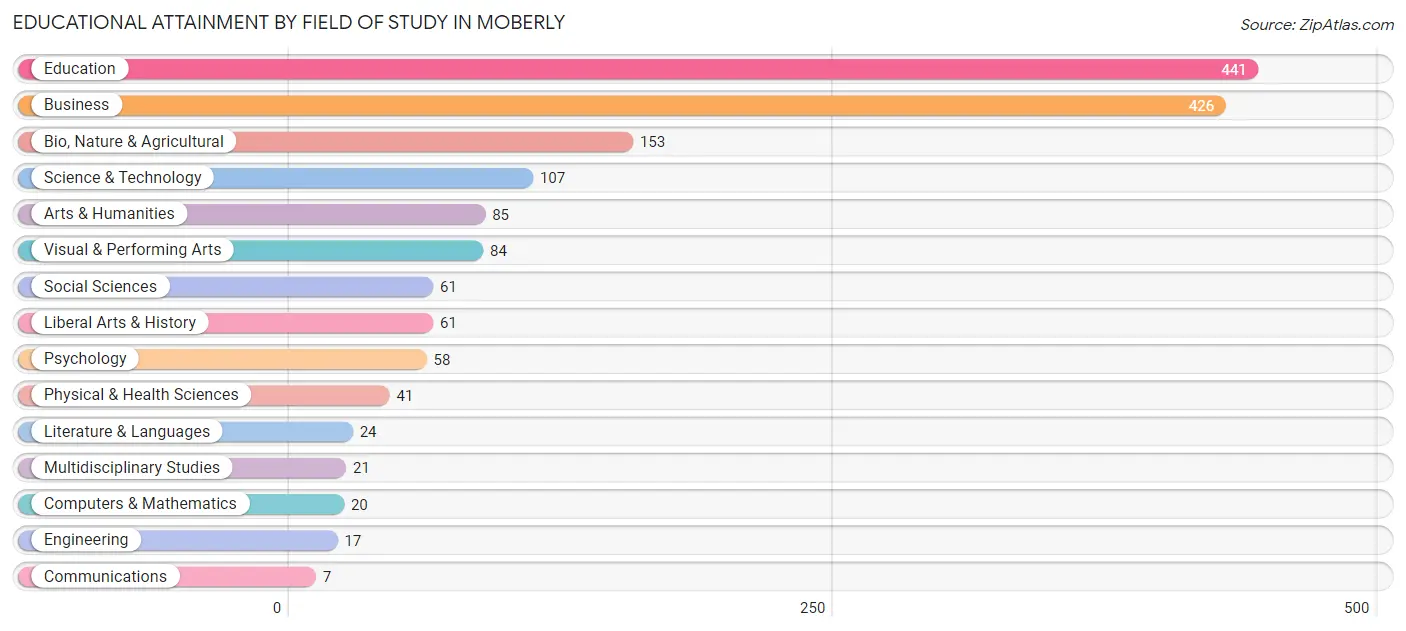
| Field of Study | # Graduates | % Graduates |
| Computers & Mathematics | 20 | 1.3% |
| Bio, Nature & Agricultural | 153 | 9.5% |
| Physical & Health Sciences | 41 | 2.5% |
| Psychology | 58 | 3.6% |
| Social Sciences | 61 | 3.8% |
| Engineering | 17 | 1.1% |
| Multidisciplinary Studies | 21 | 1.3% |
| Science & Technology | 107 | 6.7% |
| Business | 426 | 26.5% |
| Education | 441 | 27.5% |
| Literature & Languages | 24 | 1.5% |
| Liberal Arts & History | 61 | 3.8% |
| Visual & Performing Arts | 84 | 5.2% |
| Communications | 7 | 0.4% |
| Arts & Humanities | 85 | 5.3% |
| Total | 1,606 | 100.0% |
Transportation & Commute in Moberly
Vehicle Availability by Sex in Moberly
The most prevalent vehicle ownership categories in Moberly are males with 2 vehicles (1,186, accounting for 48.9%) and females with 2 vehicles (1,167, making up 42.1%).
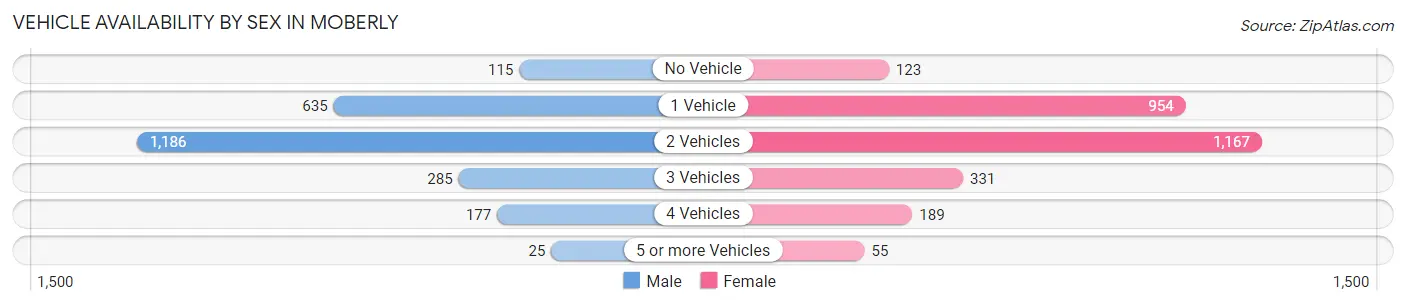
| Vehicles Available | Male | Female |
| No Vehicle | 115 (4.8%) | 123 (4.4%) |
| 1 Vehicle | 635 (26.2%) | 954 (33.8%) |
| 2 Vehicles | 1,186 (48.9%) | 1,167 (41.4%) |
| 3 Vehicles | 285 (11.8%) | 331 (11.7%) |
| 4 Vehicles | 177 (7.3%) | 189 (6.7%) |
| 5 or more Vehicles | 25 (1.0%) | 55 (1.9%) |
| Total | 2,423 (100.0%) | 2,819 (100.0%) |
Commute Time in Moberly
The most frequently occuring commute durations in Moberly are 10 to 14 minutes (1,510 commuters, 30.2%), 5 to 9 minutes (1,323 commuters, 26.5%), and 15 to 19 minutes (561 commuters, 11.2%).
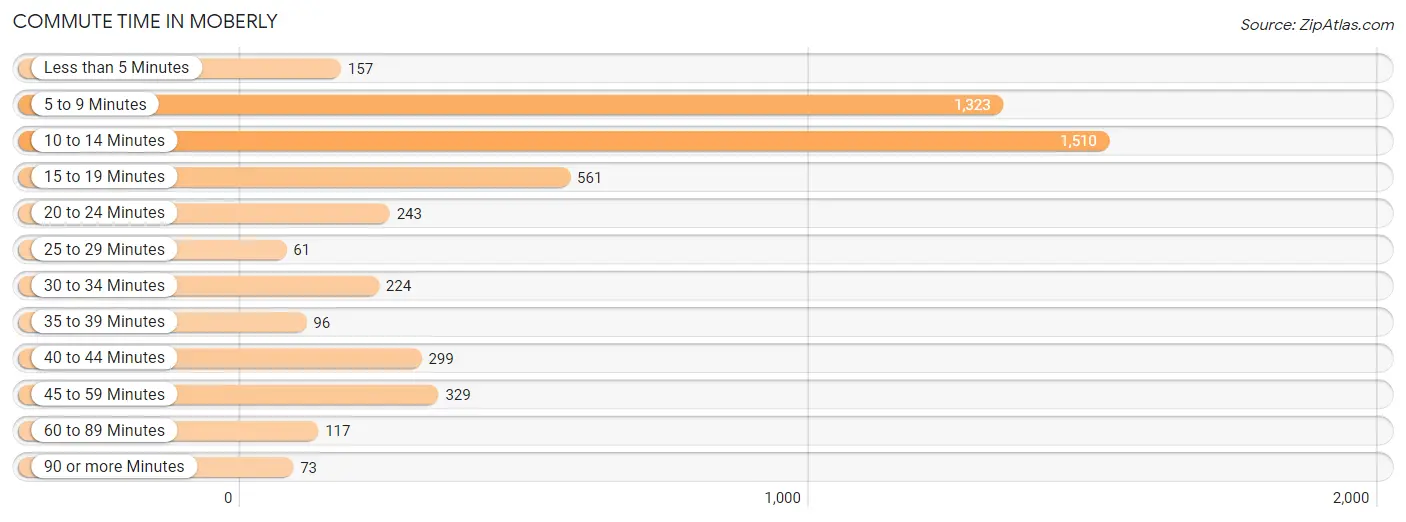
| Commute Time | # Commuters | % Commuters |
| Less than 5 Minutes | 157 | 3.1% |
| 5 to 9 Minutes | 1,323 | 26.5% |
| 10 to 14 Minutes | 1,510 | 30.2% |
| 15 to 19 Minutes | 561 | 11.2% |
| 20 to 24 Minutes | 243 | 4.9% |
| 25 to 29 Minutes | 61 | 1.2% |
| 30 to 34 Minutes | 224 | 4.5% |
| 35 to 39 Minutes | 96 | 1.9% |
| 40 to 44 Minutes | 299 | 6.0% |
| 45 to 59 Minutes | 329 | 6.6% |
| 60 to 89 Minutes | 117 | 2.3% |
| 90 or more Minutes | 73 | 1.5% |
Commute Time by Sex in Moberly
The most common commute times in Moberly are 10 to 14 minutes (745 commuters, 31.8%) for males and 10 to 14 minutes (765 commuters, 28.8%) for females.
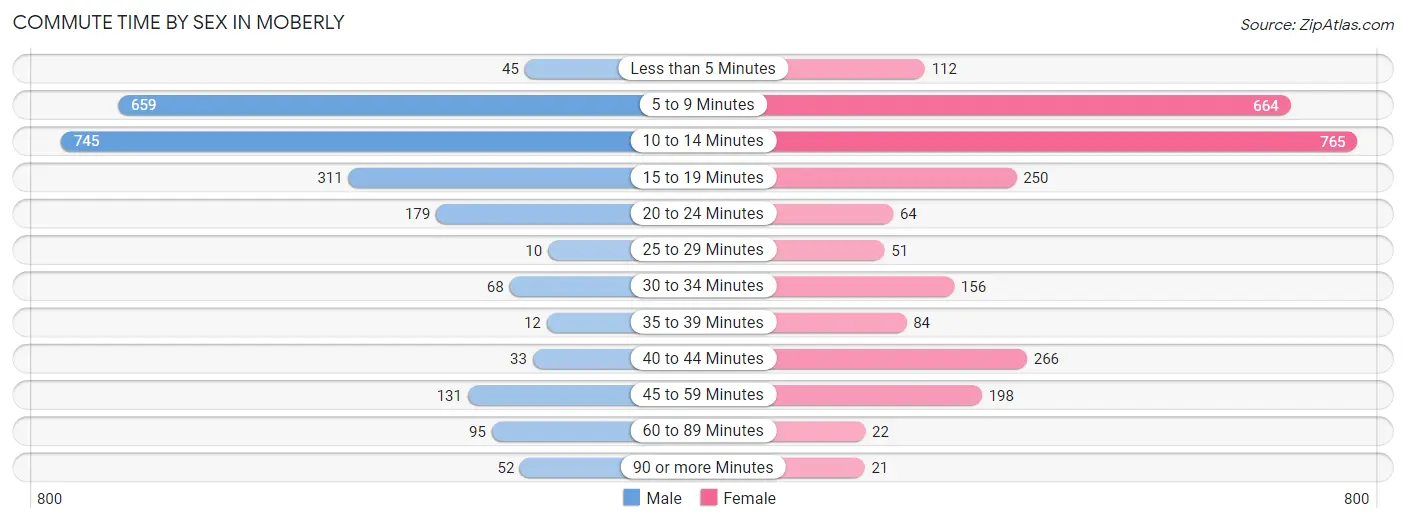
| Commute Time | Male | Female |
| Less than 5 Minutes | 45 (1.9%) | 112 (4.2%) |
| 5 to 9 Minutes | 659 (28.2%) | 664 (25.0%) |
| 10 to 14 Minutes | 745 (31.8%) | 765 (28.8%) |
| 15 to 19 Minutes | 311 (13.3%) | 250 (9.4%) |
| 20 to 24 Minutes | 179 (7.6%) | 64 (2.4%) |
| 25 to 29 Minutes | 10 (0.4%) | 51 (1.9%) |
| 30 to 34 Minutes | 68 (2.9%) | 156 (5.9%) |
| 35 to 39 Minutes | 12 (0.5%) | 84 (3.2%) |
| 40 to 44 Minutes | 33 (1.4%) | 266 (10.0%) |
| 45 to 59 Minutes | 131 (5.6%) | 198 (7.5%) |
| 60 to 89 Minutes | 95 (4.1%) | 22 (0.8%) |
| 90 or more Minutes | 52 (2.2%) | 21 (0.8%) |
Time of Departure to Work by Sex in Moberly
The most frequent times of departure to work in Moberly are 7:30 AM to 7:59 AM (418, 17.9%) for males and 7:00 AM to 7:29 AM (474, 17.9%) for females.
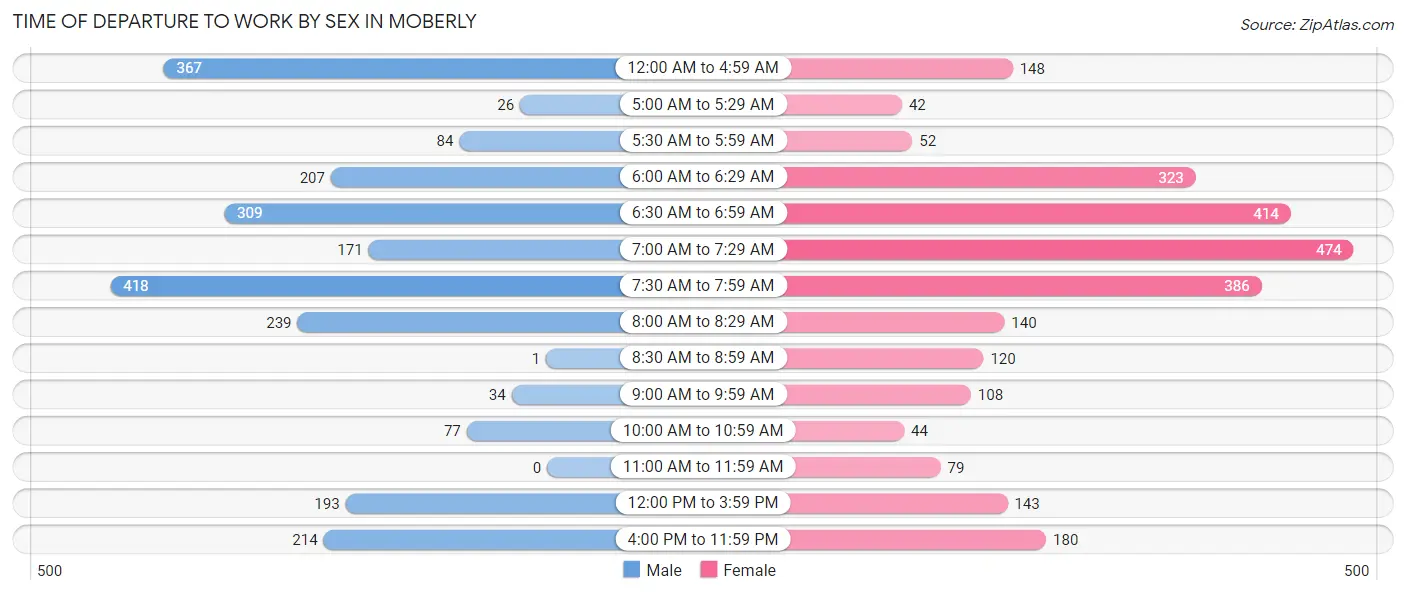
| Time of Departure | Male | Female |
| 12:00 AM to 4:59 AM | 367 (15.7%) | 148 (5.6%) |
| 5:00 AM to 5:29 AM | 26 (1.1%) | 42 (1.6%) |
| 5:30 AM to 5:59 AM | 84 (3.6%) | 52 (2.0%) |
| 6:00 AM to 6:29 AM | 207 (8.8%) | 323 (12.2%) |
| 6:30 AM to 6:59 AM | 309 (13.2%) | 414 (15.6%) |
| 7:00 AM to 7:29 AM | 171 (7.3%) | 474 (17.9%) |
| 7:30 AM to 7:59 AM | 418 (17.9%) | 386 (14.5%) |
| 8:00 AM to 8:29 AM | 239 (10.2%) | 140 (5.3%) |
| 8:30 AM to 8:59 AM | 1 (0.0%) | 120 (4.5%) |
| 9:00 AM to 9:59 AM | 34 (1.5%) | 108 (4.1%) |
| 10:00 AM to 10:59 AM | 77 (3.3%) | 44 (1.7%) |
| 11:00 AM to 11:59 AM | 0 (0.0%) | 79 (3.0%) |
| 12:00 PM to 3:59 PM | 193 (8.3%) | 143 (5.4%) |
| 4:00 PM to 11:59 PM | 214 (9.1%) | 180 (6.8%) |
| Total | 2,340 (100.0%) | 2,653 (100.0%) |
Housing Occupancy in Moberly
Occupancy by Ownership in Moberly
Of the total 4,935 dwellings in Moberly, owner-occupied units account for 2,616 (53.0%), while renter-occupied units make up 2,319 (47.0%).
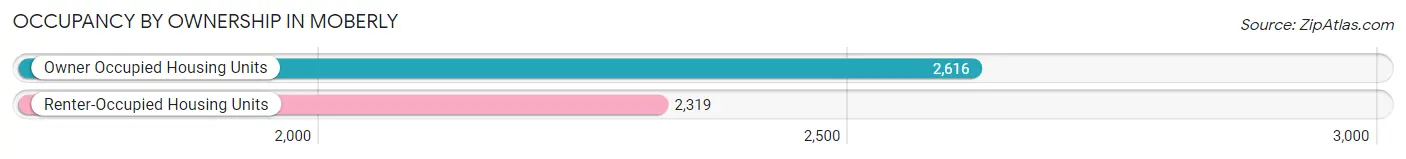
| Occupancy | # Housing Units | % Housing Units |
| Owner Occupied Housing Units | 2,616 | 53.0% |
| Renter-Occupied Housing Units | 2,319 | 47.0% |
| Total Occupied Housing Units | 4,935 | 100.0% |
Occupancy by Household Size in Moberly
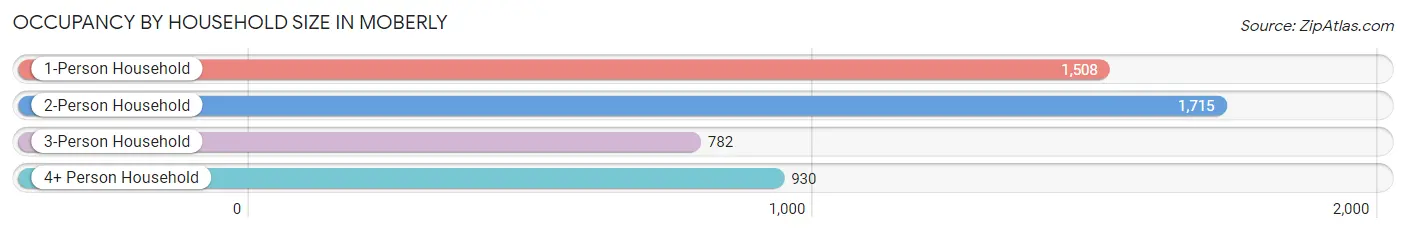
| Household Size | # Housing Units | % Housing Units |
| 1-Person Household | 1,508 | 30.6% |
| 2-Person Household | 1,715 | 34.7% |
| 3-Person Household | 782 | 15.9% |
| 4+ Person Household | 930 | 18.8% |
| Total Housing Units | 4,935 | 100.0% |
Occupancy by Ownership by Household Size in Moberly
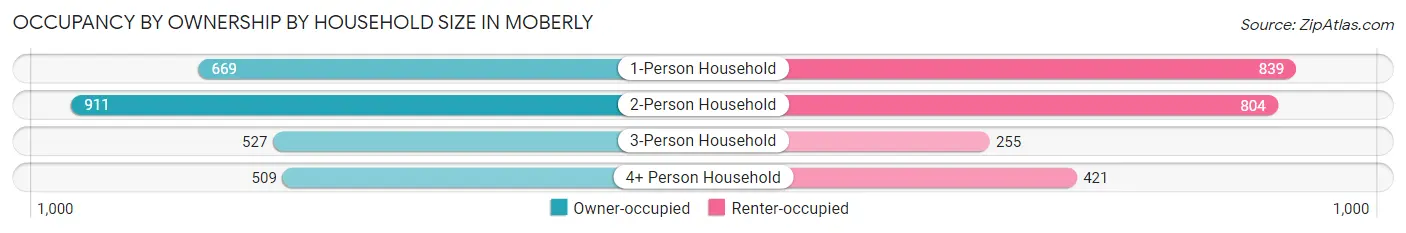
| Household Size | Owner-occupied | Renter-occupied |
| 1-Person Household | 669 (44.4%) | 839 (55.6%) |
| 2-Person Household | 911 (53.1%) | 804 (46.9%) |
| 3-Person Household | 527 (67.4%) | 255 (32.6%) |
| 4+ Person Household | 509 (54.7%) | 421 (45.3%) |
| Total Housing Units | 2,616 (53.0%) | 2,319 (47.0%) |
Occupancy by Educational Attainment in Moberly
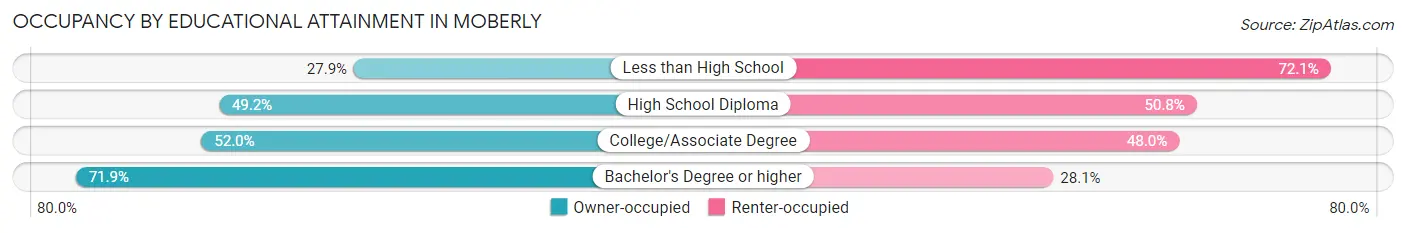
| Household Size | Owner-occupied | Renter-occupied |
| Less than High School | 112 (27.9%) | 289 (72.1%) |
| High School Diploma | 886 (49.2%) | 916 (50.8%) |
| College/Associate Degree | 902 (52.0%) | 834 (48.0%) |
| Bachelor's Degree or higher | 716 (71.9%) | 280 (28.1%) |
Occupancy by Age of Householder in Moberly
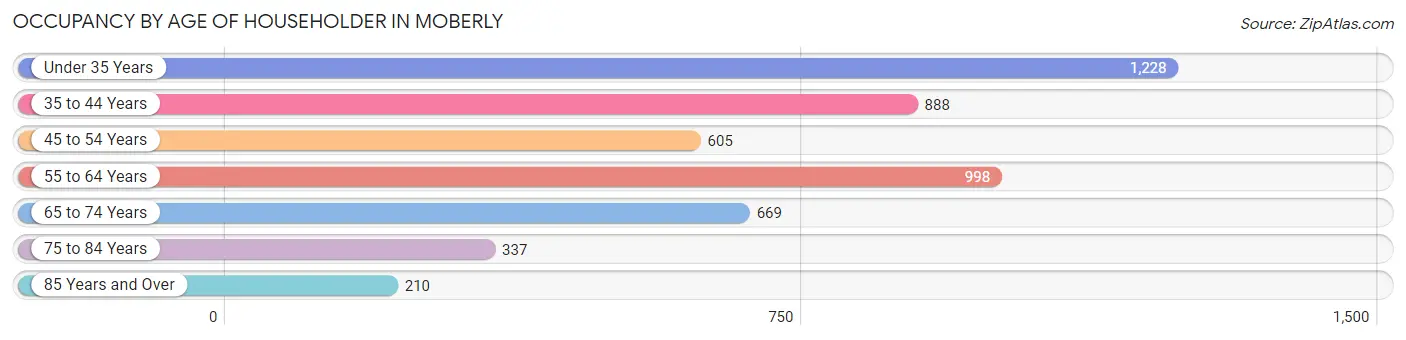
| Age Bracket | # Households | % Households |
| Under 35 Years | 1,228 | 24.9% |
| 35 to 44 Years | 888 | 18.0% |
| 45 to 54 Years | 605 | 12.3% |
| 55 to 64 Years | 998 | 20.2% |
| 65 to 74 Years | 669 | 13.6% |
| 75 to 84 Years | 337 | 6.8% |
| 85 Years and Over | 210 | 4.3% |
| Total | 4,935 | 100.0% |
Housing Finances in Moberly
Median Income by Occupancy in Moberly
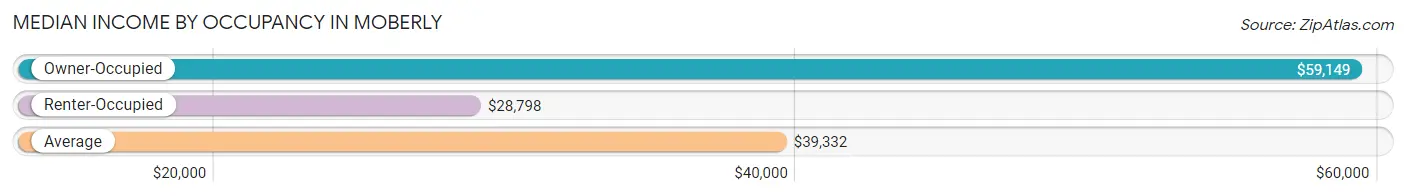
| Occupancy Type | # Households | Median Income |
| Owner-Occupied | 2,616 (53.0%) | $59,149 |
| Renter-Occupied | 2,319 (47.0%) | $28,798 |
| Average | 4,935 (100.0%) | $39,332 |
Occupancy by Householder Income Bracket in Moberly
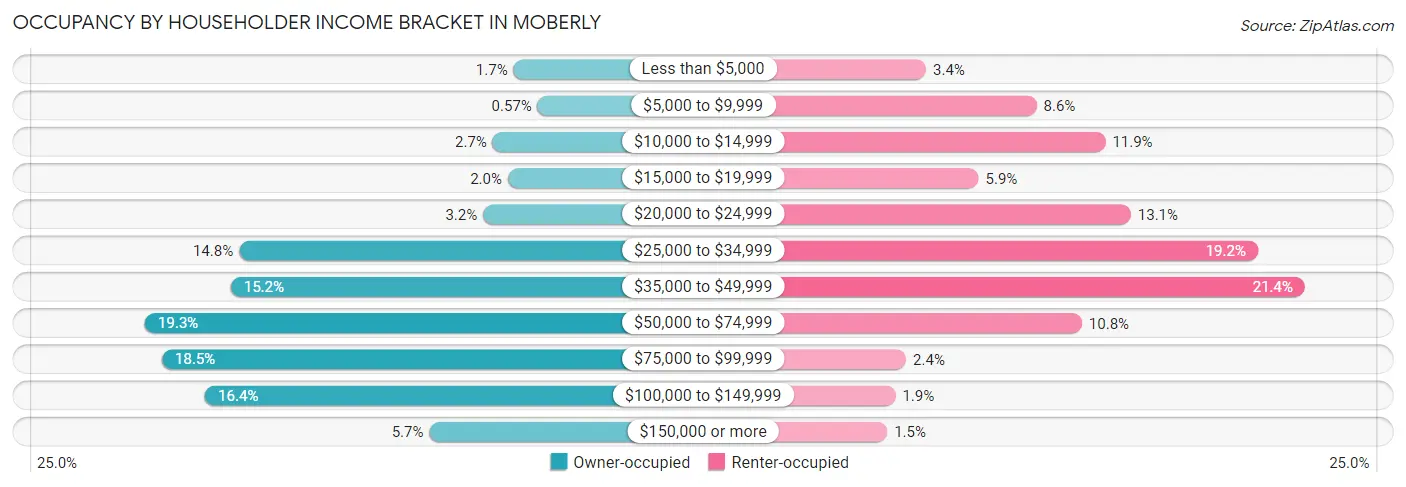
| Income Bracket | Owner-occupied | Renter-occupied |
| Less than $5,000 | 45 (1.7%) | 78 (3.4%) |
| $5,000 to $9,999 | 15 (0.6%) | 200 (8.6%) |
| $10,000 to $14,999 | 71 (2.7%) | 276 (11.9%) |
| $15,000 to $19,999 | 52 (2.0%) | 136 (5.9%) |
| $20,000 to $24,999 | 83 (3.2%) | 304 (13.1%) |
| $25,000 to $34,999 | 387 (14.8%) | 444 (19.2%) |
| $35,000 to $49,999 | 397 (15.2%) | 496 (21.4%) |
| $50,000 to $74,999 | 504 (19.3%) | 250 (10.8%) |
| $75,000 to $99,999 | 483 (18.5%) | 56 (2.4%) |
| $100,000 to $149,999 | 429 (16.4%) | 44 (1.9%) |
| $150,000 or more | 150 (5.7%) | 35 (1.5%) |
| Total | 2,616 (100.0%) | 2,319 (100.0%) |
Monthly Housing Cost Tiers in Moberly
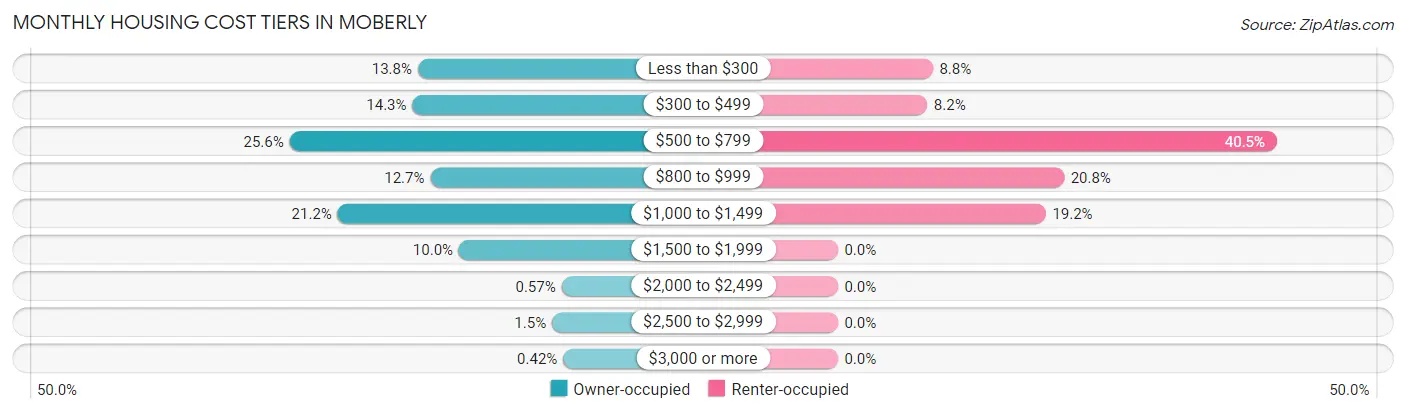
| Monthly Cost | Owner-occupied | Renter-occupied |
| Less than $300 | 361 (13.8%) | 203 (8.7%) |
| $300 to $499 | 374 (14.3%) | 191 (8.2%) |
| $500 to $799 | 670 (25.6%) | 938 (40.5%) |
| $800 to $999 | 331 (12.7%) | 483 (20.8%) |
| $1,000 to $1,499 | 554 (21.2%) | 444 (19.2%) |
| $1,500 to $1,999 | 262 (10.0%) | 0 (0.0%) |
| $2,000 to $2,499 | 15 (0.6%) | 0 (0.0%) |
| $2,500 to $2,999 | 38 (1.5%) | 0 (0.0%) |
| $3,000 or more | 11 (0.4%) | 0 (0.0%) |
| Total | 2,616 (100.0%) | 2,319 (100.0%) |
Physical Housing Characteristics in Moberly
Housing Structures in Moberly
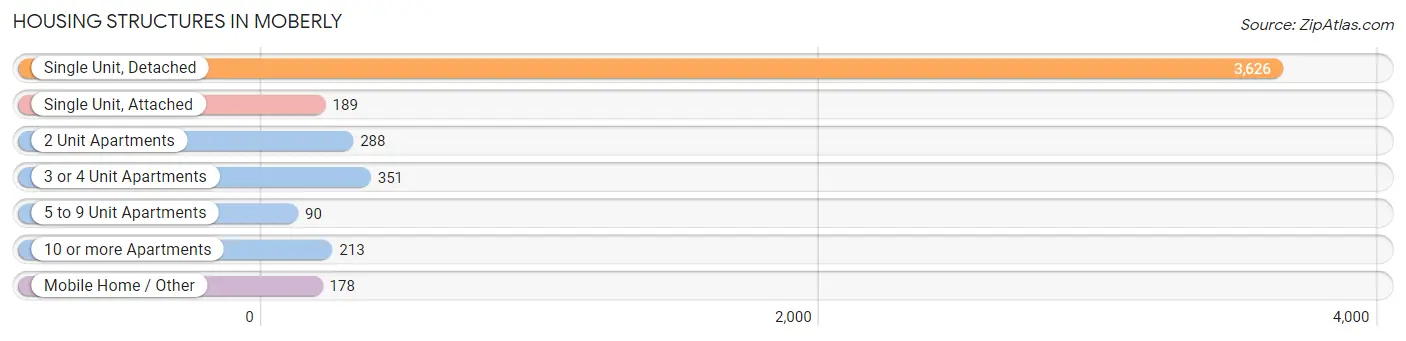
| Structure Type | # Housing Units | % Housing Units |
| Single Unit, Detached | 3,626 | 73.5% |
| Single Unit, Attached | 189 | 3.8% |
| 2 Unit Apartments | 288 | 5.8% |
| 3 or 4 Unit Apartments | 351 | 7.1% |
| 5 to 9 Unit Apartments | 90 | 1.8% |
| 10 or more Apartments | 213 | 4.3% |
| Mobile Home / Other | 178 | 3.6% |
| Total | 4,935 | 100.0% |
Housing Structures by Occupancy in Moberly
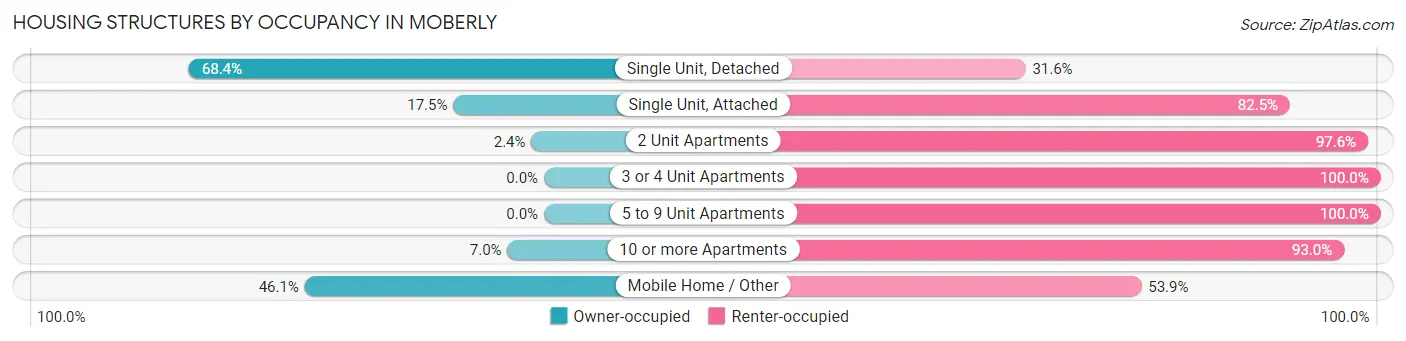
| Structure Type | Owner-occupied | Renter-occupied |
| Single Unit, Detached | 2,479 (68.4%) | 1,147 (31.6%) |
| Single Unit, Attached | 33 (17.5%) | 156 (82.5%) |
| 2 Unit Apartments | 7 (2.4%) | 281 (97.6%) |
| 3 or 4 Unit Apartments | 0 (0.0%) | 351 (100.0%) |
| 5 to 9 Unit Apartments | 0 (0.0%) | 90 (100.0%) |
| 10 or more Apartments | 15 (7.0%) | 198 (93.0%) |
| Mobile Home / Other | 82 (46.1%) | 96 (53.9%) |
| Total | 2,616 (53.0%) | 2,319 (47.0%) |
Housing Structures by Number of Rooms in Moberly
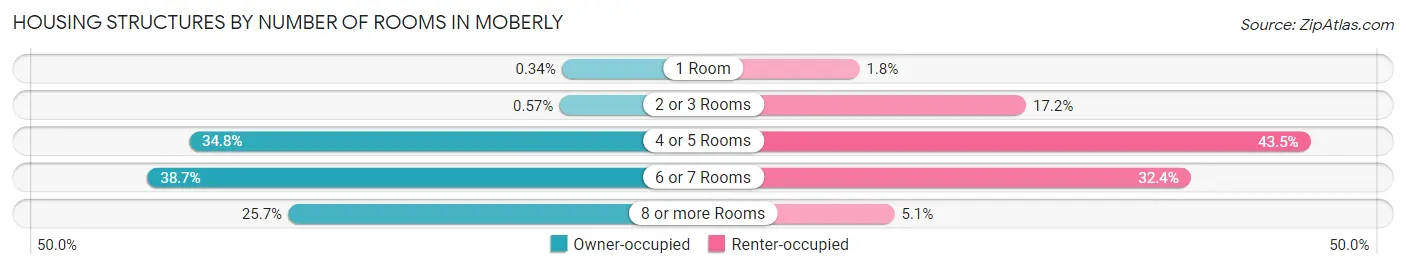
| Number of Rooms | Owner-occupied | Renter-occupied |
| 1 Room | 9 (0.3%) | 42 (1.8%) |
| 2 or 3 Rooms | 15 (0.6%) | 399 (17.2%) |
| 4 or 5 Rooms | 910 (34.8%) | 1,009 (43.5%) |
| 6 or 7 Rooms | 1,011 (38.7%) | 752 (32.4%) |
| 8 or more Rooms | 671 (25.7%) | 117 (5.1%) |
| Total | 2,616 (100.0%) | 2,319 (100.0%) |
Housing Structure by Heating Type in Moberly
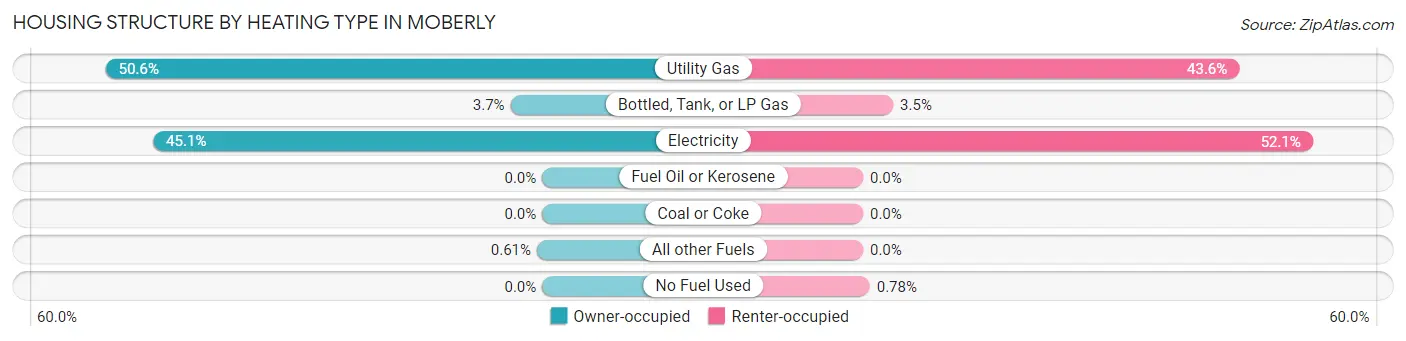
| Heating Type | Owner-occupied | Renter-occupied |
| Utility Gas | 1,324 (50.6%) | 1,011 (43.6%) |
| Bottled, Tank, or LP Gas | 96 (3.7%) | 81 (3.5%) |
| Electricity | 1,180 (45.1%) | 1,209 (52.1%) |
| Fuel Oil or Kerosene | 0 (0.0%) | 0 (0.0%) |
| Coal or Coke | 0 (0.0%) | 0 (0.0%) |
| All other Fuels | 16 (0.6%) | 0 (0.0%) |
| No Fuel Used | 0 (0.0%) | 18 (0.8%) |
| Total | 2,616 (100.0%) | 2,319 (100.0%) |
Household Vehicle Usage in Moberly
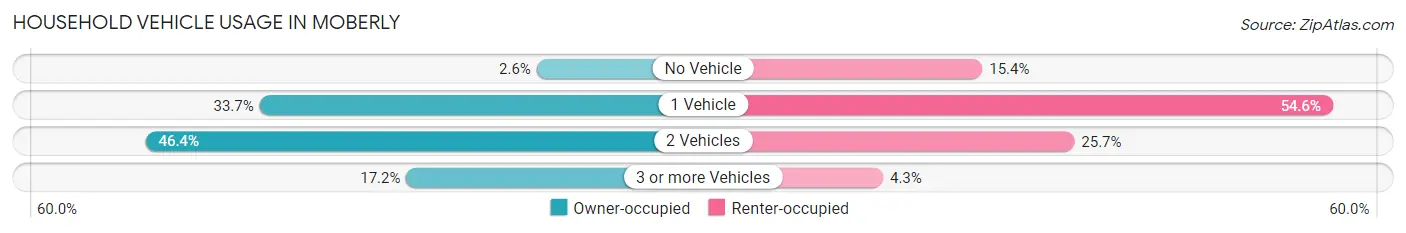
| Vehicles per Household | Owner-occupied | Renter-occupied |
| No Vehicle | 69 (2.6%) | 357 (15.4%) |
| 1 Vehicle | 881 (33.7%) | 1,267 (54.6%) |
| 2 Vehicles | 1,215 (46.4%) | 596 (25.7%) |
| 3 or more Vehicles | 451 (17.2%) | 99 (4.3%) |
| Total | 2,616 (100.0%) | 2,319 (100.0%) |
Real Estate & Mortgages in Moberly
Real Estate and Mortgage Overview in Moberly
| Characteristic | Without Mortgage | With Mortgage |
| Housing Units | 1,144 | 1,472 |
| Median Property Value | $77,600 | $146,800 |
| Median Household Income | $49,861 | $109 |
| Monthly Housing Costs | $440 | $11 |
| Real Estate Taxes | $764 | $13 |
Property Value by Mortgage Status in Moberly
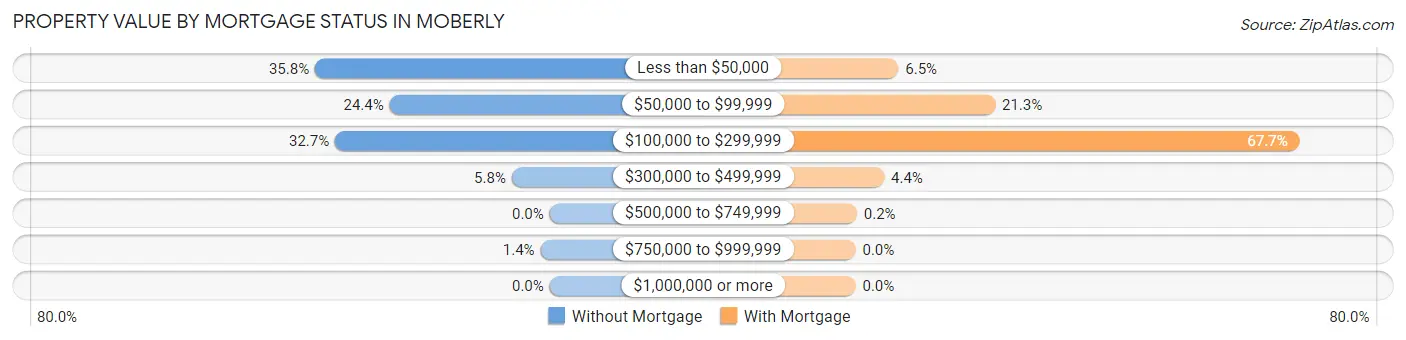
| Property Value | Without Mortgage | With Mortgage |
| Less than $50,000 | 409 (35.7%) | 96 (6.5%) |
| $50,000 to $99,999 | 279 (24.4%) | 313 (21.3%) |
| $100,000 to $299,999 | 374 (32.7%) | 996 (67.7%) |
| $300,000 to $499,999 | 66 (5.8%) | 64 (4.3%) |
| $500,000 to $749,999 | 0 (0.0%) | 3 (0.2%) |
| $750,000 to $999,999 | 16 (1.4%) | 0 (0.0%) |
| $1,000,000 or more | 0 (0.0%) | 0 (0.0%) |
| Total | 1,144 (100.0%) | 1,472 (100.0%) |
Household Income by Mortgage Status in Moberly
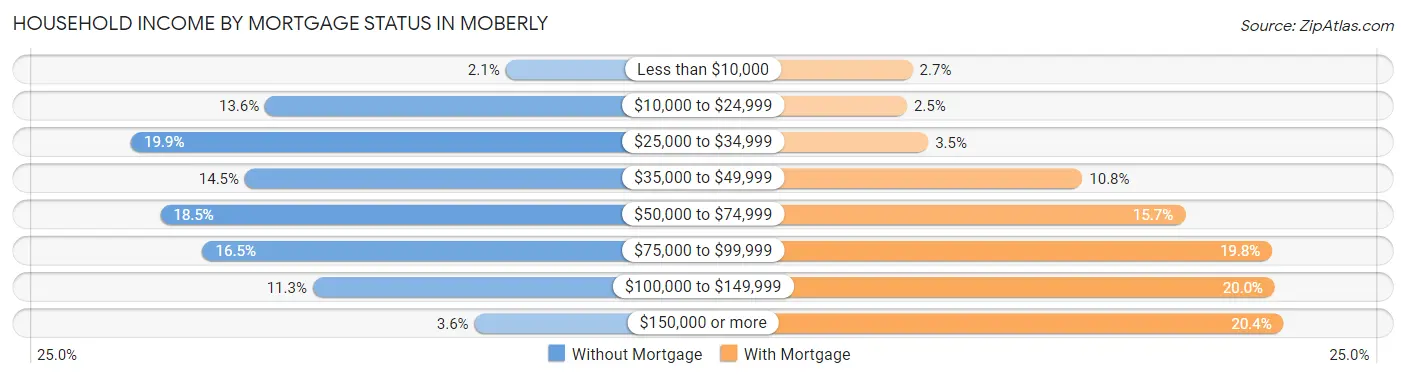
| Household Income | Without Mortgage | With Mortgage |
| Less than $10,000 | 24 (2.1%) | 40 (2.7%) |
| $10,000 to $24,999 | 155 (13.6%) | 36 (2.5%) |
| $25,000 to $34,999 | 228 (19.9%) | 51 (3.5%) |
| $35,000 to $49,999 | 166 (14.5%) | 159 (10.8%) |
| $50,000 to $74,999 | 212 (18.5%) | 231 (15.7%) |
| $75,000 to $99,999 | 189 (16.5%) | 292 (19.8%) |
| $100,000 to $149,999 | 129 (11.3%) | 294 (20.0%) |
| $150,000 or more | 41 (3.6%) | 300 (20.4%) |
| Total | 1,144 (100.0%) | 1,472 (100.0%) |
Property Value to Household Income Ratio in Moberly
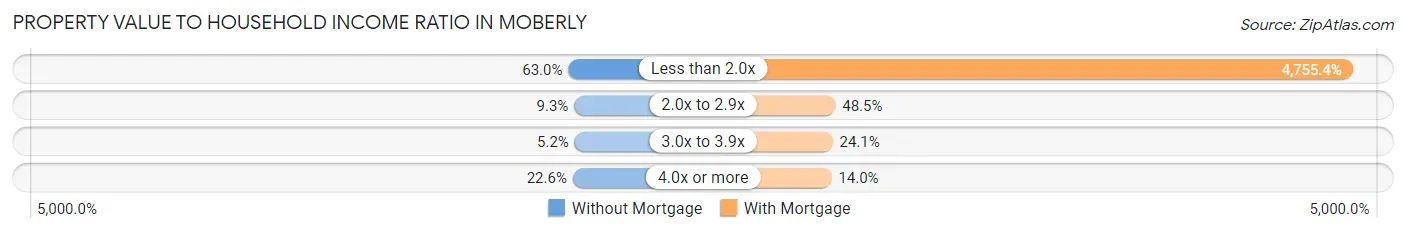
| Value-to-Income Ratio | Without Mortgage | With Mortgage |
| Less than 2.0x | 721 (63.0%) | 70,000 (4,755.4%) |
| 2.0x to 2.9x | 106 (9.3%) | 714 (48.5%) |
| 3.0x to 3.9x | 59 (5.2%) | 355 (24.1%) |
| 4.0x or more | 258 (22.6%) | 206 (14.0%) |
| Total | 1,144 (100.0%) | 1,472 (100.0%) |
Real Estate Taxes by Mortgage Status in Moberly
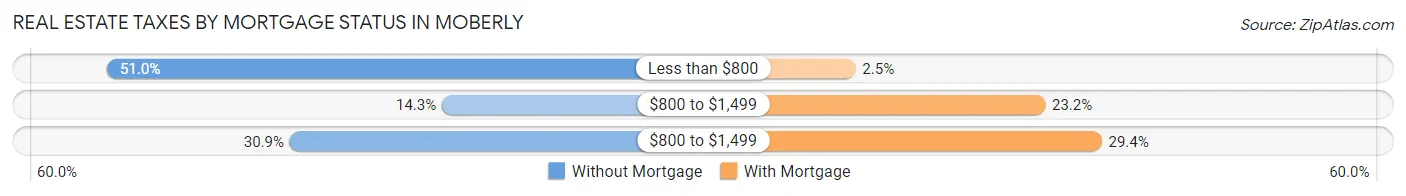
| Property Taxes | Without Mortgage | With Mortgage |
| Less than $800 | 583 (51.0%) | 36 (2.5%) |
| $800 to $1,499 | 163 (14.2%) | 342 (23.2%) |
| $800 to $1,499 | 354 (30.9%) | 433 (29.4%) |
| Total | 1,144 (100.0%) | 1,472 (100.0%) |
Health & Disability in Moberly
Health Insurance Coverage by Age in Moberly
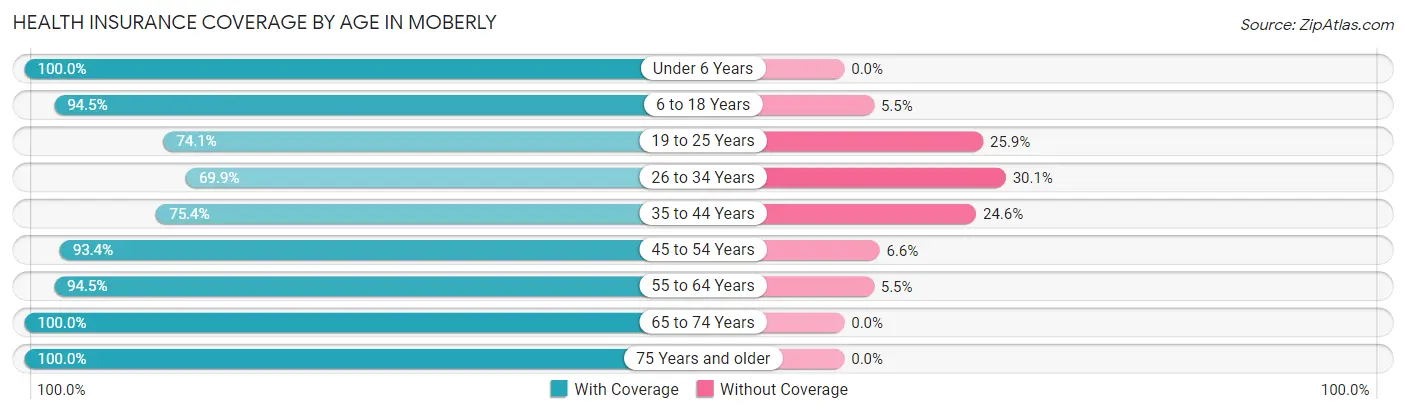
| Age Bracket | With Coverage | Without Coverage |
| Under 6 Years | 1,007 (100.0%) | 0 (0.0%) |
| 6 to 18 Years | 2,032 (94.5%) | 119 (5.5%) |
| 19 to 25 Years | 833 (74.1%) | 291 (25.9%) |
| 26 to 34 Years | 1,173 (69.9%) | 505 (30.1%) |
| 35 to 44 Years | 1,139 (75.4%) | 371 (24.6%) |
| 45 to 54 Years | 953 (93.4%) | 67 (6.6%) |
| 55 to 64 Years | 1,477 (94.5%) | 86 (5.5%) |
| 65 to 74 Years | 1,056 (100.0%) | 0 (0.0%) |
| 75 Years and older | 845 (100.0%) | 0 (0.0%) |
| Total | 10,515 (88.0%) | 1,439 (12.0%) |
Health Insurance Coverage by Citizenship Status in Moberly
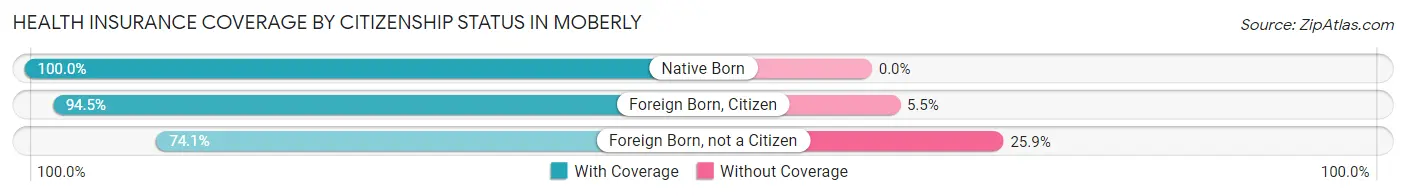
| Citizenship Status | With Coverage | Without Coverage |
| Native Born | 1,007 (100.0%) | 0 (0.0%) |
| Foreign Born, Citizen | 2,032 (94.5%) | 119 (5.5%) |
| Foreign Born, not a Citizen | 833 (74.1%) | 291 (25.9%) |
Health Insurance Coverage by Household Income in Moberly
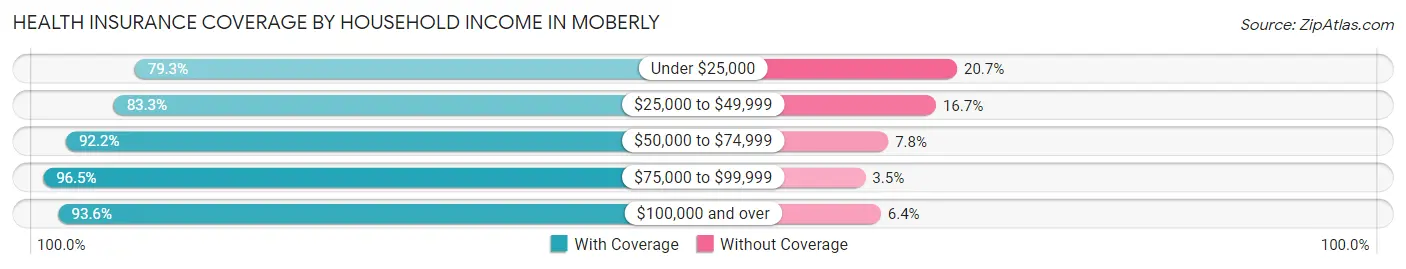
| Household Income | With Coverage | Without Coverage |
| Under $25,000 | 1,901 (79.3%) | 495 (20.7%) |
| $25,000 to $49,999 | 2,861 (83.3%) | 574 (16.7%) |
| $50,000 to $74,999 | 2,069 (92.2%) | 174 (7.8%) |
| $75,000 to $99,999 | 1,606 (96.5%) | 58 (3.5%) |
| $100,000 and over | 1,907 (93.6%) | 130 (6.4%) |
Public vs Private Health Insurance Coverage by Age in Moberly
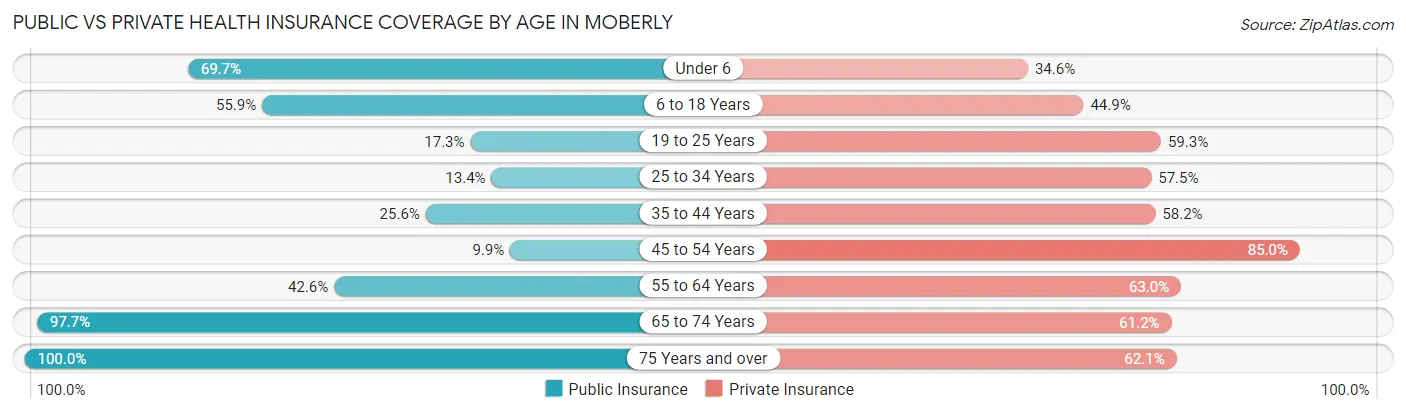
| Age Bracket | Public Insurance | Private Insurance |
| Under 6 | 702 (69.7%) | 348 (34.6%) |
| 6 to 18 Years | 1,203 (55.9%) | 965 (44.9%) |
| 19 to 25 Years | 194 (17.3%) | 666 (59.3%) |
| 25 to 34 Years | 224 (13.4%) | 964 (57.5%) |
| 35 to 44 Years | 386 (25.6%) | 879 (58.2%) |
| 45 to 54 Years | 101 (9.9%) | 867 (85.0%) |
| 55 to 64 Years | 665 (42.5%) | 984 (63.0%) |
| 65 to 74 Years | 1,032 (97.7%) | 646 (61.2%) |
| 75 Years and over | 845 (100.0%) | 525 (62.1%) |
| Total | 5,352 (44.8%) | 6,844 (57.3%) |
Disability Status by Sex by Age in Moberly
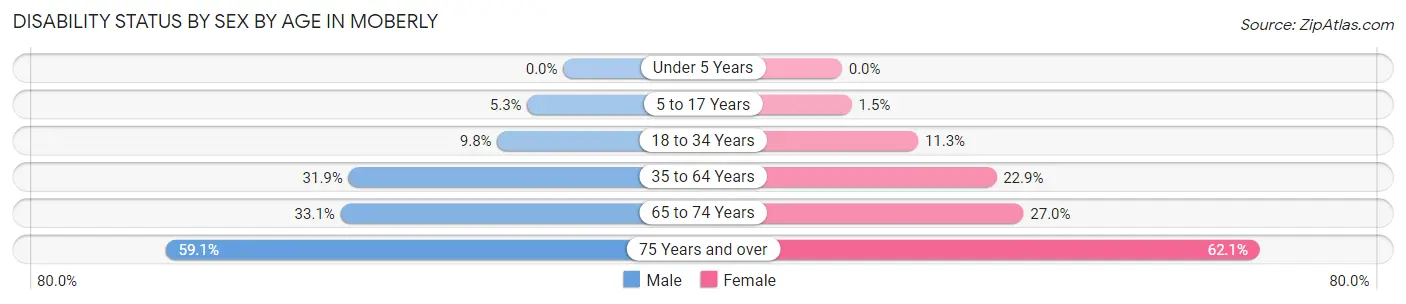
| Age Bracket | Male | Female |
| Under 5 Years | 0 (0.0%) | 0 (0.0%) |
| 5 to 17 Years | 66 (5.3%) | 15 (1.5%) |
| 18 to 34 Years | 152 (9.8%) | 152 (11.3%) |
| 35 to 64 Years | 582 (31.9%) | 520 (22.9%) |
| 65 to 74 Years | 126 (33.1%) | 182 (27.0%) |
| 75 Years and over | 166 (59.1%) | 350 (62.1%) |
Disability Class by Sex by Age in Moberly
Disability Class: Hearing Difficulty
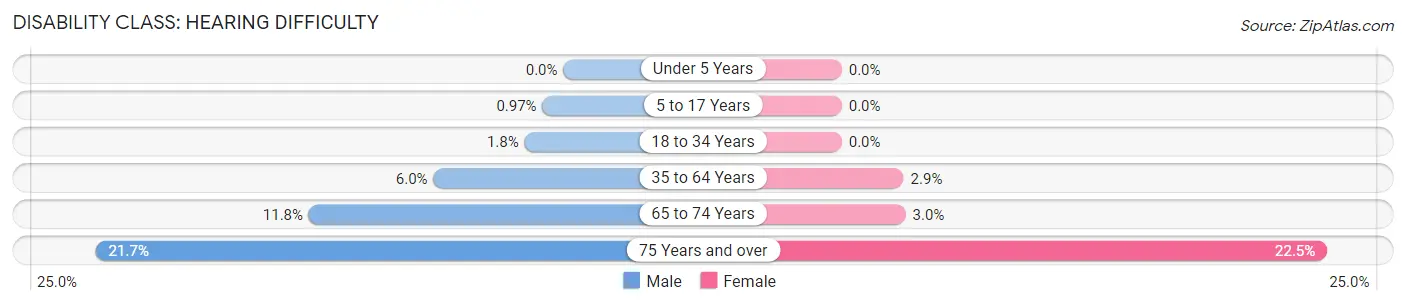
| Age Bracket | Male | Female |
| Under 5 Years | 0 (0.0%) | 0 (0.0%) |
| 5 to 17 Years | 12 (1.0%) | 0 (0.0%) |
| 18 to 34 Years | 28 (1.8%) | 0 (0.0%) |
| 35 to 64 Years | 110 (6.0%) | 65 (2.9%) |
| 65 to 74 Years | 45 (11.8%) | 20 (3.0%) |
| 75 Years and over | 61 (21.7%) | 127 (22.5%) |
Disability Class: Vision Difficulty
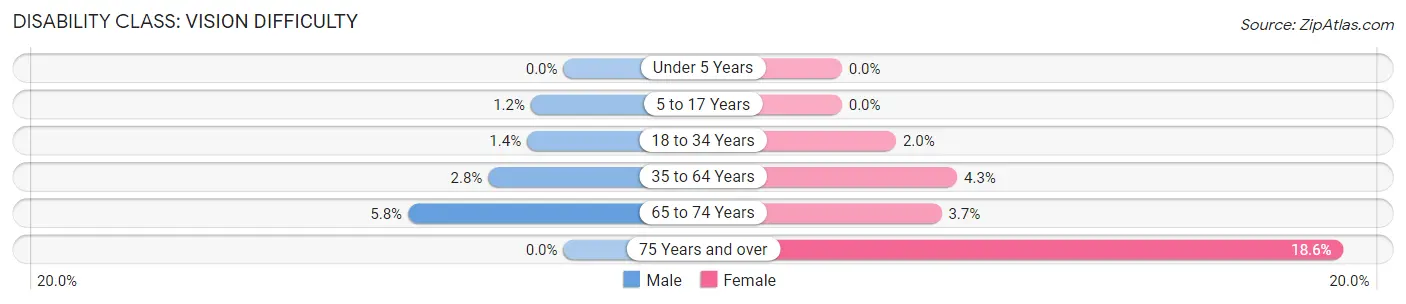
| Age Bracket | Male | Female |
| Under 5 Years | 0 (0.0%) | 0 (0.0%) |
| 5 to 17 Years | 15 (1.2%) | 0 (0.0%) |
| 18 to 34 Years | 21 (1.3%) | 27 (2.0%) |
| 35 to 64 Years | 51 (2.8%) | 97 (4.3%) |
| 65 to 74 Years | 22 (5.8%) | 25 (3.7%) |
| 75 Years and over | 0 (0.0%) | 105 (18.6%) |
Disability Class: Cognitive Difficulty
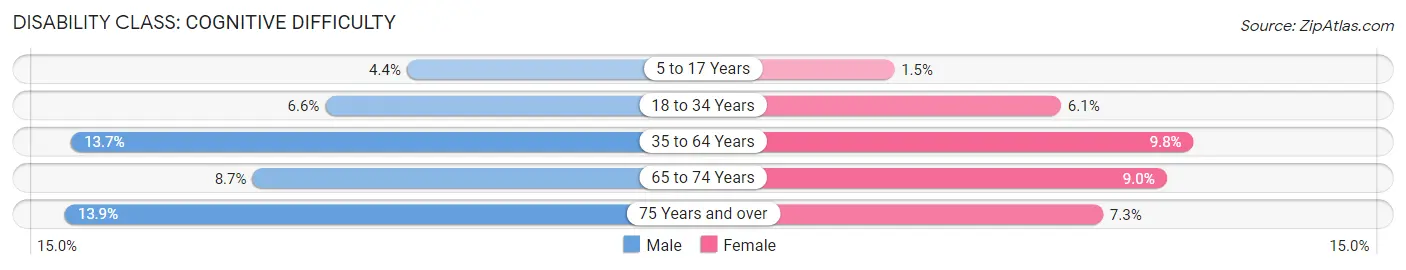
| Age Bracket | Male | Female |
| 5 to 17 Years | 54 (4.4%) | 15 (1.5%) |
| 18 to 34 Years | 103 (6.6%) | 82 (6.1%) |
| 35 to 64 Years | 250 (13.7%) | 222 (9.8%) |
| 65 to 74 Years | 33 (8.7%) | 61 (9.0%) |
| 75 Years and over | 39 (13.9%) | 41 (7.3%) |
Disability Class: Ambulatory Difficulty
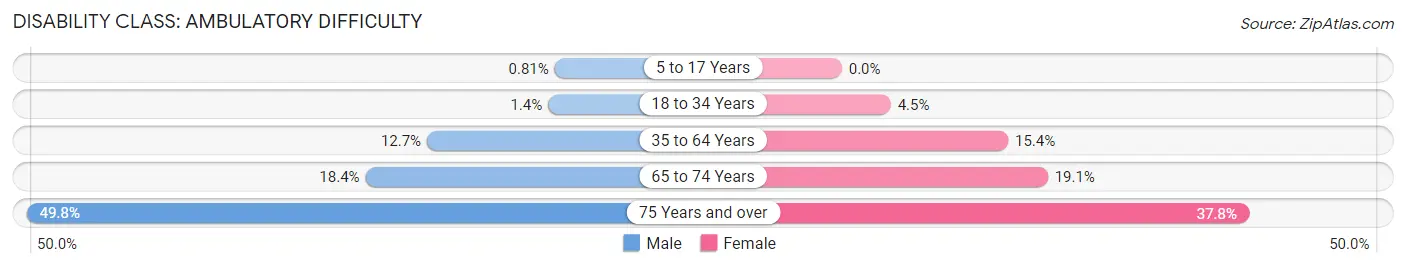
| Age Bracket | Male | Female |
| 5 to 17 Years | 10 (0.8%) | 0 (0.0%) |
| 18 to 34 Years | 22 (1.4%) | 61 (4.5%) |
| 35 to 64 Years | 231 (12.7%) | 350 (15.4%) |
| 65 to 74 Years | 70 (18.4%) | 129 (19.1%) |
| 75 Years and over | 140 (49.8%) | 213 (37.8%) |
Disability Class: Self-Care Difficulty
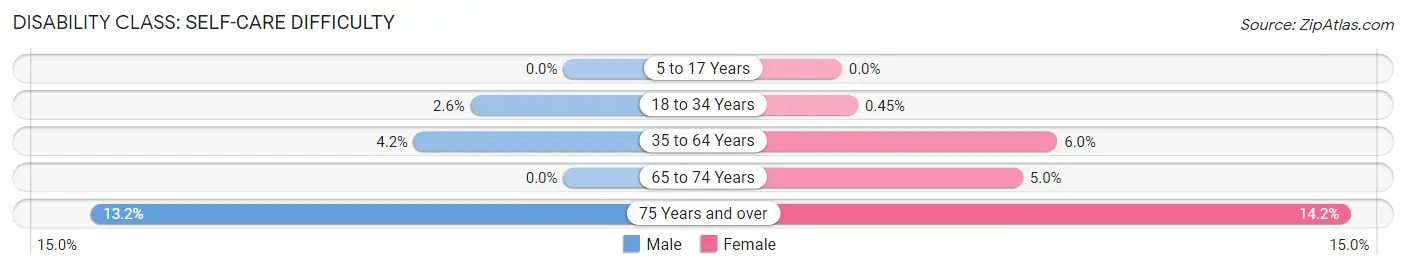
| Age Bracket | Male | Female |
| 5 to 17 Years | 0 (0.0%) | 0 (0.0%) |
| 18 to 34 Years | 40 (2.6%) | 6 (0.4%) |
| 35 to 64 Years | 76 (4.2%) | 136 (6.0%) |
| 65 to 74 Years | 0 (0.0%) | 34 (5.0%) |
| 75 Years and over | 37 (13.2%) | 80 (14.2%) |
Technology Access in Moberly
Computing Device Access in Moberly
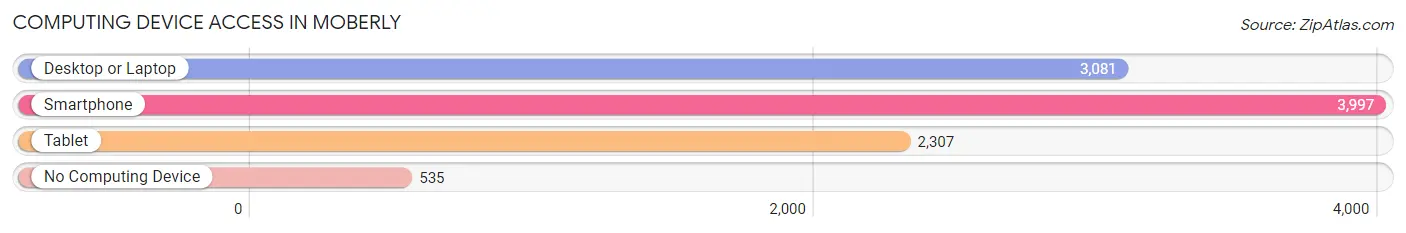
| Device Type | # Households | % Households |
| Desktop or Laptop | 3,081 | 62.4% |
| Smartphone | 3,997 | 81.0% |
| Tablet | 2,307 | 46.8% |
| No Computing Device | 535 | 10.8% |
| Total | 4,935 | 100.0% |
Internet Access in Moberly
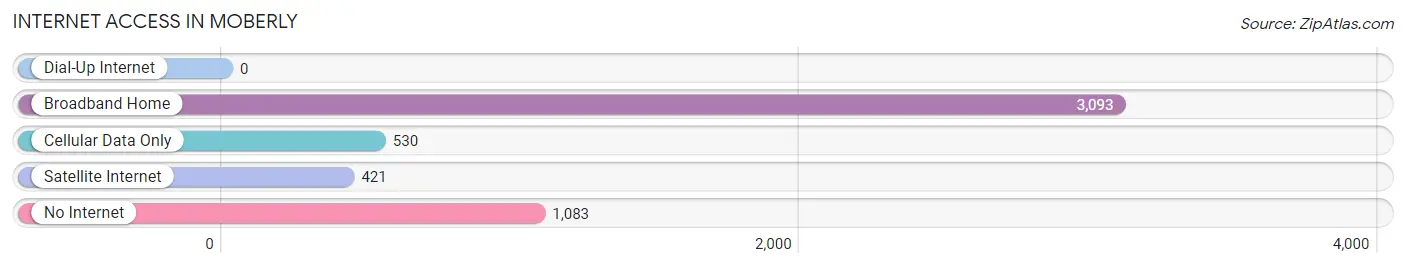
| Internet Type | # Households | % Households |
| Dial-Up Internet | 0 | 0.0% |
| Broadband Home | 3,093 | 62.7% |
| Cellular Data Only | 530 | 10.7% |
| Satellite Internet | 421 | 8.5% |
| No Internet | 1,083 | 22.0% |
| Total | 4,935 | 100.0% |
Moberly Summary
Moberly, Missouri is a city located in Randolph County, in the north-central part of the state. It is situated on the Chariton River, about halfway between St. Louis and Kansas City. The city has a population of 13,974, according to the 2010 census, and is the county seat of Randolph County.
History
Moberly was founded in 1866 by railroad magnate William M. Moore, who named the city after his friend, Colonel William E. Moberly. The city was incorporated in 1872, and the first post office was established in 1873.
Moberly was an important stop on the Hannibal and St. Joseph Railroad, which connected St. Louis and Kansas City. The railroad was the first to cross the state of Missouri, and it was instrumental in the development of the city.
In the late 19th century, Moberly was a major center for the production of coal and iron. The city was also home to several large manufacturing plants, including the Moberly Iron and Steel Company, which was founded in 1887.
Geography
Moberly is located in north-central Missouri, about halfway between St. Louis and Kansas City. The city is situated on the Chariton River, and is surrounded by rolling hills and farmland.
The city has a total area of 8.3 square miles, of which 8.2 square miles is land and 0.1 square miles is water.
Economy
Moberly's economy is largely based on manufacturing and agriculture. The city is home to several large manufacturing plants, including the Moberly Iron and Steel Company, which produces steel products for the automotive and construction industries.
The city is also home to several agricultural businesses, including grain elevators, feed mills, and livestock operations.
Demographics
According to the 2010 census, Moberly has a population of 13,974. The racial makeup of the city is 87.3% White, 8.2% African American, 0.7% Native American, 0.5% Asian, 0.1% Pacific Islander, 1.2% from other races, and 2.1% from two or more races.
The median household income in Moberly is $37,945, and the median family income is $45,945. The per capita income is $20,845. About 16.3% of the population is below the poverty line.
Conclusion
Moberly, Missouri is a city located in Randolph County, in the north-central part of the state. It was founded in 1866 by railroad magnate William M. Moore, and was an important stop on the Hannibal and St. Joseph Railroad. The city has a population of 13,974, according to the 2010 census, and is the county seat of Randolph County. The economy of Moberly is largely based on manufacturing and agriculture, and the city is home to several large manufacturing plants and agricultural businesses. The racial makeup of the city is 87.3% White, 8.2% African American, 0.7% Native American, 0.5% Asian, 0.1% Pacific Islander, 1.2% from other races, and 2.1% from two or more races. The median household income in Moberly is $37,945, and the median family income is $45,945. The per capita income is $20,845. About 16.3% of the population is below the poverty line.
Common Questions
What is Per Capita Income in Moberly?
Per Capita income in Moberly is $21,760.
What is the Median Family Income in Moberly?
Median Family Income in Moberly is $52,545.
What is the Median Household income in Moberly?
Median Household Income in Moberly is $39,332.
What is Income or Wage Gap in Moberly?
Income or Wage Gap in Moberly is 0.6%.
Women in Moberly earn 99.4 cents for every dollar earned by a man.
What is Family Income Deficit in Moberly?
Family Income Deficit in Moberly is $9,411.
Families that are below poverty line in Moberly earn $9,411 less on average than the poverty threshold level.
What is Inequality or Gini Index in Moberly?
Inequality or Gini Index in Moberly is 0.44.
What is the Total Population of Moberly?
Total Population of Moberly is 13,708.
What is the Total Male Population of Moberly?
Total Male Population of Moberly is 7,355.
What is the Total Female Population of Moberly?
Total Female Population of Moberly is 6,353.
What is the Ratio of Males per 100 Females in Moberly?
There are 115.77 Males per 100 Females in Moberly.
What is the Ratio of Females per 100 Males in Moberly?
There are 86.38 Females per 100 Males in Moberly.
What is the Median Population Age in Moberly?
Median Population Age in Moberly is 37.5 Years.
What is the Average Family Size in Moberly
Average Family Size in Moberly is 3.0 People.
What is the Average Household Size in Moberly
Average Household Size in Moberly is 2.4 People.
How Large is the Labor Force in Moberly?
There are 5,752 People in the Labor Forcein in Moberly.
What is the Percentage of People in the Labor Force in Moberly?
52.4% of People are in the Labor Force in Moberly.
What is the Unemployment Rate in Moberly?
Unemployment Rate in Moberly is 7.5%.