Seneca, MO Map & Demographics
Seneca Map
Seneca Overview
$21,245
PER CAPITA INCOME
$53,523
AVG FAMILY INCOME
$42,279
AVG HOUSEHOLD INCOME
27.0%
WAGE / INCOME GAP [ % ]
73.0¢/ $1
WAGE / INCOME GAP [ $ ]
$7,159
FAMILY INCOME DEFICIT
0.41
INEQUALITY / GINI INDEX
2,005
TOTAL POPULATION
1,057
MALE POPULATION
948
FEMALE POPULATION
111.50
MALES / 100 FEMALES
89.69
FEMALES / 100 MALES
35.3
MEDIAN AGE
3.4
AVG FAMILY SIZE
2.9
AVG HOUSEHOLD SIZE
838
LABOR FORCE [ PEOPLE ]
53.4%
PERCENT IN LABOR FORCE
0.1%
UNEMPLOYMENT RATE
Seneca Zip Codes
Seneca Area Codes
Income in Seneca
Income Overview in Seneca
Per Capita Income in Seneca is $21,245, while median incomes of families and households are $53,523 and $42,279 respectively.
| Characteristic | Number | Measure |
| Per Capita Income | 2,005 | $21,245 |
| Median Family Income | 488 | $53,523 |
| Mean Family Income | 488 | $64,306 |
| Median Household Income | 671 | $42,279 |
| Mean Household Income | 671 | $54,794 |
| Income Deficit | 488 | $7,159 |
| Wage / Income Gap (%) | 2,005 | 26.95% |
| Wage / Income Gap ($) | 2,005 | 73.05¢ per $1 |
| Gini / Inequality Index | 2,005 | 0.41 |
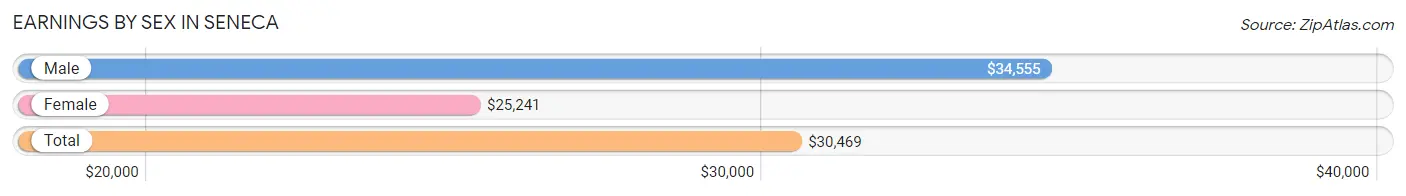
Earnings by Sex in Seneca
Average Earnings in Seneca are $30,469, $34,555 for men and $25,241 for women, a difference of 27.0%.
| Sex | Number | Average Earnings |
| Male | 483 (54.9%) | $34,555 |
| Female | 397 (45.1%) | $25,241 |
| Total | 880 (100.0%) | $30,469 |
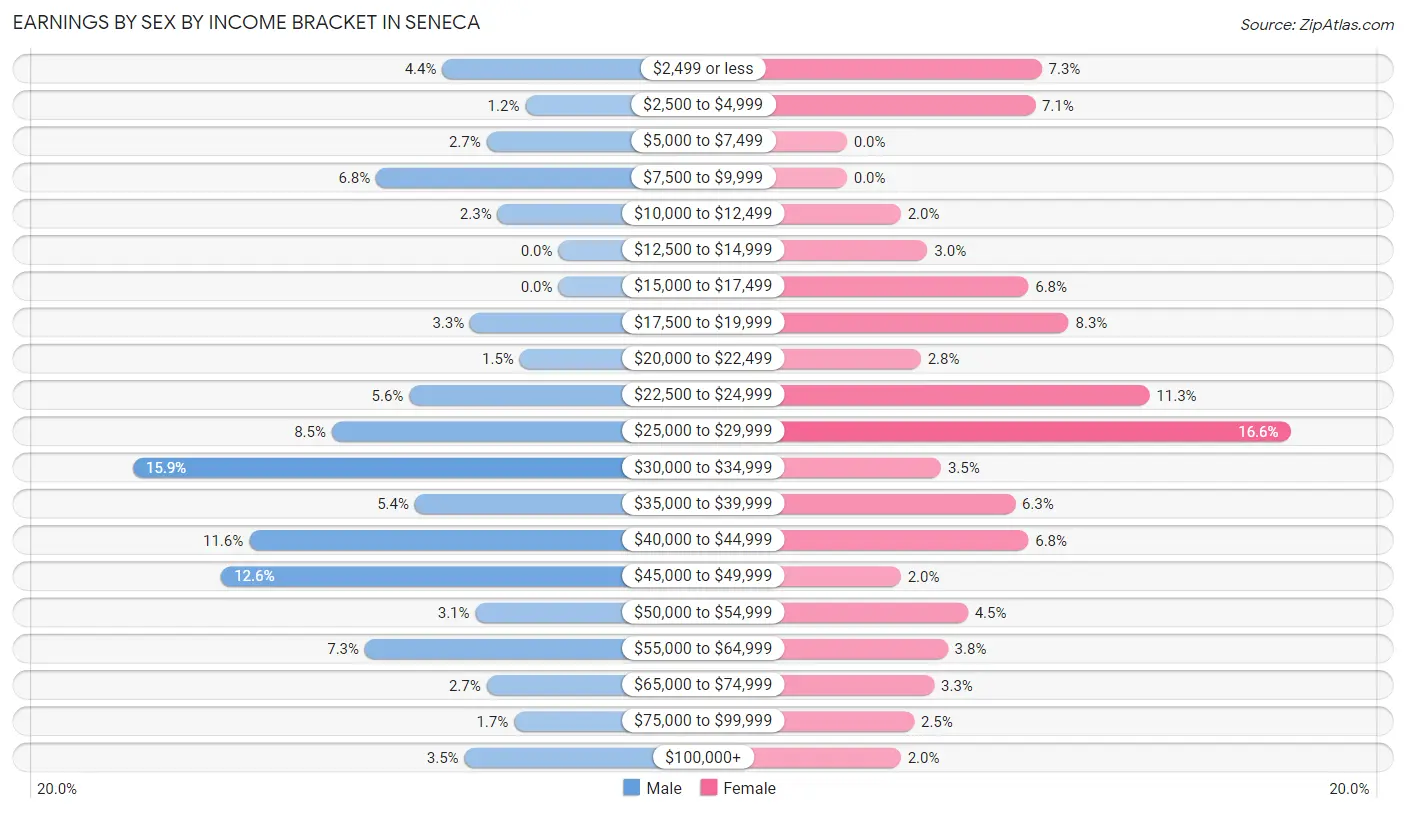
Earnings by Sex by Income Bracket in Seneca
The most common earnings brackets in Seneca are $30,000 to $34,999 for men (77 | 15.9%) and $25,000 to $29,999 for women (66 | 16.6%).
| Income | Male | Female |
| $2,499 or less | 21 (4.3%) | 29 (7.3%) |
| $2,500 to $4,999 | 6 (1.2%) | 28 (7.0%) |
| $5,000 to $7,499 | 13 (2.7%) | 0 (0.0%) |
| $7,500 to $9,999 | 33 (6.8%) | 0 (0.0%) |
| $10,000 to $12,499 | 11 (2.3%) | 8 (2.0%) |
| $12,500 to $14,999 | 0 (0.0%) | 12 (3.0%) |
| $15,000 to $17,499 | 0 (0.0%) | 27 (6.8%) |
| $17,500 to $19,999 | 16 (3.3%) | 33 (8.3%) |
| $20,000 to $22,499 | 7 (1.5%) | 11 (2.8%) |
| $22,500 to $24,999 | 27 (5.6%) | 45 (11.3%) |
| $25,000 to $29,999 | 41 (8.5%) | 66 (16.6%) |
| $30,000 to $34,999 | 77 (15.9%) | 14 (3.5%) |
| $35,000 to $39,999 | 26 (5.4%) | 25 (6.3%) |
| $40,000 to $44,999 | 56 (11.6%) | 27 (6.8%) |
| $45,000 to $49,999 | 61 (12.6%) | 8 (2.0%) |
| $50,000 to $54,999 | 15 (3.1%) | 18 (4.5%) |
| $55,000 to $64,999 | 35 (7.2%) | 15 (3.8%) |
| $65,000 to $74,999 | 13 (2.7%) | 13 (3.3%) |
| $75,000 to $99,999 | 8 (1.7%) | 10 (2.5%) |
| $100,000+ | 17 (3.5%) | 8 (2.0%) |
| Total | 483 (100.0%) | 397 (100.0%) |
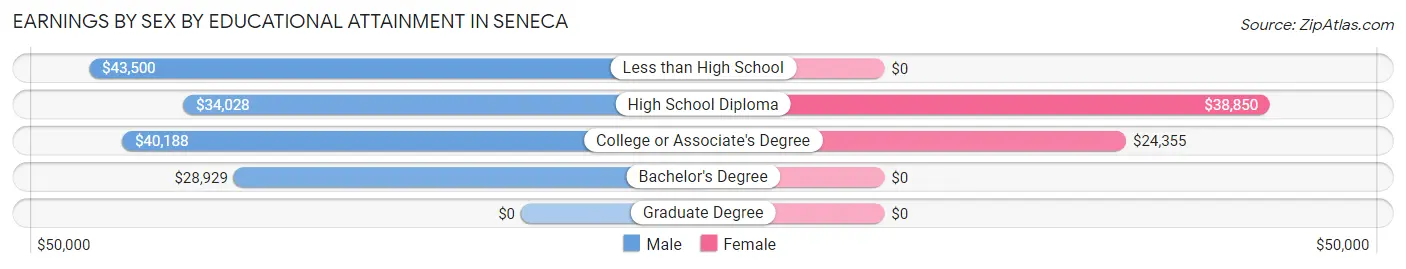
Earnings by Sex by Educational Attainment in Seneca
Average earnings in Seneca are $39,844 for men and $27,045 for women, a difference of 32.1%. Men with an educational attainment of less than high school enjoy the highest average annual earnings of $43,500, while those with bachelor's degree education earn the least with $28,929. Women with an educational attainment of high school diploma earn the most with the average annual earnings of $38,850, while those with college or associate's degree education have the smallest earnings of $24,355.
| Educational Attainment | Male Income | Female Income |
| Less than High School | $43,500 | $0 |
| High School Diploma | $34,028 | $38,850 |
| College or Associate's Degree | $40,188 | $24,355 |
| Bachelor's Degree | $28,929 | $0 |
| Graduate Degree | - | - |
| Total | $39,844 | $27,045 |
Family Income in Seneca
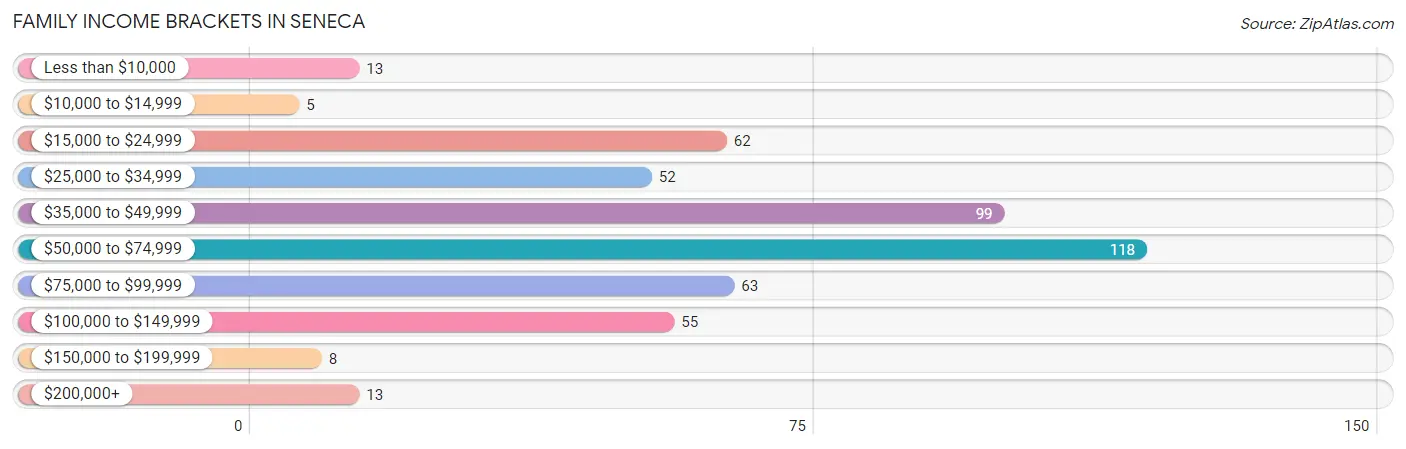
Family Income Brackets in Seneca
According to the Seneca family income data, there are 118 families falling into the $50,000 to $74,999 income range, which is the most common income bracket and makes up 24.2% of all families. Conversely, the $10,000 to $14,999 income bracket is the least frequent group with only 5 families (1.0%) belonging to this category.
| Income Bracket | # Families | % Families |
| Less than $10,000 | 13 | 2.7% |
| $10,000 to $14,999 | 5 | 1.0% |
| $15,000 to $24,999 | 62 | 12.7% |
| $25,000 to $34,999 | 52 | 10.7% |
| $35,000 to $49,999 | 99 | 20.3% |
| $50,000 to $74,999 | 118 | 24.2% |
| $75,000 to $99,999 | 63 | 12.9% |
| $100,000 to $149,999 | 55 | 11.3% |
| $150,000 to $199,999 | 8 | 1.6% |
| $200,000+ | 13 | 2.7% |
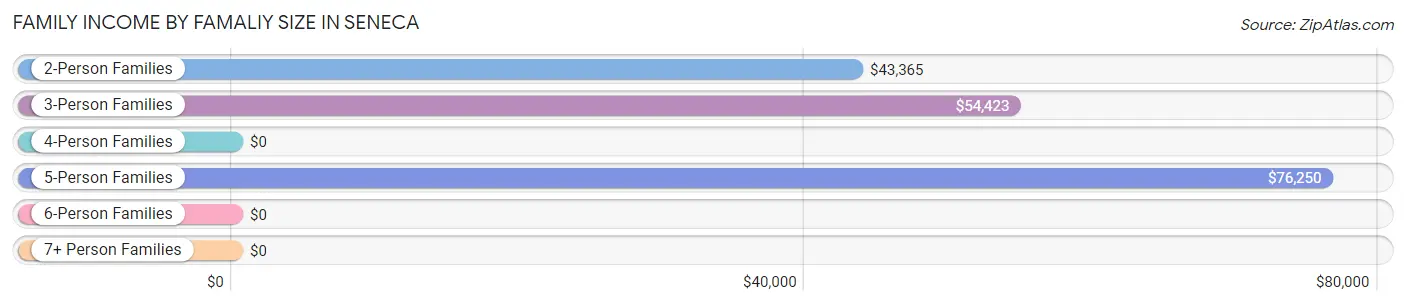
Family Income by Famaliy Size in Seneca
5-person families (30 | 6.1%) account for the highest median family income in Seneca with $76,250 per family, while 2-person families (237 | 48.6%) have the highest median income of $21,682 per family member.
| Income Bracket | # Families | Median Income |
| 2-Person Families | 237 (48.6%) | $43,365 |
| 3-Person Families | 122 (25.0%) | $54,423 |
| 4-Person Families | 74 (15.2%) | $0 |
| 5-Person Families | 30 (6.1%) | $76,250 |
| 6-Person Families | 10 (2.1%) | $0 |
| 7+ Person Families | 15 (3.1%) | $0 |
| Total | 488 (100.0%) | $53,523 |
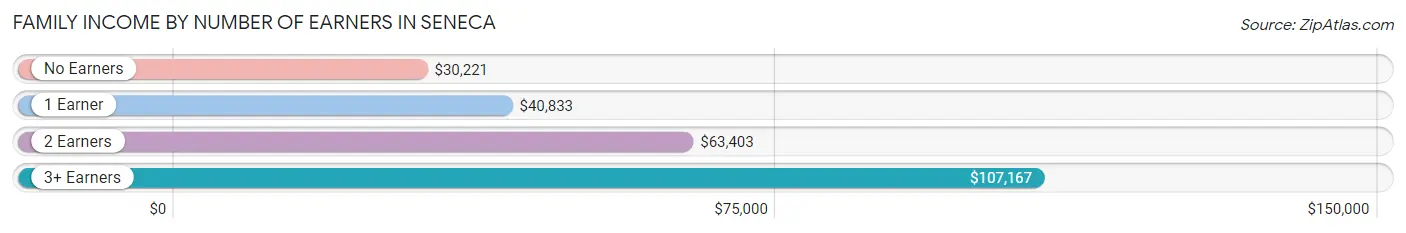
Family Income by Number of Earners in Seneca
The median family income in Seneca is $53,523, with families comprising 3+ earners (40) having the highest median family income of $107,167, while families with no earners (81) have the lowest median family income of $30,221, accounting for 8.2% and 16.6% of families, respectively.
| Number of Earners | # Families | Median Income |
| No Earners | 81 (16.6%) | $30,221 |
| 1 Earner | 206 (42.2%) | $40,833 |
| 2 Earners | 161 (33.0%) | $63,403 |
| 3+ Earners | 40 (8.2%) | $107,167 |
| Total | 488 (100.0%) | $53,523 |
Household Income in Seneca
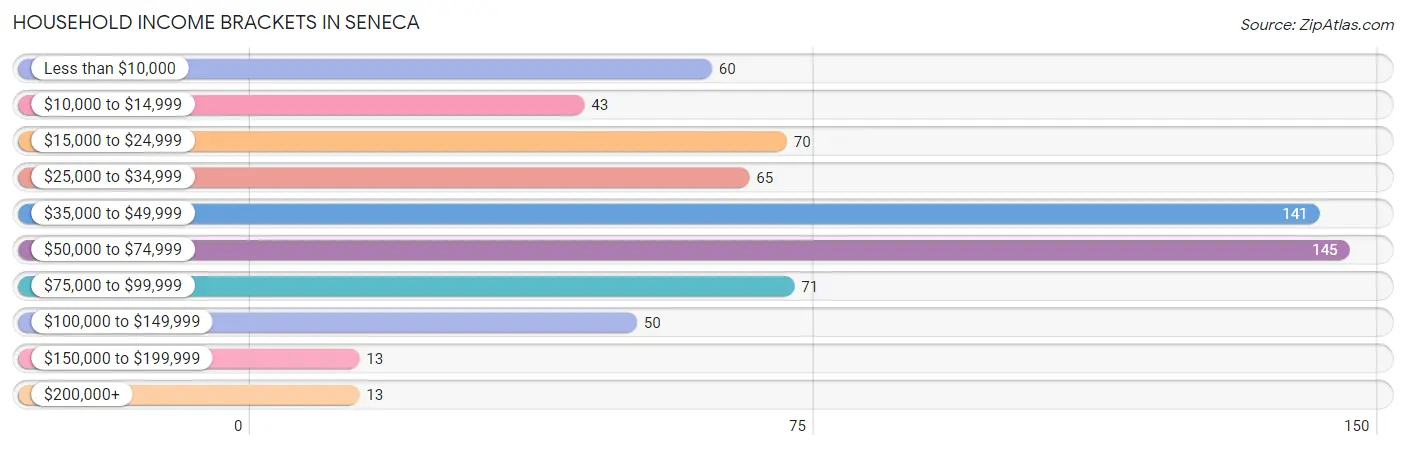
Household Income Brackets in Seneca
With 145 households falling in the category, the $50,000 to $74,999 income range is the most frequent in Seneca, accounting for 21.6% of all households. In contrast, only 13 households (1.9%) fall into the $150,000 to $199,999 income bracket, making it the least populous group.
| Income Bracket | # Households | % Households |
| Less than $10,000 | 60 | 8.9% |
| $10,000 to $14,999 | 43 | 6.4% |
| $15,000 to $24,999 | 70 | 10.4% |
| $25,000 to $34,999 | 65 | 9.7% |
| $35,000 to $49,999 | 141 | 21.0% |
| $50,000 to $74,999 | 145 | 21.6% |
| $75,000 to $99,999 | 71 | 10.6% |
| $100,000 to $149,999 | 50 | 7.5% |
| $150,000 to $199,999 | 13 | 1.9% |
| $200,000+ | 13 | 1.9% |
Household Income by Householder Age in Seneca
The median household income in Seneca is $42,279, with the highest median household income of $57,917 found in the 25 to 44 years age bracket for the primary householder. A total of 161 households (24.0%) fall into this category. Meanwhile, the 65+ years age bracket for the primary householder has the lowest median household income of $32,353, with 208 households (31.0%) in this group.
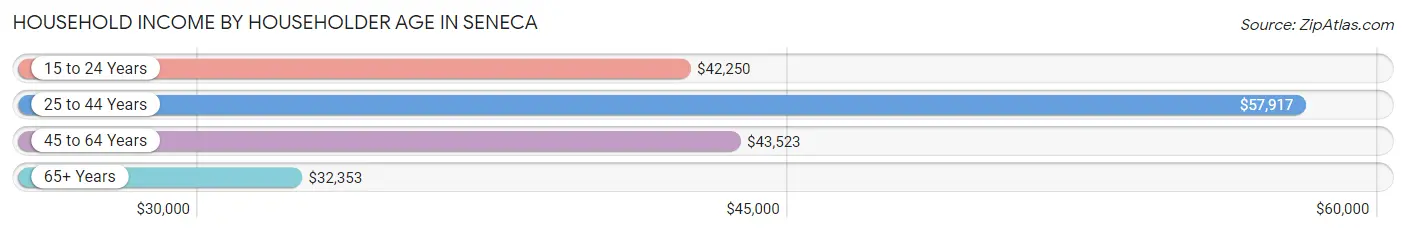
| Income Bracket | # Households | Median Income |
| 15 to 24 Years | 45 (6.7%) | $42,250 |
| 25 to 44 Years | 161 (24.0%) | $57,917 |
| 45 to 64 Years | 257 (38.3%) | $43,523 |
| 65+ Years | 208 (31.0%) | $32,353 |
| Total | 671 (100.0%) | $42,279 |
Poverty in Seneca
Income Below Poverty by Sex and Age in Seneca
With 16.2% poverty level for males and 21.4% for females among the residents of Seneca, 15 year old males and 16 and 17 year old females are the most vulnerable to poverty, with 20 males (100.0%) and 12 females (48.0%) in their respective age groups living below the poverty level.
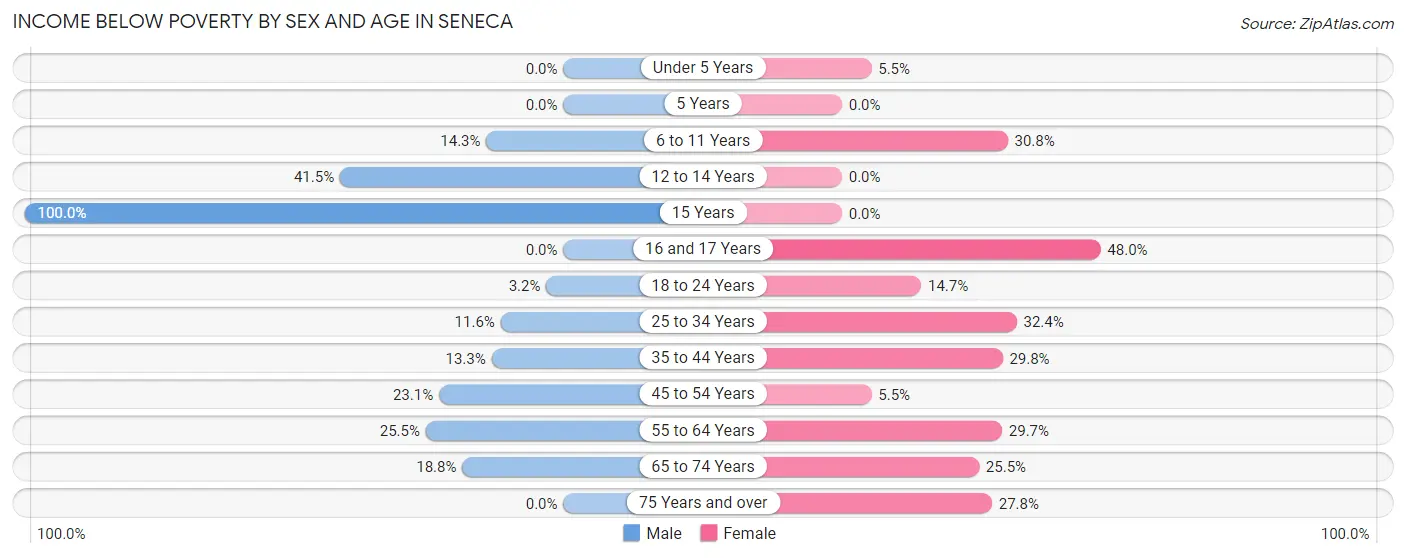
| Age Bracket | Male | Female |
| Under 5 Years | 0 (0.0%) | 7 (5.5%) |
| 5 Years | 0 (0.0%) | 0 (0.0%) |
| 6 to 11 Years | 22 (14.3%) | 8 (30.8%) |
| 12 to 14 Years | 17 (41.5%) | 0 (0.0%) |
| 15 Years | 20 (100.0%) | 0 (0.0%) |
| 16 and 17 Years | 0 (0.0%) | 12 (48.0%) |
| 18 to 24 Years | 3 (3.2%) | 15 (14.7%) |
| 25 to 34 Years | 22 (11.6%) | 36 (32.4%) |
| 35 to 44 Years | 12 (13.3%) | 17 (29.8%) |
| 45 to 54 Years | 18 (23.1%) | 5 (5.5%) |
| 55 to 64 Years | 36 (25.5%) | 41 (29.7%) |
| 65 to 74 Years | 18 (18.8%) | 28 (25.5%) |
| 75 Years and over | 0 (0.0%) | 27 (27.8%) |
| Total | 168 (16.2%) | 196 (21.4%) |
Income Above Poverty by Sex and Age in Seneca
According to the poverty statistics in Seneca, males aged under 5 years and females aged 5 years are the age groups that are most secure financially, with 100.0% of males and 100.0% of females in these age groups living above the poverty line.
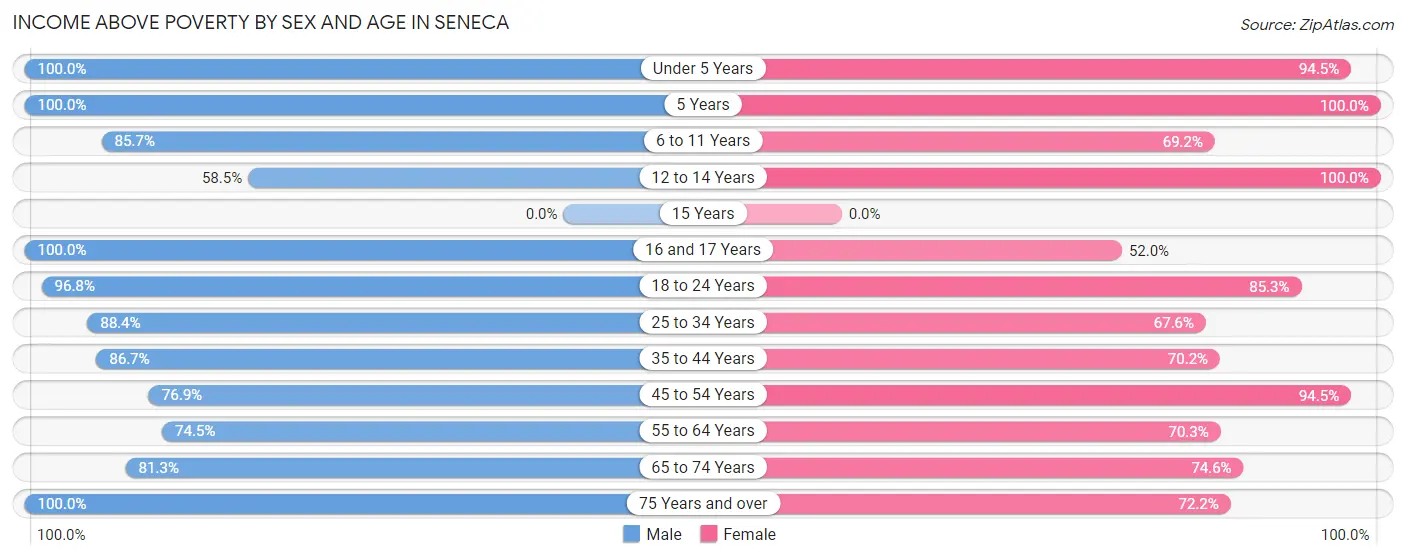
| Age Bracket | Male | Female |
| Under 5 Years | 29 (100.0%) | 121 (94.5%) |
| 5 Years | 8 (100.0%) | 6 (100.0%) |
| 6 to 11 Years | 132 (85.7%) | 18 (69.2%) |
| 12 to 14 Years | 24 (58.5%) | 23 (100.0%) |
| 15 Years | 0 (0.0%) | 0 (0.0%) |
| 16 and 17 Years | 34 (100.0%) | 13 (52.0%) |
| 18 to 24 Years | 92 (96.8%) | 87 (85.3%) |
| 25 to 34 Years | 167 (88.4%) | 75 (67.6%) |
| 35 to 44 Years | 78 (86.7%) | 40 (70.2%) |
| 45 to 54 Years | 60 (76.9%) | 86 (94.5%) |
| 55 to 64 Years | 105 (74.5%) | 97 (70.3%) |
| 65 to 74 Years | 78 (81.2%) | 82 (74.6%) |
| 75 Years and over | 60 (100.0%) | 70 (72.2%) |
| Total | 867 (83.8%) | 718 (78.6%) |
Income Below Poverty Among Married-Couple Families in Seneca
The poverty statistics for married-couple families in Seneca show that 8.2% or 28 of the total 342 families live below the poverty line. Families with 3 or 4 children have the highest poverty rate of 55.9%, comprising of 19 families. On the other hand, families with 1 or 2 children have the lowest poverty rate of 0.0%, which includes 0 families.
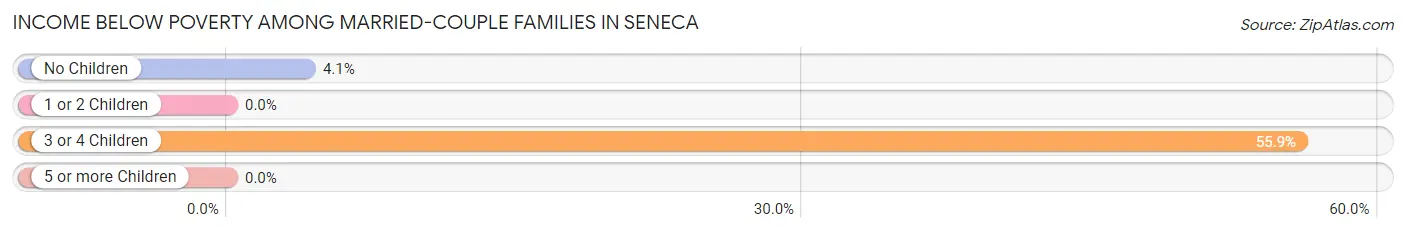
| Children | Above Poverty | Below Poverty |
| No Children | 212 (95.9%) | 9 (4.1%) |
| 1 or 2 Children | 87 (100.0%) | 0 (0.0%) |
| 3 or 4 Children | 15 (44.1%) | 19 (55.9%) |
| 5 or more Children | 0 (0.0%) | 0 (0.0%) |
| Total | 314 (91.8%) | 28 (8.2%) |
Income Below Poverty Among Single-Parent Households in Seneca
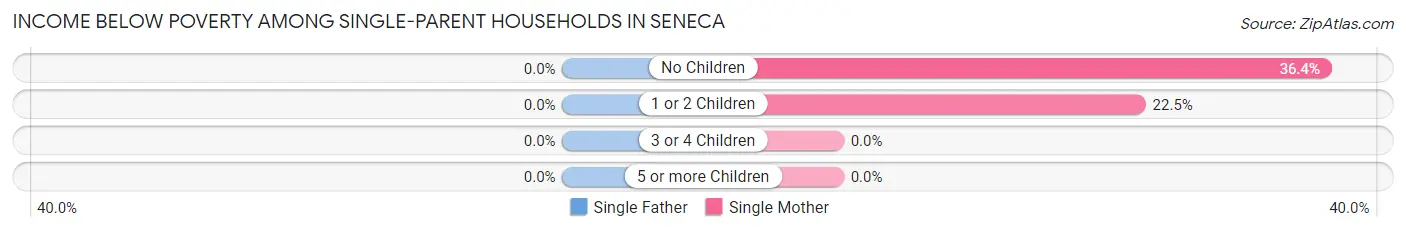
| Children | Single Father | Single Mother |
| No Children | 0 (0.0%) | 8 (36.4%) |
| 1 or 2 Children | 0 (0.0%) | 18 (22.5%) |
| 3 or 4 Children | 0 (0.0%) | 0 (0.0%) |
| 5 or more Children | 0 (0.0%) | 0 (0.0%) |
| Total | 0 (0.0%) | 26 (24.3%) |
Income Below Poverty Among Married-Couple vs Single-Parent Households in Seneca
The poverty data for Seneca shows that 28 of the married-couple family households (8.2%) and 26 of the single-parent households (17.8%) are living below the poverty level. Within the married-couple family households, those with 3 or 4 children have the highest poverty rate, with 19 households (55.9%) falling below the poverty line. Among the single-parent households, those with no children have the highest poverty rate, with 8 household (28.6%) living below poverty.
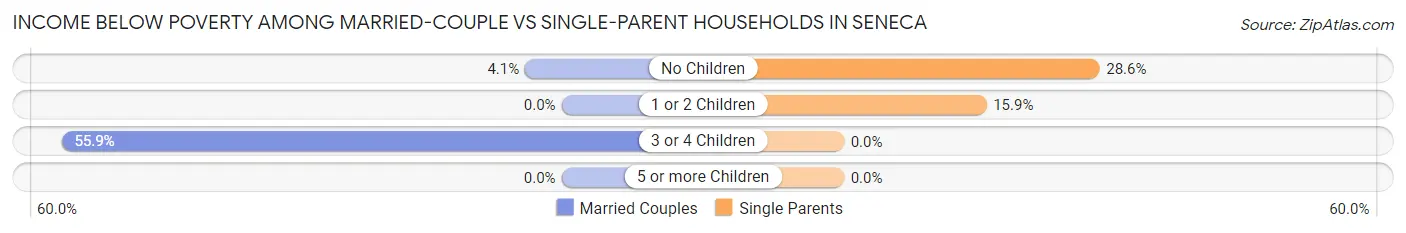
| Children | Married-Couple Families | Single-Parent Households |
| No Children | 9 (4.1%) | 8 (28.6%) |
| 1 or 2 Children | 0 (0.0%) | 18 (15.9%) |
| 3 or 4 Children | 19 (55.9%) | 0 (0.0%) |
| 5 or more Children | 0 (0.0%) | 0 (0.0%) |
| Total | 28 (8.2%) | 26 (17.8%) |
Race in Seneca
The most populous races in Seneca are White / Caucasian (1,609 | 80.2%), Hawaiian / Pacific (155 | 7.7%), and Two or more Races (152 | 7.6%).
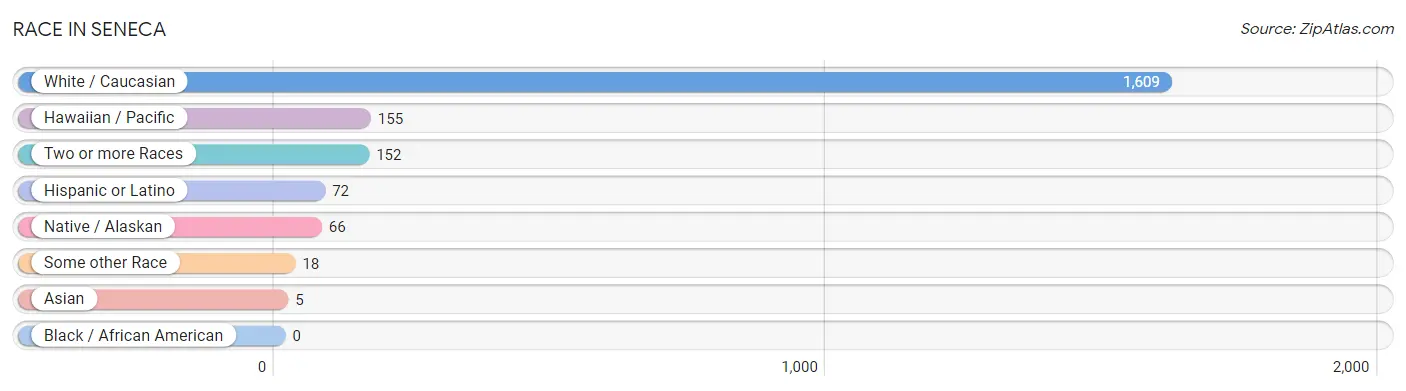
| Race | # Population | % Population |
| Asian | 5 | 0.3% |
| Black / African American | 0 | 0.0% |
| Hawaiian / Pacific | 155 | 7.7% |
| Hispanic or Latino | 72 | 3.6% |
| Native / Alaskan | 66 | 3.3% |
| White / Caucasian | 1,609 | 80.2% |
| Two or more Races | 152 | 7.6% |
| Some other Race | 18 | 0.9% |
| Total | 2,005 | 100.0% |
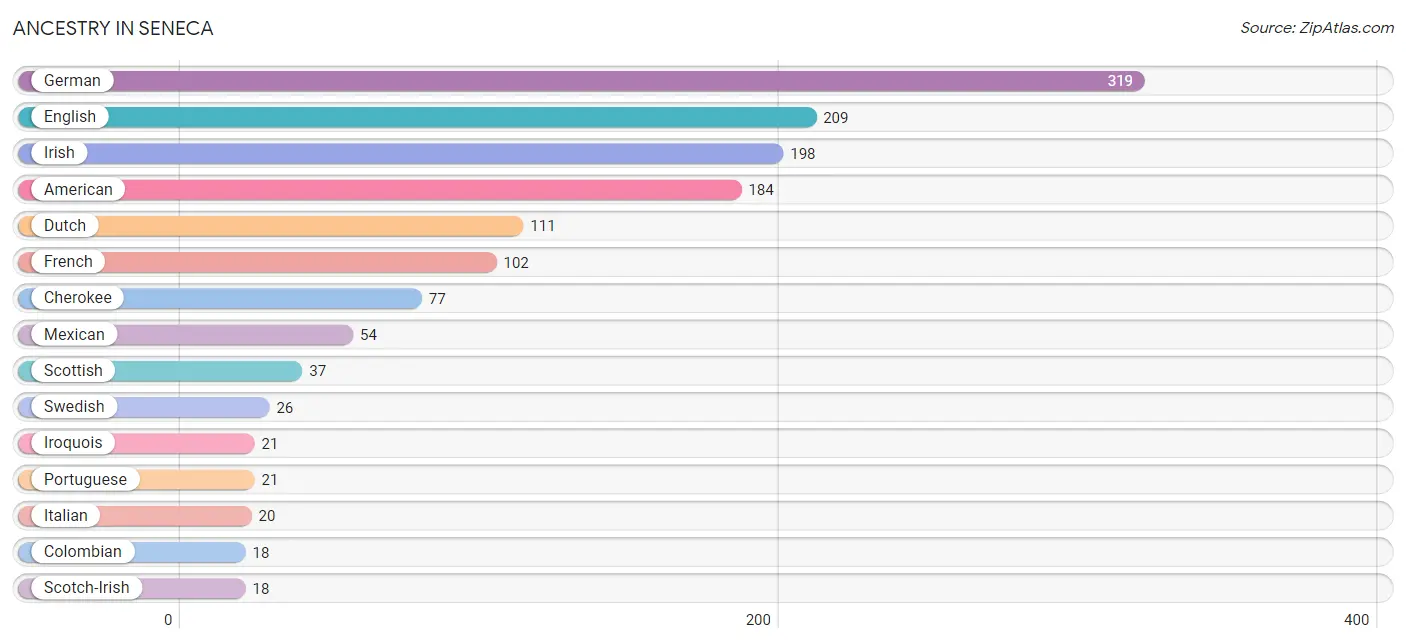
Ancestry in Seneca
The most populous ancestries reported in Seneca are German (319 | 15.9%), English (209 | 10.4%), Irish (198 | 9.9%), American (184 | 9.2%), and Dutch (111 | 5.5%), together accounting for 50.9% of all Seneca residents.
| Ancestry | # Population | % Population |
| American | 184 | 9.2% |
| Apache | 13 | 0.6% |
| Austrian | 11 | 0.5% |
| Bhutanese | 2 | 0.1% |
| Canadian | 4 | 0.2% |
| Cherokee | 77 | 3.8% |
| Colombian | 18 | 0.9% |
| Dutch | 111 | 5.5% |
| English | 209 | 10.4% |
| European | 10 | 0.5% |
| French | 102 | 5.1% |
| German | 319 | 15.9% |
| Indian (Asian) | 5 | 0.3% |
| Irish | 198 | 9.9% |
| Iroquois | 21 | 1.1% |
| Italian | 20 | 1.0% |
| Mexican | 54 | 2.7% |
| Norwegian | 8 | 0.4% |
| Portuguese | 21 | 1.1% |
| Potawatomi | 6 | 0.3% |
| Scandinavian | 11 | 0.5% |
| Scotch-Irish | 18 | 0.9% |
| Scottish | 37 | 1.8% |
| South American | 18 | 0.9% |
| Swedish | 26 | 1.3% |
| Welsh | 12 | 0.6% | View All 26 Rows |
Immigrants in Seneca
The most numerous immigrant groups reported in Seneca came from Micronesia (126 | 6.3%), Oceania (126 | 6.3%), Latin America (16 | 0.8%), Colombia (10 | 0.5%), and South America (10 | 0.5%), together accounting for 14.4% of all Seneca residents.
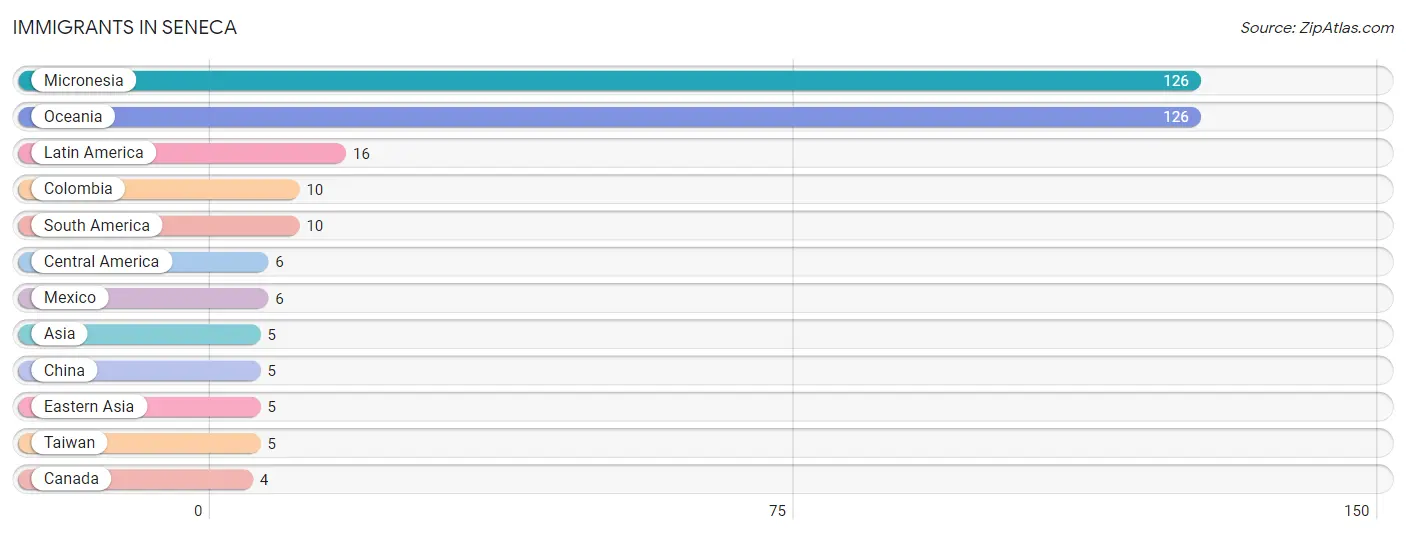
| Immigration Origin | # Population | % Population |
| Asia | 5 | 0.3% |
| Canada | 4 | 0.2% |
| Central America | 6 | 0.3% |
| China | 5 | 0.3% |
| Colombia | 10 | 0.5% |
| Eastern Asia | 5 | 0.3% |
| Latin America | 16 | 0.8% |
| Mexico | 6 | 0.3% |
| Micronesia | 126 | 6.3% |
| Oceania | 126 | 6.3% |
| South America | 10 | 0.5% |
| Taiwan | 5 | 0.3% | View All 12 Rows |
Sex and Age in Seneca
Sex and Age in Seneca
The most populous age groups in Seneca are 25 to 29 Years (136 | 12.9%) for men and Under 5 Years (128 | 13.5%) for women.
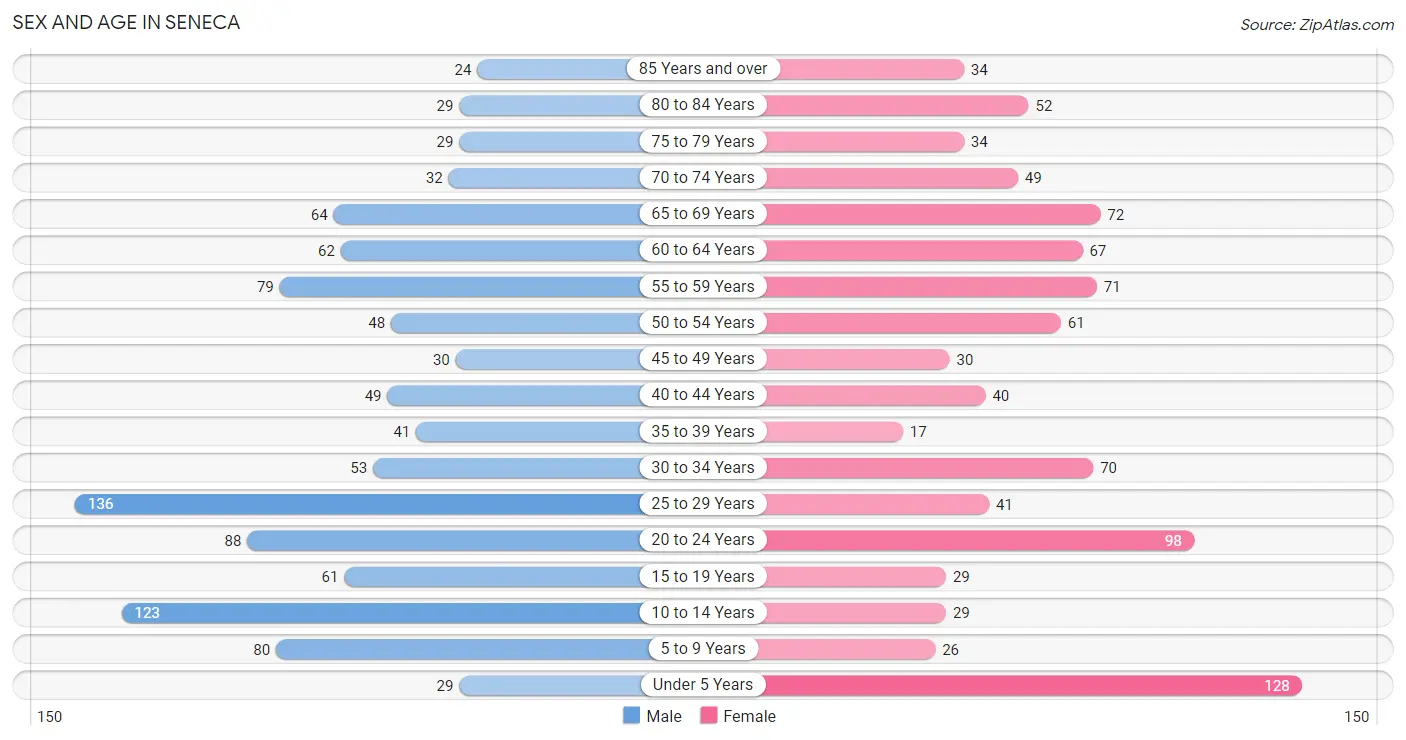
| Age Bracket | Male | Female |
| Under 5 Years | 29 (2.7%) | 128 (13.5%) |
| 5 to 9 Years | 80 (7.6%) | 26 (2.7%) |
| 10 to 14 Years | 123 (11.6%) | 29 (3.1%) |
| 15 to 19 Years | 61 (5.8%) | 29 (3.1%) |
| 20 to 24 Years | 88 (8.3%) | 98 (10.3%) |
| 25 to 29 Years | 136 (12.9%) | 41 (4.3%) |
| 30 to 34 Years | 53 (5.0%) | 70 (7.4%) |
| 35 to 39 Years | 41 (3.9%) | 17 (1.8%) |
| 40 to 44 Years | 49 (4.6%) | 40 (4.2%) |
| 45 to 49 Years | 30 (2.8%) | 30 (3.2%) |
| 50 to 54 Years | 48 (4.5%) | 61 (6.4%) |
| 55 to 59 Years | 79 (7.5%) | 71 (7.5%) |
| 60 to 64 Years | 62 (5.9%) | 67 (7.1%) |
| 65 to 69 Years | 64 (6.0%) | 72 (7.6%) |
| 70 to 74 Years | 32 (3.0%) | 49 (5.2%) |
| 75 to 79 Years | 29 (2.7%) | 34 (3.6%) |
| 80 to 84 Years | 29 (2.7%) | 52 (5.5%) |
| 85 Years and over | 24 (2.3%) | 34 (3.6%) |
| Total | 1,057 (100.0%) | 948 (100.0%) |
Families and Households in Seneca
Median Family Size in Seneca
The median family size in Seneca is 3.35 persons per family, with single female/mother families (107 | 21.9%) accounting for the largest median family size of 4.35 persons per family. On the other hand, single male/father families (39 | 8.0%) represent the smallest median family size with 2.21 persons per family.
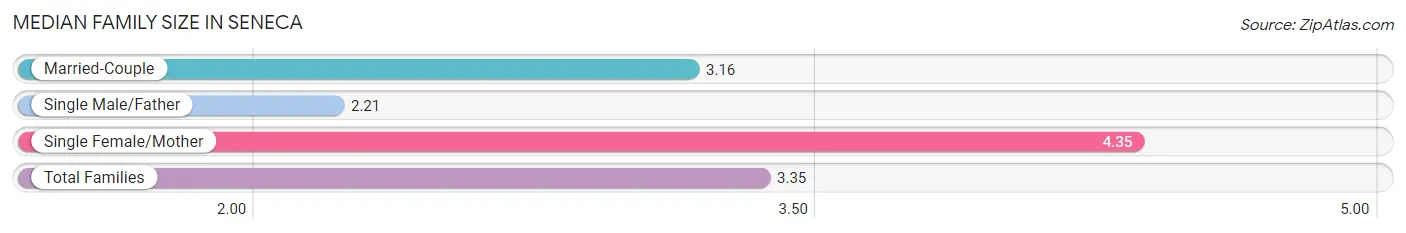
| Family Type | # Families | Family Size |
| Married-Couple | 342 (70.1%) | 3.16 |
| Single Male/Father | 39 (8.0%) | 2.21 |
| Single Female/Mother | 107 (21.9%) | 4.35 |
| Total Families | 488 (100.0%) | 3.35 |
Median Household Size in Seneca
The median household size in Seneca is 2.86 persons per household, with single female/mother households (107 | 16.0%) accounting for the largest median household size of 4.47 persons per household. non-family households (183 | 27.3%) represent the smallest median household size with 1.21 persons per household.
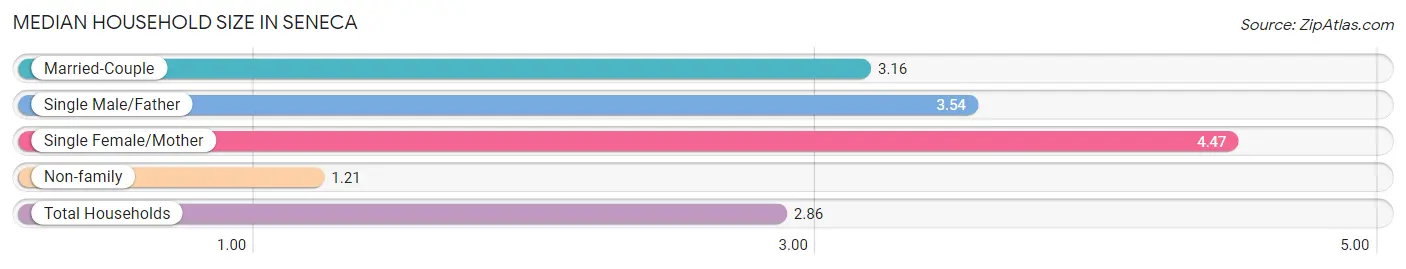
| Household Type | # Households | Household Size |
| Married-Couple | 342 (51.0%) | 3.16 |
| Single Male/Father | 39 (5.8%) | 3.54 |
| Single Female/Mother | 107 (16.0%) | 4.47 |
| Non-family | 183 (27.3%) | 1.21 |
| Total Households | 671 (100.0%) | 2.86 |
Household Size by Marriage Status in Seneca
Out of a total of 671 households in Seneca, 488 (72.7%) are family households, while 183 (27.3%) are nonfamily households. The most numerous type of family households are 2-person households, comprising 213, and the most common type of nonfamily households are 1-person households, comprising 162.
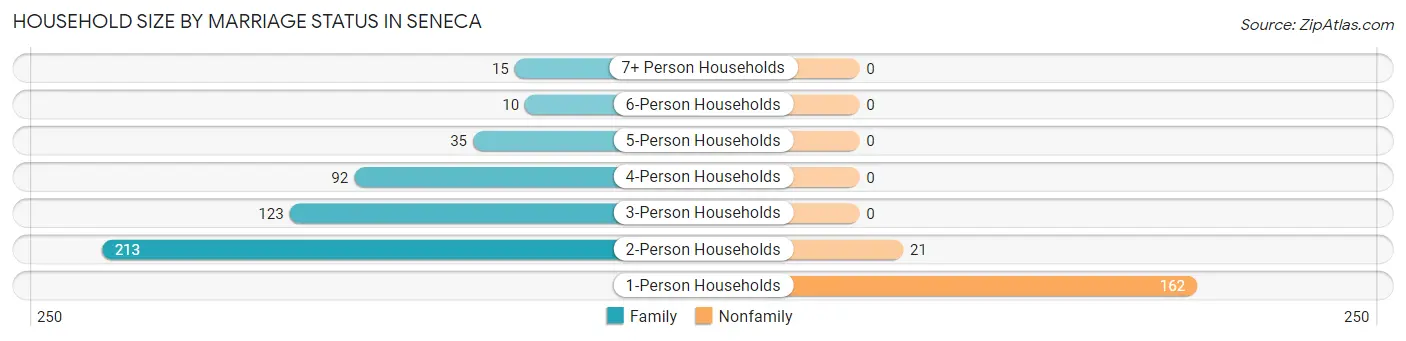
| Household Size | Family Households | Nonfamily Households |
| 1-Person Households | - | 162 (24.1%) |
| 2-Person Households | 213 (31.7%) | 21 (3.1%) |
| 3-Person Households | 123 (18.3%) | 0 (0.0%) |
| 4-Person Households | 92 (13.7%) | 0 (0.0%) |
| 5-Person Households | 35 (5.2%) | 0 (0.0%) |
| 6-Person Households | 10 (1.5%) | 0 (0.0%) |
| 7+ Person Households | 15 (2.2%) | 0 (0.0%) |
| Total | 488 (72.7%) | 183 (27.3%) |
Female Fertility in Seneca
Fertility by Age in Seneca
Average fertility rate in Seneca is 198.0 births per 1,000 women. Women in the age bracket of 20 to 34 years have the highest fertility rate with 330.0 births per 1,000 women. Women in the age bracket of 20 to 34 years acount for 100.0% of all women with births.
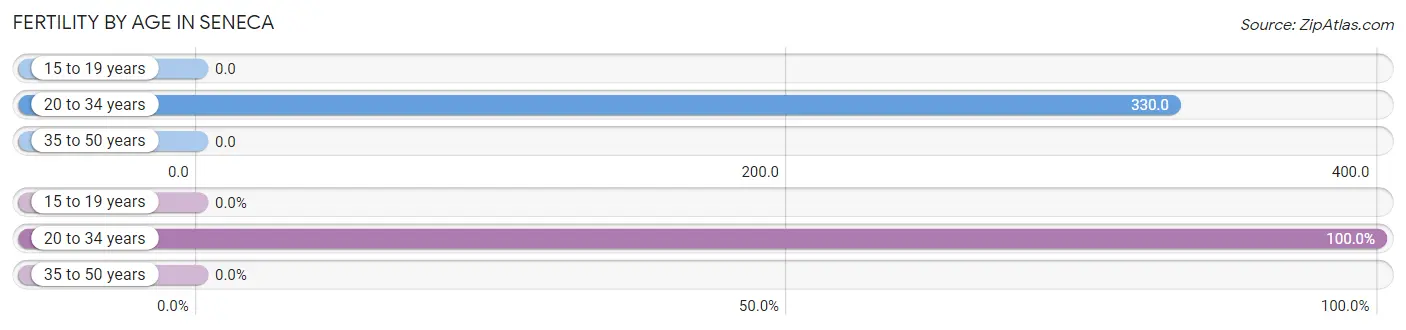
| Age Bracket | Women with Births | Births / 1,000 Women |
| 15 to 19 years | 0 (0.0%) | 0.0 |
| 20 to 34 years | 69 (100.0%) | 330.0 |
| 35 to 50 years | 0 (0.0%) | 0.0 |
| Total | 69 (100.0%) | 198.0 |
Fertility by Age by Marriage Status in Seneca
62.3% of women with births (69) in Seneca are married. The highest percentage of unmarried women with births falls into 20 to 34 years age bracket with 37.7% of them unmarried at the time of birth, while the lowest percentage of unmarried women with births belong to 20 to 34 years age bracket with 37.7% of them unmarried.
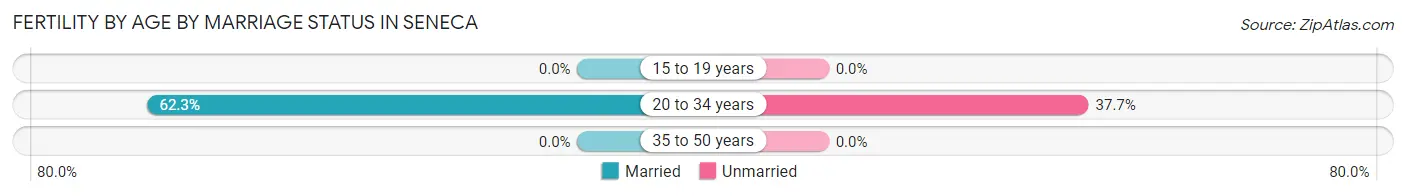
| Age Bracket | Married | Unmarried |
| 15 to 19 years | 0 (0.0%) | 0 (0.0%) |
| 20 to 34 years | 43 (62.3%) | 26 (37.7%) |
| 35 to 50 years | 0 (0.0%) | 0 (0.0%) |
| Total | 43 (62.3%) | 26 (37.7%) |
Fertility by Education in Seneca
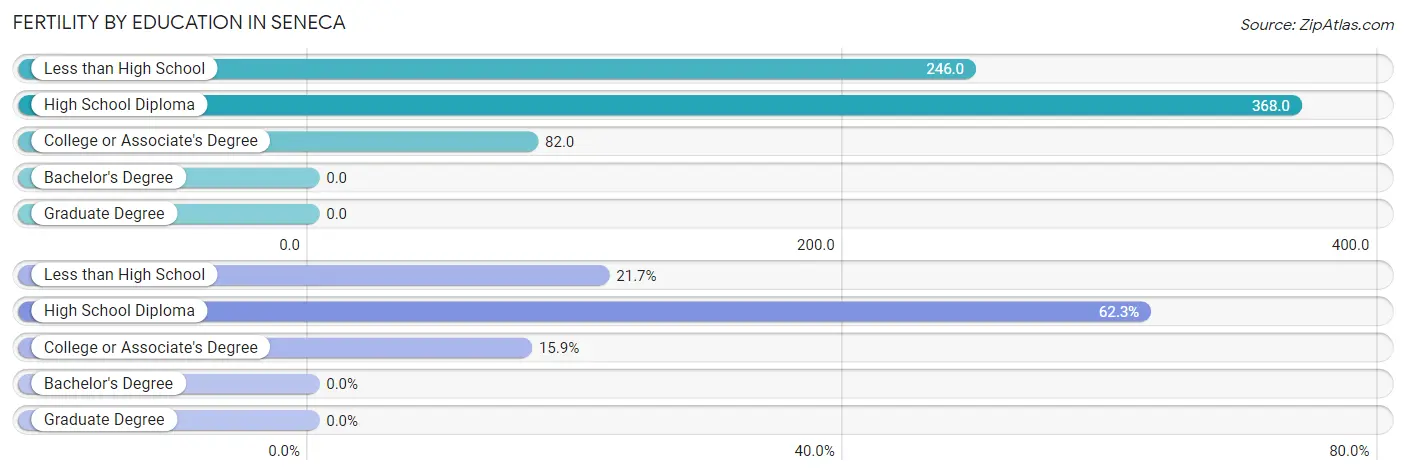
| Educational Attainment | Women with Births | Births / 1,000 Women |
| Less than High School | 15 (21.7%) | 246.0 |
| High School Diploma | 43 (62.3%) | 368.0 |
| College or Associate's Degree | 11 (15.9%) | 82.0 |
| Bachelor's Degree | 0 (0.0%) | 0.0 |
| Graduate Degree | 0 (0.0%) | 0.0 |
| Total | 69 (100.0%) | 198.0 |
Fertility by Education by Marriage Status in Seneca
37.7% of women with births in Seneca are unmarried. Women with the educational attainment of high school diploma are most likely to be married with 100.0% of them married at childbirth, while women with the educational attainment of less than high school are least likely to be married with 100.0% of them unmarried at childbirth.
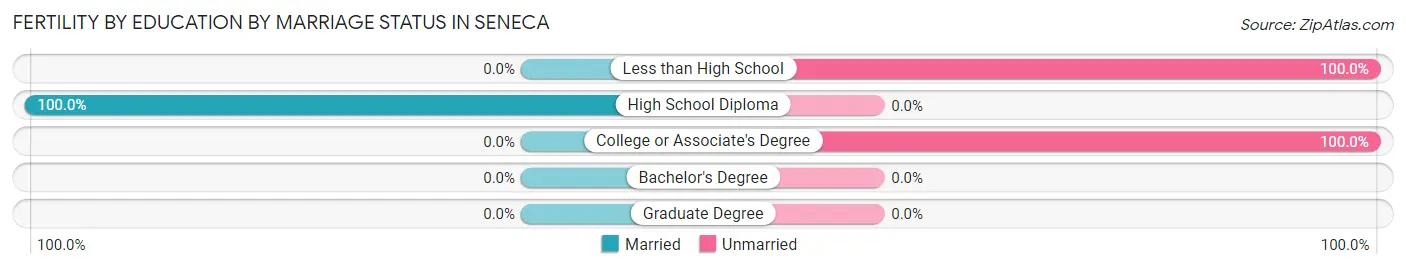
| Educational Attainment | Married | Unmarried |
| Less than High School | 0 (0.0%) | 15 (100.0%) |
| High School Diploma | 43 (100.0%) | 0 (0.0%) |
| College or Associate's Degree | 0 (0.0%) | 11 (100.0%) |
| Bachelor's Degree | 0 (0.0%) | 0 (0.0%) |
| Graduate Degree | 0 (0.0%) | 0 (0.0%) |
| Total | 43 (62.3%) | 26 (37.7%) |
Employment Characteristics in Seneca
Employment by Class of Employer in Seneca
Among the 838 employed individuals in Seneca, private company employees (576 | 68.7%), not-for-profit organizations (167 | 19.9%), and self-employed (not incorporated) (43 | 5.1%) make up the most common classes of employment.
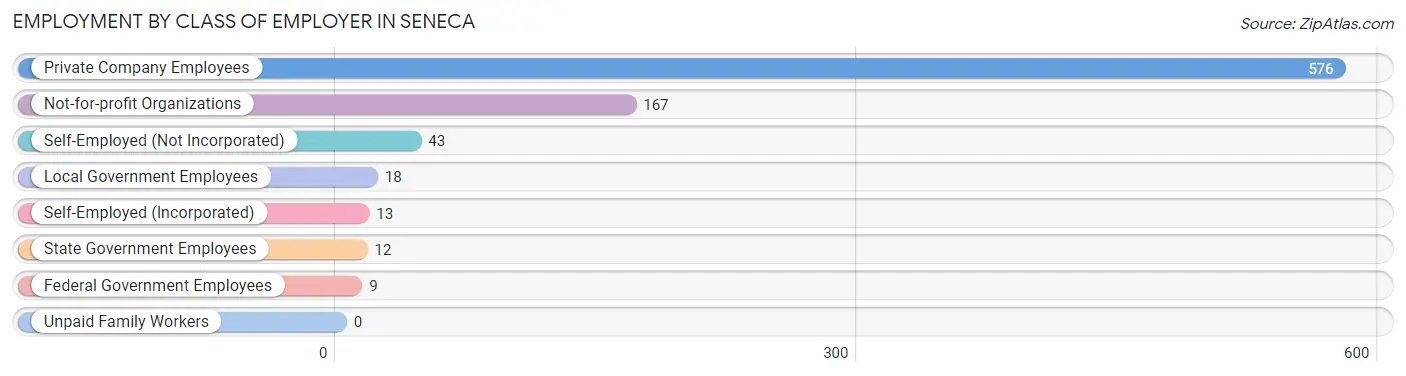
| Employer Class | # Employees | % Employees |
| Private Company Employees | 576 | 68.7% |
| Self-Employed (Incorporated) | 13 | 1.5% |
| Self-Employed (Not Incorporated) | 43 | 5.1% |
| Not-for-profit Organizations | 167 | 19.9% |
| Local Government Employees | 18 | 2.1% |
| State Government Employees | 12 | 1.4% |
| Federal Government Employees | 9 | 1.1% |
| Unpaid Family Workers | 0 | 0.0% |
| Total | 838 | 100.0% |
Employment Status by Age in Seneca
According to the labor force statistics for Seneca, out of the total population over 16 years of age (1,570), 53.4% or 838 individuals are in the labor force, with 0.1% or 1 of them unemployed. The age group with the highest labor force participation rate is 25 to 29 years, with 100.0% or 177 individuals in the labor force. Within the labor force, the 20 to 24 years age range has the highest percentage of unemployed individuals, with 0.7% or 1 of them being unemployed.
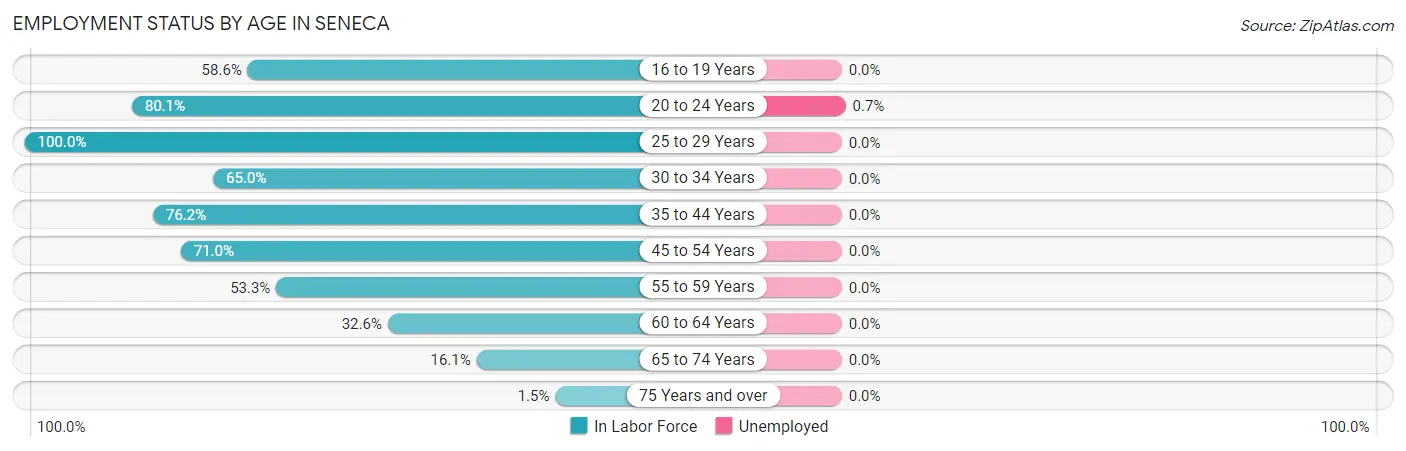
| Age Bracket | In Labor Force | Unemployed |
| 16 to 19 Years | 41 (58.6%) | 0 (0.0%) |
| 20 to 24 Years | 149 (80.1%) | 1 (0.7%) |
| 25 to 29 Years | 177 (100.0%) | 0 (0.0%) |
| 30 to 34 Years | 80 (65.0%) | 0 (0.0%) |
| 35 to 44 Years | 112 (76.2%) | 0 (0.0%) |
| 45 to 54 Years | 120 (71.0%) | 0 (0.0%) |
| 55 to 59 Years | 80 (53.3%) | 0 (0.0%) |
| 60 to 64 Years | 42 (32.6%) | 0 (0.0%) |
| 65 to 74 Years | 35 (16.1%) | 0 (0.0%) |
| 75 Years and over | 3 (1.5%) | 0 (0.0%) |
| Total | 838 (53.4%) | 1 (0.1%) |
Employment Status by Educational Attainment in Seneca
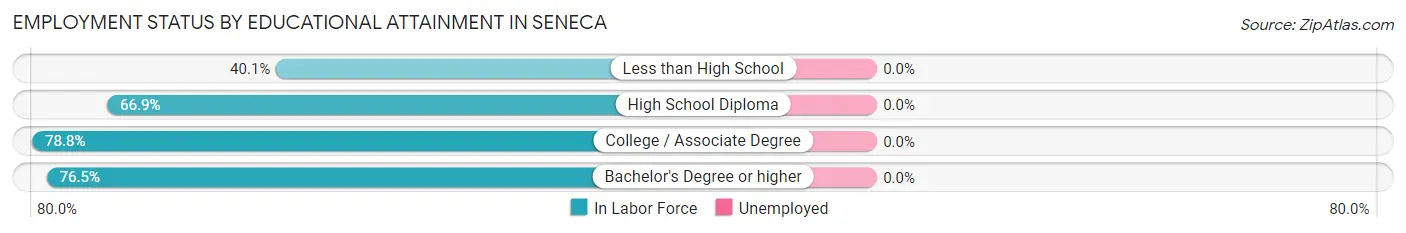
| Educational Attainment | In Labor Force | Unemployed |
| Less than High School | 61 (40.1%) | 0 (0.0%) |
| High School Diploma | 188 (66.9%) | 0 (0.0%) |
| College / Associate Degree | 287 (78.8%) | 0 (0.0%) |
| Bachelor's Degree or higher | 75 (76.5%) | 0 (0.0%) |
| Total | 611 (68.3%) | 0 (0.0%) |
Employment Occupations by Sex in Seneca
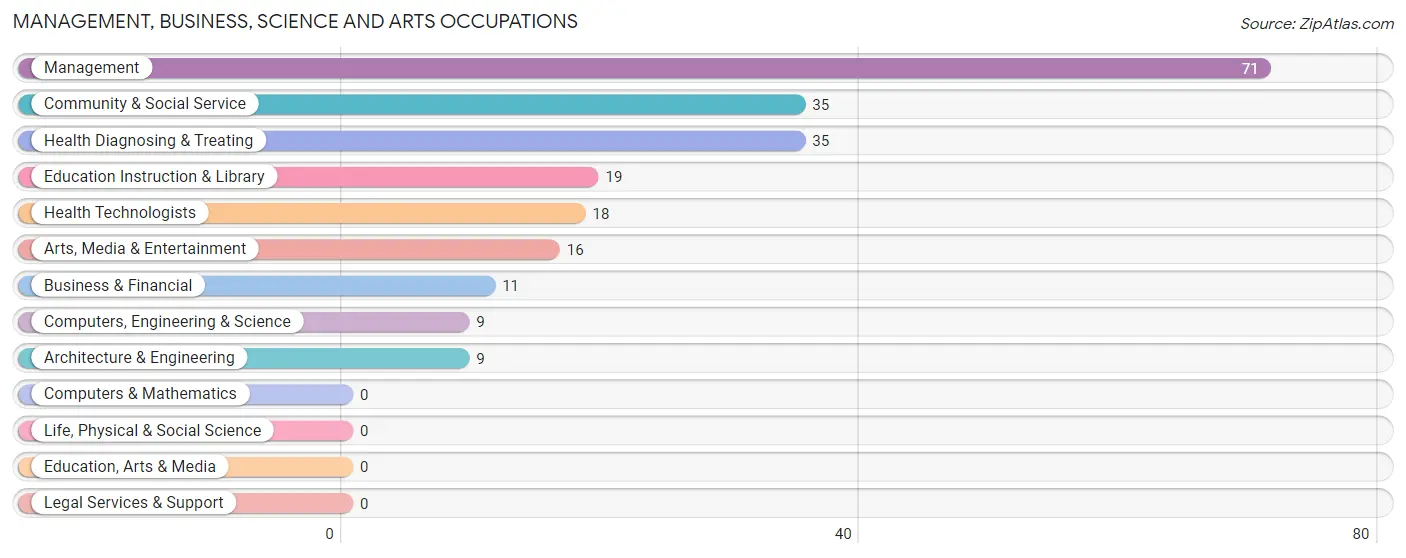
Management, Business, Science and Arts Occupations
The most common Management, Business, Science and Arts occupations in Seneca are Management (71 | 8.5%), Community & Social Service (35 | 4.2%), Health Diagnosing & Treating (35 | 4.2%), Education Instruction & Library (19 | 2.3%), and Health Technologists (18 | 2.1%).
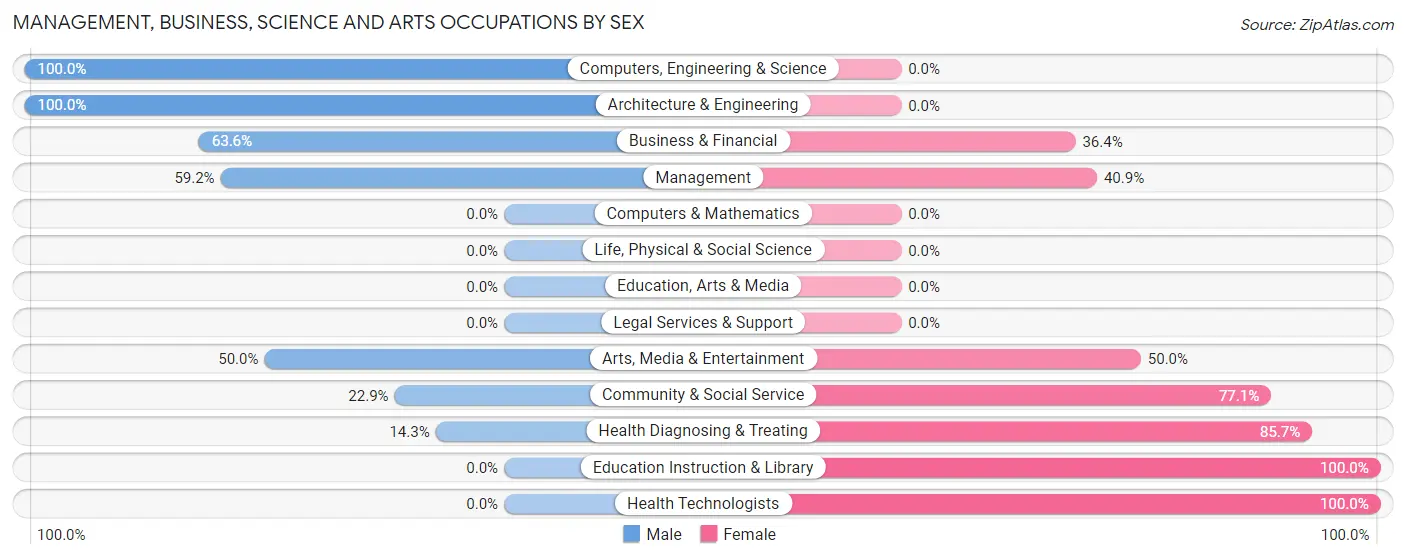
Management, Business, Science and Arts Occupations by Sex
Within the Management, Business, Science and Arts occupations in Seneca, the most male-oriented occupations are Computers, Engineering & Science (100.0%), Architecture & Engineering (100.0%), and Business & Financial (63.6%), while the most female-oriented occupations are Education Instruction & Library (100.0%), Health Technologists (100.0%), and Health Diagnosing & Treating (85.7%).
| Occupation | Male | Female |
| Management | 42 (59.2%) | 29 (40.8%) |
| Business & Financial | 7 (63.6%) | 4 (36.4%) |
| Computers, Engineering & Science | 9 (100.0%) | 0 (0.0%) |
| Computers & Mathematics | 0 (0.0%) | 0 (0.0%) |
| Architecture & Engineering | 9 (100.0%) | 0 (0.0%) |
| Life, Physical & Social Science | 0 (0.0%) | 0 (0.0%) |
| Community & Social Service | 8 (22.9%) | 27 (77.1%) |
| Education, Arts & Media | 0 (0.0%) | 0 (0.0%) |
| Legal Services & Support | 0 (0.0%) | 0 (0.0%) |
| Education Instruction & Library | 0 (0.0%) | 19 (100.0%) |
| Arts, Media & Entertainment | 8 (50.0%) | 8 (50.0%) |
| Health Diagnosing & Treating | 5 (14.3%) | 30 (85.7%) |
| Health Technologists | 0 (0.0%) | 18 (100.0%) |
| Total (Category) | 71 (44.1%) | 90 (55.9%) |
| Total (Overall) | 460 (54.9%) | 378 (45.1%) |
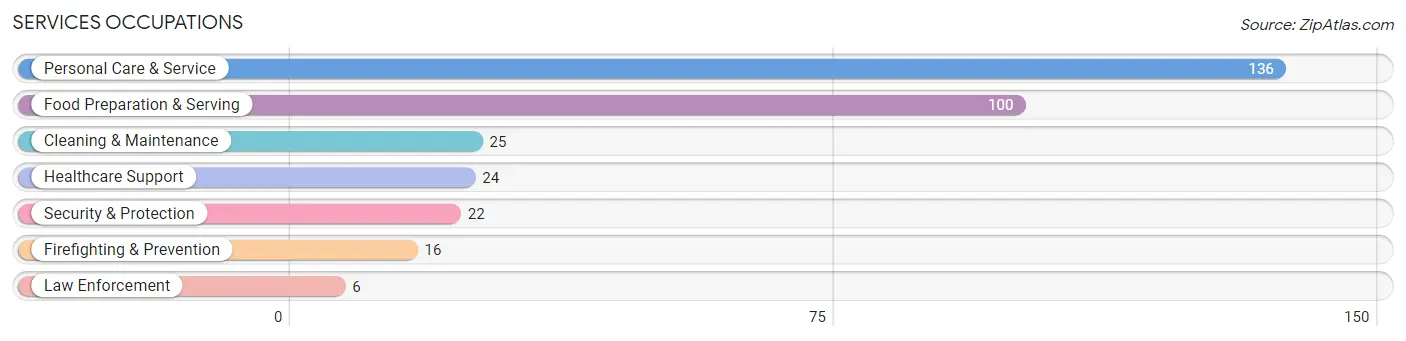
Services Occupations
The most common Services occupations in Seneca are Personal Care & Service (136 | 16.2%), Food Preparation & Serving (100 | 11.9%), Cleaning & Maintenance (25 | 3.0%), Healthcare Support (24 | 2.9%), and Security & Protection (22 | 2.6%).
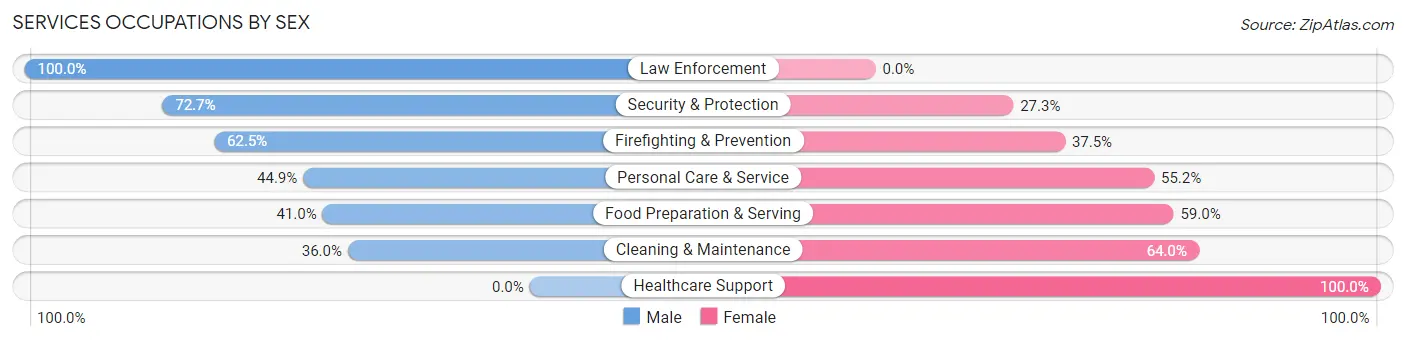
Services Occupations by Sex
Within the Services occupations in Seneca, the most male-oriented occupations are Law Enforcement (100.0%), Security & Protection (72.7%), and Firefighting & Prevention (62.5%), while the most female-oriented occupations are Healthcare Support (100.0%), Cleaning & Maintenance (64.0%), and Food Preparation & Serving (59.0%).
| Occupation | Male | Female |
| Healthcare Support | 0 (0.0%) | 24 (100.0%) |
| Security & Protection | 16 (72.7%) | 6 (27.3%) |
| Firefighting & Prevention | 10 (62.5%) | 6 (37.5%) |
| Law Enforcement | 6 (100.0%) | 0 (0.0%) |
| Food Preparation & Serving | 41 (41.0%) | 59 (59.0%) |
| Cleaning & Maintenance | 9 (36.0%) | 16 (64.0%) |
| Personal Care & Service | 61 (44.9%) | 75 (55.1%) |
| Total (Category) | 127 (41.4%) | 180 (58.6%) |
| Total (Overall) | 460 (54.9%) | 378 (45.1%) |
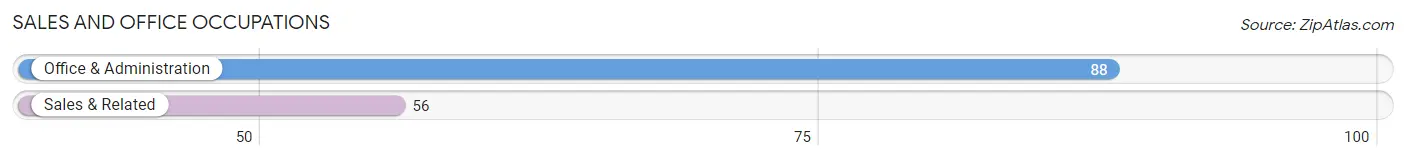
Sales and Office Occupations
The most common Sales and Office occupations in Seneca are Office & Administration (88 | 10.5%), and Sales & Related (56 | 6.7%).
Sales and Office Occupations by Sex
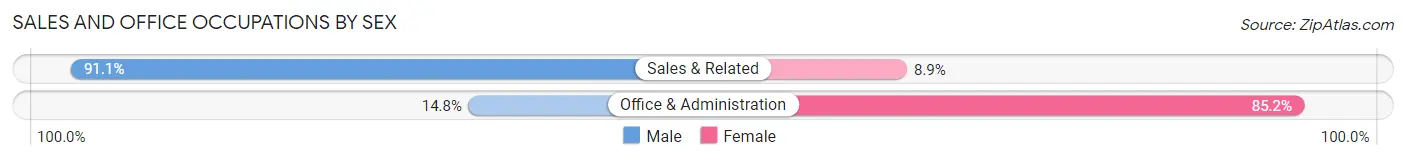
| Occupation | Male | Female |
| Sales & Related | 51 (91.1%) | 5 (8.9%) |
| Office & Administration | 13 (14.8%) | 75 (85.2%) |
| Total (Category) | 64 (44.4%) | 80 (55.6%) |
| Total (Overall) | 460 (54.9%) | 378 (45.1%) |
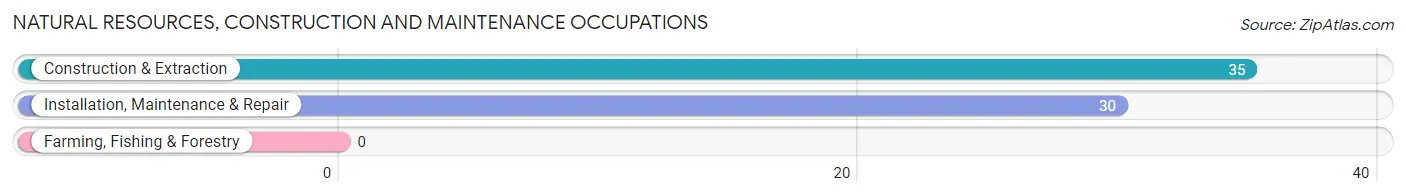
Natural Resources, Construction and Maintenance Occupations
The most common Natural Resources, Construction and Maintenance occupations in Seneca are Construction & Extraction (35 | 4.2%), and Installation, Maintenance & Repair (30 | 3.6%).
Natural Resources, Construction and Maintenance Occupations by Sex
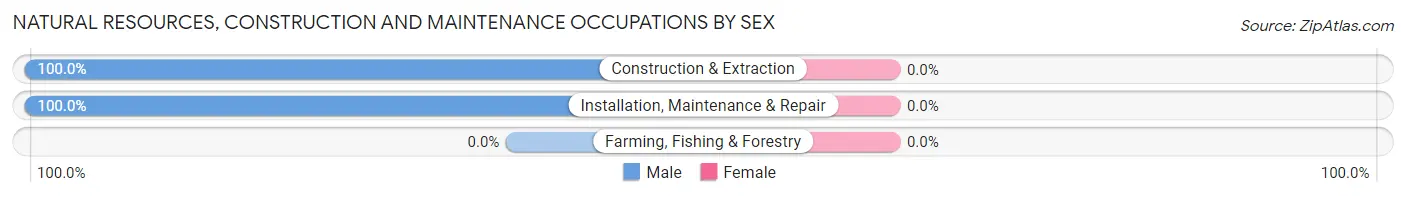
| Occupation | Male | Female |
| Farming, Fishing & Forestry | 0 (0.0%) | 0 (0.0%) |
| Construction & Extraction | 35 (100.0%) | 0 (0.0%) |
| Installation, Maintenance & Repair | 30 (100.0%) | 0 (0.0%) |
| Total (Category) | 65 (100.0%) | 0 (0.0%) |
| Total (Overall) | 460 (54.9%) | 378 (45.1%) |
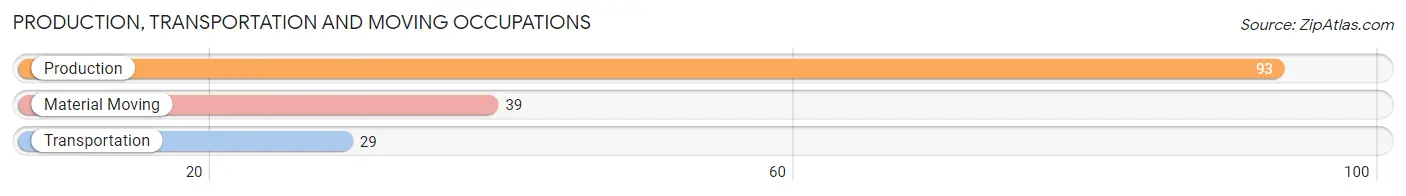
Production, Transportation and Moving Occupations
The most common Production, Transportation and Moving occupations in Seneca are Production (93 | 11.1%), Material Moving (39 | 4.6%), and Transportation (29 | 3.5%).
Production, Transportation and Moving Occupations by Sex
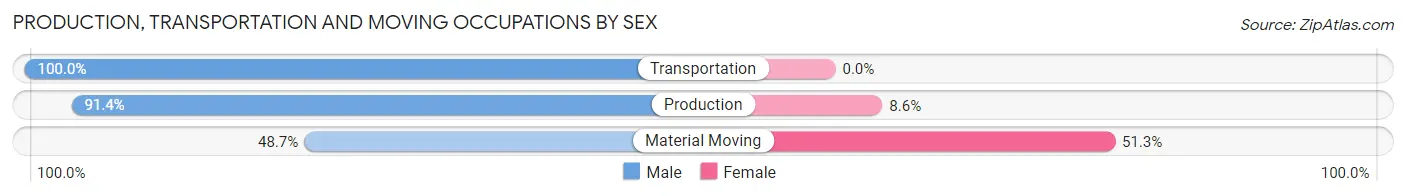
| Occupation | Male | Female |
| Production | 85 (91.4%) | 8 (8.6%) |
| Transportation | 29 (100.0%) | 0 (0.0%) |
| Material Moving | 19 (48.7%) | 20 (51.3%) |
| Total (Category) | 133 (82.6%) | 28 (17.4%) |
| Total (Overall) | 460 (54.9%) | 378 (45.1%) |
Employment Industries by Sex in Seneca
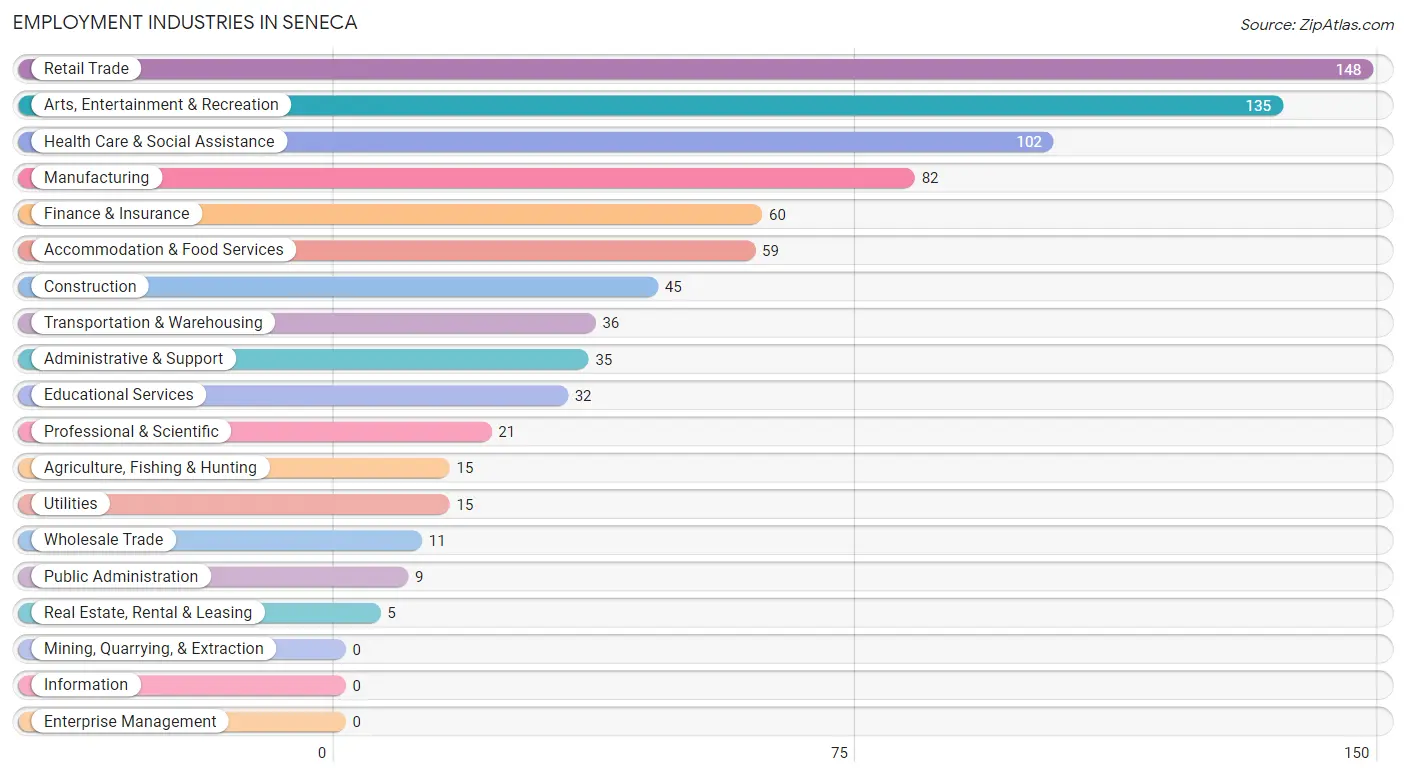
Employment Industries in Seneca
The major employment industries in Seneca include Retail Trade (148 | 17.7%), Arts, Entertainment & Recreation (135 | 16.1%), Health Care & Social Assistance (102 | 12.2%), Manufacturing (82 | 9.8%), and Finance & Insurance (60 | 7.2%).
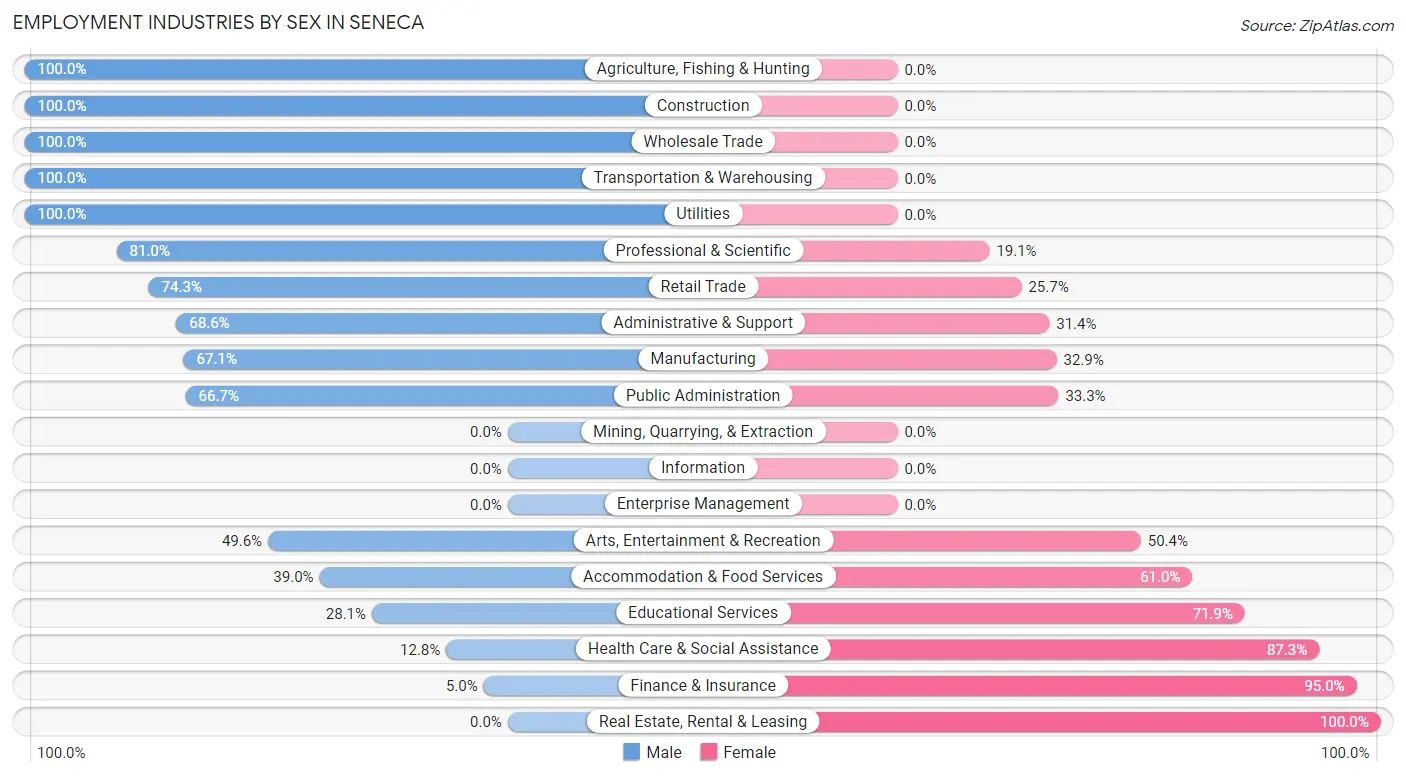
Employment Industries by Sex in Seneca
The Seneca industries that see more men than women are Agriculture, Fishing & Hunting (100.0%), Construction (100.0%), and Wholesale Trade (100.0%), whereas the industries that tend to have a higher number of women are Real Estate, Rental & Leasing (100.0%), Finance & Insurance (95.0%), and Health Care & Social Assistance (87.3%).
| Industry | Male | Female |
| Agriculture, Fishing & Hunting | 15 (100.0%) | 0 (0.0%) |
| Mining, Quarrying, & Extraction | 0 (0.0%) | 0 (0.0%) |
| Construction | 45 (100.0%) | 0 (0.0%) |
| Manufacturing | 55 (67.1%) | 27 (32.9%) |
| Wholesale Trade | 11 (100.0%) | 0 (0.0%) |
| Retail Trade | 110 (74.3%) | 38 (25.7%) |
| Transportation & Warehousing | 36 (100.0%) | 0 (0.0%) |
| Utilities | 15 (100.0%) | 0 (0.0%) |
| Information | 0 (0.0%) | 0 (0.0%) |
| Finance & Insurance | 3 (5.0%) | 57 (95.0%) |
| Real Estate, Rental & Leasing | 0 (0.0%) | 5 (100.0%) |
| Professional & Scientific | 17 (80.9%) | 4 (19.1%) |
| Enterprise Management | 0 (0.0%) | 0 (0.0%) |
| Administrative & Support | 24 (68.6%) | 11 (31.4%) |
| Educational Services | 9 (28.1%) | 23 (71.9%) |
| Health Care & Social Assistance | 13 (12.8%) | 89 (87.3%) |
| Arts, Entertainment & Recreation | 67 (49.6%) | 68 (50.4%) |
| Accommodation & Food Services | 23 (39.0%) | 36 (61.0%) |
| Public Administration | 6 (66.7%) | 3 (33.3%) |
| Total | 460 (54.9%) | 378 (45.1%) |
Education in Seneca
School Enrollment in Seneca
The most common levels of schooling among the 365 students in Seneca are middle school (147 | 40.3%), high school (79 | 21.6%), and elementary school (75 | 20.5%).
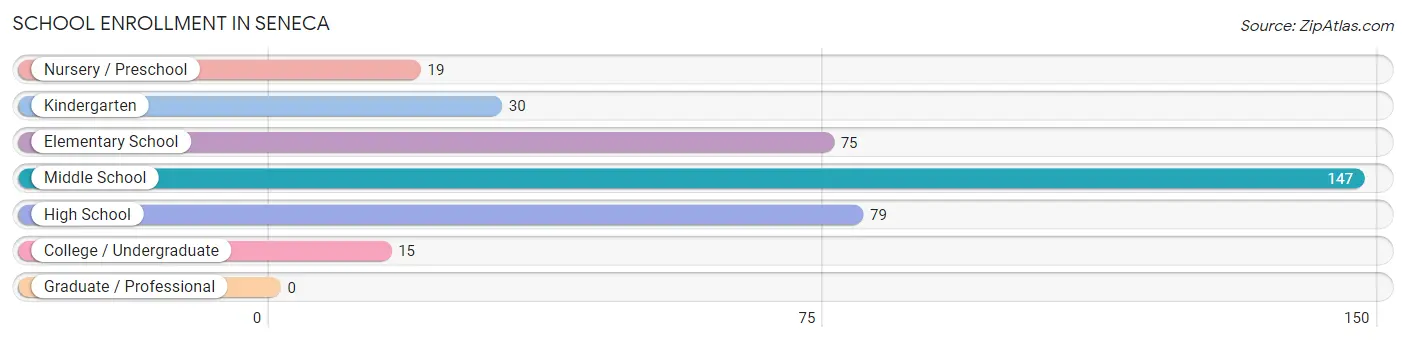
| School Level | # Students | % Students |
| Nursery / Preschool | 19 | 5.2% |
| Kindergarten | 30 | 8.2% |
| Elementary School | 75 | 20.5% |
| Middle School | 147 | 40.3% |
| High School | 79 | 21.6% |
| College / Undergraduate | 15 | 4.1% |
| Graduate / Professional | 0 | 0.0% |
| Total | 365 | 100.0% |
School Enrollment by Age by Funding Source in Seneca
Out of a total of 365 students who are enrolled in schools in Seneca, 30 (8.2%) attend a private institution, while the remaining 335 (91.8%) are enrolled in public schools. The age group of 3 to 4 year olds has the highest likelihood of being enrolled in private schools, with 5 (38.5% in the age bracket) enrolled. Conversely, the age group of 18 to 19 year olds has the lowest likelihood of being enrolled in a private school, with 4 (100.0% in the age bracket) attending a public institution.
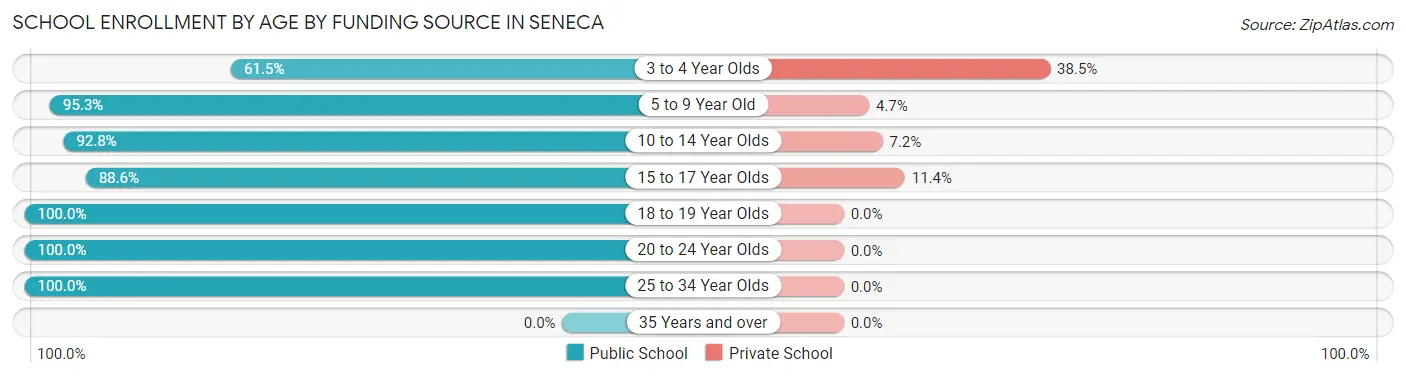
| Age Bracket | Public School | Private School |
| 3 to 4 Year Olds | 8 (61.5%) | 5 (38.5%) |
| 5 to 9 Year Old | 101 (95.3%) | 5 (4.7%) |
| 10 to 14 Year Olds | 141 (92.8%) | 11 (7.2%) |
| 15 to 17 Year Olds | 70 (88.6%) | 9 (11.4%) |
| 18 to 19 Year Olds | 4 (100.0%) | 0 (0.0%) |
| 20 to 24 Year Olds | 6 (100.0%) | 0 (0.0%) |
| 25 to 34 Year Olds | 5 (100.0%) | 0 (0.0%) |
| 35 Years and over | 0 (0.0%) | 0 (0.0%) |
| Total | 335 (91.8%) | 30 (8.2%) |
Educational Attainment by Field of Study in Seneca
Education (54 | 30.2%), business (38 | 21.2%), science & technology (36 | 20.1%), liberal arts & history (16 | 8.9%), and literature & languages (8 | 4.5%) are the most common fields of study among 179 individuals in Seneca who have obtained a bachelor's degree or higher.
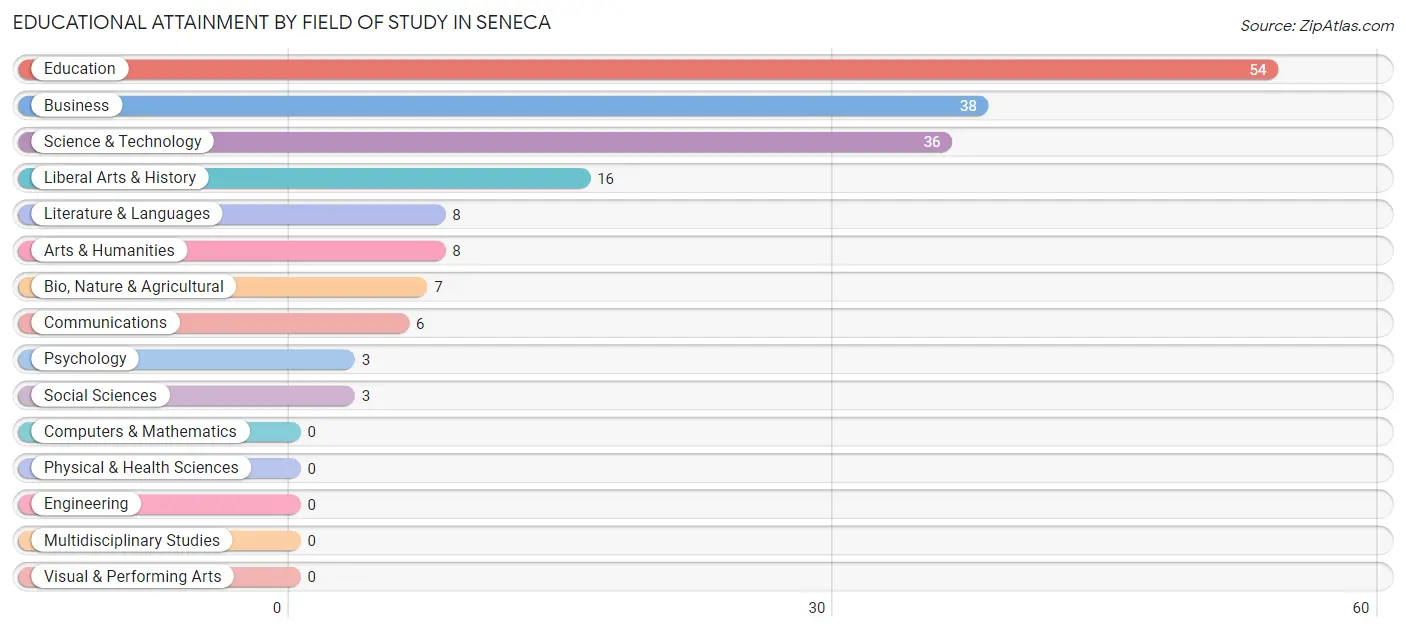
| Field of Study | # Graduates | % Graduates |
| Computers & Mathematics | 0 | 0.0% |
| Bio, Nature & Agricultural | 7 | 3.9% |
| Physical & Health Sciences | 0 | 0.0% |
| Psychology | 3 | 1.7% |
| Social Sciences | 3 | 1.7% |
| Engineering | 0 | 0.0% |
| Multidisciplinary Studies | 0 | 0.0% |
| Science & Technology | 36 | 20.1% |
| Business | 38 | 21.2% |
| Education | 54 | 30.2% |
| Literature & Languages | 8 | 4.5% |
| Liberal Arts & History | 16 | 8.9% |
| Visual & Performing Arts | 0 | 0.0% |
| Communications | 6 | 3.4% |
| Arts & Humanities | 8 | 4.5% |
| Total | 179 | 100.0% |
Transportation & Commute in Seneca
Vehicle Availability by Sex in Seneca
The most prevalent vehicle ownership categories in Seneca are males with 2 vehicles (201, accounting for 43.7%) and females with 2 vehicles (144, making up 53.2%).
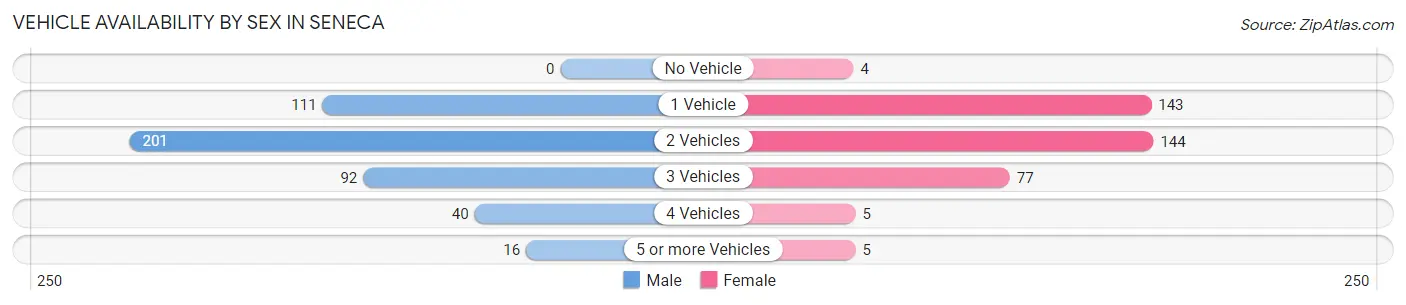
| Vehicles Available | Male | Female |
| No Vehicle | 0 (0.0%) | 4 (1.1%) |
| 1 Vehicle | 111 (24.1%) | 143 (37.8%) |
| 2 Vehicles | 201 (43.7%) | 144 (38.1%) |
| 3 Vehicles | 92 (20.0%) | 77 (20.4%) |
| 4 Vehicles | 40 (8.7%) | 5 (1.3%) |
| 5 or more Vehicles | 16 (3.5%) | 5 (1.3%) |
| Total | 460 (100.0%) | 378 (100.0%) |
Commute Time in Seneca
The most frequently occuring commute durations in Seneca are 20 to 24 minutes (181 commuters, 22.7%), 5 to 9 minutes (166 commuters, 20.8%), and 30 to 34 minutes (101 commuters, 12.7%).
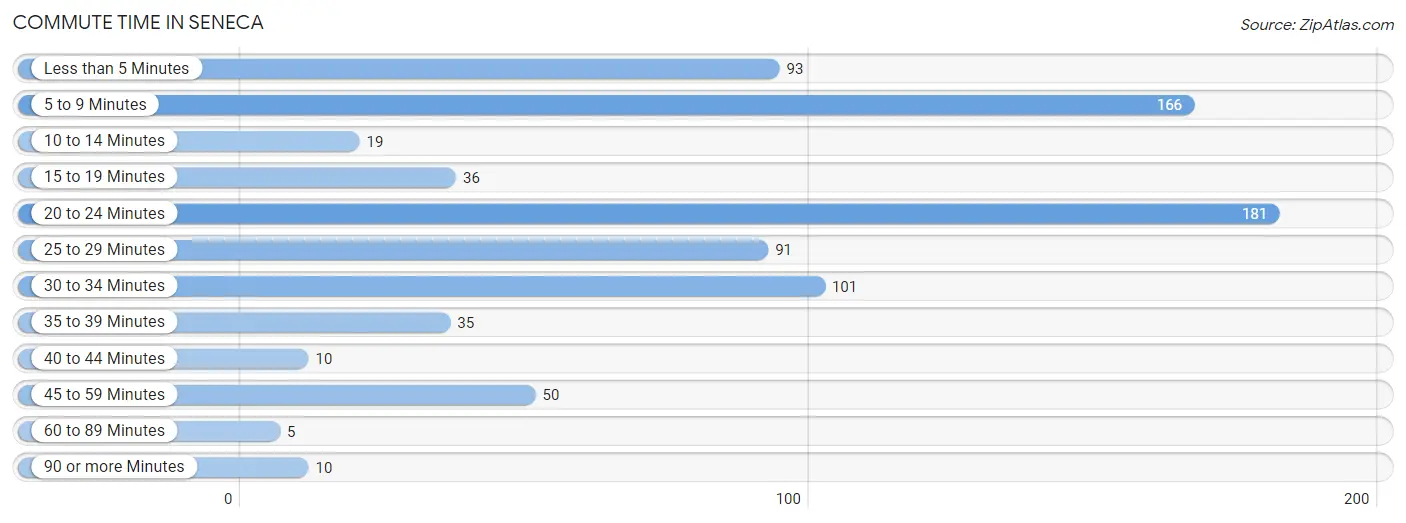
| Commute Time | # Commuters | % Commuters |
| Less than 5 Minutes | 93 | 11.7% |
| 5 to 9 Minutes | 166 | 20.8% |
| 10 to 14 Minutes | 19 | 2.4% |
| 15 to 19 Minutes | 36 | 4.5% |
| 20 to 24 Minutes | 181 | 22.7% |
| 25 to 29 Minutes | 91 | 11.4% |
| 30 to 34 Minutes | 101 | 12.7% |
| 35 to 39 Minutes | 35 | 4.4% |
| 40 to 44 Minutes | 10 | 1.3% |
| 45 to 59 Minutes | 50 | 6.3% |
| 60 to 89 Minutes | 5 | 0.6% |
| 90 or more Minutes | 10 | 1.3% |
Commute Time by Sex in Seneca
The most common commute times in Seneca are 20 to 24 minutes (111 commuters, 26.2%) for males and 5 to 9 minutes (90 commuters, 24.1%) for females.
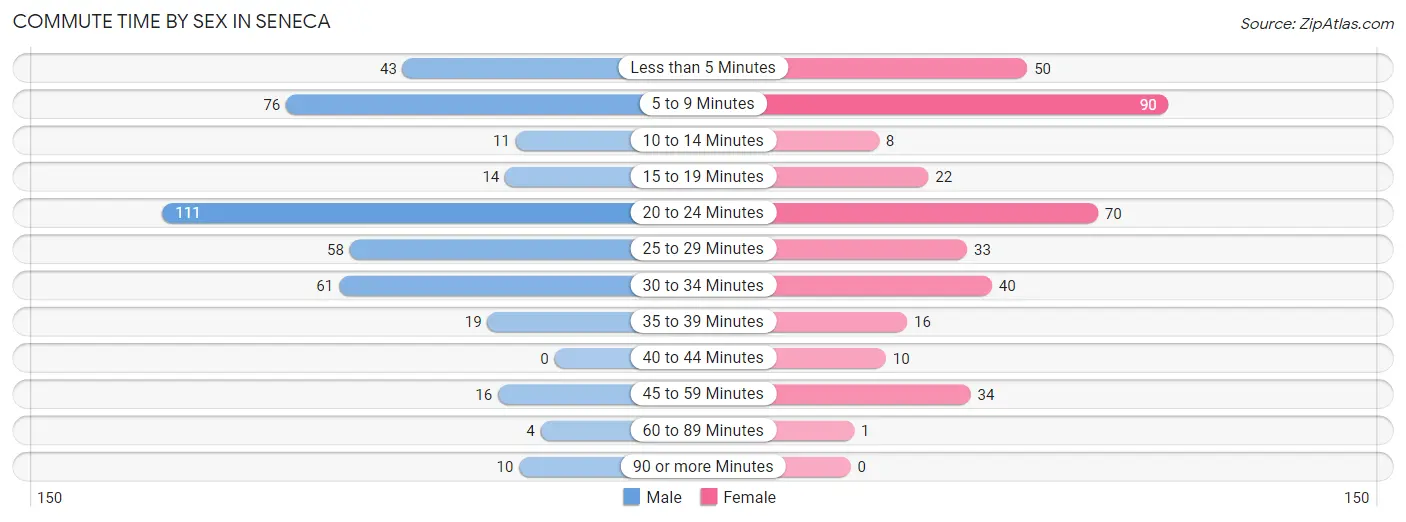
| Commute Time | Male | Female |
| Less than 5 Minutes | 43 (10.2%) | 50 (13.4%) |
| 5 to 9 Minutes | 76 (18.0%) | 90 (24.1%) |
| 10 to 14 Minutes | 11 (2.6%) | 8 (2.1%) |
| 15 to 19 Minutes | 14 (3.3%) | 22 (5.9%) |
| 20 to 24 Minutes | 111 (26.2%) | 70 (18.7%) |
| 25 to 29 Minutes | 58 (13.7%) | 33 (8.8%) |
| 30 to 34 Minutes | 61 (14.4%) | 40 (10.7%) |
| 35 to 39 Minutes | 19 (4.5%) | 16 (4.3%) |
| 40 to 44 Minutes | 0 (0.0%) | 10 (2.7%) |
| 45 to 59 Minutes | 16 (3.8%) | 34 (9.1%) |
| 60 to 89 Minutes | 4 (0.9%) | 1 (0.3%) |
| 90 or more Minutes | 10 (2.4%) | 0 (0.0%) |
Time of Departure to Work by Sex in Seneca
The most frequent times of departure to work in Seneca are 12:00 AM to 4:59 AM (82, 19.4%) for males and 7:00 AM to 7:29 AM (112, 29.9%) for females.
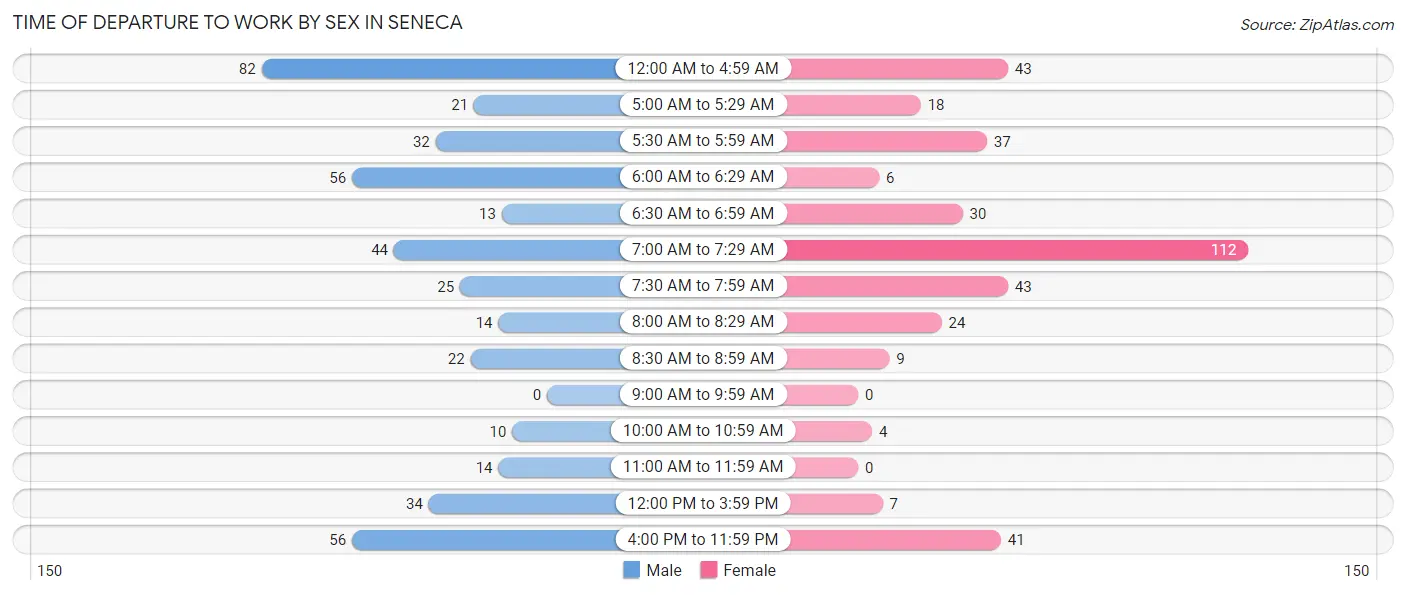
| Time of Departure | Male | Female |
| 12:00 AM to 4:59 AM | 82 (19.4%) | 43 (11.5%) |
| 5:00 AM to 5:29 AM | 21 (5.0%) | 18 (4.8%) |
| 5:30 AM to 5:59 AM | 32 (7.6%) | 37 (9.9%) |
| 6:00 AM to 6:29 AM | 56 (13.2%) | 6 (1.6%) |
| 6:30 AM to 6:59 AM | 13 (3.1%) | 30 (8.0%) |
| 7:00 AM to 7:29 AM | 44 (10.4%) | 112 (29.9%) |
| 7:30 AM to 7:59 AM | 25 (5.9%) | 43 (11.5%) |
| 8:00 AM to 8:29 AM | 14 (3.3%) | 24 (6.4%) |
| 8:30 AM to 8:59 AM | 22 (5.2%) | 9 (2.4%) |
| 9:00 AM to 9:59 AM | 0 (0.0%) | 0 (0.0%) |
| 10:00 AM to 10:59 AM | 10 (2.4%) | 4 (1.1%) |
| 11:00 AM to 11:59 AM | 14 (3.3%) | 0 (0.0%) |
| 12:00 PM to 3:59 PM | 34 (8.0%) | 7 (1.9%) |
| 4:00 PM to 11:59 PM | 56 (13.2%) | 41 (11.0%) |
| Total | 423 (100.0%) | 374 (100.0%) |
Housing Occupancy in Seneca
Occupancy by Ownership in Seneca
Of the total 671 dwellings in Seneca, owner-occupied units account for 434 (64.7%), while renter-occupied units make up 237 (35.3%).
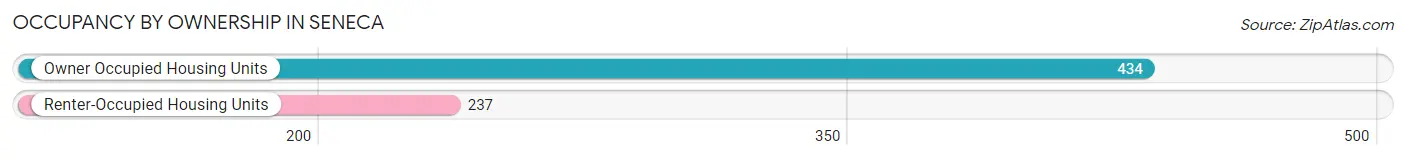
| Occupancy | # Housing Units | % Housing Units |
| Owner Occupied Housing Units | 434 | 64.7% |
| Renter-Occupied Housing Units | 237 | 35.3% |
| Total Occupied Housing Units | 671 | 100.0% |
Occupancy by Household Size in Seneca
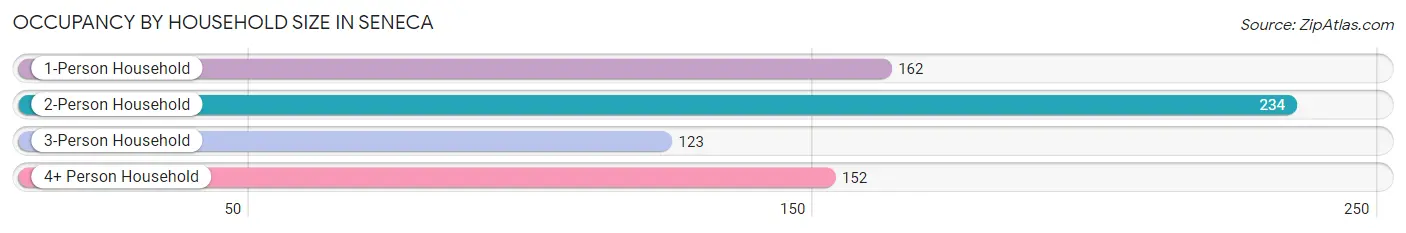
| Household Size | # Housing Units | % Housing Units |
| 1-Person Household | 162 | 24.1% |
| 2-Person Household | 234 | 34.9% |
| 3-Person Household | 123 | 18.3% |
| 4+ Person Household | 152 | 22.7% |
| Total Housing Units | 671 | 100.0% |
Occupancy by Ownership by Household Size in Seneca
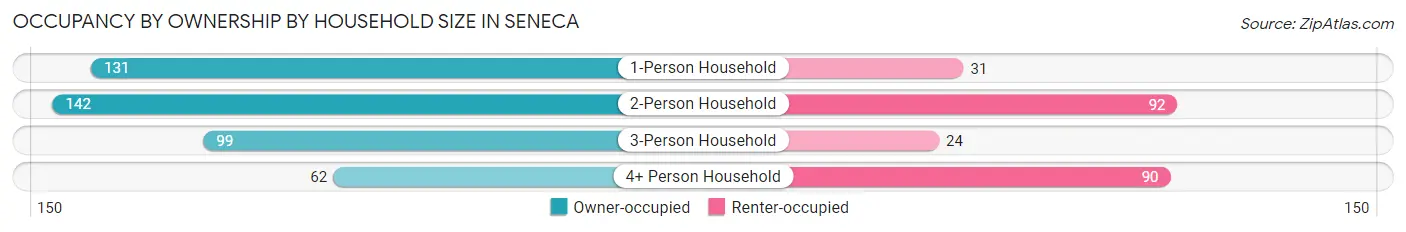
| Household Size | Owner-occupied | Renter-occupied |
| 1-Person Household | 131 (80.9%) | 31 (19.1%) |
| 2-Person Household | 142 (60.7%) | 92 (39.3%) |
| 3-Person Household | 99 (80.5%) | 24 (19.5%) |
| 4+ Person Household | 62 (40.8%) | 90 (59.2%) |
| Total Housing Units | 434 (64.7%) | 237 (35.3%) |
Occupancy by Educational Attainment in Seneca
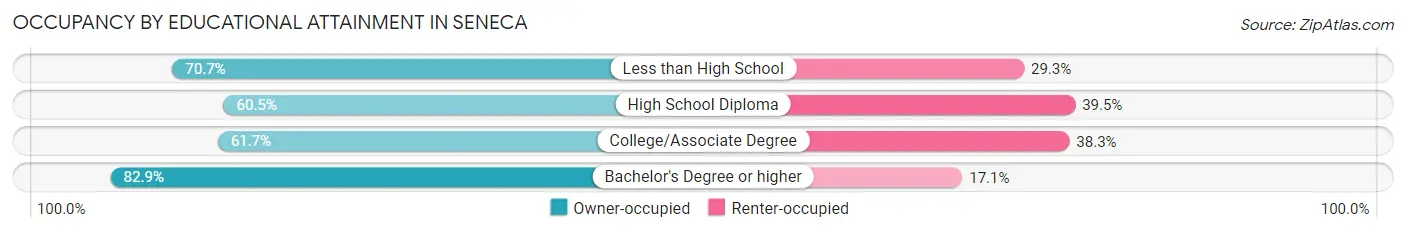
| Household Size | Owner-occupied | Renter-occupied |
| Less than High School | 41 (70.7%) | 17 (29.3%) |
| High School Diploma | 135 (60.5%) | 88 (39.5%) |
| College/Associate Degree | 190 (61.7%) | 118 (38.3%) |
| Bachelor's Degree or higher | 68 (82.9%) | 14 (17.1%) |
Occupancy by Age of Householder in Seneca
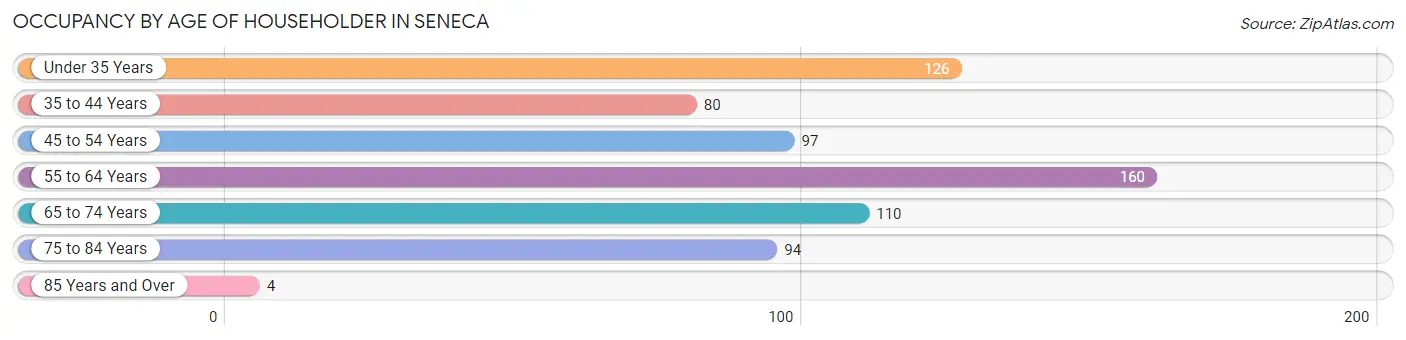
| Age Bracket | # Households | % Households |
| Under 35 Years | 126 | 18.8% |
| 35 to 44 Years | 80 | 11.9% |
| 45 to 54 Years | 97 | 14.5% |
| 55 to 64 Years | 160 | 23.8% |
| 65 to 74 Years | 110 | 16.4% |
| 75 to 84 Years | 94 | 14.0% |
| 85 Years and Over | 4 | 0.6% |
| Total | 671 | 100.0% |
Housing Finances in Seneca
Median Income by Occupancy in Seneca
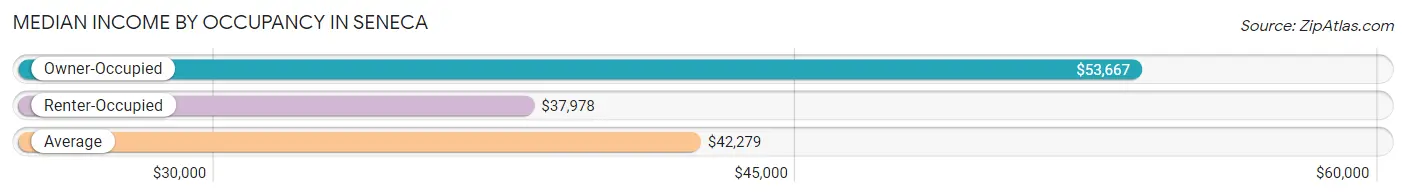
| Occupancy Type | # Households | Median Income |
| Owner-Occupied | 434 (64.7%) | $53,667 |
| Renter-Occupied | 237 (35.3%) | $37,978 |
| Average | 671 (100.0%) | $42,279 |
Occupancy by Householder Income Bracket in Seneca
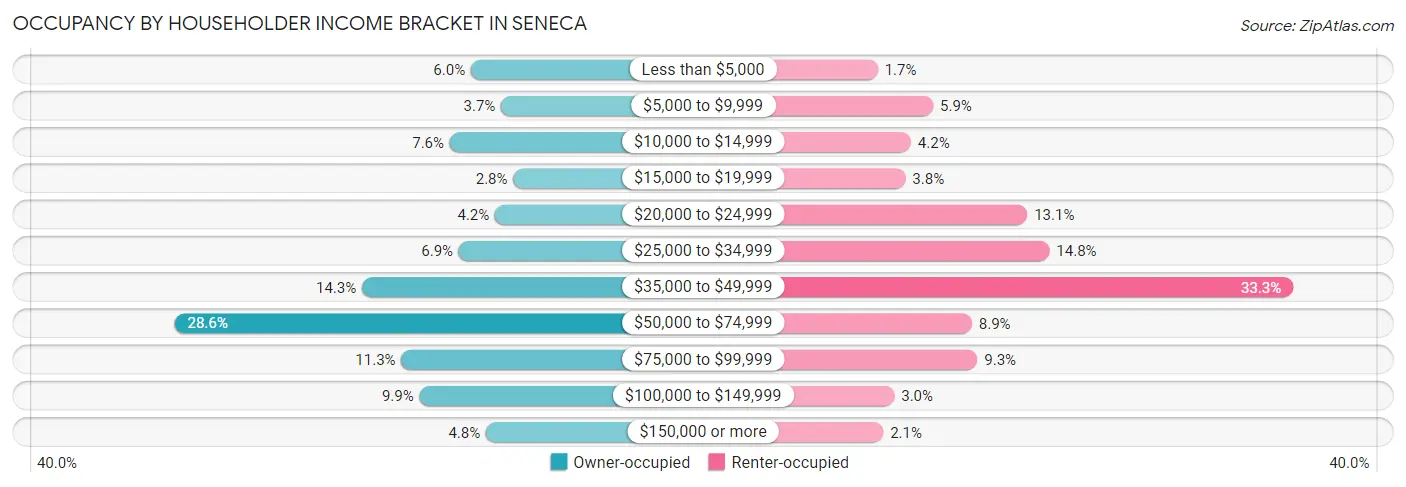
| Income Bracket | Owner-occupied | Renter-occupied |
| Less than $5,000 | 26 (6.0%) | 4 (1.7%) |
| $5,000 to $9,999 | 16 (3.7%) | 14 (5.9%) |
| $10,000 to $14,999 | 33 (7.6%) | 10 (4.2%) |
| $15,000 to $19,999 | 12 (2.8%) | 9 (3.8%) |
| $20,000 to $24,999 | 18 (4.2%) | 31 (13.1%) |
| $25,000 to $34,999 | 30 (6.9%) | 35 (14.8%) |
| $35,000 to $49,999 | 62 (14.3%) | 79 (33.3%) |
| $50,000 to $74,999 | 124 (28.6%) | 21 (8.9%) |
| $75,000 to $99,999 | 49 (11.3%) | 22 (9.3%) |
| $100,000 to $149,999 | 43 (9.9%) | 7 (2.9%) |
| $150,000 or more | 21 (4.8%) | 5 (2.1%) |
| Total | 434 (100.0%) | 237 (100.0%) |
Monthly Housing Cost Tiers in Seneca
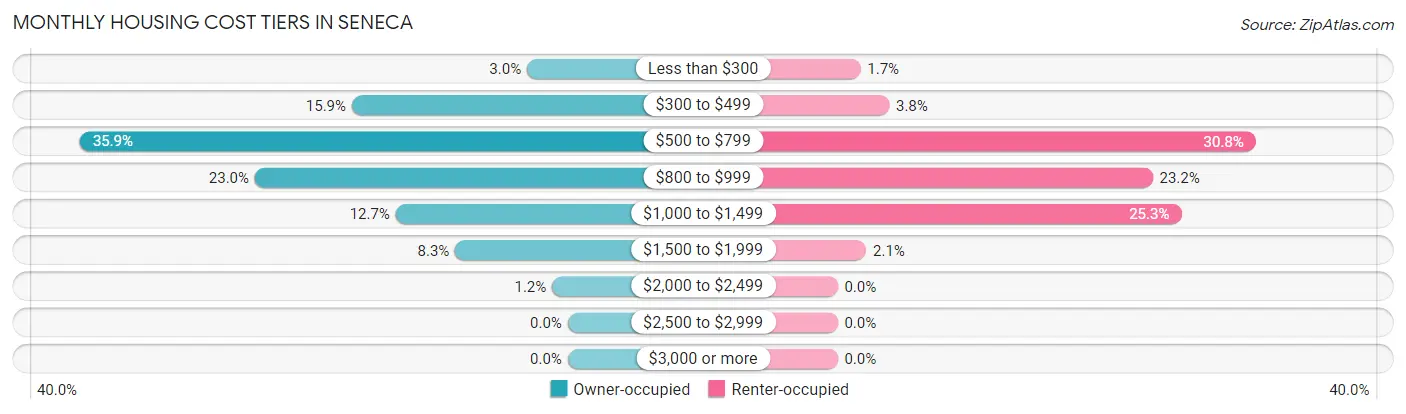
| Monthly Cost | Owner-occupied | Renter-occupied |
| Less than $300 | 13 (3.0%) | 4 (1.7%) |
| $300 to $499 | 69 (15.9%) | 9 (3.8%) |
| $500 to $799 | 156 (35.9%) | 73 (30.8%) |
| $800 to $999 | 100 (23.0%) | 55 (23.2%) |
| $1,000 to $1,499 | 55 (12.7%) | 60 (25.3%) |
| $1,500 to $1,999 | 36 (8.3%) | 5 (2.1%) |
| $2,000 to $2,499 | 5 (1.1%) | 0 (0.0%) |
| $2,500 to $2,999 | 0 (0.0%) | 0 (0.0%) |
| $3,000 or more | 0 (0.0%) | 0 (0.0%) |
| Total | 434 (100.0%) | 237 (100.0%) |
Physical Housing Characteristics in Seneca
Housing Structures in Seneca
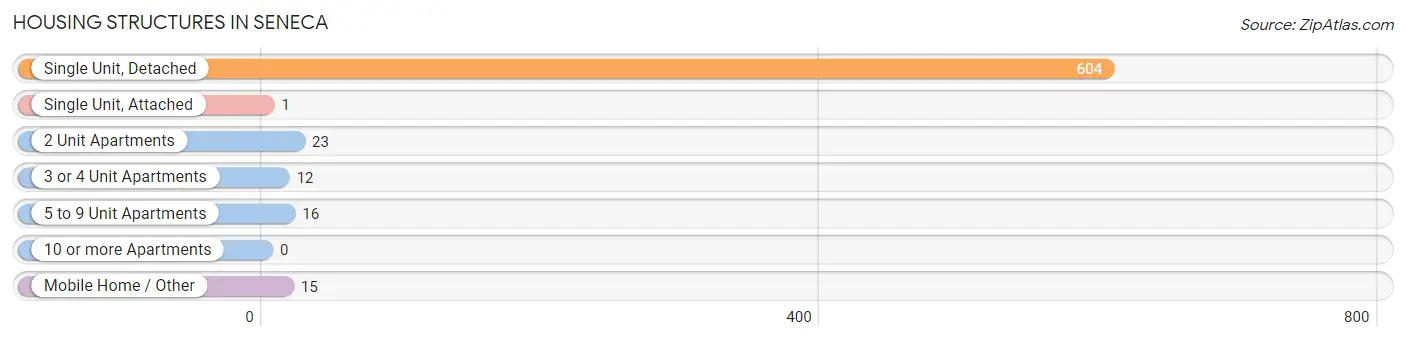
| Structure Type | # Housing Units | % Housing Units |
| Single Unit, Detached | 604 | 90.0% |
| Single Unit, Attached | 1 | 0.2% |
| 2 Unit Apartments | 23 | 3.4% |
| 3 or 4 Unit Apartments | 12 | 1.8% |
| 5 to 9 Unit Apartments | 16 | 2.4% |
| 10 or more Apartments | 0 | 0.0% |
| Mobile Home / Other | 15 | 2.2% |
| Total | 671 | 100.0% |
Housing Structures by Occupancy in Seneca
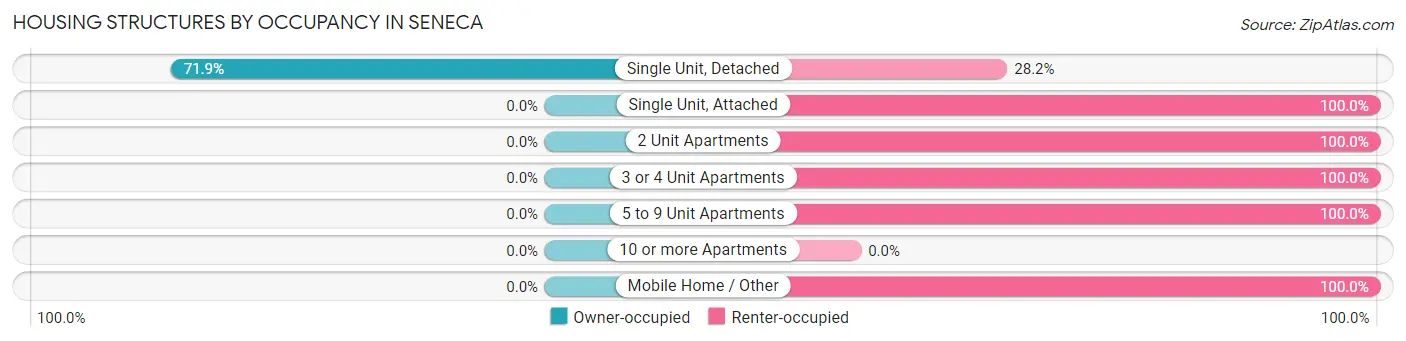
| Structure Type | Owner-occupied | Renter-occupied |
| Single Unit, Detached | 434 (71.9%) | 170 (28.1%) |
| Single Unit, Attached | 0 (0.0%) | 1 (100.0%) |
| 2 Unit Apartments | 0 (0.0%) | 23 (100.0%) |
| 3 or 4 Unit Apartments | 0 (0.0%) | 12 (100.0%) |
| 5 to 9 Unit Apartments | 0 (0.0%) | 16 (100.0%) |
| 10 or more Apartments | 0 (0.0%) | 0 (0.0%) |
| Mobile Home / Other | 0 (0.0%) | 15 (100.0%) |
| Total | 434 (64.7%) | 237 (35.3%) |
Housing Structures by Number of Rooms in Seneca
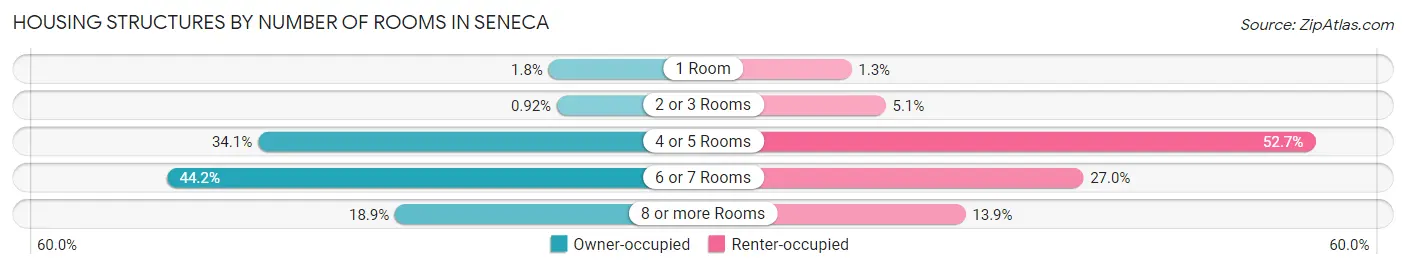
| Number of Rooms | Owner-occupied | Renter-occupied |
| 1 Room | 8 (1.8%) | 3 (1.3%) |
| 2 or 3 Rooms | 4 (0.9%) | 12 (5.1%) |
| 4 or 5 Rooms | 148 (34.1%) | 125 (52.7%) |
| 6 or 7 Rooms | 192 (44.2%) | 64 (27.0%) |
| 8 or more Rooms | 82 (18.9%) | 33 (13.9%) |
| Total | 434 (100.0%) | 237 (100.0%) |
Housing Structure by Heating Type in Seneca
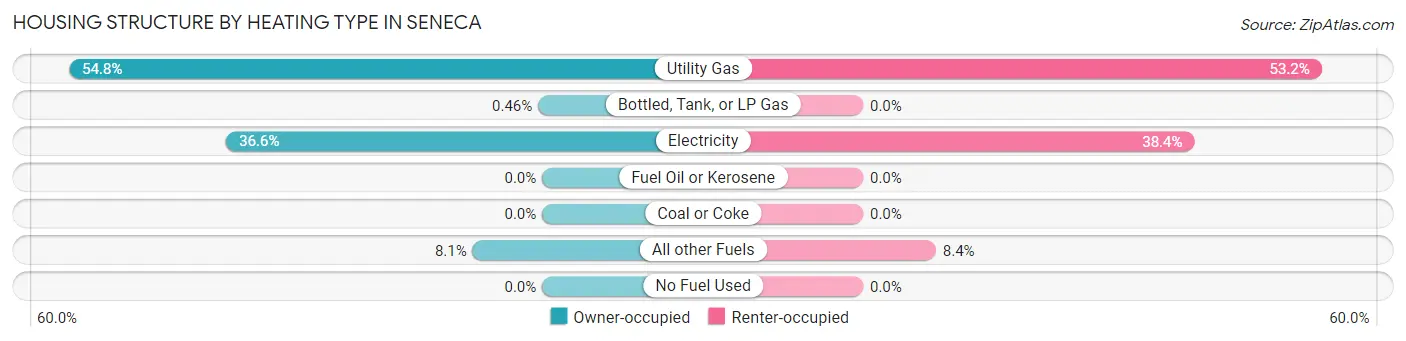
| Heating Type | Owner-occupied | Renter-occupied |
| Utility Gas | 238 (54.8%) | 126 (53.2%) |
| Bottled, Tank, or LP Gas | 2 (0.5%) | 0 (0.0%) |
| Electricity | 159 (36.6%) | 91 (38.4%) |
| Fuel Oil or Kerosene | 0 (0.0%) | 0 (0.0%) |
| Coal or Coke | 0 (0.0%) | 0 (0.0%) |
| All other Fuels | 35 (8.1%) | 20 (8.4%) |
| No Fuel Used | 0 (0.0%) | 0 (0.0%) |
| Total | 434 (100.0%) | 237 (100.0%) |
Household Vehicle Usage in Seneca
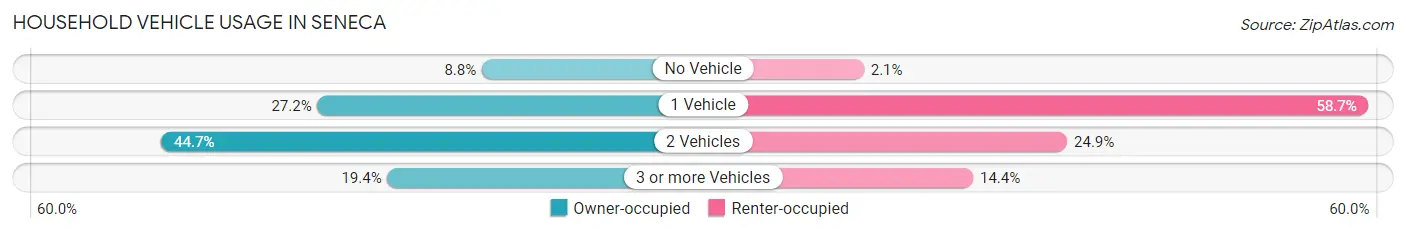
| Vehicles per Household | Owner-occupied | Renter-occupied |
| No Vehicle | 38 (8.8%) | 5 (2.1%) |
| 1 Vehicle | 118 (27.2%) | 139 (58.7%) |
| 2 Vehicles | 194 (44.7%) | 59 (24.9%) |
| 3 or more Vehicles | 84 (19.4%) | 34 (14.3%) |
| Total | 434 (100.0%) | 237 (100.0%) |
Real Estate & Mortgages in Seneca
Real Estate and Mortgage Overview in Seneca
| Characteristic | Without Mortgage | With Mortgage |
| Housing Units | 182 | 252 |
| Median Property Value | $159,700 | $87,800 |
| Median Household Income | $46,250 | $16 |
| Monthly Housing Costs | $512 | $0 |
| Real Estate Taxes | $1,023 | $15 |
Property Value by Mortgage Status in Seneca
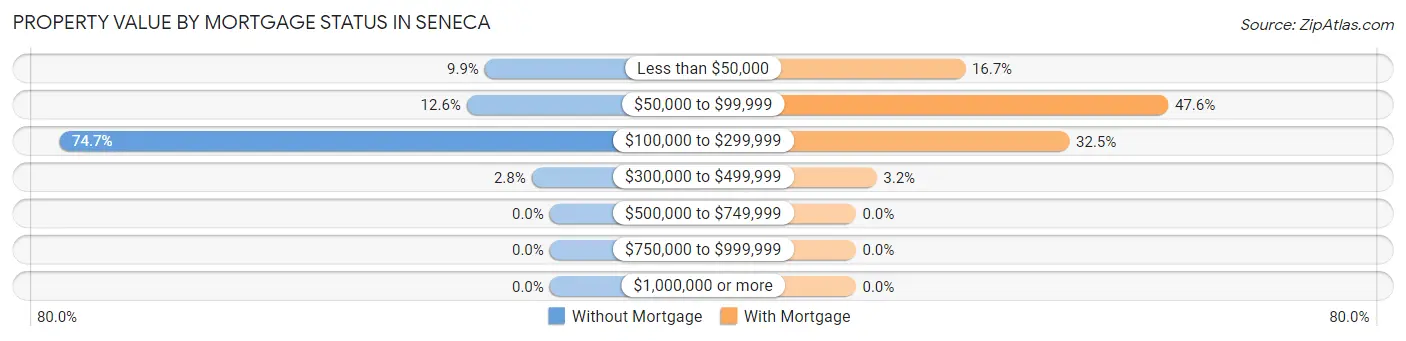
| Property Value | Without Mortgage | With Mortgage |
| Less than $50,000 | 18 (9.9%) | 42 (16.7%) |
| $50,000 to $99,999 | 23 (12.6%) | 120 (47.6%) |
| $100,000 to $299,999 | 136 (74.7%) | 82 (32.5%) |
| $300,000 to $499,999 | 5 (2.8%) | 8 (3.2%) |
| $500,000 to $749,999 | 0 (0.0%) | 0 (0.0%) |
| $750,000 to $999,999 | 0 (0.0%) | 0 (0.0%) |
| $1,000,000 or more | 0 (0.0%) | 0 (0.0%) |
| Total | 182 (100.0%) | 252 (100.0%) |
Household Income by Mortgage Status in Seneca
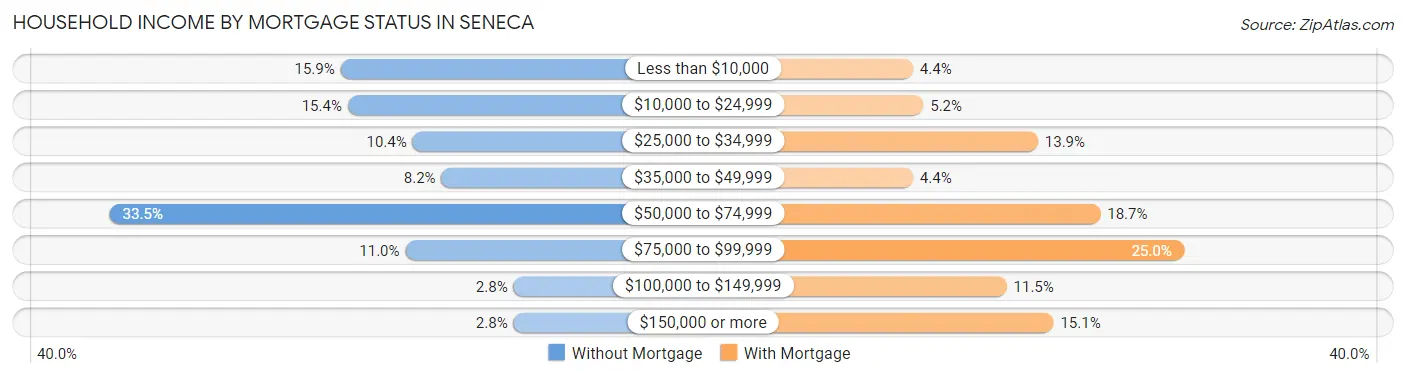
| Household Income | Without Mortgage | With Mortgage |
| Less than $10,000 | 29 (15.9%) | 11 (4.4%) |
| $10,000 to $24,999 | 28 (15.4%) | 13 (5.2%) |
| $25,000 to $34,999 | 19 (10.4%) | 35 (13.9%) |
| $35,000 to $49,999 | 15 (8.2%) | 11 (4.4%) |
| $50,000 to $74,999 | 61 (33.5%) | 47 (18.6%) |
| $75,000 to $99,999 | 20 (11.0%) | 63 (25.0%) |
| $100,000 to $149,999 | 5 (2.8%) | 29 (11.5%) |
| $150,000 or more | 5 (2.8%) | 38 (15.1%) |
| Total | 182 (100.0%) | 252 (100.0%) |
Property Value to Household Income Ratio in Seneca
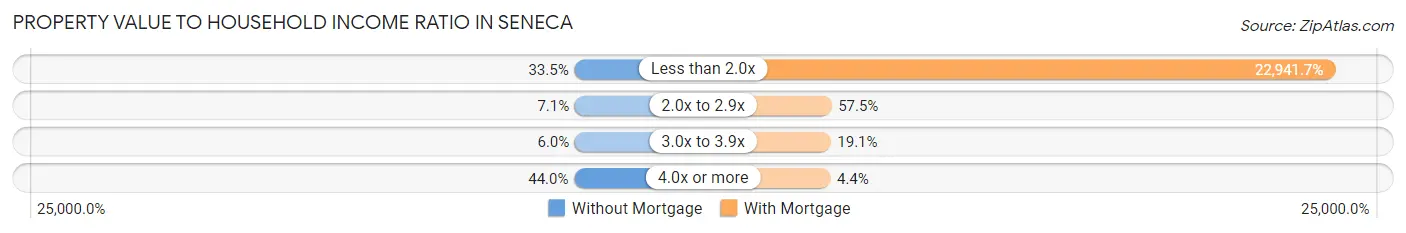
| Value-to-Income Ratio | Without Mortgage | With Mortgage |
| Less than 2.0x | 61 (33.5%) | 57,813 (22,941.7%) |
| 2.0x to 2.9x | 13 (7.1%) | 145 (57.5%) |
| 3.0x to 3.9x | 11 (6.0%) | 48 (19.1%) |
| 4.0x or more | 80 (44.0%) | 11 (4.4%) |
| Total | 182 (100.0%) | 252 (100.0%) |
Real Estate Taxes by Mortgage Status in Seneca
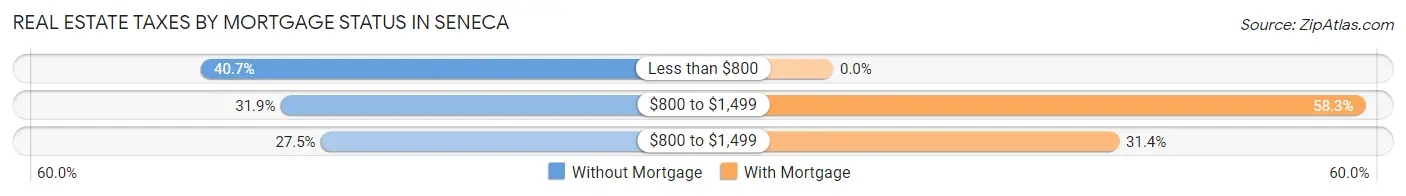
| Property Taxes | Without Mortgage | With Mortgage |
| Less than $800 | 74 (40.7%) | 0 (0.0%) |
| $800 to $1,499 | 58 (31.9%) | 147 (58.3%) |
| $800 to $1,499 | 50 (27.5%) | 79 (31.4%) |
| Total | 182 (100.0%) | 252 (100.0%) |
Health & Disability in Seneca
Health Insurance Coverage by Age in Seneca
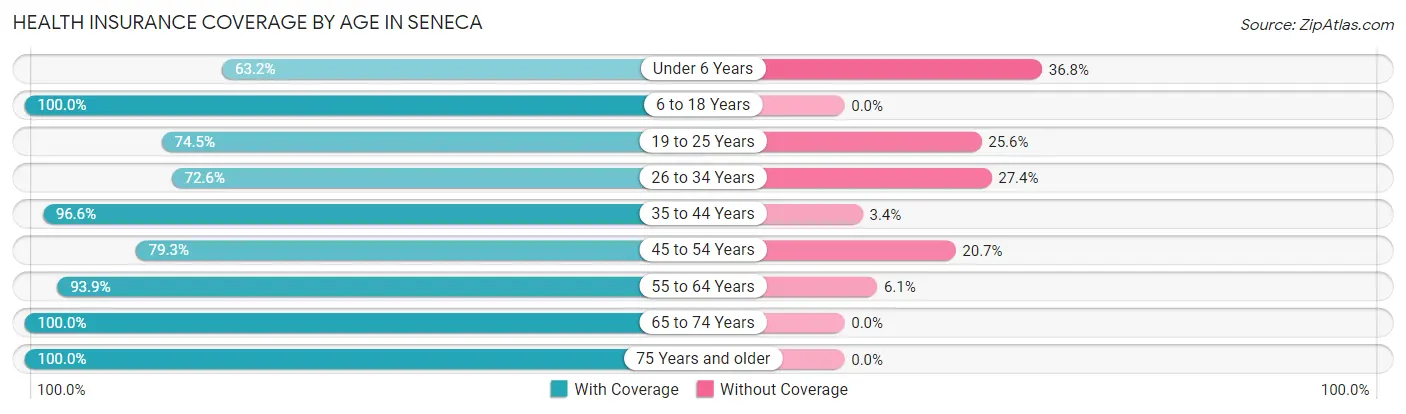
| Age Bracket | With Coverage | Without Coverage |
| Under 6 Years | 108 (63.2%) | 63 (36.8%) |
| 6 to 18 Years | 323 (100.0%) | 0 (0.0%) |
| 19 to 25 Years | 169 (74.5%) | 58 (25.6%) |
| 26 to 34 Years | 196 (72.6%) | 74 (27.4%) |
| 35 to 44 Years | 142 (96.6%) | 5 (3.4%) |
| 45 to 54 Years | 134 (79.3%) | 35 (20.7%) |
| 55 to 64 Years | 262 (93.9%) | 17 (6.1%) |
| 65 to 74 Years | 206 (100.0%) | 0 (0.0%) |
| 75 Years and older | 157 (100.0%) | 0 (0.0%) |
| Total | 1,697 (87.1%) | 252 (12.9%) |
Health Insurance Coverage by Citizenship Status in Seneca
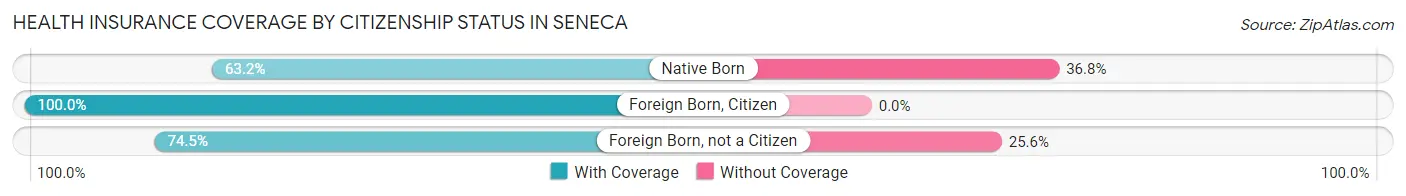
| Citizenship Status | With Coverage | Without Coverage |
| Native Born | 108 (63.2%) | 63 (36.8%) |
| Foreign Born, Citizen | 323 (100.0%) | 0 (0.0%) |
| Foreign Born, not a Citizen | 169 (74.5%) | 58 (25.6%) |
Health Insurance Coverage by Household Income in Seneca
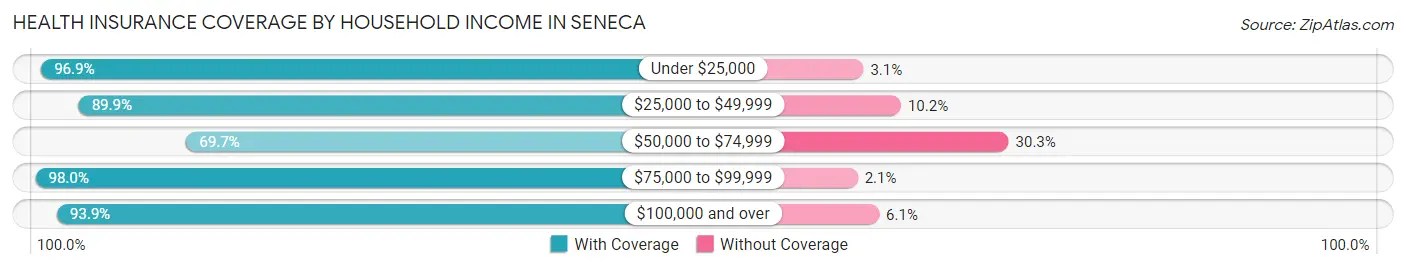
| Household Income | With Coverage | Without Coverage |
| Under $25,000 | 248 (96.9%) | 8 (3.1%) |
| $25,000 to $49,999 | 531 (89.8%) | 60 (10.2%) |
| $50,000 to $74,999 | 370 (69.7%) | 161 (30.3%) |
| $75,000 to $99,999 | 239 (98.0%) | 5 (2.1%) |
| $100,000 and over | 279 (93.9%) | 18 (6.1%) |
Public vs Private Health Insurance Coverage by Age in Seneca
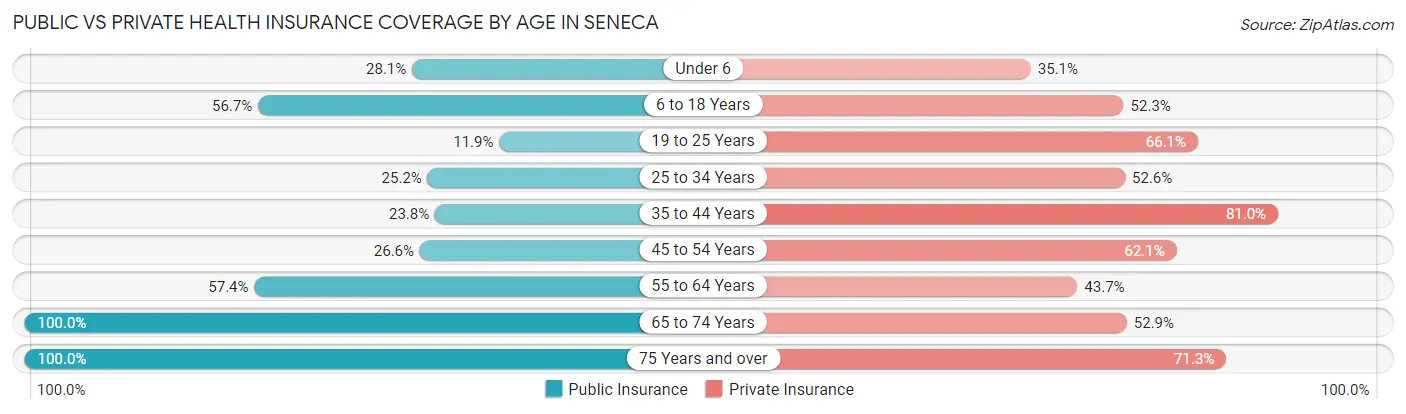
| Age Bracket | Public Insurance | Private Insurance |
| Under 6 | 48 (28.1%) | 60 (35.1%) |
| 6 to 18 Years | 183 (56.7%) | 169 (52.3%) |
| 19 to 25 Years | 27 (11.9%) | 150 (66.1%) |
| 25 to 34 Years | 68 (25.2%) | 142 (52.6%) |
| 35 to 44 Years | 35 (23.8%) | 119 (80.9%) |
| 45 to 54 Years | 45 (26.6%) | 105 (62.1%) |
| 55 to 64 Years | 160 (57.4%) | 122 (43.7%) |
| 65 to 74 Years | 206 (100.0%) | 109 (52.9%) |
| 75 Years and over | 157 (100.0%) | 112 (71.3%) |
| Total | 929 (47.7%) | 1,088 (55.8%) |
Disability Status by Sex by Age in Seneca
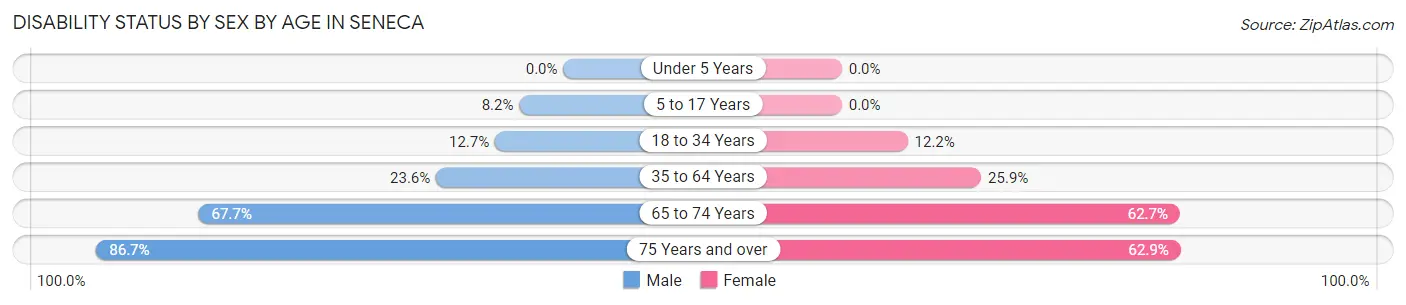
| Age Bracket | Male | Female |
| Under 5 Years | 0 (0.0%) | 0 (0.0%) |
| 5 to 17 Years | 21 (8.2%) | 0 (0.0%) |
| 18 to 34 Years | 36 (12.7%) | 26 (12.2%) |
| 35 to 64 Years | 73 (23.6%) | 74 (25.9%) |
| 65 to 74 Years | 65 (67.7%) | 69 (62.7%) |
| 75 Years and over | 52 (86.7%) | 61 (62.9%) |
Disability Class by Sex by Age in Seneca
Disability Class: Hearing Difficulty
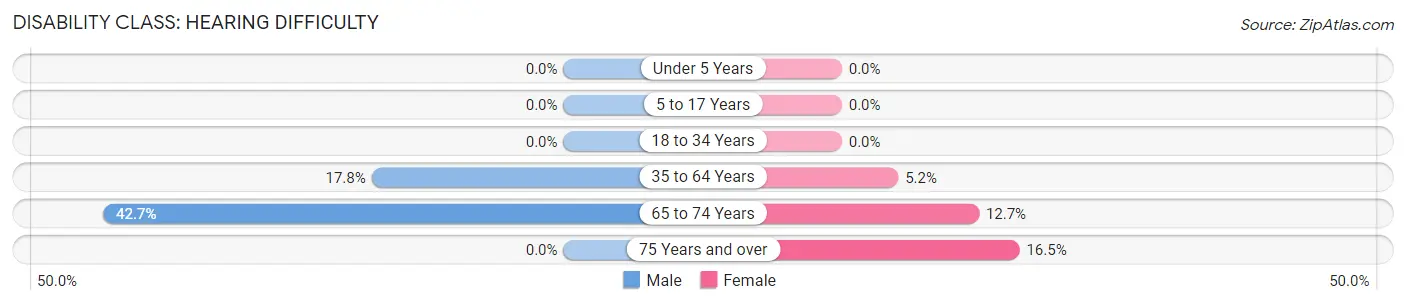
| Age Bracket | Male | Female |
| Under 5 Years | 0 (0.0%) | 0 (0.0%) |
| 5 to 17 Years | 0 (0.0%) | 0 (0.0%) |
| 18 to 34 Years | 0 (0.0%) | 0 (0.0%) |
| 35 to 64 Years | 55 (17.8%) | 15 (5.2%) |
| 65 to 74 Years | 41 (42.7%) | 14 (12.7%) |
| 75 Years and over | 0 (0.0%) | 16 (16.5%) |
Disability Class: Vision Difficulty
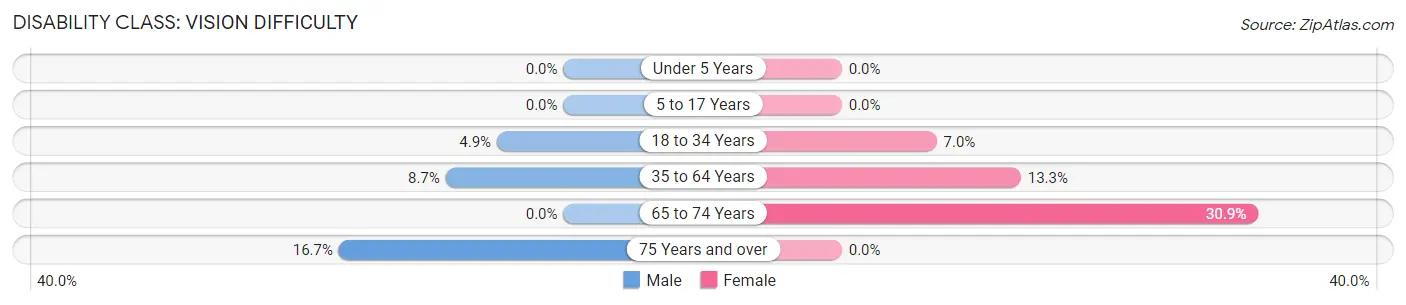
| Age Bracket | Male | Female |
| Under 5 Years | 0 (0.0%) | 0 (0.0%) |
| 5 to 17 Years | 0 (0.0%) | 0 (0.0%) |
| 18 to 34 Years | 14 (4.9%) | 15 (7.0%) |
| 35 to 64 Years | 27 (8.7%) | 38 (13.3%) |
| 65 to 74 Years | 0 (0.0%) | 34 (30.9%) |
| 75 Years and over | 10 (16.7%) | 0 (0.0%) |
Disability Class: Cognitive Difficulty
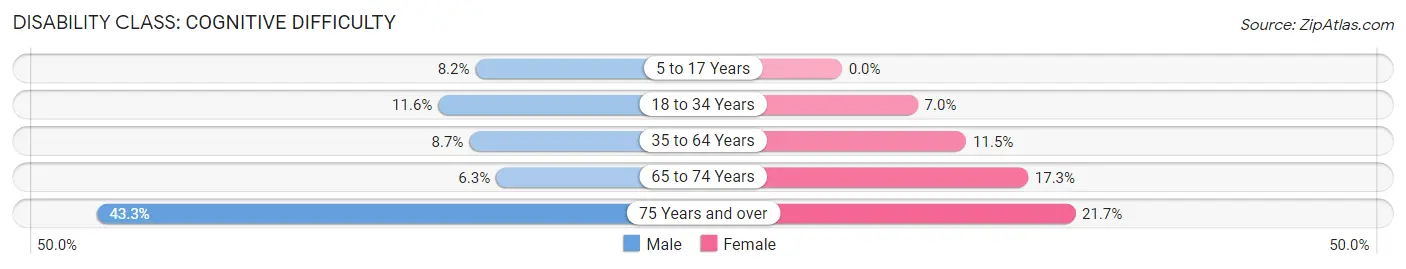
| Age Bracket | Male | Female |
| 5 to 17 Years | 21 (8.2%) | 0 (0.0%) |
| 18 to 34 Years | 33 (11.6%) | 15 (7.0%) |
| 35 to 64 Years | 27 (8.7%) | 33 (11.5%) |
| 65 to 74 Years | 6 (6.2%) | 19 (17.3%) |
| 75 Years and over | 26 (43.3%) | 21 (21.6%) |
Disability Class: Ambulatory Difficulty
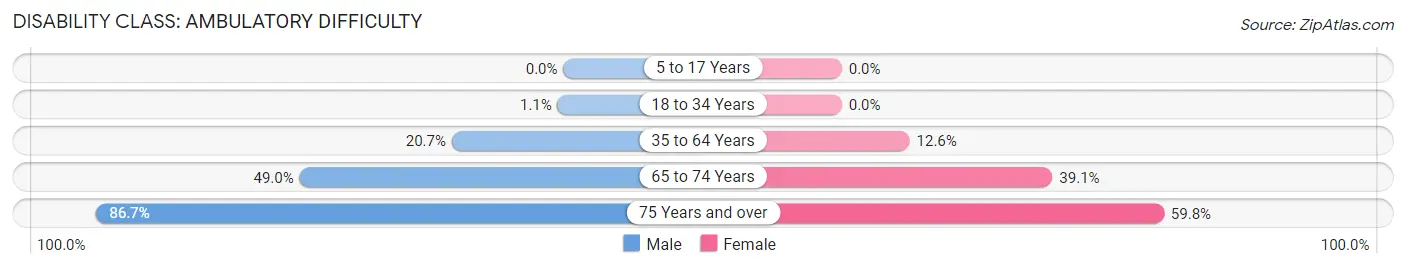
| Age Bracket | Male | Female |
| 5 to 17 Years | 0 (0.0%) | 0 (0.0%) |
| 18 to 34 Years | 3 (1.1%) | 0 (0.0%) |
| 35 to 64 Years | 64 (20.7%) | 36 (12.6%) |
| 65 to 74 Years | 47 (49.0%) | 43 (39.1%) |
| 75 Years and over | 52 (86.7%) | 58 (59.8%) |
Disability Class: Self-Care Difficulty
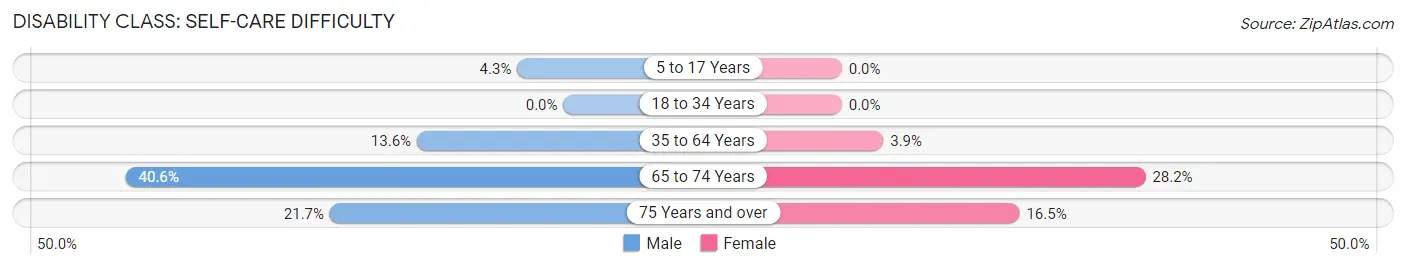
| Age Bracket | Male | Female |
| 5 to 17 Years | 11 (4.3%) | 0 (0.0%) |
| 18 to 34 Years | 0 (0.0%) | 0 (0.0%) |
| 35 to 64 Years | 42 (13.6%) | 11 (3.8%) |
| 65 to 74 Years | 39 (40.6%) | 31 (28.2%) |
| 75 Years and over | 13 (21.7%) | 16 (16.5%) |
Technology Access in Seneca
Computing Device Access in Seneca
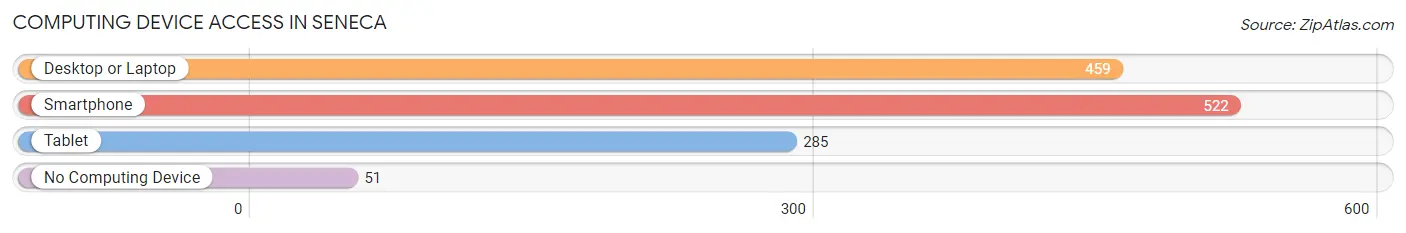
| Device Type | # Households | % Households |
| Desktop or Laptop | 459 | 68.4% |
| Smartphone | 522 | 77.8% |
| Tablet | 285 | 42.5% |
| No Computing Device | 51 | 7.6% |
| Total | 671 | 100.0% |
Internet Access in Seneca
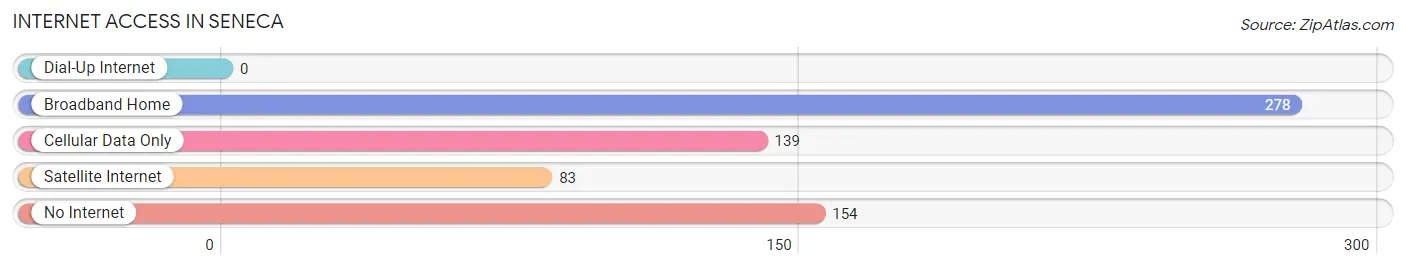
| Internet Type | # Households | % Households |
| Dial-Up Internet | 0 | 0.0% |
| Broadband Home | 278 | 41.4% |
| Cellular Data Only | 139 | 20.7% |
| Satellite Internet | 83 | 12.4% |
| No Internet | 154 | 23.0% |
| Total | 671 | 100.0% |
Seneca Summary
Seneca, Missouri is a small city located in the southwestern corner of the state, near the Oklahoma border. It is the county seat of Newton County and is part of the Joplin, Missouri Metropolitan Statistical Area. The city has a population of approximately 2,500 people and is known for its rural charm and friendly atmosphere.
History
Seneca was founded in 1871 by a group of settlers from the nearby town of Neosho. The town was named after the Seneca tribe of Native Americans who had previously inhabited the area. The first post office was established in 1872 and the town was officially incorporated in 1876.
In the late 19th century, Seneca was a thriving agricultural community, with a variety of crops being grown in the area. The town was also home to several businesses, including a flour mill, a sawmill, and a brickyard.
In the early 20th century, Seneca experienced a period of growth and prosperity. The town was home to several banks, a newspaper, a hotel, and a variety of other businesses. The town also had a thriving entertainment scene, with several theaters, a roller rink, and a dance hall.
Geography
Seneca is located in the southwestern corner of Missouri, near the Oklahoma border. The city is situated in the Ozark Mountains and is surrounded by rolling hills and wooded areas. The city is located along the Neosho River, which flows through the city and provides a scenic backdrop.
The city has a total area of 2.3 square miles, all of which is land. The city has a humid subtropical climate, with hot, humid summers and mild winters.
Economy
Seneca’s economy is largely based on agriculture and tourism. The city is home to several farms, which produce a variety of crops, including corn, soybeans, wheat, and hay. The city is also home to several tourist attractions, including the Seneca Caverns, a natural limestone cave system.
The city is also home to several small businesses, including restaurants, retail stores, and service providers. The city is also home to several manufacturing companies, including a furniture factory and a metal fabrication plant.
Demographics
As of the 2010 census, Seneca had a population of 2,500 people. The racial makeup of the city was 95.2% White, 0.8% African American, 0.4% Native American, 0.4% Asian, 0.2% Pacific Islander, and 2.8% from other races. Hispanic or Latino of any race were 3.2% of the population.
The median household income in Seneca was $35,000, and the median family income was $41,000. The per capita income was $17,000. About 15.2% of the population was below the poverty line.
Seneca is a small, rural city with a friendly atmosphere and a strong sense of community. The city is home to a variety of businesses and attractions, and is a popular destination for tourists. The city is also home to a diverse population, with a variety of racial and ethnic backgrounds.
Common Questions
What is Per Capita Income in Seneca?
Per Capita income in Seneca is $21,245.
What is the Median Family Income in Seneca?
Median Family Income in Seneca is $53,523.
What is the Median Household income in Seneca?
Median Household Income in Seneca is $42,279.
What is Income or Wage Gap in Seneca?
Income or Wage Gap in Seneca is 27.0%.
Women in Seneca earn 73.0 cents for every dollar earned by a man.
What is Family Income Deficit in Seneca?
Family Income Deficit in Seneca is $7,159.
Families that are below poverty line in Seneca earn $7,159 less on average than the poverty threshold level.
What is Inequality or Gini Index in Seneca?
Inequality or Gini Index in Seneca is 0.41.
What is the Total Population of Seneca?
Total Population of Seneca is 2,005.
What is the Total Male Population of Seneca?
Total Male Population of Seneca is 1,057.
What is the Total Female Population of Seneca?
Total Female Population of Seneca is 948.
What is the Ratio of Males per 100 Females in Seneca?
There are 111.50 Males per 100 Females in Seneca.
What is the Ratio of Females per 100 Males in Seneca?
There are 89.69 Females per 100 Males in Seneca.
What is the Median Population Age in Seneca?
Median Population Age in Seneca is 35.3 Years.
What is the Average Family Size in Seneca
Average Family Size in Seneca is 3.4 People.
What is the Average Household Size in Seneca
Average Household Size in Seneca is 2.9 People.
How Large is the Labor Force in Seneca?
There are 838 People in the Labor Forcein in Seneca.
What is the Percentage of People in the Labor Force in Seneca?
53.4% of People are in the Labor Force in Seneca.
What is the Unemployment Rate in Seneca?
Unemployment Rate in Seneca is 0.1%.