Union, MO Map & Demographics
Union Map
Union Overview
$31,729
PER CAPITA INCOME
$85,846
AVG FAMILY INCOME
$68,864
AVG HOUSEHOLD INCOME
10.6%
WAGE / INCOME GAP [ % ]
89.4¢/ $1
WAGE / INCOME GAP [ $ ]
0.39
INEQUALITY / GINI INDEX
12,341
TOTAL POPULATION
6,271
MALE POPULATION
6,070
FEMALE POPULATION
103.31
MALES / 100 FEMALES
96.79
FEMALES / 100 MALES
34.2
MEDIAN AGE
3.1
AVG FAMILY SIZE
2.6
AVG HOUSEHOLD SIZE
6,407
LABOR FORCE [ PEOPLE ]
65.9%
PERCENT IN LABOR FORCE
5.6%
UNEMPLOYMENT RATE
Union Zip Codes
Union Area Codes
Income in Union
Income Overview in Union
Per Capita Income in Union is $31,729, while median incomes of families and households are $85,846 and $68,864 respectively.
| Characteristic | Number | Measure |
| Per Capita Income | 12,341 | $31,729 |
| Median Family Income | 3,064 | $85,846 |
| Mean Family Income | 3,064 | $97,030 |
| Median Household Income | 4,708 | $68,864 |
| Mean Household Income | 4,708 | $82,228 |
| Income Deficit | 3,064 | $0 |
| Wage / Income Gap (%) | 12,341 | 10.56% |
| Wage / Income Gap ($) | 12,341 | 89.44¢ per $1 |
| Gini / Inequality Index | 12,341 | 0.39 |
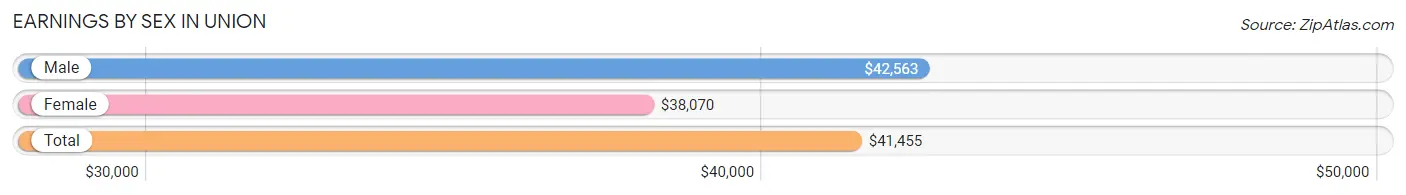
Earnings by Sex in Union
Average Earnings in Union are $41,455, $42,563 for men and $38,070 for women, a difference of 10.6%.
| Sex | Number | Average Earnings |
| Male | 3,458 (52.0%) | $42,563 |
| Female | 3,186 (47.9%) | $38,070 |
| Total | 6,644 (100.0%) | $41,455 |
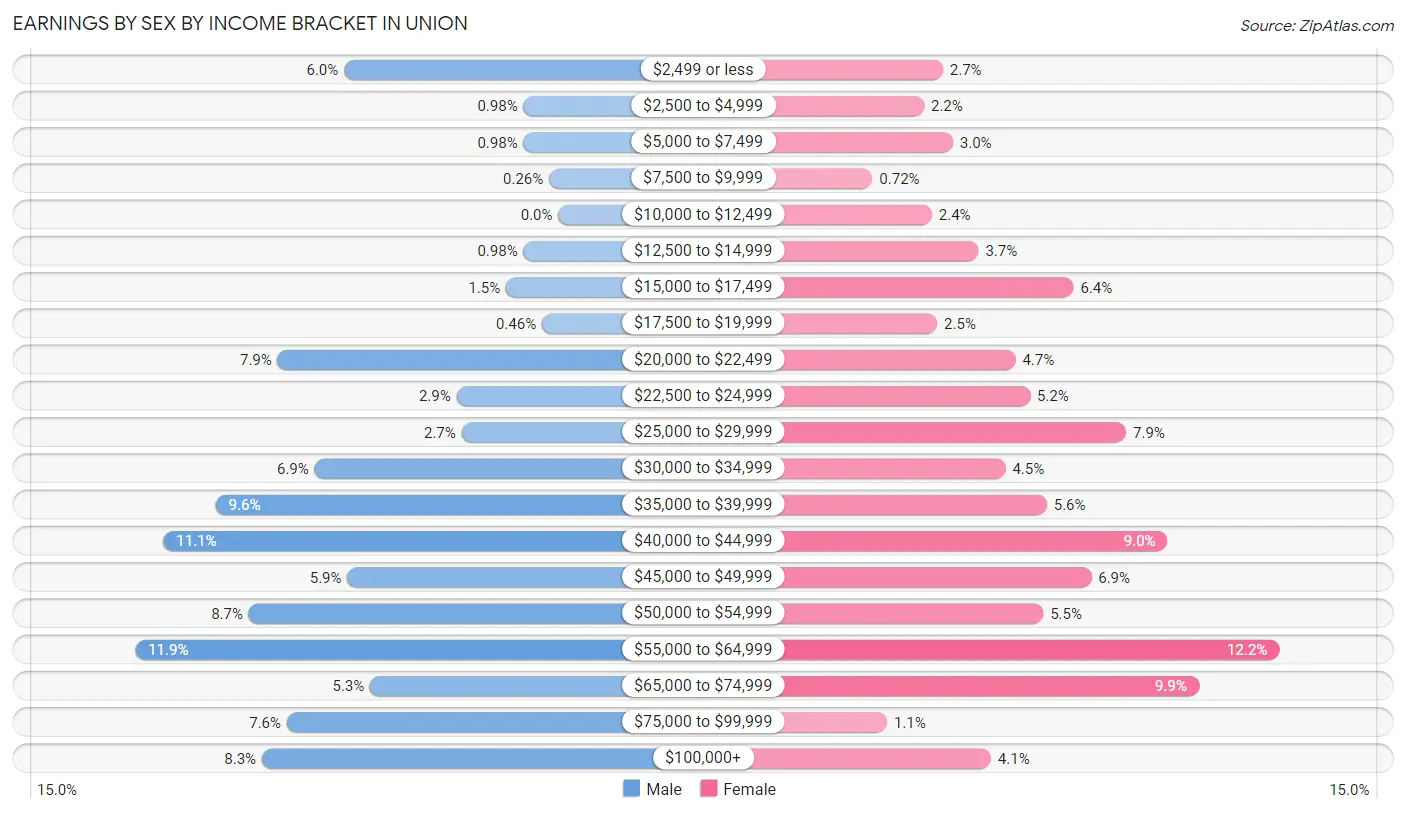
Earnings by Sex by Income Bracket in Union
The most common earnings brackets in Union are $55,000 to $64,999 for men (411 | 11.9%) and $55,000 to $64,999 for women (387 | 12.1%).
| Income | Male | Female |
| $2,499 or less | 208 (6.0%) | 86 (2.7%) |
| $2,500 to $4,999 | 34 (1.0%) | 69 (2.2%) |
| $5,000 to $7,499 | 34 (1.0%) | 95 (3.0%) |
| $7,500 to $9,999 | 9 (0.3%) | 23 (0.7%) |
| $10,000 to $12,499 | 0 (0.0%) | 76 (2.4%) |
| $12,500 to $14,999 | 34 (1.0%) | 118 (3.7%) |
| $15,000 to $17,499 | 51 (1.5%) | 203 (6.4%) |
| $17,500 to $19,999 | 16 (0.5%) | 81 (2.5%) |
| $20,000 to $22,499 | 273 (7.9%) | 151 (4.7%) |
| $22,500 to $24,999 | 99 (2.9%) | 164 (5.1%) |
| $25,000 to $29,999 | 94 (2.7%) | 250 (7.9%) |
| $30,000 to $34,999 | 237 (6.9%) | 142 (4.5%) |
| $35,000 to $39,999 | 333 (9.6%) | 179 (5.6%) |
| $40,000 to $44,999 | 384 (11.1%) | 287 (9.0%) |
| $45,000 to $49,999 | 205 (5.9%) | 219 (6.9%) |
| $50,000 to $54,999 | 301 (8.7%) | 176 (5.5%) |
| $55,000 to $64,999 | 411 (11.9%) | 387 (12.1%) |
| $65,000 to $74,999 | 183 (5.3%) | 315 (9.9%) |
| $75,000 to $99,999 | 264 (7.6%) | 36 (1.1%) |
| $100,000+ | 288 (8.3%) | 129 (4.1%) |
| Total | 3,458 (100.0%) | 3,186 (100.0%) |
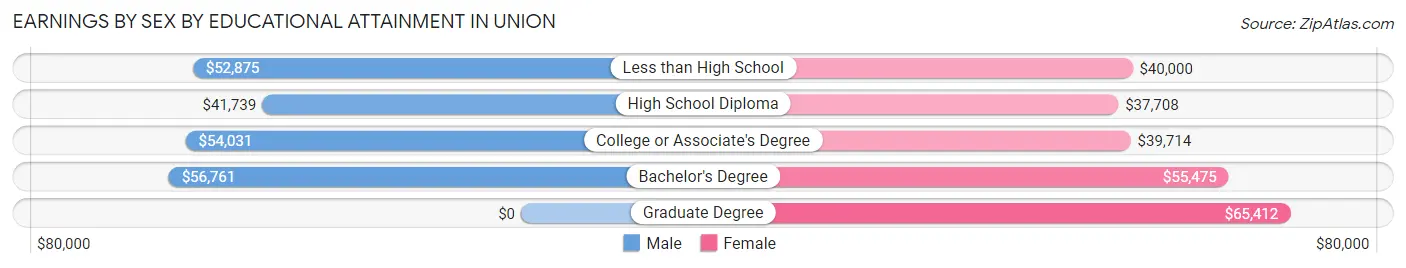
Earnings by Sex by Educational Attainment in Union
Average earnings in Union are $50,694 for men and $44,287 for women, a difference of 12.6%. Men with an educational attainment of bachelor's degree enjoy the highest average annual earnings of $56,761, while those with high school diploma education earn the least with $41,739. Women with an educational attainment of graduate degree earn the most with the average annual earnings of $65,412, while those with high school diploma education have the smallest earnings of $37,708.
| Educational Attainment | Male Income | Female Income |
| Less than High School | $52,875 | $40,000 |
| High School Diploma | $41,739 | $37,708 |
| College or Associate's Degree | $54,031 | $39,714 |
| Bachelor's Degree | $56,761 | $55,475 |
| Graduate Degree | - | - |
| Total | $50,694 | $44,287 |
Family Income in Union
Family Income Brackets in Union
According to the Union family income data, there are 889 families falling into the $100,000 to $149,999 income range, which is the most common income bracket and makes up 29.0% of all families. Conversely, the $10,000 to $14,999 income bracket is the least frequent group with only 34 families (1.1%) belonging to this category.
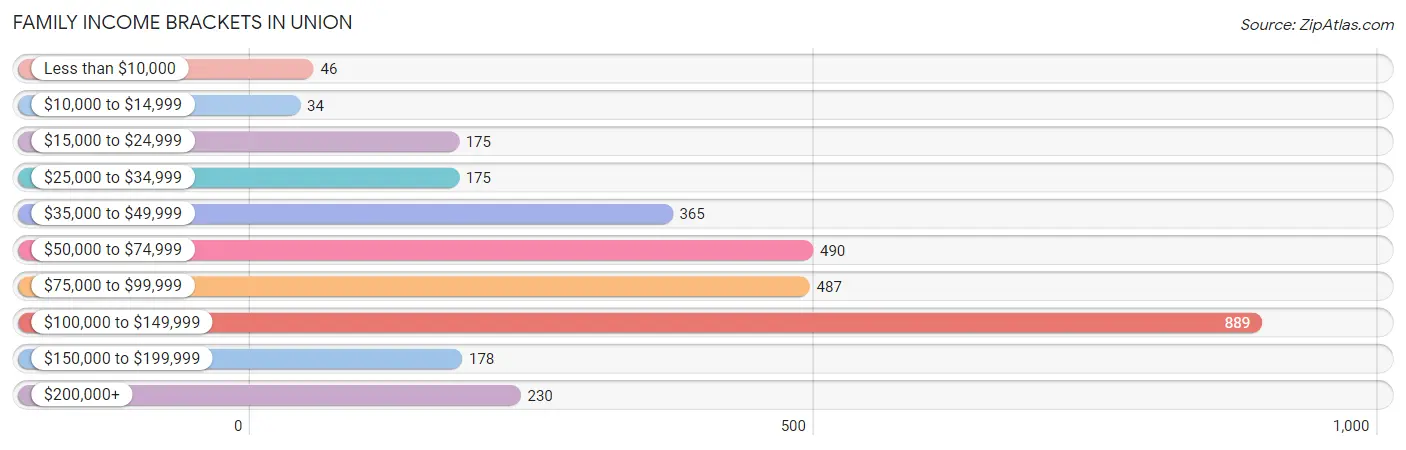
| Income Bracket | # Families | % Families |
| Less than $10,000 | 46 | 1.5% |
| $10,000 to $14,999 | 34 | 1.1% |
| $15,000 to $24,999 | 175 | 5.7% |
| $25,000 to $34,999 | 175 | 5.7% |
| $35,000 to $49,999 | 365 | 11.9% |
| $50,000 to $74,999 | 490 | 16.0% |
| $75,000 to $99,999 | 487 | 15.9% |
| $100,000 to $149,999 | 889 | 29.0% |
| $150,000 to $199,999 | 178 | 5.8% |
| $200,000+ | 230 | 7.5% |
Family Income by Famaliy Size in Union
5-person families (294 | 9.6%) account for the highest median family income in Union with $108,817 per family, while 2-person families (1,605 | 52.4%) have the highest median income of $34,884 per family member.
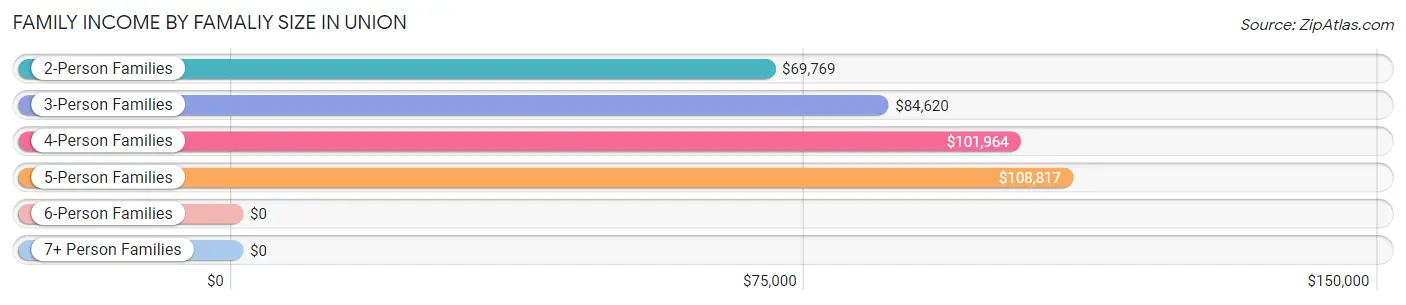
| Income Bracket | # Families | Median Income |
| 2-Person Families | 1,605 (52.4%) | $69,769 |
| 3-Person Families | 419 (13.7%) | $84,620 |
| 4-Person Families | 660 (21.5%) | $101,964 |
| 5-Person Families | 294 (9.6%) | $108,817 |
| 6-Person Families | 52 (1.7%) | $0 |
| 7+ Person Families | 34 (1.1%) | $0 |
| Total | 3,064 (100.0%) | $85,846 |
Family Income by Number of Earners in Union
The median family income in Union is $85,846, with families comprising 2 earners (1,529) having the highest median family income of $106,540, while families with no earners (463) have the lowest median family income of $50,605, accounting for 49.9% and 15.1% of families, respectively.
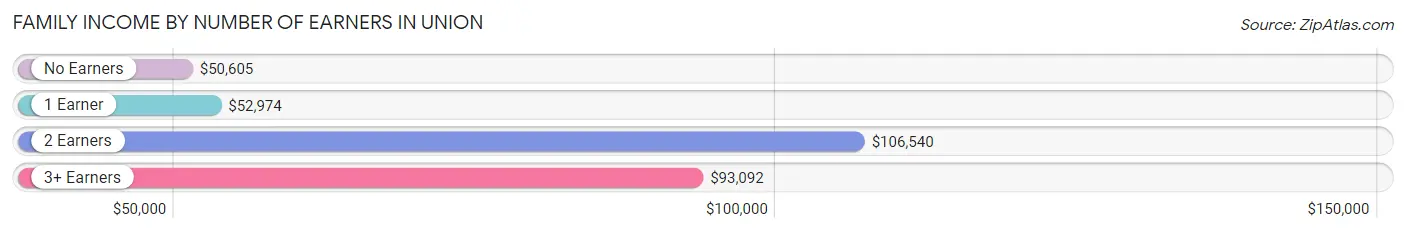
| Number of Earners | # Families | Median Income |
| No Earners | 463 (15.1%) | $50,605 |
| 1 Earner | 783 (25.6%) | $52,974 |
| 2 Earners | 1,529 (49.9%) | $106,540 |
| 3+ Earners | 289 (9.4%) | $93,092 |
| Total | 3,064 (100.0%) | $85,846 |
Household Income in Union
Household Income Brackets in Union
With 1,088 households falling in the category, the $100,000 to $149,999 income range is the most frequent in Union, accounting for 23.1% of all households. In contrast, only 71 households (1.5%) fall into the $10,000 to $14,999 income bracket, making it the least populous group.
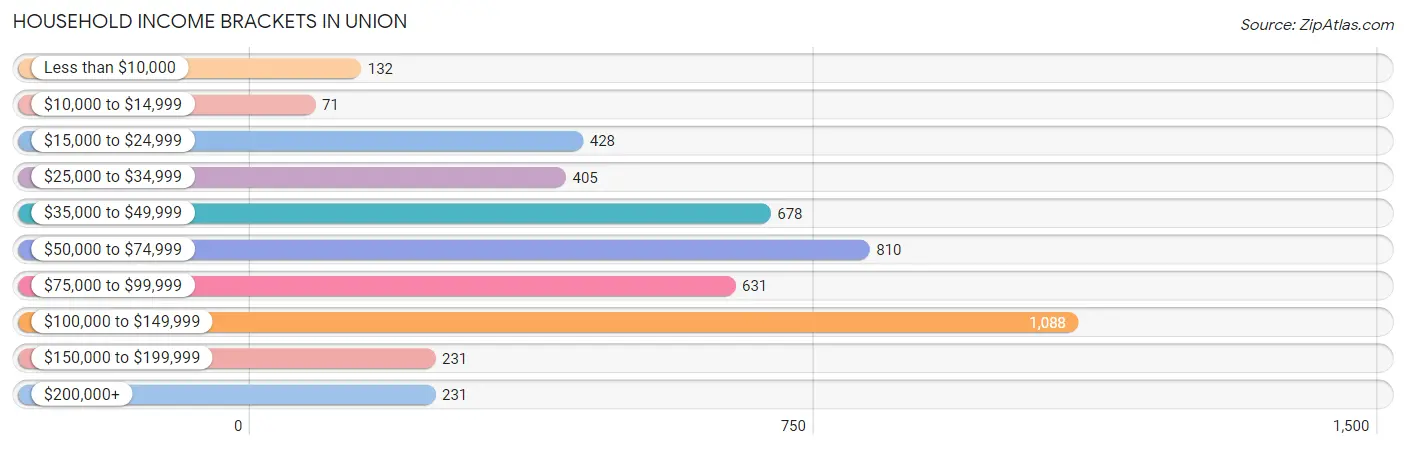
| Income Bracket | # Households | % Households |
| Less than $10,000 | 132 | 2.8% |
| $10,000 to $14,999 | 71 | 1.5% |
| $15,000 to $24,999 | 428 | 9.1% |
| $25,000 to $34,999 | 405 | 8.6% |
| $35,000 to $49,999 | 678 | 14.4% |
| $50,000 to $74,999 | 810 | 17.2% |
| $75,000 to $99,999 | 631 | 13.4% |
| $100,000 to $149,999 | 1,088 | 23.1% |
| $150,000 to $199,999 | 231 | 4.9% |
| $200,000+ | 231 | 4.9% |
Household Income by Householder Age in Union
The median household income in Union is $68,864, with the highest median household income of $101,610 found in the 25 to 44 years age bracket for the primary householder. A total of 1,638 households (34.8%) fall into this category. Meanwhile, the 65+ years age bracket for the primary householder has the lowest median household income of $43,173, with 1,044 households (22.2%) in this group.
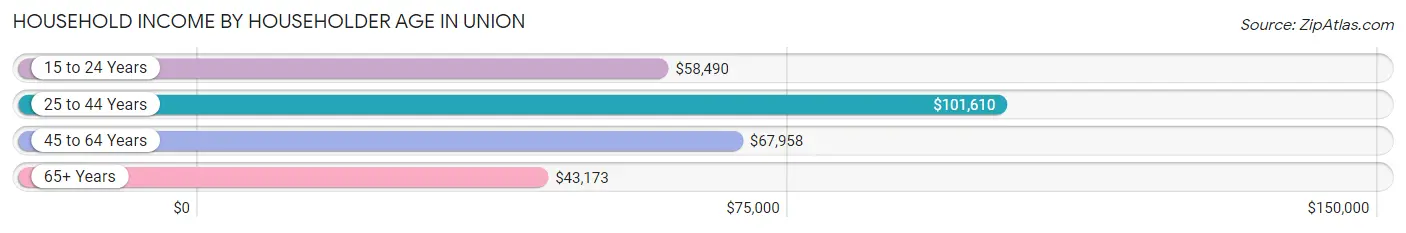
| Income Bracket | # Households | Median Income |
| 15 to 24 Years | 389 (8.3%) | $58,490 |
| 25 to 44 Years | 1,638 (34.8%) | $101,610 |
| 45 to 64 Years | 1,637 (34.8%) | $67,958 |
| 65+ Years | 1,044 (22.2%) | $43,173 |
| Total | 4,708 (100.0%) | $68,864 |
Poverty in Union
Income Below Poverty by Sex and Age in Union
With 5.9% poverty level for males and 9.3% for females among the residents of Union, 6 to 11 year old males and 12 to 14 year old females are the most vulnerable to poverty, with 89 males (17.8%) and 33 females (28.2%) in their respective age groups living below the poverty level.
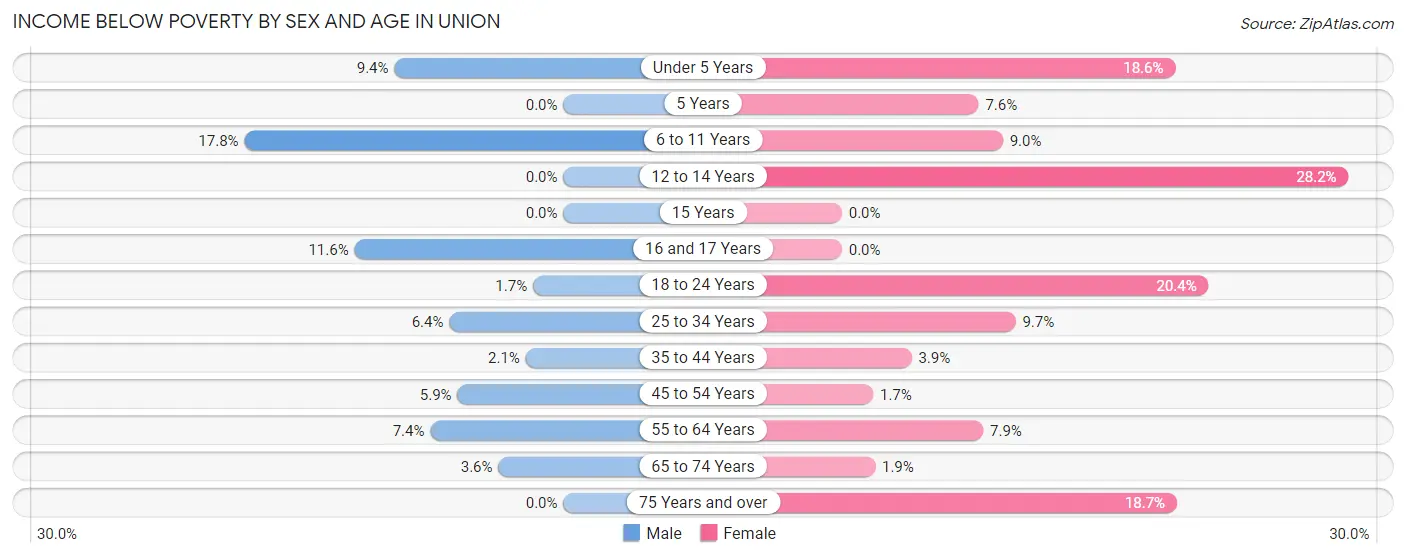
| Age Bracket | Male | Female |
| Under 5 Years | 54 (9.4%) | 52 (18.6%) |
| 5 Years | 0 (0.0%) | 7 (7.6%) |
| 6 to 11 Years | 89 (17.8%) | 43 (9.0%) |
| 12 to 14 Years | 0 (0.0%) | 33 (28.2%) |
| 15 Years | 0 (0.0%) | 0 (0.0%) |
| 16 and 17 Years | 20 (11.6%) | 0 (0.0%) |
| 18 to 24 Years | 10 (1.7%) | 118 (20.4%) |
| 25 to 34 Years | 65 (6.4%) | 91 (9.7%) |
| 35 to 44 Years | 17 (2.1%) | 25 (3.9%) |
| 45 to 54 Years | 41 (5.9%) | 10 (1.7%) |
| 55 to 64 Years | 48 (7.4%) | 68 (7.9%) |
| 65 to 74 Years | 13 (3.6%) | 9 (1.8%) |
| 75 Years and over | 0 (0.0%) | 92 (18.7%) |
| Total | 357 (5.9%) | 548 (9.3%) |
Income Above Poverty by Sex and Age in Union
According to the poverty statistics in Union, males aged 5 years and females aged 15 years are the age groups that are most secure financially, with 100.0% of males and 100.0% of females in these age groups living above the poverty line.
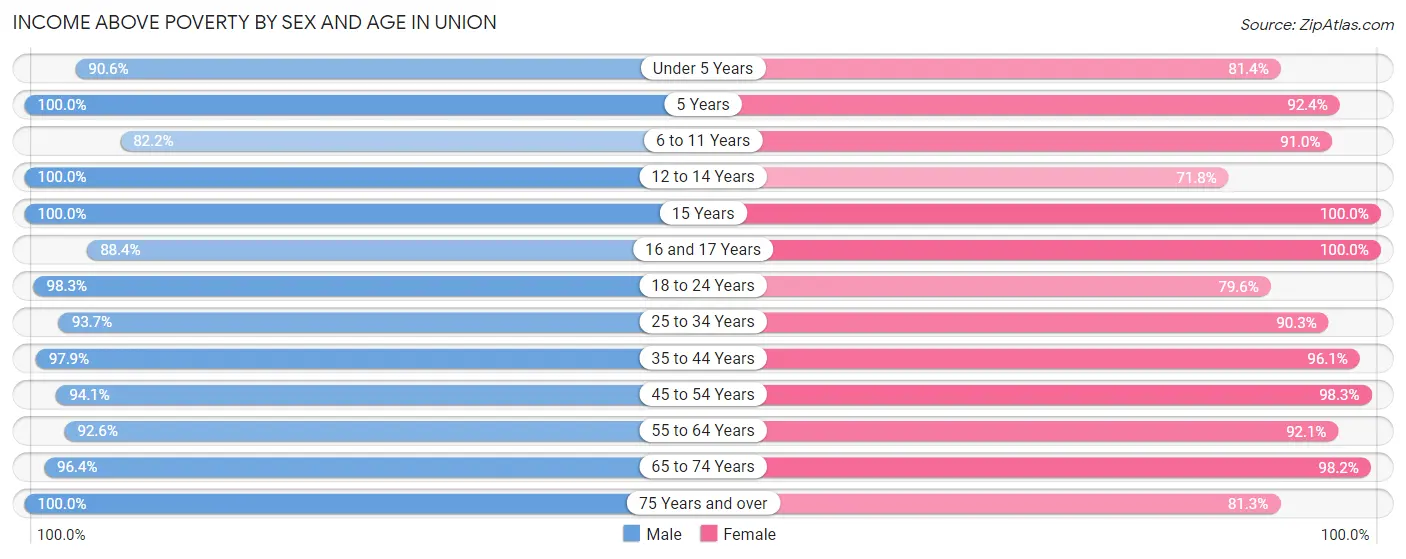
| Age Bracket | Male | Female |
| Under 5 Years | 520 (90.6%) | 228 (81.4%) |
| 5 Years | 21 (100.0%) | 85 (92.4%) |
| 6 to 11 Years | 412 (82.2%) | 437 (91.0%) |
| 12 to 14 Years | 289 (100.0%) | 84 (71.8%) |
| 15 Years | 106 (100.0%) | 47 (100.0%) |
| 16 and 17 Years | 152 (88.4%) | 308 (100.0%) |
| 18 to 24 Years | 582 (98.3%) | 460 (79.6%) |
| 25 to 34 Years | 958 (93.6%) | 850 (90.3%) |
| 35 to 44 Years | 792 (97.9%) | 619 (96.1%) |
| 45 to 54 Years | 654 (94.1%) | 564 (98.3%) |
| 55 to 64 Years | 600 (92.6%) | 796 (92.1%) |
| 65 to 74 Years | 346 (96.4%) | 477 (98.2%) |
| 75 Years and over | 287 (100.0%) | 401 (81.3%) |
| Total | 5,719 (94.1%) | 5,356 (90.7%) |
Income Below Poverty Among Married-Couple Families in Union
The poverty statistics for married-couple families in Union show that 1.9% or 42 of the total 2,196 families live below the poverty line. Families with 3 or 4 children have the highest poverty rate of 6.8%, comprising of 17 families. On the other hand, families with no children have the lowest poverty rate of 0.9%, which includes 11 families.
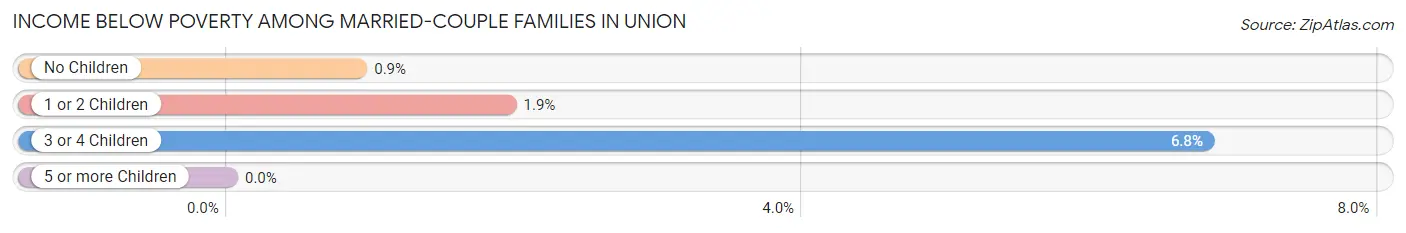
| Children | Above Poverty | Below Poverty |
| No Children | 1,213 (99.1%) | 11 (0.9%) |
| 1 or 2 Children | 708 (98.1%) | 14 (1.9%) |
| 3 or 4 Children | 233 (93.2%) | 17 (6.8%) |
| 5 or more Children | 0 (0.0%) | 0 (0.0%) |
| Total | 2,154 (98.1%) | 42 (1.9%) |
Income Below Poverty Among Single-Parent Households in Union
According to the poverty data in Union, 13.3% or 31 single-father households and 18.3% or 116 single-mother households are living below the poverty line. Among single-father households, those with no children have the highest poverty rate, with 31 households (21.5%) experiencing poverty. Likewise, among single-mother households, those with 5 or more children have the highest poverty rate, with 25 households (100.0%) falling below the poverty line.
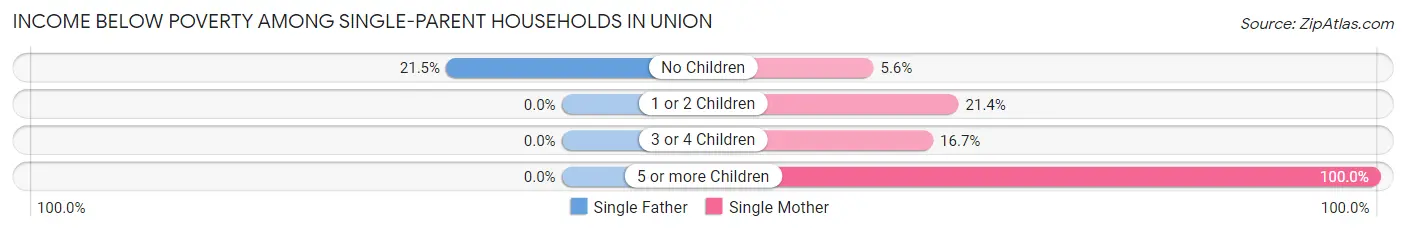
| Children | Single Father | Single Mother |
| No Children | 31 (21.5%) | 13 (5.6%) |
| 1 or 2 Children | 0 (0.0%) | 70 (21.4%) |
| 3 or 4 Children | 0 (0.0%) | 8 (16.7%) |
| 5 or more Children | 0 (0.0%) | 25 (100.0%) |
| Total | 31 (13.3%) | 116 (18.3%) |
Income Below Poverty Among Married-Couple vs Single-Parent Households in Union
The poverty data for Union shows that 42 of the married-couple family households (1.9%) and 147 of the single-parent households (16.9%) are living below the poverty level. Within the married-couple family households, those with 3 or 4 children have the highest poverty rate, with 17 households (6.8%) falling below the poverty line. Among the single-parent households, those with 5 or more children have the highest poverty rate, with 25 household (100.0%) living below poverty.
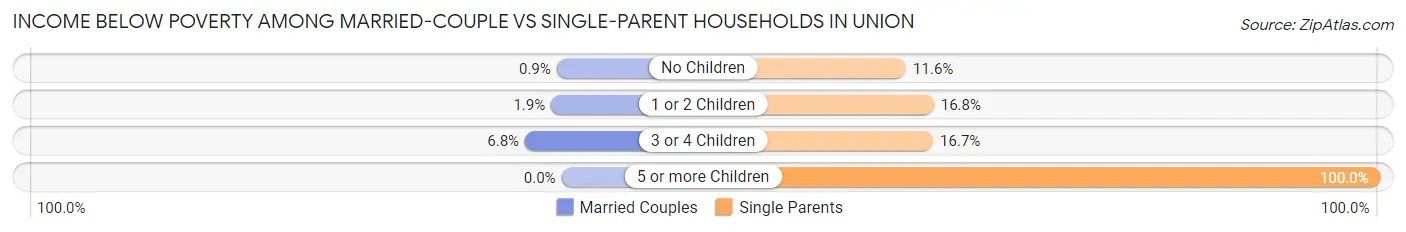
| Children | Married-Couple Families | Single-Parent Households |
| No Children | 11 (0.9%) | 44 (11.6%) |
| 1 or 2 Children | 14 (1.9%) | 70 (16.8%) |
| 3 or 4 Children | 17 (6.8%) | 8 (16.7%) |
| 5 or more Children | 0 (0.0%) | 25 (100.0%) |
| Total | 42 (1.9%) | 147 (16.9%) |
Race in Union
The most populous races in Union are White / Caucasian (10,926 | 88.5%), Two or more Races (947 | 7.7%), and Black / African American (326 | 2.6%).
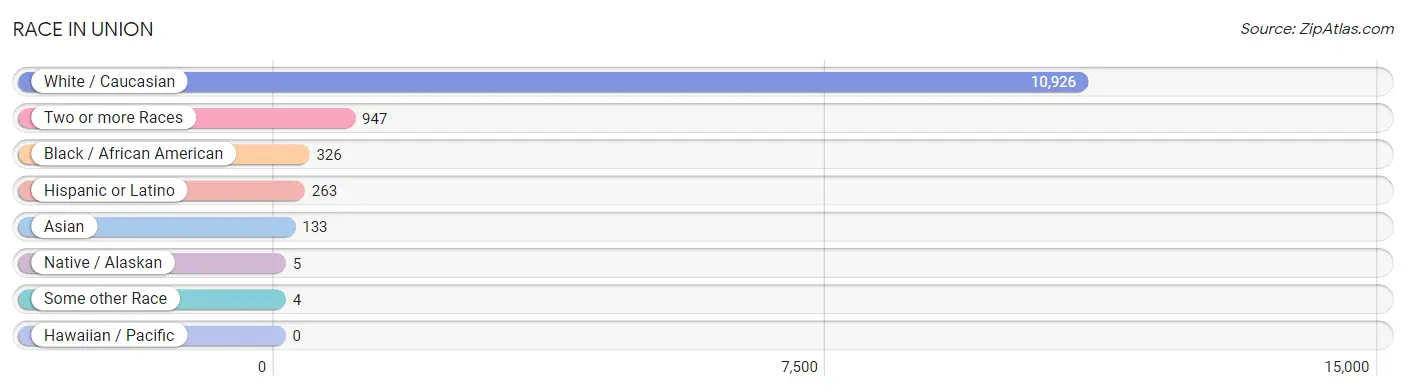
| Race | # Population | % Population |
| Asian | 133 | 1.1% |
| Black / African American | 326 | 2.6% |
| Hawaiian / Pacific | 0 | 0.0% |
| Hispanic or Latino | 263 | 2.1% |
| Native / Alaskan | 5 | 0.0% |
| White / Caucasian | 10,926 | 88.5% |
| Two or more Races | 947 | 7.7% |
| Some other Race | 4 | 0.0% |
| Total | 12,341 | 100.0% |
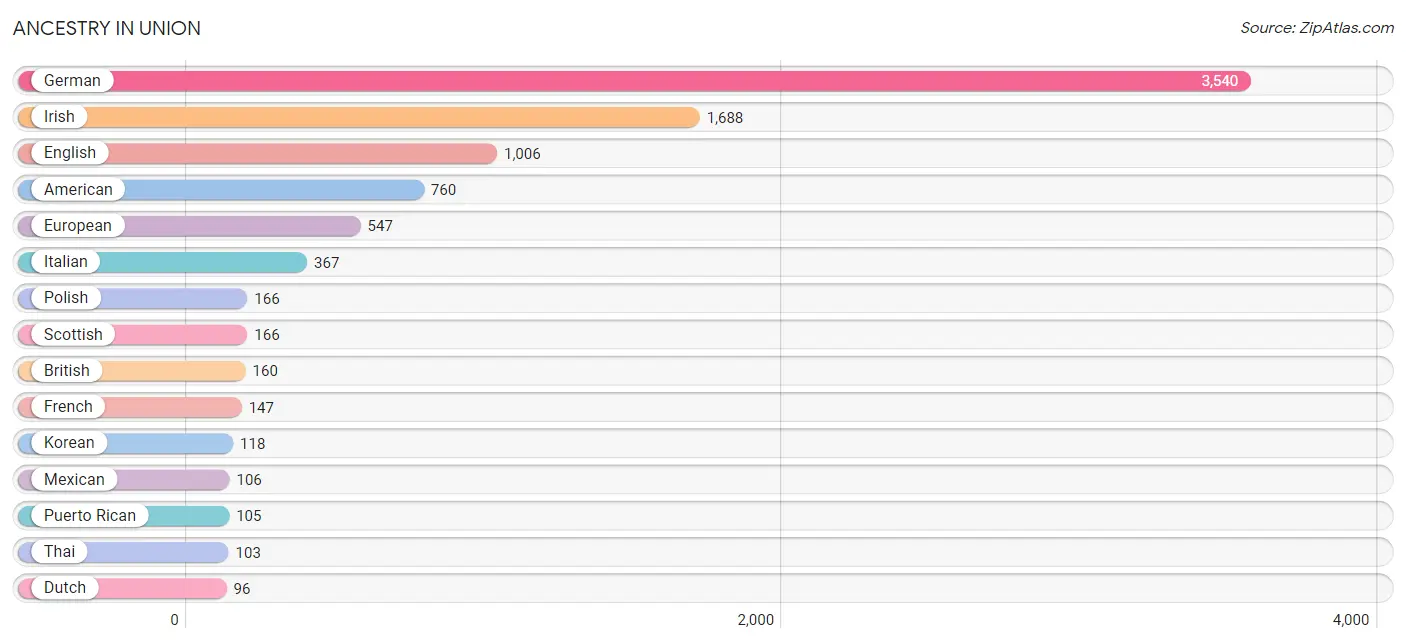
Ancestry in Union
The most populous ancestries reported in Union are German (3,540 | 28.7%), Irish (1,688 | 13.7%), English (1,006 | 8.2%), American (760 | 6.2%), and European (547 | 4.4%), together accounting for 61.1% of all Union residents.
| Ancestry | # Population | % Population |
| African | 25 | 0.2% |
| American | 760 | 6.2% |
| Austrian | 45 | 0.4% |
| Blackfeet | 20 | 0.2% |
| British | 160 | 1.3% |
| Cherokee | 32 | 0.3% |
| Chickasaw | 9 | 0.1% |
| Colombian | 23 | 0.2% |
| Cuban | 12 | 0.1% |
| Czech | 22 | 0.2% |
| Czechoslovakian | 50 | 0.4% |
| Dutch | 96 | 0.8% |
| Eastern European | 10 | 0.1% |
| English | 1,006 | 8.2% |
| European | 547 | 4.4% |
| French | 147 | 1.2% |
| German | 3,540 | 28.7% |
| Greek | 79 | 0.6% |
| Hungarian | 39 | 0.3% |
| Indian (Asian) | 30 | 0.2% |
| Irish | 1,688 | 13.7% |
| Italian | 367 | 3.0% |
| Korean | 118 | 1.0% |
| Mexican | 106 | 0.9% |
| Northern European | 30 | 0.2% |
| Norwegian | 35 | 0.3% |
| Polish | 166 | 1.3% |
| Pueblo | 5 | 0.0% |
| Puerto Rican | 105 | 0.9% |
| Romanian | 37 | 0.3% |
| Russian | 11 | 0.1% |
| Scandinavian | 25 | 0.2% |
| Scotch-Irish | 76 | 0.6% |
| Scottish | 166 | 1.3% |
| South American | 23 | 0.2% |
| Subsaharan African | 25 | 0.2% |
| Swedish | 77 | 0.6% |
| Thai | 103 | 0.8% |
| Welsh | 76 | 0.6% | View All 39 Rows |
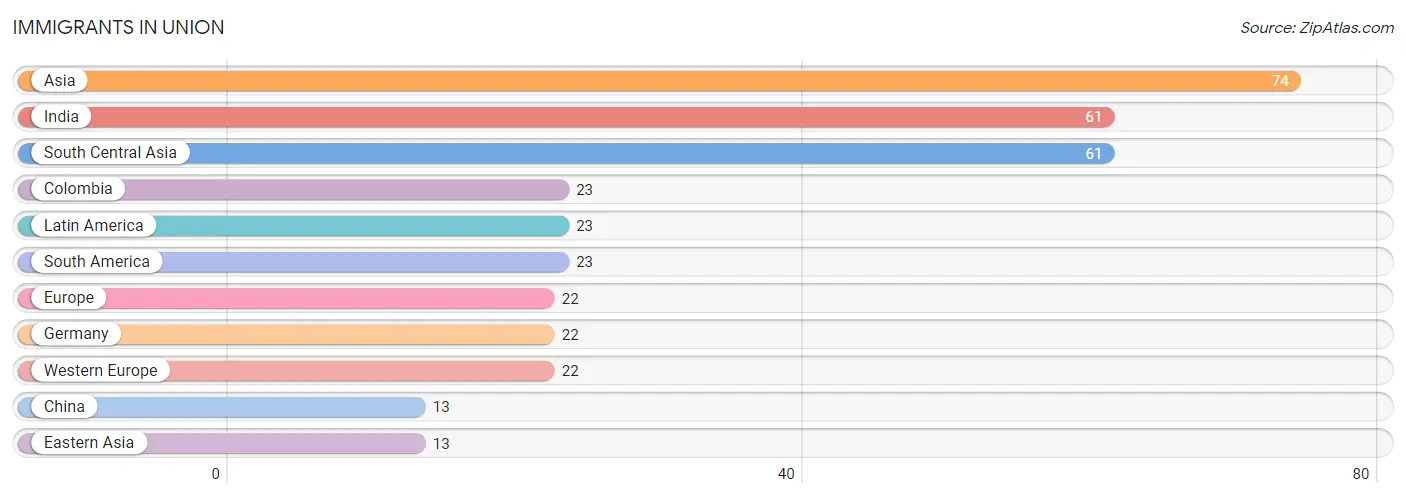
Immigrants in Union
The most numerous immigrant groups reported in Union came from Asia (74 | 0.6%), India (61 | 0.5%), South Central Asia (61 | 0.5%), Colombia (23 | 0.2%), and Latin America (23 | 0.2%), together accounting for 2.0% of all Union residents.
| Immigration Origin | # Population | % Population |
| Asia | 74 | 0.6% |
| China | 13 | 0.1% |
| Colombia | 23 | 0.2% |
| Eastern Asia | 13 | 0.1% |
| Europe | 22 | 0.2% |
| Germany | 22 | 0.2% |
| India | 61 | 0.5% |
| Latin America | 23 | 0.2% |
| South America | 23 | 0.2% |
| South Central Asia | 61 | 0.5% |
| Western Europe | 22 | 0.2% | View All 11 Rows |
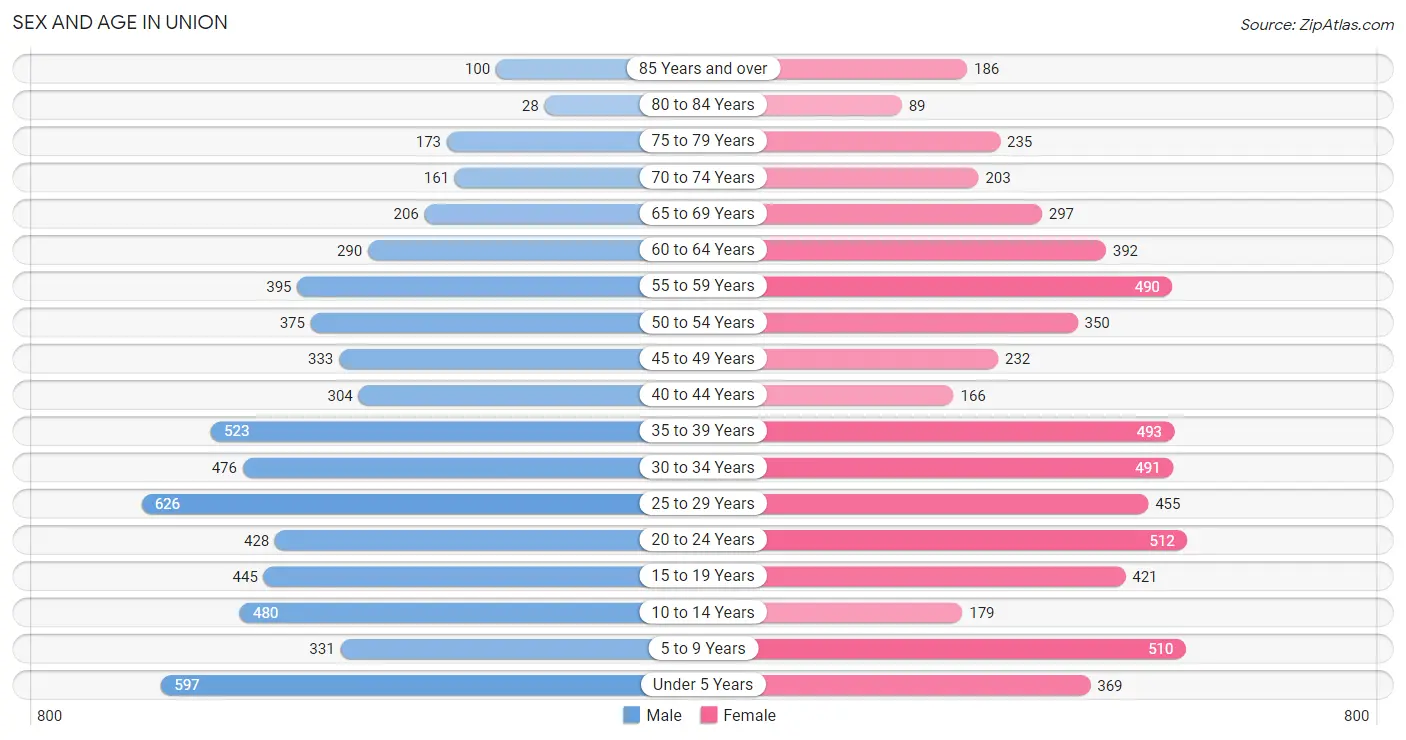
Sex and Age in Union
Sex and Age in Union
The most populous age groups in Union are 25 to 29 Years (626 | 10.0%) for men and 20 to 24 Years (512 | 8.4%) for women.
| Age Bracket | Male | Female |
| Under 5 Years | 597 (9.5%) | 369 (6.1%) |
| 5 to 9 Years | 331 (5.3%) | 510 (8.4%) |
| 10 to 14 Years | 480 (7.6%) | 179 (2.9%) |
| 15 to 19 Years | 445 (7.1%) | 421 (6.9%) |
| 20 to 24 Years | 428 (6.8%) | 512 (8.4%) |
| 25 to 29 Years | 626 (10.0%) | 455 (7.5%) |
| 30 to 34 Years | 476 (7.6%) | 491 (8.1%) |
| 35 to 39 Years | 523 (8.3%) | 493 (8.1%) |
| 40 to 44 Years | 304 (4.9%) | 166 (2.7%) |
| 45 to 49 Years | 333 (5.3%) | 232 (3.8%) |
| 50 to 54 Years | 375 (6.0%) | 350 (5.8%) |
| 55 to 59 Years | 395 (6.3%) | 490 (8.1%) |
| 60 to 64 Years | 290 (4.6%) | 392 (6.5%) |
| 65 to 69 Years | 206 (3.3%) | 297 (4.9%) |
| 70 to 74 Years | 161 (2.6%) | 203 (3.3%) |
| 75 to 79 Years | 173 (2.8%) | 235 (3.9%) |
| 80 to 84 Years | 28 (0.4%) | 89 (1.5%) |
| 85 Years and over | 100 (1.6%) | 186 (3.1%) |
| Total | 6,271 (100.0%) | 6,070 (100.0%) |
Families and Households in Union
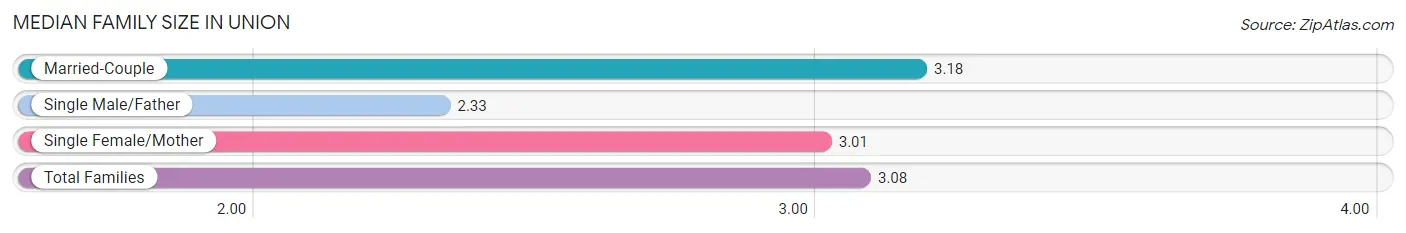
Median Family Size in Union
The median family size in Union is 3.08 persons per family, with married-couple families (2,196 | 71.7%) accounting for the largest median family size of 3.18 persons per family. On the other hand, single male/father families (234 | 7.6%) represent the smallest median family size with 2.33 persons per family.
| Family Type | # Families | Family Size |
| Married-Couple | 2,196 (71.7%) | 3.18 |
| Single Male/Father | 234 (7.6%) | 2.33 |
| Single Female/Mother | 634 (20.7%) | 3.01 |
| Total Families | 3,064 (100.0%) | 3.08 |
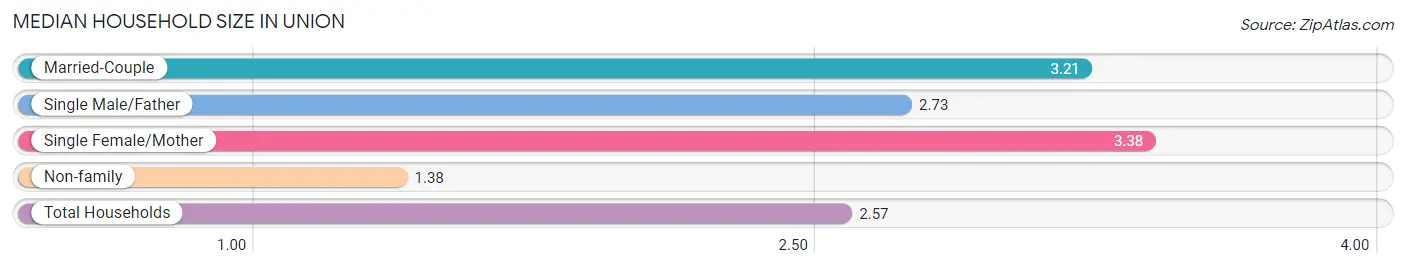
Median Household Size in Union
The median household size in Union is 2.57 persons per household, with single female/mother households (634 | 13.5%) accounting for the largest median household size of 3.38 persons per household. non-family households (1,644 | 34.9%) represent the smallest median household size with 1.38 persons per household.
| Household Type | # Households | Household Size |
| Married-Couple | 2,196 (46.6%) | 3.21 |
| Single Male/Father | 234 (5.0%) | 2.73 |
| Single Female/Mother | 634 (13.5%) | 3.38 |
| Non-family | 1,644 (34.9%) | 1.38 |
| Total Households | 4,708 (100.0%) | 2.57 |
Household Size by Marriage Status in Union
Out of a total of 4,708 households in Union, 3,064 (65.1%) are family households, while 1,644 (34.9%) are nonfamily households. The most numerous type of family households are 2-person households, comprising 1,425, and the most common type of nonfamily households are 1-person households, comprising 1,176.
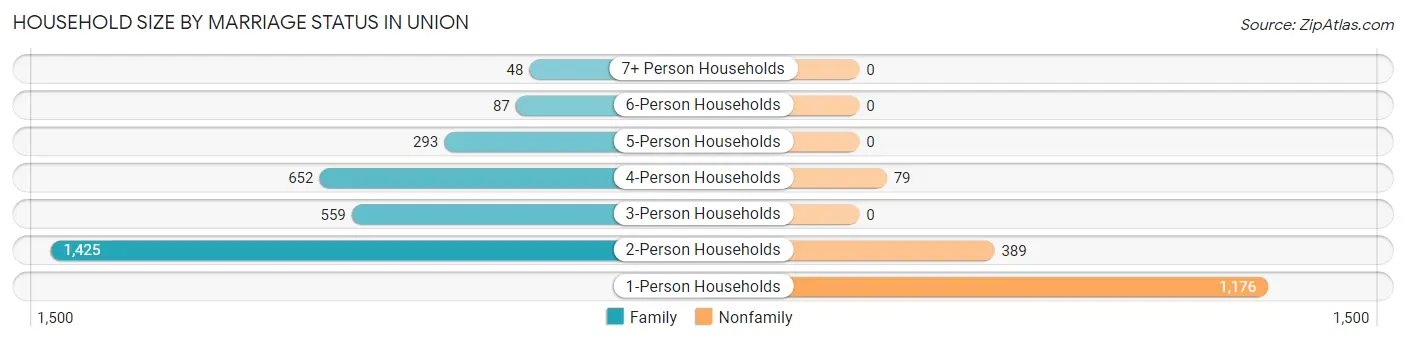
| Household Size | Family Households | Nonfamily Households |
| 1-Person Households | - | 1,176 (25.0%) |
| 2-Person Households | 1,425 (30.3%) | 389 (8.3%) |
| 3-Person Households | 559 (11.9%) | 0 (0.0%) |
| 4-Person Households | 652 (13.9%) | 79 (1.7%) |
| 5-Person Households | 293 (6.2%) | 0 (0.0%) |
| 6-Person Households | 87 (1.8%) | 0 (0.0%) |
| 7+ Person Households | 48 (1.0%) | 0 (0.0%) |
| Total | 3,064 (65.1%) | 1,644 (34.9%) |
Female Fertility in Union
Fertility by Age in Union
Average fertility rate in Union is 94.0 births per 1,000 women. Women in the age bracket of 20 to 34 years have the highest fertility rate with 184.0 births per 1,000 women. Women in the age bracket of 20 to 34 years acount for 100.0% of all women with births.
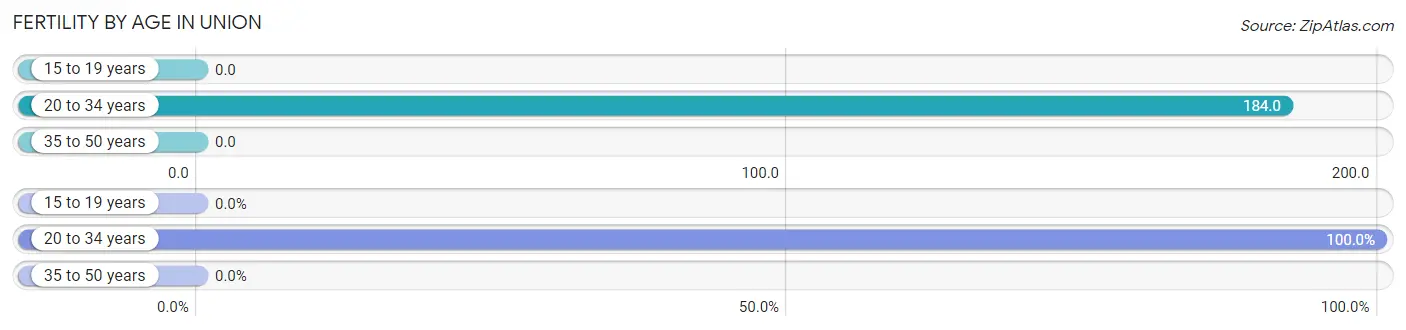
| Age Bracket | Women with Births | Births / 1,000 Women |
| 15 to 19 years | 0 (0.0%) | 0.0 |
| 20 to 34 years | 268 (100.0%) | 184.0 |
| 35 to 50 years | 0 (0.0%) | 0.0 |
| Total | 268 (100.0%) | 94.0 |
Fertility by Age by Marriage Status in Union
46.6% of women with births (268) in Union are married. The highest percentage of unmarried women with births falls into 20 to 34 years age bracket with 53.4% of them unmarried at the time of birth, while the lowest percentage of unmarried women with births belong to 20 to 34 years age bracket with 53.4% of them unmarried.
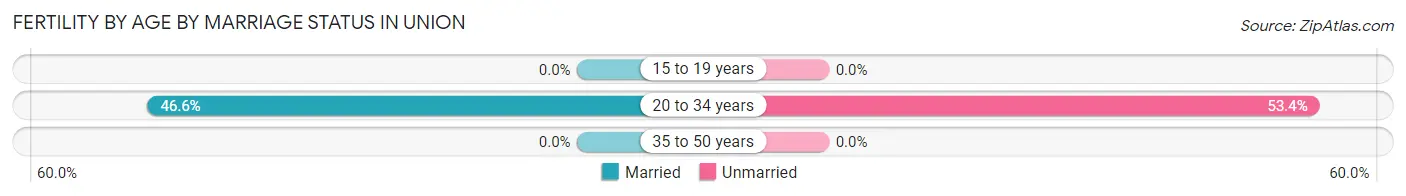
| Age Bracket | Married | Unmarried |
| 15 to 19 years | 0 (0.0%) | 0 (0.0%) |
| 20 to 34 years | 125 (46.6%) | 143 (53.4%) |
| 35 to 50 years | 0 (0.0%) | 0 (0.0%) |
| Total | 125 (46.6%) | 143 (53.4%) |
Fertility by Education in Union
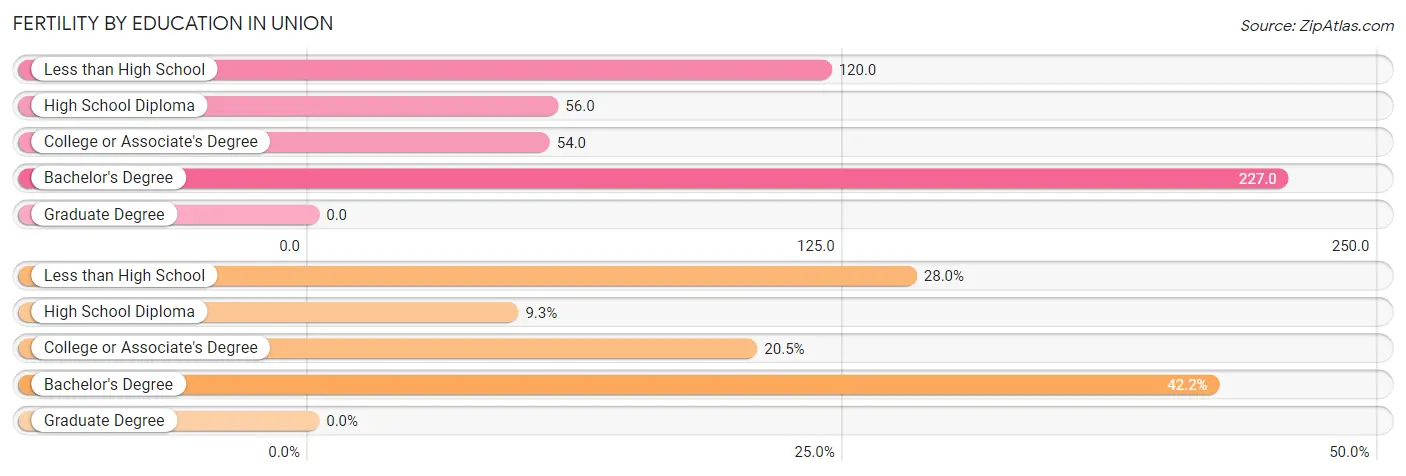
| Educational Attainment | Women with Births | Births / 1,000 Women |
| Less than High School | 75 (28.0%) | 120.0 |
| High School Diploma | 25 (9.3%) | 56.0 |
| College or Associate's Degree | 55 (20.5%) | 54.0 |
| Bachelor's Degree | 113 (42.2%) | 227.0 |
| Graduate Degree | 0 (0.0%) | 0.0 |
| Total | 268 (100.0%) | 94.0 |
Fertility by Education by Marriage Status in Union
53.4% of women with births in Union are unmarried. Women with the educational attainment of bachelor's degree are most likely to be married with 100.0% of them married at childbirth, while women with the educational attainment of less than high school are least likely to be married with 100.0% of them unmarried at childbirth.
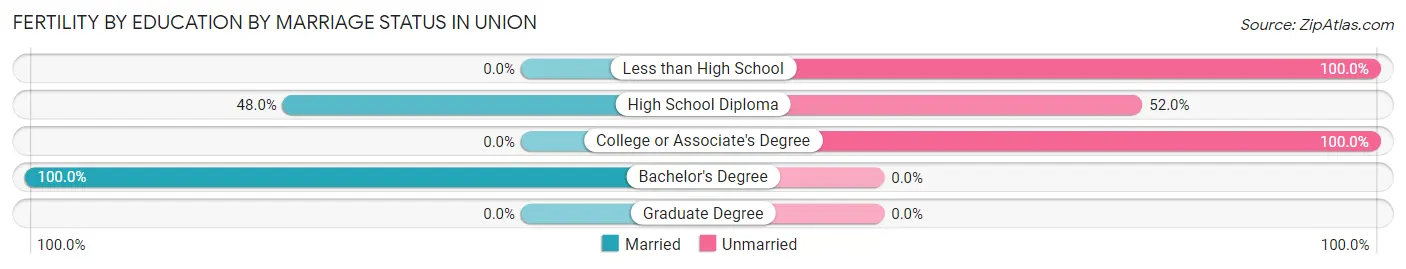
| Educational Attainment | Married | Unmarried |
| Less than High School | 0 (0.0%) | 75 (100.0%) |
| High School Diploma | 12 (48.0%) | 13 (52.0%) |
| College or Associate's Degree | 0 (0.0%) | 55 (100.0%) |
| Bachelor's Degree | 113 (100.0%) | 0 (0.0%) |
| Graduate Degree | 0 (0.0%) | 0 (0.0%) |
| Total | 125 (46.6%) | 143 (53.4%) |
Employment Characteristics in Union
Employment by Class of Employer in Union
Among the 6,004 employed individuals in Union, private company employees (4,146 | 69.1%), not-for-profit organizations (628 | 10.5%), and local government employees (490 | 8.2%) make up the most common classes of employment.
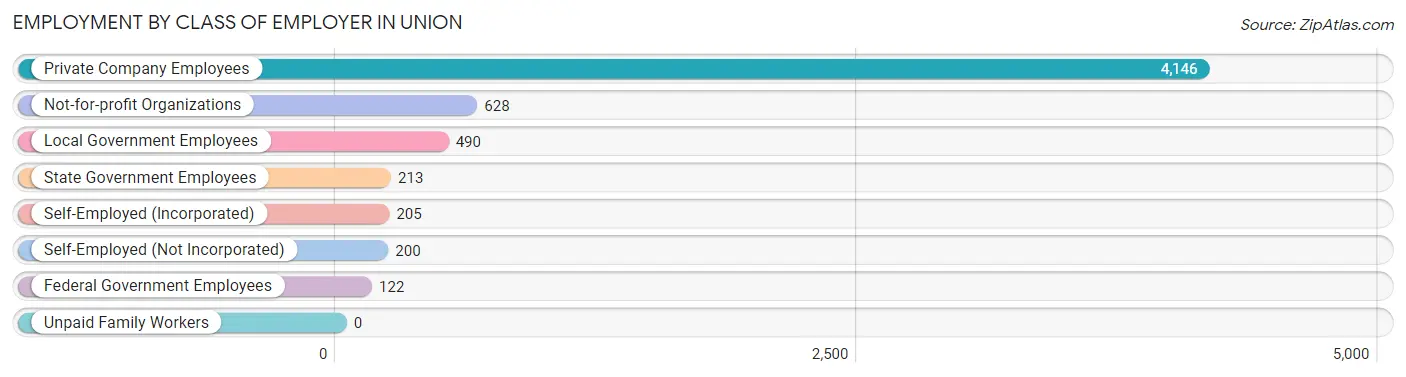
| Employer Class | # Employees | % Employees |
| Private Company Employees | 4,146 | 69.1% |
| Self-Employed (Incorporated) | 205 | 3.4% |
| Self-Employed (Not Incorporated) | 200 | 3.3% |
| Not-for-profit Organizations | 628 | 10.5% |
| Local Government Employees | 490 | 8.2% |
| State Government Employees | 213 | 3.5% |
| Federal Government Employees | 122 | 2.0% |
| Unpaid Family Workers | 0 | 0.0% |
| Total | 6,004 | 100.0% |
Employment Status by Age in Union
According to the labor force statistics for Union, out of the total population over 16 years of age (9,722), 65.9% or 6,407 individuals are in the labor force, with 5.6% or 359 of them unemployed. The age group with the highest labor force participation rate is 20 to 24 years, with 92.6% or 870 individuals in the labor force. Within the labor force, the 30 to 34 years age range has the highest percentage of unemployed individuals, with 18.0% or 156 of them being unemployed.
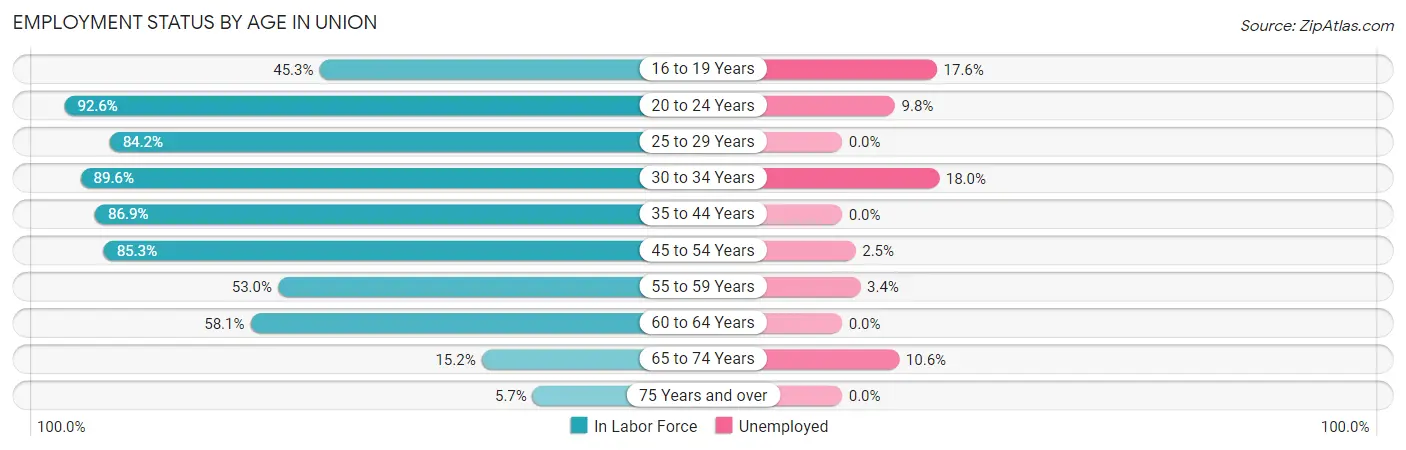
| Age Bracket | In Labor Force | Unemployed |
| 16 to 19 Years | 323 (45.3%) | 57 (17.6%) |
| 20 to 24 Years | 870 (92.6%) | 85 (9.8%) |
| 25 to 29 Years | 910 (84.2%) | 0 (0.0%) |
| 30 to 34 Years | 866 (89.6%) | 156 (18.0%) |
| 35 to 44 Years | 1,291 (86.9%) | 0 (0.0%) |
| 45 to 54 Years | 1,100 (85.3%) | 28 (2.5%) |
| 55 to 59 Years | 469 (53.0%) | 16 (3.4%) |
| 60 to 64 Years | 396 (58.1%) | 0 (0.0%) |
| 65 to 74 Years | 132 (15.2%) | 14 (10.6%) |
| 75 Years and over | 46 (5.7%) | 0 (0.0%) |
| Total | 6,407 (65.9%) | 359 (5.6%) |
Employment Status by Educational Attainment in Union
According to labor force statistics for Union, 78.8% of individuals (5,036) out of the total population between 25 and 64 years of age (6,391) are in the labor force, with 4.0% or 201 of them being unemployed. The group with the highest labor force participation rate are those with the educational attainment of college / associate degree, with 87.8% or 1,953 individuals in the labor force. Within the labor force, individuals with bachelor's degree or higher education have the highest percentage of unemployment, with 8.5% or 112 of them being unemployed.
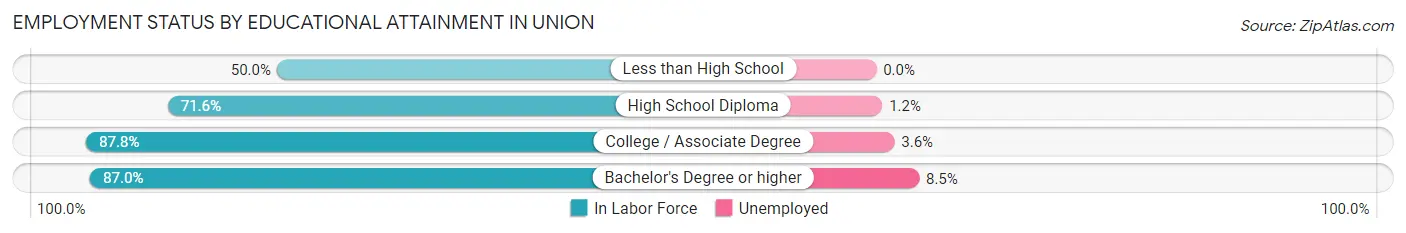
| Educational Attainment | In Labor Force | Unemployed |
| Less than High School | 319 (50.0%) | 0 (0.0%) |
| High School Diploma | 1,438 (71.6%) | 24 (1.2%) |
| College / Associate Degree | 1,953 (87.8%) | 80 (3.6%) |
| Bachelor's Degree or higher | 1,323 (87.0%) | 129 (8.5%) |
| Total | 5,036 (78.8%) | 256 (4.0%) |
Employment Occupations by Sex in Union
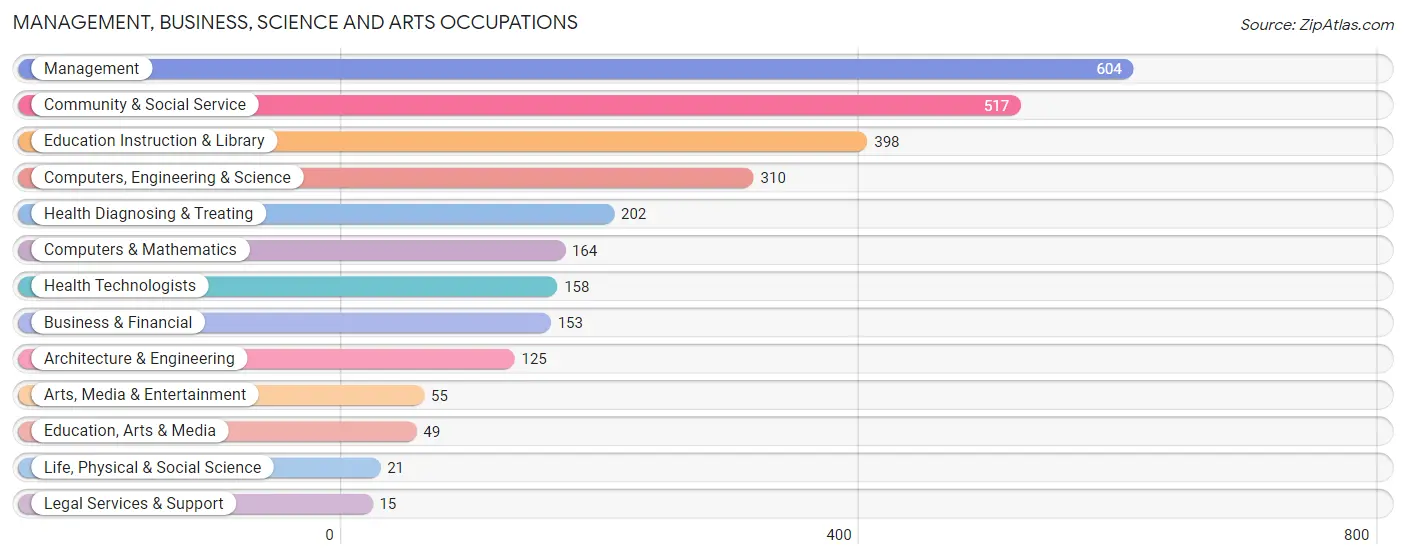
Management, Business, Science and Arts Occupations
The most common Management, Business, Science and Arts occupations in Union are Management (604 | 10.1%), Community & Social Service (517 | 8.6%), Education Instruction & Library (398 | 6.6%), Computers, Engineering & Science (310 | 5.2%), and Health Diagnosing & Treating (202 | 3.4%).
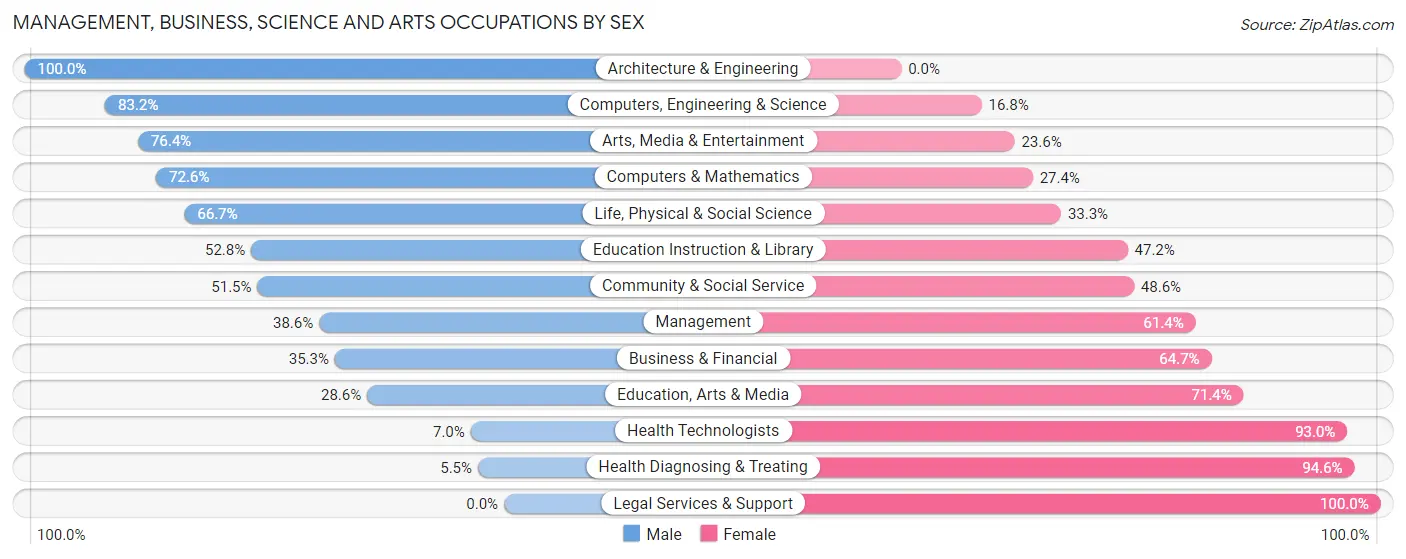
Management, Business, Science and Arts Occupations by Sex
Within the Management, Business, Science and Arts occupations in Union, the most male-oriented occupations are Architecture & Engineering (100.0%), Computers, Engineering & Science (83.2%), and Arts, Media & Entertainment (76.4%), while the most female-oriented occupations are Legal Services & Support (100.0%), Health Diagnosing & Treating (94.6%), and Health Technologists (93.0%).
| Occupation | Male | Female |
| Management | 233 (38.6%) | 371 (61.4%) |
| Business & Financial | 54 (35.3%) | 99 (64.7%) |
| Computers, Engineering & Science | 258 (83.2%) | 52 (16.8%) |
| Computers & Mathematics | 119 (72.6%) | 45 (27.4%) |
| Architecture & Engineering | 125 (100.0%) | 0 (0.0%) |
| Life, Physical & Social Science | 14 (66.7%) | 7 (33.3%) |
| Community & Social Service | 266 (51.4%) | 251 (48.5%) |
| Education, Arts & Media | 14 (28.6%) | 35 (71.4%) |
| Legal Services & Support | 0 (0.0%) | 15 (100.0%) |
| Education Instruction & Library | 210 (52.8%) | 188 (47.2%) |
| Arts, Media & Entertainment | 42 (76.4%) | 13 (23.6%) |
| Health Diagnosing & Treating | 11 (5.4%) | 191 (94.6%) |
| Health Technologists | 11 (7.0%) | 147 (93.0%) |
| Total (Category) | 822 (46.0%) | 964 (54.0%) |
| Total (Overall) | 3,186 (53.1%) | 2,814 (46.9%) |
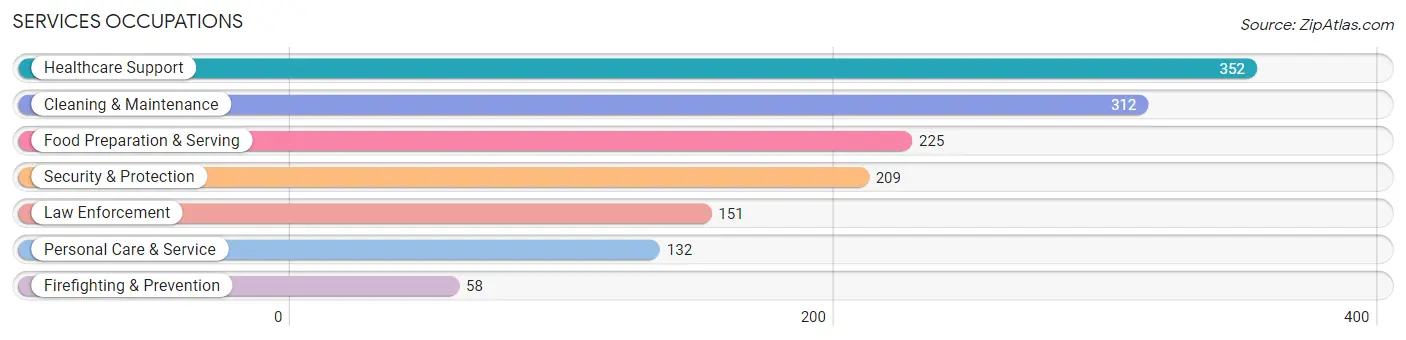
Services Occupations
The most common Services occupations in Union are Healthcare Support (352 | 5.9%), Cleaning & Maintenance (312 | 5.2%), Food Preparation & Serving (225 | 3.7%), Security & Protection (209 | 3.5%), and Law Enforcement (151 | 2.5%).
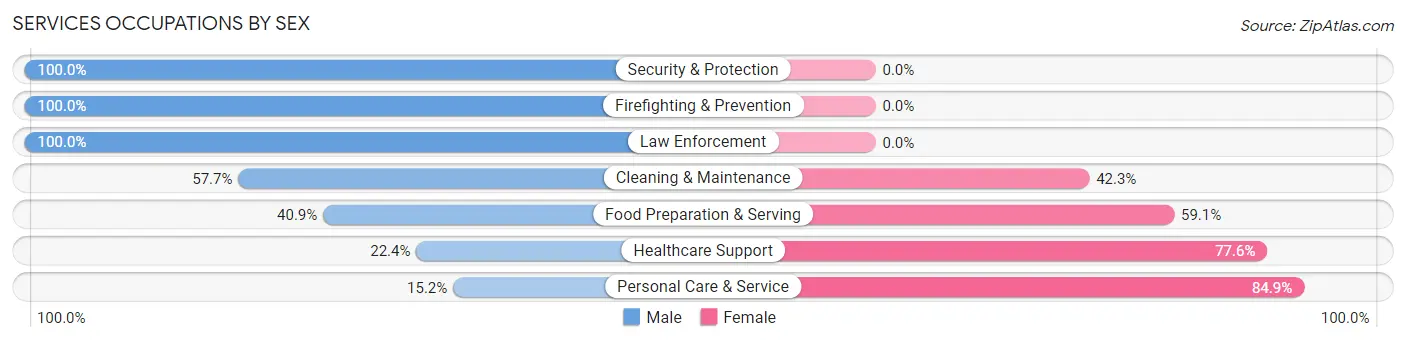
Services Occupations by Sex
Within the Services occupations in Union, the most male-oriented occupations are Security & Protection (100.0%), Firefighting & Prevention (100.0%), and Law Enforcement (100.0%), while the most female-oriented occupations are Personal Care & Service (84.9%), Healthcare Support (77.6%), and Food Preparation & Serving (59.1%).
| Occupation | Male | Female |
| Healthcare Support | 79 (22.4%) | 273 (77.6%) |
| Security & Protection | 209 (100.0%) | 0 (0.0%) |
| Firefighting & Prevention | 58 (100.0%) | 0 (0.0%) |
| Law Enforcement | 151 (100.0%) | 0 (0.0%) |
| Food Preparation & Serving | 92 (40.9%) | 133 (59.1%) |
| Cleaning & Maintenance | 180 (57.7%) | 132 (42.3%) |
| Personal Care & Service | 20 (15.1%) | 112 (84.9%) |
| Total (Category) | 580 (47.1%) | 650 (52.8%) |
| Total (Overall) | 3,186 (53.1%) | 2,814 (46.9%) |
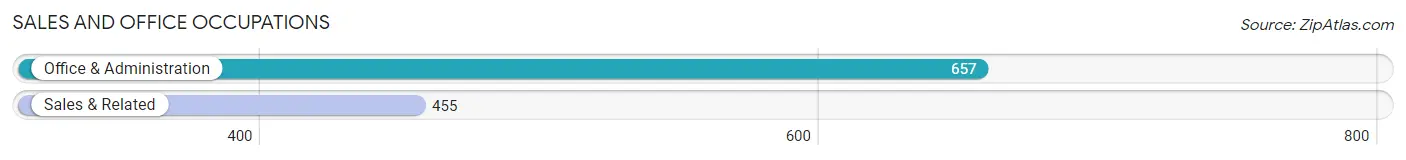
Sales and Office Occupations
The most common Sales and Office occupations in Union are Office & Administration (657 | 11.0%), and Sales & Related (455 | 7.6%).
Sales and Office Occupations by Sex
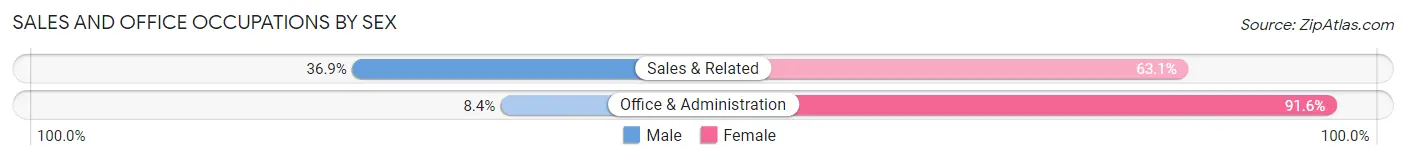
| Occupation | Male | Female |
| Sales & Related | 168 (36.9%) | 287 (63.1%) |
| Office & Administration | 55 (8.4%) | 602 (91.6%) |
| Total (Category) | 223 (20.1%) | 889 (79.9%) |
| Total (Overall) | 3,186 (53.1%) | 2,814 (46.9%) |
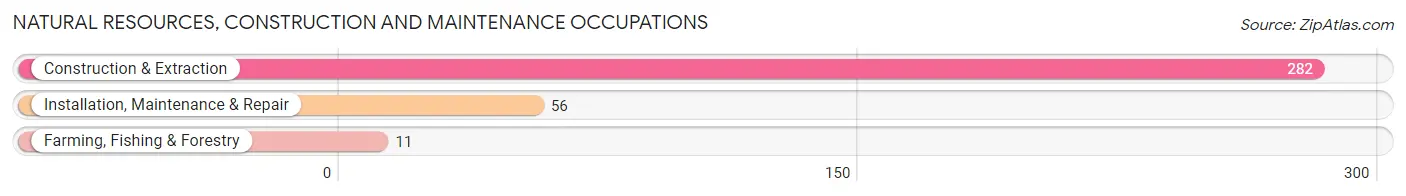
Natural Resources, Construction and Maintenance Occupations
The most common Natural Resources, Construction and Maintenance occupations in Union are Construction & Extraction (282 | 4.7%), Installation, Maintenance & Repair (56 | 0.9%), and Farming, Fishing & Forestry (11 | 0.2%).
Natural Resources, Construction and Maintenance Occupations by Sex
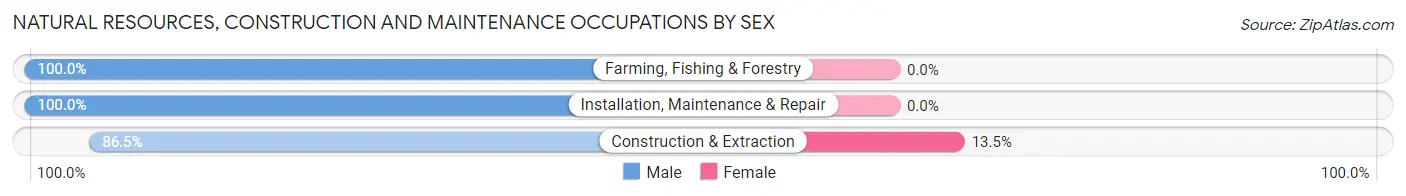
| Occupation | Male | Female |
| Farming, Fishing & Forestry | 11 (100.0%) | 0 (0.0%) |
| Construction & Extraction | 244 (86.5%) | 38 (13.5%) |
| Installation, Maintenance & Repair | 56 (100.0%) | 0 (0.0%) |
| Total (Category) | 311 (89.1%) | 38 (10.9%) |
| Total (Overall) | 3,186 (53.1%) | 2,814 (46.9%) |
Production, Transportation and Moving Occupations
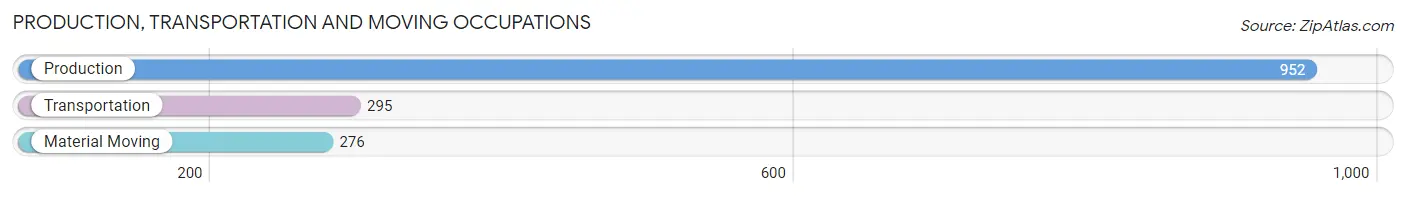
The most common Production, Transportation and Moving occupations in Union are Production (952 | 15.9%), Transportation (295 | 4.9%), and Material Moving (276 | 4.6%).
Production, Transportation and Moving Occupations by Sex
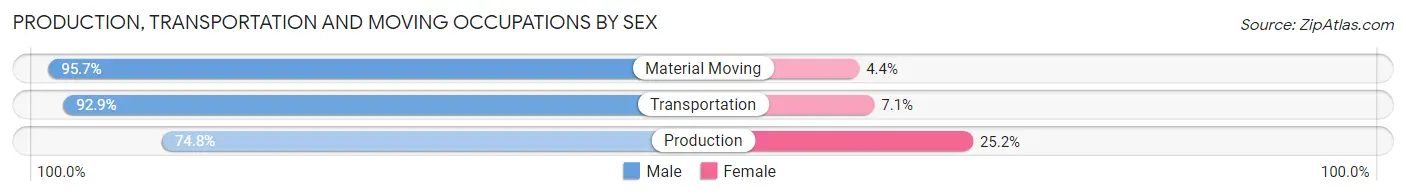
| Occupation | Male | Female |
| Production | 712 (74.8%) | 240 (25.2%) |
| Transportation | 274 (92.9%) | 21 (7.1%) |
| Material Moving | 264 (95.7%) | 12 (4.3%) |
| Total (Category) | 1,250 (82.1%) | 273 (17.9%) |
| Total (Overall) | 3,186 (53.1%) | 2,814 (46.9%) |
Employment Industries by Sex in Union
Employment Industries in Union
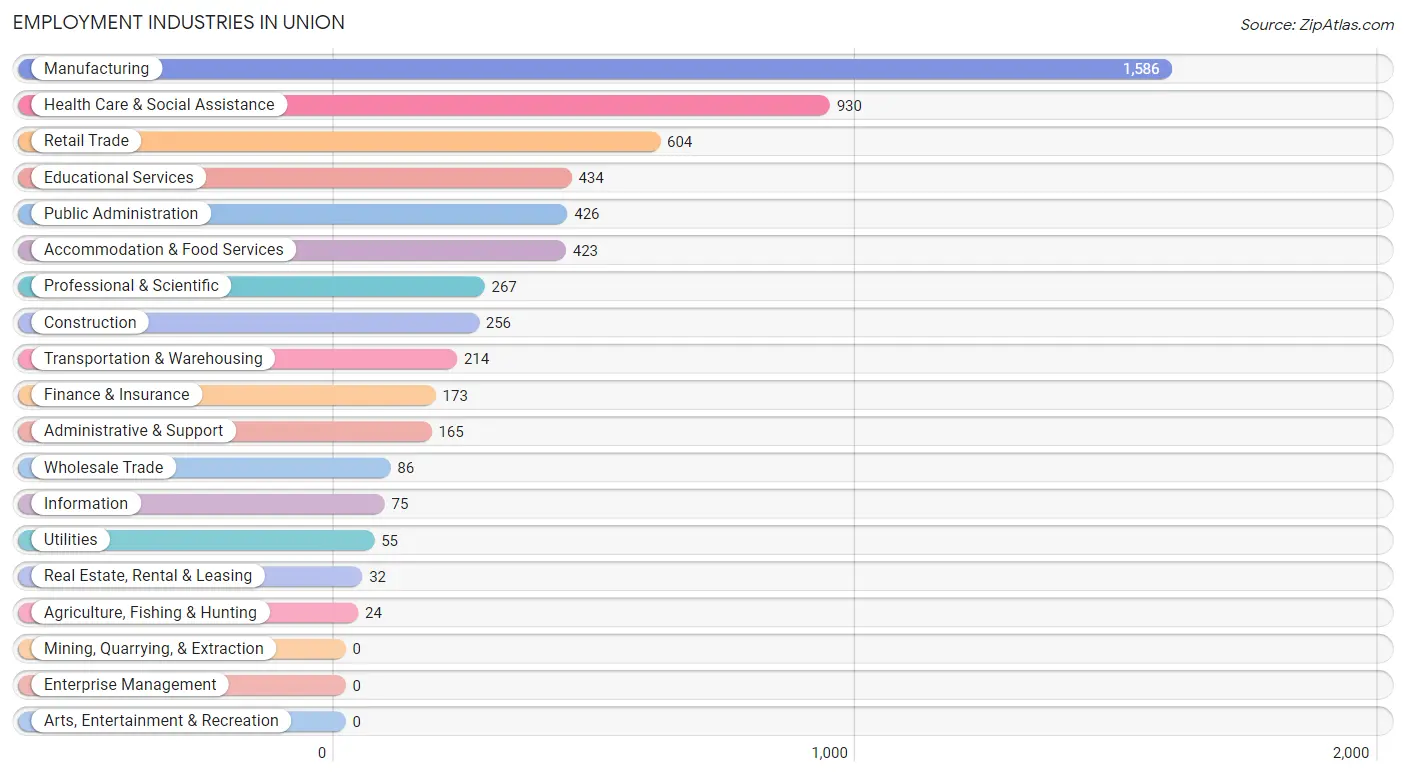
The major employment industries in Union include Manufacturing (1,586 | 26.4%), Health Care & Social Assistance (930 | 15.5%), Retail Trade (604 | 10.1%), Educational Services (434 | 7.2%), and Public Administration (426 | 7.1%).
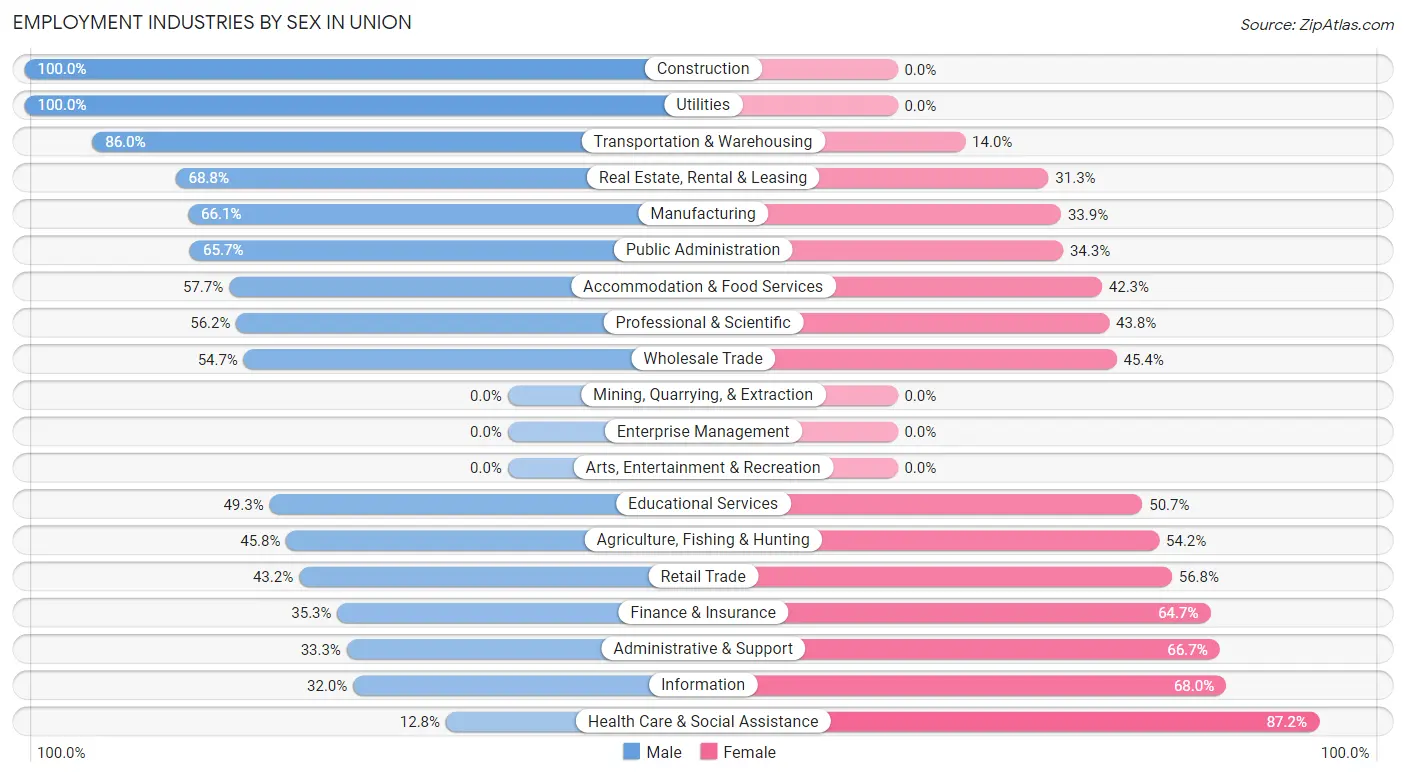
Employment Industries by Sex in Union
The Union industries that see more men than women are Construction (100.0%), Utilities (100.0%), and Transportation & Warehousing (86.0%), whereas the industries that tend to have a higher number of women are Health Care & Social Assistance (87.2%), Information (68.0%), and Administrative & Support (66.7%).
| Industry | Male | Female |
| Agriculture, Fishing & Hunting | 11 (45.8%) | 13 (54.2%) |
| Mining, Quarrying, & Extraction | 0 (0.0%) | 0 (0.0%) |
| Construction | 256 (100.0%) | 0 (0.0%) |
| Manufacturing | 1,049 (66.1%) | 537 (33.9%) |
| Wholesale Trade | 47 (54.6%) | 39 (45.4%) |
| Retail Trade | 261 (43.2%) | 343 (56.8%) |
| Transportation & Warehousing | 184 (86.0%) | 30 (14.0%) |
| Utilities | 55 (100.0%) | 0 (0.0%) |
| Information | 24 (32.0%) | 51 (68.0%) |
| Finance & Insurance | 61 (35.3%) | 112 (64.7%) |
| Real Estate, Rental & Leasing | 22 (68.8%) | 10 (31.2%) |
| Professional & Scientific | 150 (56.2%) | 117 (43.8%) |
| Enterprise Management | 0 (0.0%) | 0 (0.0%) |
| Administrative & Support | 55 (33.3%) | 110 (66.7%) |
| Educational Services | 214 (49.3%) | 220 (50.7%) |
| Health Care & Social Assistance | 119 (12.8%) | 811 (87.2%) |
| Arts, Entertainment & Recreation | 0 (0.0%) | 0 (0.0%) |
| Accommodation & Food Services | 244 (57.7%) | 179 (42.3%) |
| Public Administration | 280 (65.7%) | 146 (34.3%) |
| Total | 3,186 (53.1%) | 2,814 (46.9%) |
Education in Union
School Enrollment in Union
The most common levels of schooling among the 2,819 students in Union are high school (683 | 24.2%), elementary school (681 | 24.2%), and middle school (579 | 20.5%).
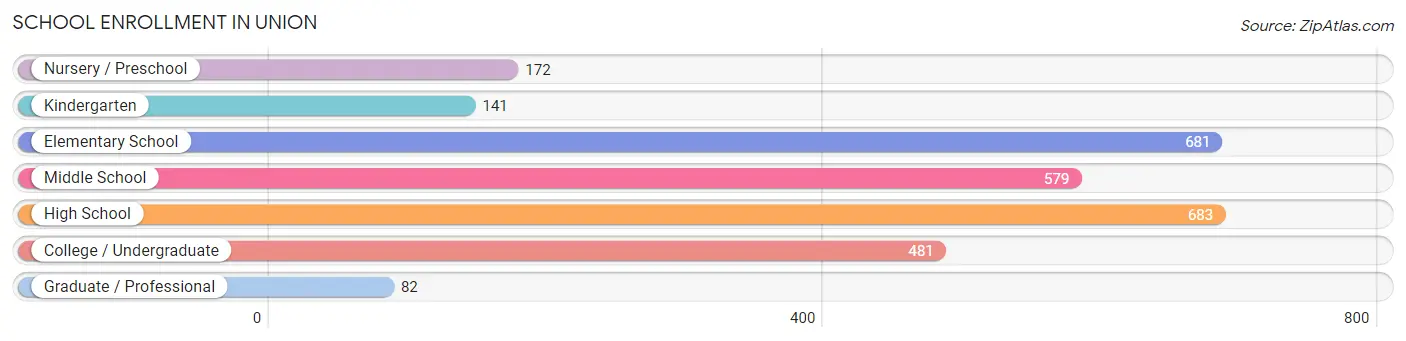
| School Level | # Students | % Students |
| Nursery / Preschool | 172 | 6.1% |
| Kindergarten | 141 | 5.0% |
| Elementary School | 681 | 24.2% |
| Middle School | 579 | 20.5% |
| High School | 683 | 24.2% |
| College / Undergraduate | 481 | 17.1% |
| Graduate / Professional | 82 | 2.9% |
| Total | 2,819 | 100.0% |
School Enrollment by Age by Funding Source in Union
Out of a total of 2,819 students who are enrolled in schools in Union, 462 (16.4%) attend a private institution, while the remaining 2,357 (83.6%) are enrolled in public schools. The age group of 35 years and over has the highest likelihood of being enrolled in private schools, with 68 (49.6% in the age bracket) enrolled. Conversely, the age group of 15 to 17 year olds has the lowest likelihood of being enrolled in a private school, with 554 (97.9% in the age bracket) attending a public institution.
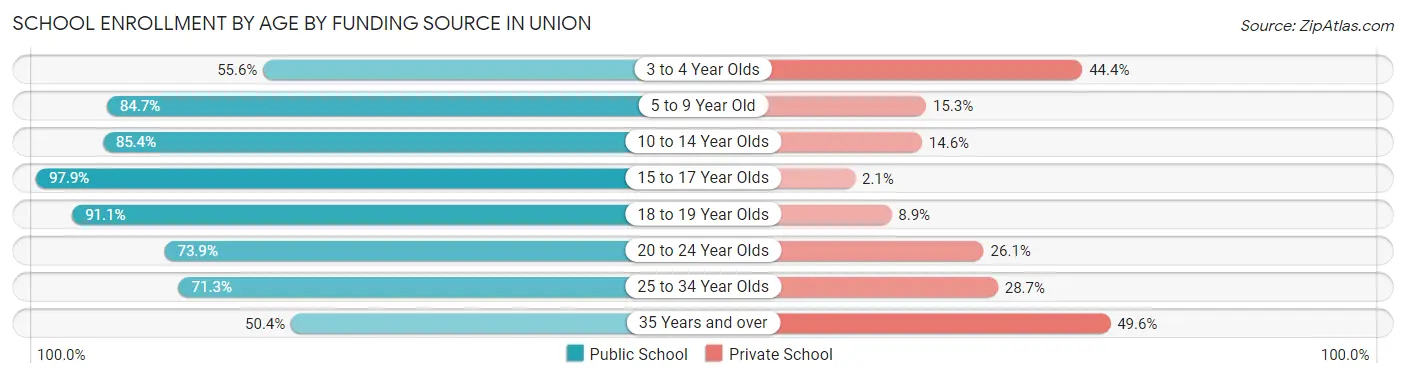
| Age Bracket | Public School | Private School |
| 3 to 4 Year Olds | 60 (55.6%) | 48 (44.4%) |
| 5 to 9 Year Old | 690 (84.7%) | 125 (15.3%) |
| 10 to 14 Year Olds | 563 (85.4%) | 96 (14.6%) |
| 15 to 17 Year Olds | 554 (97.9%) | 12 (2.1%) |
| 18 to 19 Year Olds | 154 (91.1%) | 15 (8.9%) |
| 20 to 24 Year Olds | 190 (73.9%) | 67 (26.1%) |
| 25 to 34 Year Olds | 77 (71.3%) | 31 (28.7%) |
| 35 Years and over | 69 (50.4%) | 68 (49.6%) |
| Total | 2,357 (83.6%) | 462 (16.4%) |
Educational Attainment by Field of Study in Union
Education (290 | 15.8%), science & technology (271 | 14.8%), psychology (256 | 13.9%), business (237 | 12.9%), and bio, nature & agricultural (183 | 10.0%) are the most common fields of study among 1,836 individuals in Union who have obtained a bachelor's degree or higher.
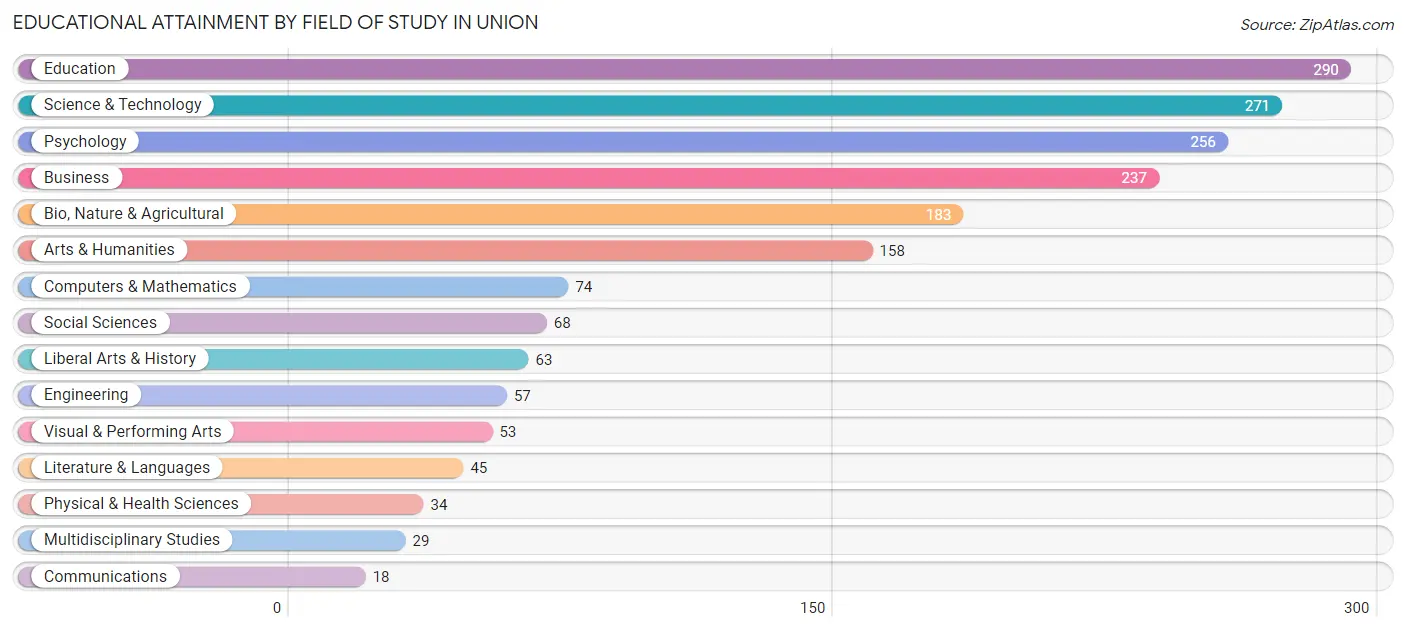
| Field of Study | # Graduates | % Graduates |
| Computers & Mathematics | 74 | 4.0% |
| Bio, Nature & Agricultural | 183 | 10.0% |
| Physical & Health Sciences | 34 | 1.8% |
| Psychology | 256 | 13.9% |
| Social Sciences | 68 | 3.7% |
| Engineering | 57 | 3.1% |
| Multidisciplinary Studies | 29 | 1.6% |
| Science & Technology | 271 | 14.8% |
| Business | 237 | 12.9% |
| Education | 290 | 15.8% |
| Literature & Languages | 45 | 2.5% |
| Liberal Arts & History | 63 | 3.4% |
| Visual & Performing Arts | 53 | 2.9% |
| Communications | 18 | 1.0% |
| Arts & Humanities | 158 | 8.6% |
| Total | 1,836 | 100.0% |
Transportation & Commute in Union
Vehicle Availability by Sex in Union
The most prevalent vehicle ownership categories in Union are males with 2 vehicles (1,618, accounting for 50.6%) and females with 2 vehicles (1,506, making up 57.7%).
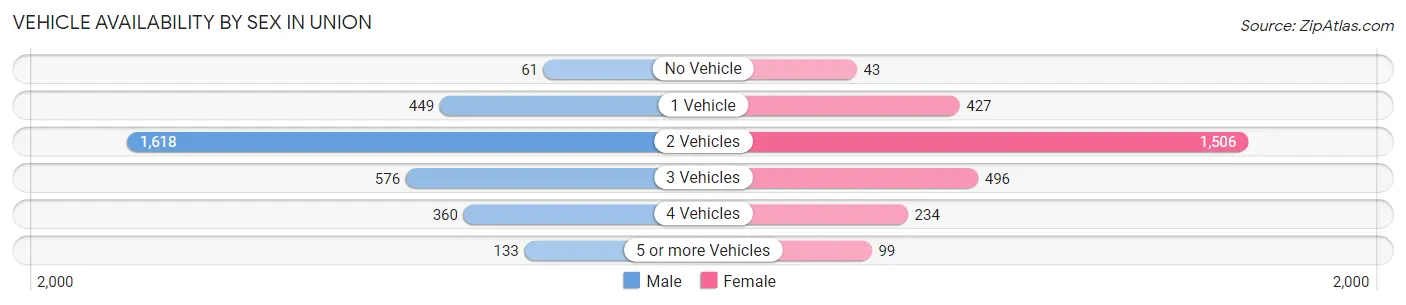
| Vehicles Available | Male | Female |
| No Vehicle | 61 (1.9%) | 43 (1.5%) |
| 1 Vehicle | 449 (14.0%) | 427 (15.2%) |
| 2 Vehicles | 1,618 (50.6%) | 1,506 (53.7%) |
| 3 Vehicles | 576 (18.0%) | 496 (17.7%) |
| 4 Vehicles | 360 (11.3%) | 234 (8.3%) |
| 5 or more Vehicles | 133 (4.2%) | 99 (3.5%) |
| Total | 3,197 (100.0%) | 2,805 (100.0%) |
Commute Time in Union
The most frequently occuring commute durations in Union are 20 to 24 minutes (858 commuters, 15.3%), 5 to 9 minutes (808 commuters, 14.4%), and 15 to 19 minutes (742 commuters, 13.2%).
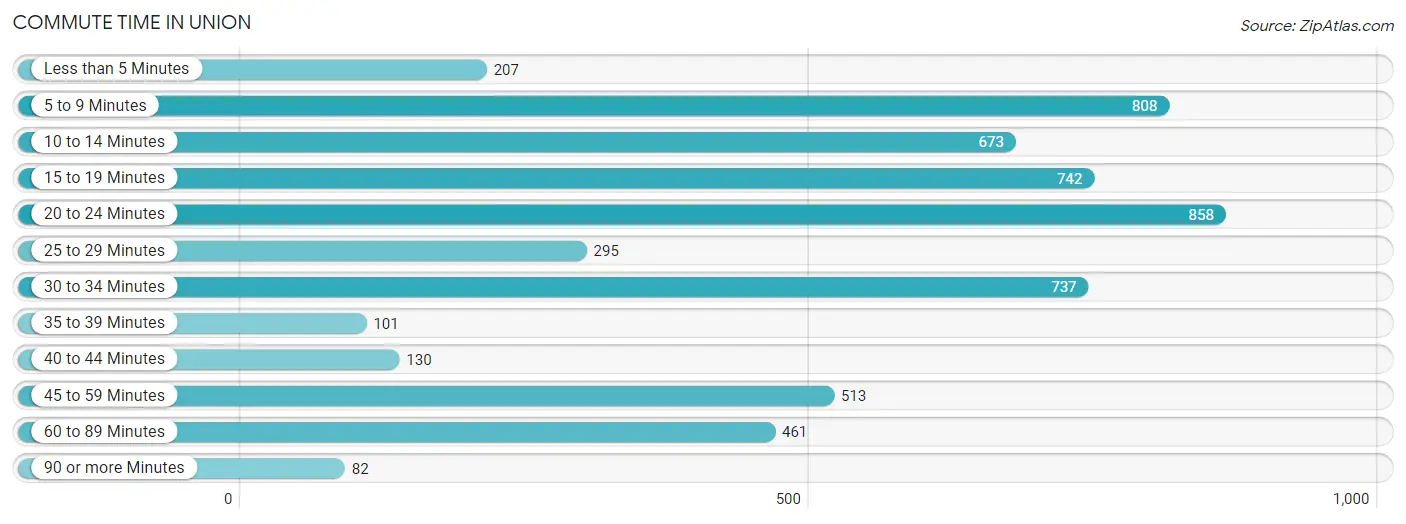
| Commute Time | # Commuters | % Commuters |
| Less than 5 Minutes | 207 | 3.7% |
| 5 to 9 Minutes | 808 | 14.4% |
| 10 to 14 Minutes | 673 | 12.0% |
| 15 to 19 Minutes | 742 | 13.2% |
| 20 to 24 Minutes | 858 | 15.3% |
| 25 to 29 Minutes | 295 | 5.3% |
| 30 to 34 Minutes | 737 | 13.1% |
| 35 to 39 Minutes | 101 | 1.8% |
| 40 to 44 Minutes | 130 | 2.3% |
| 45 to 59 Minutes | 513 | 9.1% |
| 60 to 89 Minutes | 461 | 8.2% |
| 90 or more Minutes | 82 | 1.5% |
Commute Time by Sex in Union
The most common commute times in Union are 15 to 19 minutes (489 commuters, 15.6%) for males and 20 to 24 minutes (443 commuters, 17.9%) for females.
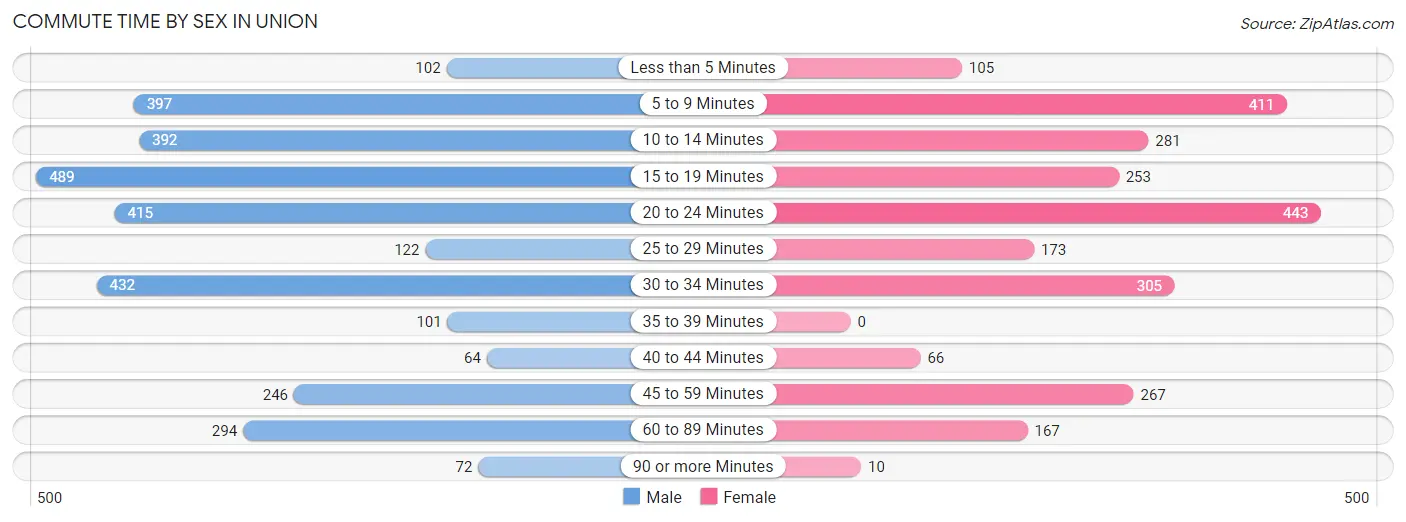
| Commute Time | Male | Female |
| Less than 5 Minutes | 102 (3.3%) | 105 (4.2%) |
| 5 to 9 Minutes | 397 (12.7%) | 411 (16.6%) |
| 10 to 14 Minutes | 392 (12.5%) | 281 (11.3%) |
| 15 to 19 Minutes | 489 (15.6%) | 253 (10.2%) |
| 20 to 24 Minutes | 415 (13.3%) | 443 (17.9%) |
| 25 to 29 Minutes | 122 (3.9%) | 173 (7.0%) |
| 30 to 34 Minutes | 432 (13.8%) | 305 (12.3%) |
| 35 to 39 Minutes | 101 (3.2%) | 0 (0.0%) |
| 40 to 44 Minutes | 64 (2.1%) | 66 (2.7%) |
| 45 to 59 Minutes | 246 (7.9%) | 267 (10.8%) |
| 60 to 89 Minutes | 294 (9.4%) | 167 (6.7%) |
| 90 or more Minutes | 72 (2.3%) | 10 (0.4%) |
Time of Departure to Work by Sex in Union
The most frequent times of departure to work in Union are 5:30 AM to 5:59 AM (491, 15.7%) for males and 7:30 AM to 7:59 AM (543, 21.9%) for females.
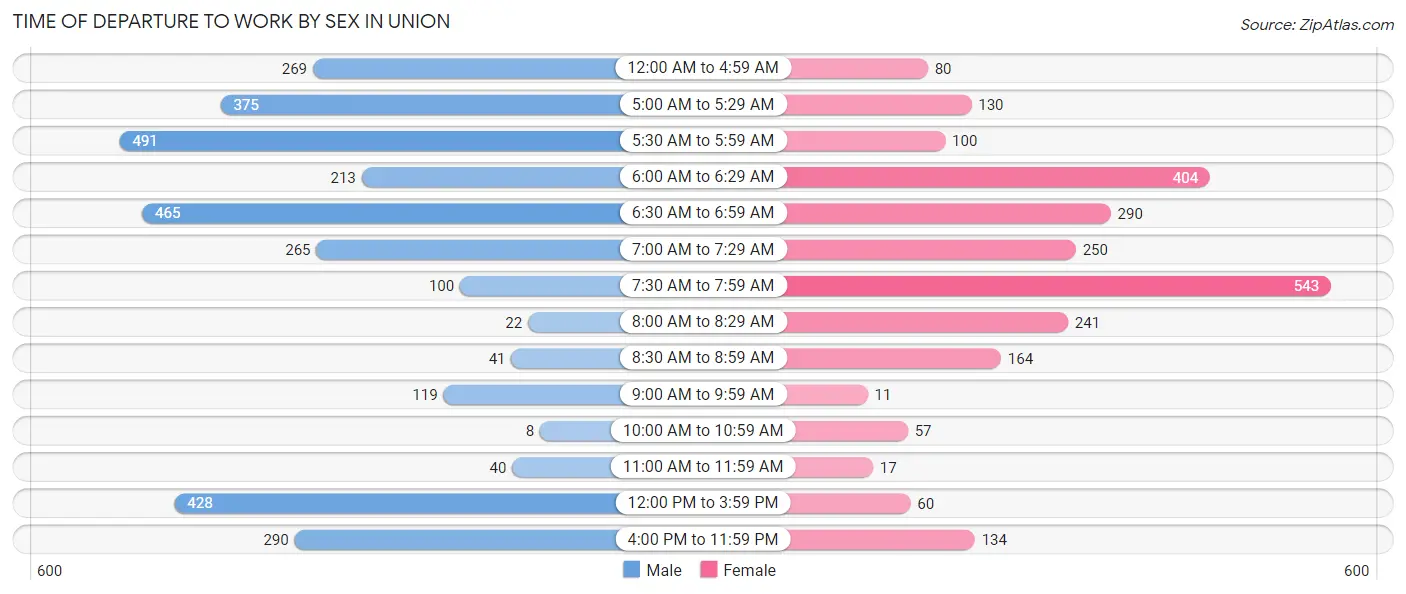
| Time of Departure | Male | Female |
| 12:00 AM to 4:59 AM | 269 (8.6%) | 80 (3.2%) |
| 5:00 AM to 5:29 AM | 375 (12.0%) | 130 (5.2%) |
| 5:30 AM to 5:59 AM | 491 (15.7%) | 100 (4.0%) |
| 6:00 AM to 6:29 AM | 213 (6.8%) | 404 (16.3%) |
| 6:30 AM to 6:59 AM | 465 (14.9%) | 290 (11.7%) |
| 7:00 AM to 7:29 AM | 265 (8.5%) | 250 (10.1%) |
| 7:30 AM to 7:59 AM | 100 (3.2%) | 543 (21.9%) |
| 8:00 AM to 8:29 AM | 22 (0.7%) | 241 (9.7%) |
| 8:30 AM to 8:59 AM | 41 (1.3%) | 164 (6.6%) |
| 9:00 AM to 9:59 AM | 119 (3.8%) | 11 (0.4%) |
| 10:00 AM to 10:59 AM | 8 (0.3%) | 57 (2.3%) |
| 11:00 AM to 11:59 AM | 40 (1.3%) | 17 (0.7%) |
| 12:00 PM to 3:59 PM | 428 (13.7%) | 60 (2.4%) |
| 4:00 PM to 11:59 PM | 290 (9.3%) | 134 (5.4%) |
| Total | 3,126 (100.0%) | 2,481 (100.0%) |
Housing Occupancy in Union
Occupancy by Ownership in Union
Of the total 4,708 dwellings in Union, owner-occupied units account for 2,974 (63.2%), while renter-occupied units make up 1,734 (36.8%).
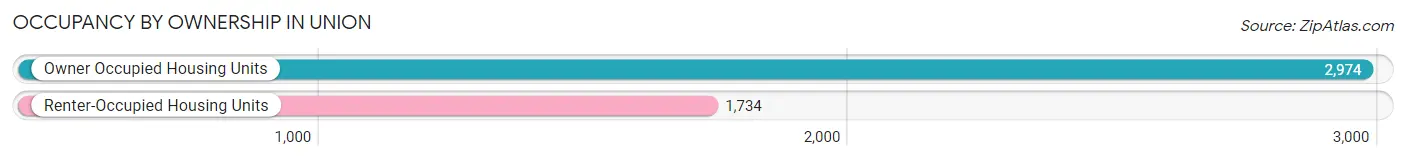
| Occupancy | # Housing Units | % Housing Units |
| Owner Occupied Housing Units | 2,974 | 63.2% |
| Renter-Occupied Housing Units | 1,734 | 36.8% |
| Total Occupied Housing Units | 4,708 | 100.0% |
Occupancy by Household Size in Union
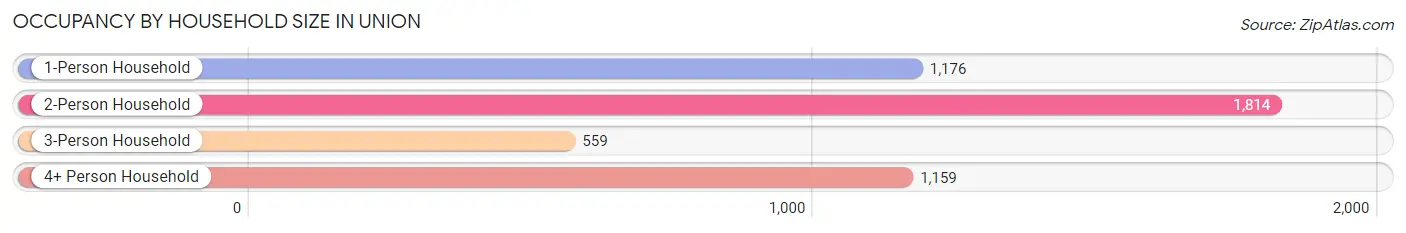
| Household Size | # Housing Units | % Housing Units |
| 1-Person Household | 1,176 | 25.0% |
| 2-Person Household | 1,814 | 38.5% |
| 3-Person Household | 559 | 11.9% |
| 4+ Person Household | 1,159 | 24.6% |
| Total Housing Units | 4,708 | 100.0% |
Occupancy by Ownership by Household Size in Union
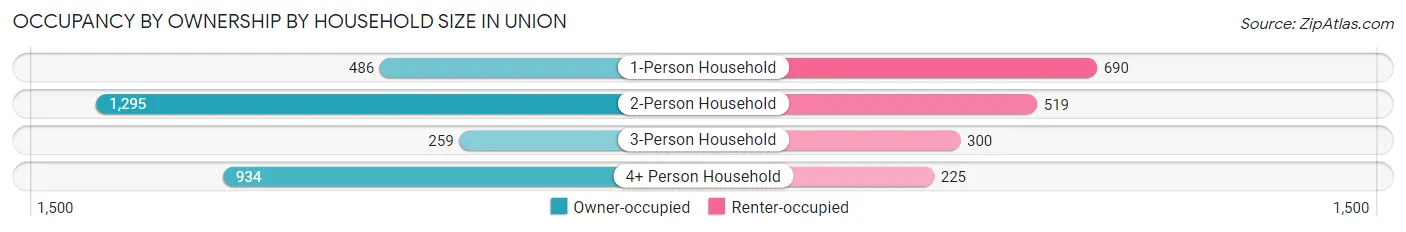
| Household Size | Owner-occupied | Renter-occupied |
| 1-Person Household | 486 (41.3%) | 690 (58.7%) |
| 2-Person Household | 1,295 (71.4%) | 519 (28.6%) |
| 3-Person Household | 259 (46.3%) | 300 (53.7%) |
| 4+ Person Household | 934 (80.6%) | 225 (19.4%) |
| Total Housing Units | 2,974 (63.2%) | 1,734 (36.8%) |
Occupancy by Educational Attainment in Union
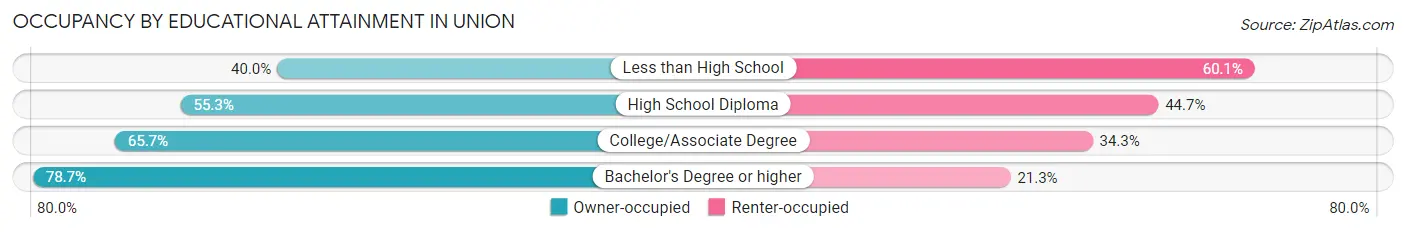
| Household Size | Owner-occupied | Renter-occupied |
| Less than High School | 165 (40.0%) | 248 (60.1%) |
| High School Diploma | 851 (55.3%) | 689 (44.7%) |
| College/Associate Degree | 1,060 (65.7%) | 554 (34.3%) |
| Bachelor's Degree or higher | 898 (78.7%) | 243 (21.3%) |
Occupancy by Age of Householder in Union
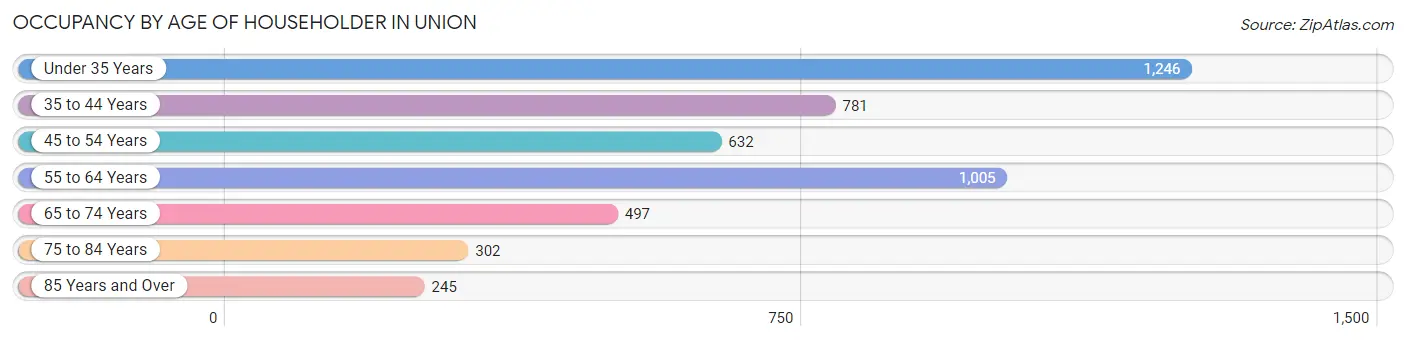
| Age Bracket | # Households | % Households |
| Under 35 Years | 1,246 | 26.5% |
| 35 to 44 Years | 781 | 16.6% |
| 45 to 54 Years | 632 | 13.4% |
| 55 to 64 Years | 1,005 | 21.3% |
| 65 to 74 Years | 497 | 10.6% |
| 75 to 84 Years | 302 | 6.4% |
| 85 Years and Over | 245 | 5.2% |
| Total | 4,708 | 100.0% |
Housing Finances in Union
Median Income by Occupancy in Union
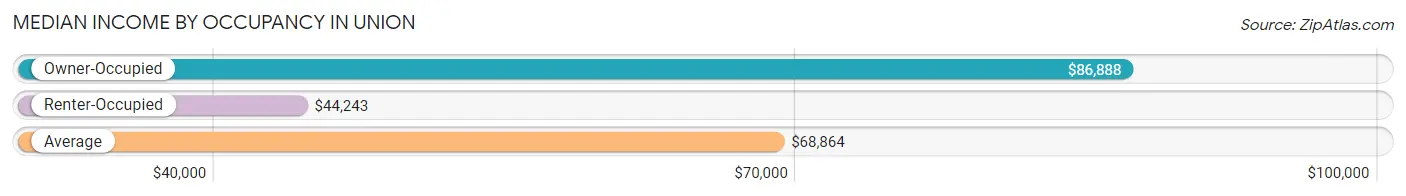
| Occupancy Type | # Households | Median Income |
| Owner-Occupied | 2,974 (63.2%) | $86,888 |
| Renter-Occupied | 1,734 (36.8%) | $44,243 |
| Average | 4,708 (100.0%) | $68,864 |
Occupancy by Householder Income Bracket in Union
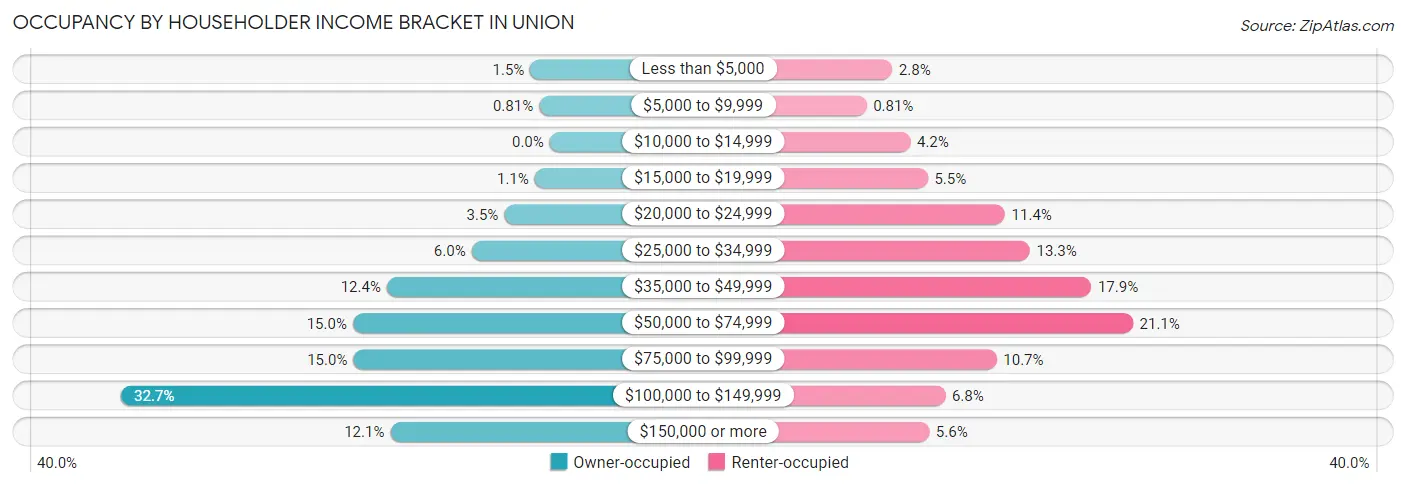
| Income Bracket | Owner-occupied | Renter-occupied |
| Less than $5,000 | 44 (1.5%) | 48 (2.8%) |
| $5,000 to $9,999 | 24 (0.8%) | 14 (0.8%) |
| $10,000 to $14,999 | 0 (0.0%) | 72 (4.2%) |
| $15,000 to $19,999 | 34 (1.1%) | 95 (5.5%) |
| $20,000 to $24,999 | 103 (3.5%) | 197 (11.4%) |
| $25,000 to $34,999 | 177 (5.9%) | 230 (13.3%) |
| $35,000 to $49,999 | 369 (12.4%) | 311 (17.9%) |
| $50,000 to $74,999 | 446 (15.0%) | 366 (21.1%) |
| $75,000 to $99,999 | 445 (15.0%) | 186 (10.7%) |
| $100,000 to $149,999 | 971 (32.7%) | 118 (6.8%) |
| $150,000 or more | 361 (12.1%) | 97 (5.6%) |
| Total | 2,974 (100.0%) | 1,734 (100.0%) |
Monthly Housing Cost Tiers in Union
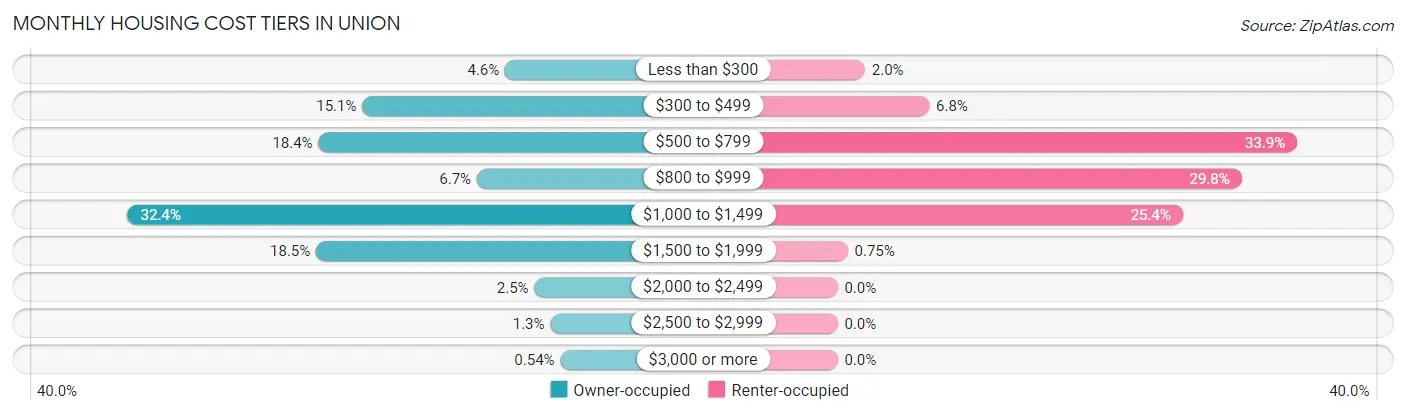
| Monthly Cost | Owner-occupied | Renter-occupied |
| Less than $300 | 137 (4.6%) | 35 (2.0%) |
| $300 to $499 | 450 (15.1%) | 117 (6.8%) |
| $500 to $799 | 546 (18.4%) | 587 (33.9%) |
| $800 to $999 | 199 (6.7%) | 516 (29.8%) |
| $1,000 to $1,499 | 964 (32.4%) | 441 (25.4%) |
| $1,500 to $1,999 | 551 (18.5%) | 13 (0.7%) |
| $2,000 to $2,499 | 73 (2.5%) | 0 (0.0%) |
| $2,500 to $2,999 | 38 (1.3%) | 0 (0.0%) |
| $3,000 or more | 16 (0.5%) | 0 (0.0%) |
| Total | 2,974 (100.0%) | 1,734 (100.0%) |
Physical Housing Characteristics in Union
Housing Structures in Union
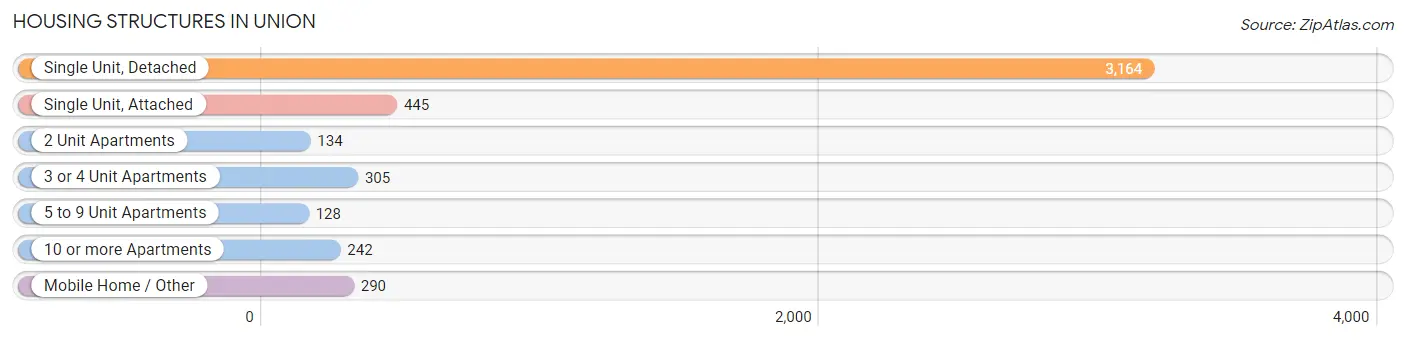
| Structure Type | # Housing Units | % Housing Units |
| Single Unit, Detached | 3,164 | 67.2% |
| Single Unit, Attached | 445 | 9.5% |
| 2 Unit Apartments | 134 | 2.9% |
| 3 or 4 Unit Apartments | 305 | 6.5% |
| 5 to 9 Unit Apartments | 128 | 2.7% |
| 10 or more Apartments | 242 | 5.1% |
| Mobile Home / Other | 290 | 6.2% |
| Total | 4,708 | 100.0% |
Housing Structures by Occupancy in Union
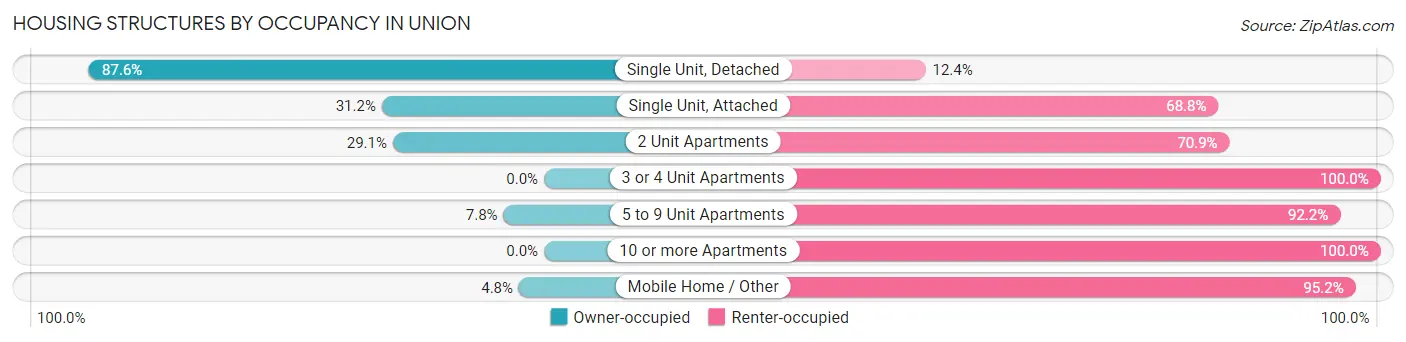
| Structure Type | Owner-occupied | Renter-occupied |
| Single Unit, Detached | 2,772 (87.6%) | 392 (12.4%) |
| Single Unit, Attached | 139 (31.2%) | 306 (68.8%) |
| 2 Unit Apartments | 39 (29.1%) | 95 (70.9%) |
| 3 or 4 Unit Apartments | 0 (0.0%) | 305 (100.0%) |
| 5 to 9 Unit Apartments | 10 (7.8%) | 118 (92.2%) |
| 10 or more Apartments | 0 (0.0%) | 242 (100.0%) |
| Mobile Home / Other | 14 (4.8%) | 276 (95.2%) |
| Total | 2,974 (63.2%) | 1,734 (36.8%) |
Housing Structures by Number of Rooms in Union
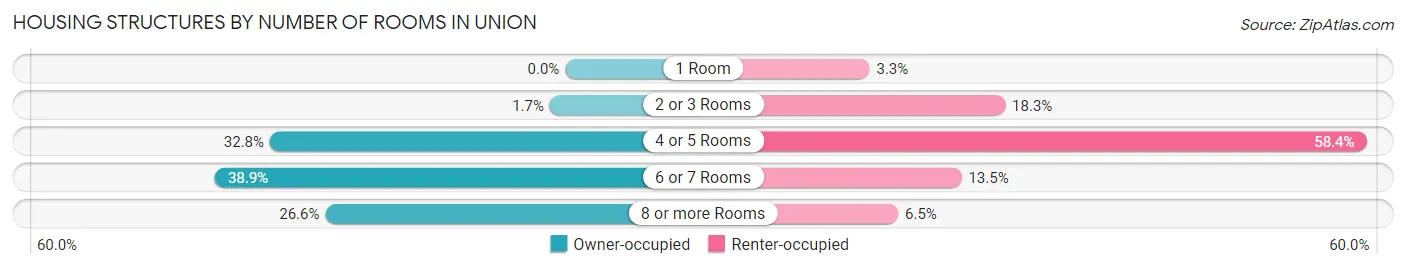
| Number of Rooms | Owner-occupied | Renter-occupied |
| 1 Room | 0 (0.0%) | 57 (3.3%) |
| 2 or 3 Rooms | 51 (1.7%) | 318 (18.3%) |
| 4 or 5 Rooms | 975 (32.8%) | 1,013 (58.4%) |
| 6 or 7 Rooms | 1,156 (38.9%) | 234 (13.5%) |
| 8 or more Rooms | 792 (26.6%) | 112 (6.5%) |
| Total | 2,974 (100.0%) | 1,734 (100.0%) |
Housing Structure by Heating Type in Union
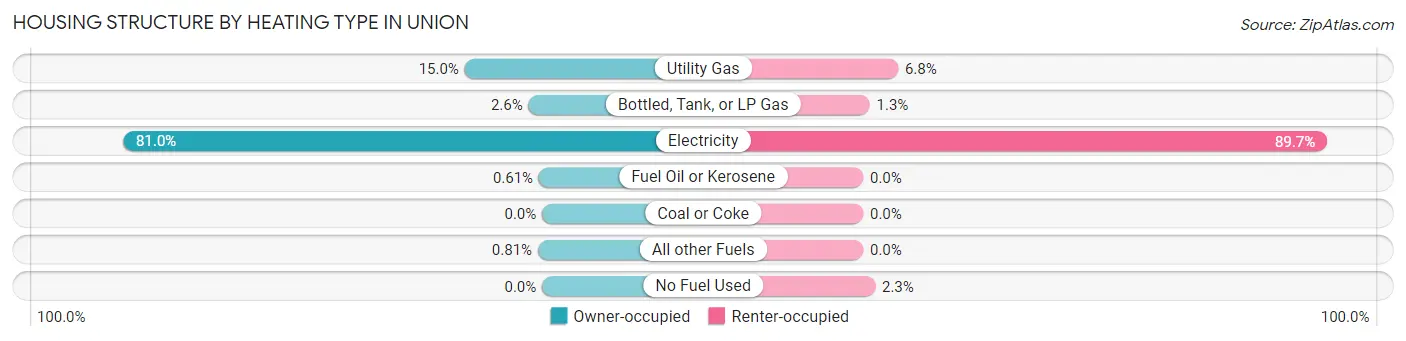
| Heating Type | Owner-occupied | Renter-occupied |
| Utility Gas | 445 (15.0%) | 117 (6.8%) |
| Bottled, Tank, or LP Gas | 78 (2.6%) | 22 (1.3%) |
| Electricity | 2,409 (81.0%) | 1,555 (89.7%) |
| Fuel Oil or Kerosene | 18 (0.6%) | 0 (0.0%) |
| Coal or Coke | 0 (0.0%) | 0 (0.0%) |
| All other Fuels | 24 (0.8%) | 0 (0.0%) |
| No Fuel Used | 0 (0.0%) | 40 (2.3%) |
| Total | 2,974 (100.0%) | 1,734 (100.0%) |
Household Vehicle Usage in Union
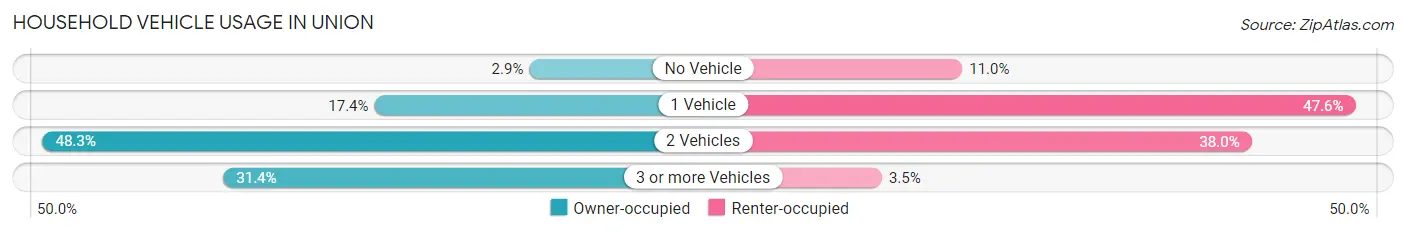
| Vehicles per Household | Owner-occupied | Renter-occupied |
| No Vehicle | 86 (2.9%) | 190 (11.0%) |
| 1 Vehicle | 516 (17.3%) | 826 (47.6%) |
| 2 Vehicles | 1,437 (48.3%) | 658 (38.0%) |
| 3 or more Vehicles | 935 (31.4%) | 60 (3.5%) |
| Total | 2,974 (100.0%) | 1,734 (100.0%) |
Real Estate & Mortgages in Union
Real Estate and Mortgage Overview in Union
| Characteristic | Without Mortgage | With Mortgage |
| Housing Units | 1,040 | 1,934 |
| Median Property Value | $159,100 | $194,700 |
| Median Household Income | $59,559 | $285 |
| Monthly Housing Costs | $480 | $16 |
| Real Estate Taxes | $1,407 | $70 |
Property Value by Mortgage Status in Union
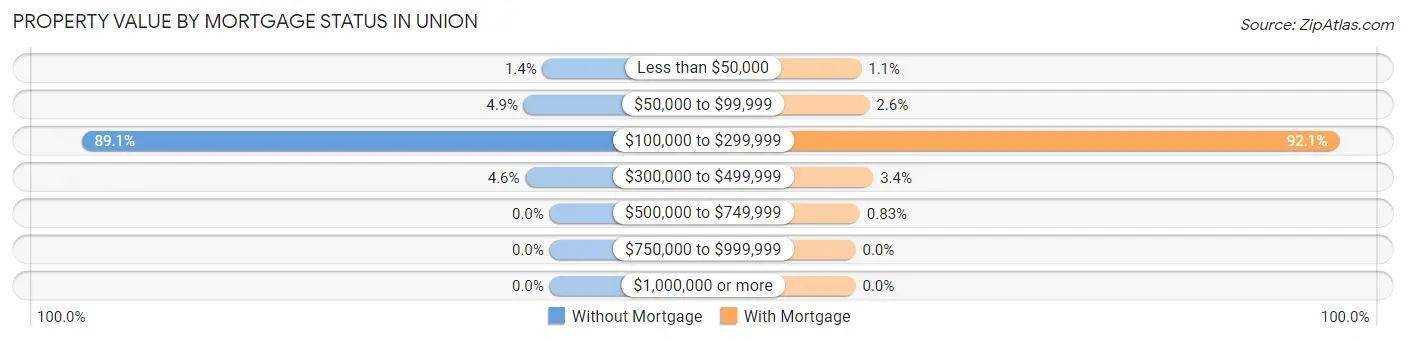
| Property Value | Without Mortgage | With Mortgage |
| Less than $50,000 | 14 (1.3%) | 21 (1.1%) |
| $50,000 to $99,999 | 51 (4.9%) | 51 (2.6%) |
| $100,000 to $299,999 | 927 (89.1%) | 1,781 (92.1%) |
| $300,000 to $499,999 | 48 (4.6%) | 65 (3.4%) |
| $500,000 to $749,999 | 0 (0.0%) | 16 (0.8%) |
| $750,000 to $999,999 | 0 (0.0%) | 0 (0.0%) |
| $1,000,000 or more | 0 (0.0%) | 0 (0.0%) |
| Total | 1,040 (100.0%) | 1,934 (100.0%) |
Household Income by Mortgage Status in Union
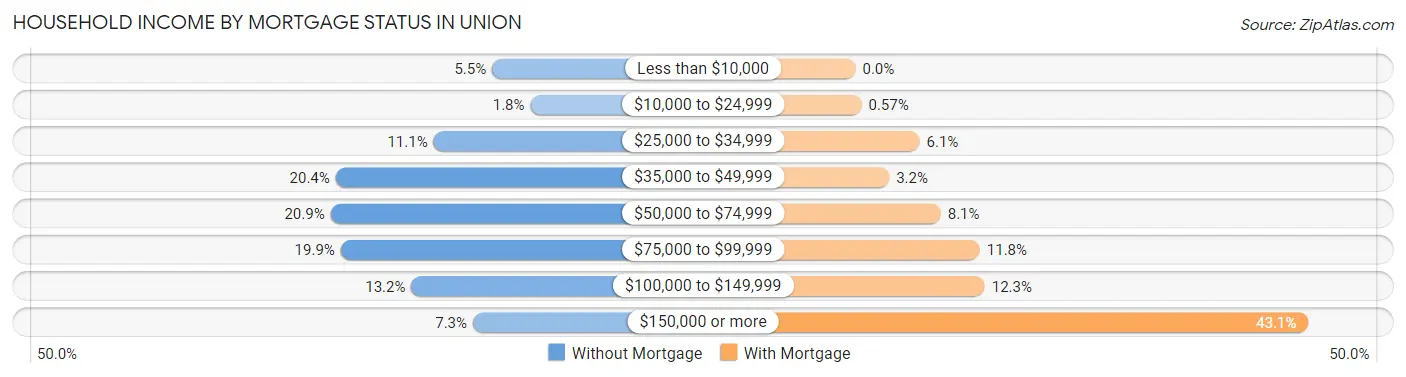
| Household Income | Without Mortgage | With Mortgage |
| Less than $10,000 | 57 (5.5%) | 0 (0.0%) |
| $10,000 to $24,999 | 19 (1.8%) | 11 (0.6%) |
| $25,000 to $34,999 | 115 (11.1%) | 118 (6.1%) |
| $35,000 to $49,999 | 212 (20.4%) | 62 (3.2%) |
| $50,000 to $74,999 | 217 (20.9%) | 157 (8.1%) |
| $75,000 to $99,999 | 207 (19.9%) | 229 (11.8%) |
| $100,000 to $149,999 | 137 (13.2%) | 238 (12.3%) |
| $150,000 or more | 76 (7.3%) | 834 (43.1%) |
| Total | 1,040 (100.0%) | 1,934 (100.0%) |
Property Value to Household Income Ratio in Union
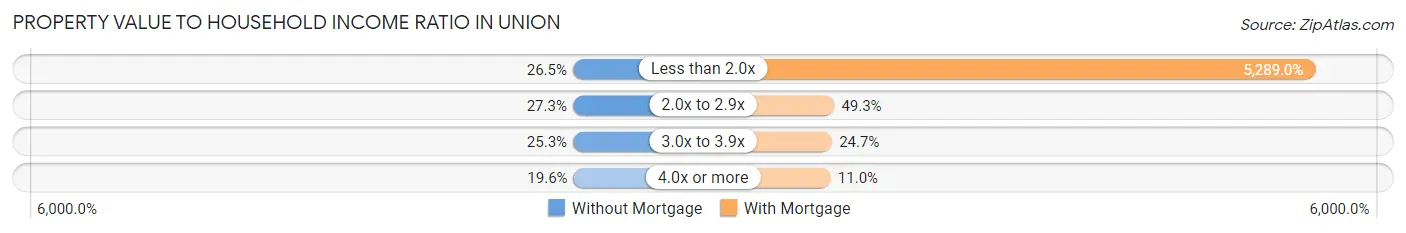
| Value-to-Income Ratio | Without Mortgage | With Mortgage |
| Less than 2.0x | 276 (26.5%) | 102,289 (5,289.0%) |
| 2.0x to 2.9x | 284 (27.3%) | 954 (49.3%) |
| 3.0x to 3.9x | 263 (25.3%) | 478 (24.7%) |
| 4.0x or more | 204 (19.6%) | 212 (11.0%) |
| Total | 1,040 (100.0%) | 1,934 (100.0%) |
Real Estate Taxes by Mortgage Status in Union
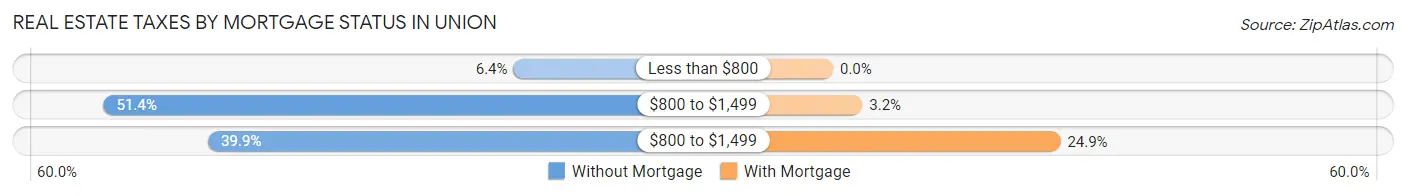
| Property Taxes | Without Mortgage | With Mortgage |
| Less than $800 | 67 (6.4%) | 0 (0.0%) |
| $800 to $1,499 | 534 (51.3%) | 62 (3.2%) |
| $800 to $1,499 | 415 (39.9%) | 482 (24.9%) |
| Total | 1,040 (100.0%) | 1,934 (100.0%) |
Health & Disability in Union
Health Insurance Coverage by Age in Union
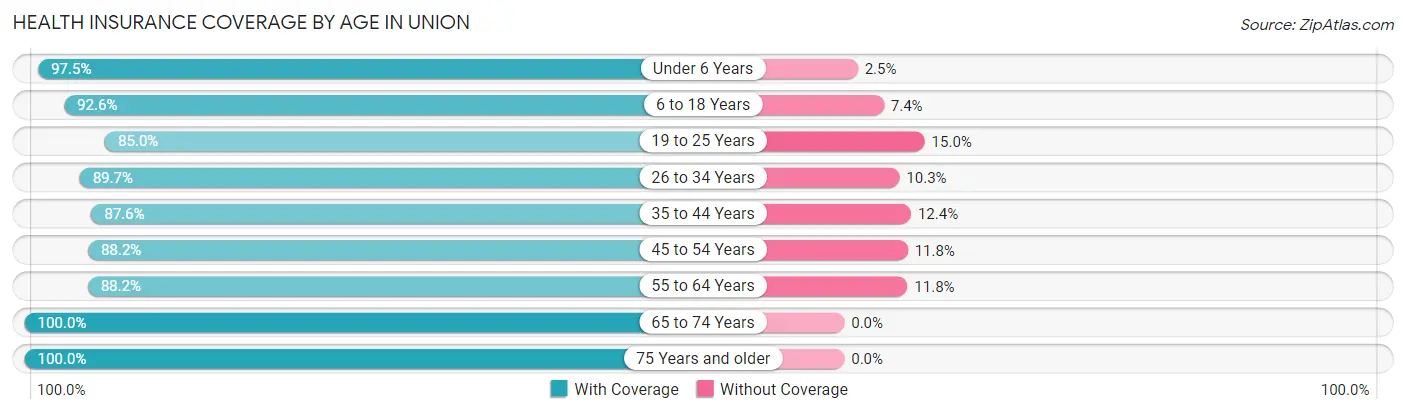
| Age Bracket | With Coverage | Without Coverage |
| Under 6 Years | 1,052 (97.5%) | 27 (2.5%) |
| 6 to 18 Years | 1,932 (92.6%) | 154 (7.4%) |
| 19 to 25 Years | 1,106 (85.0%) | 195 (15.0%) |
| 26 to 34 Years | 1,554 (89.7%) | 178 (10.3%) |
| 35 to 44 Years | 1,260 (87.6%) | 179 (12.4%) |
| 45 to 54 Years | 1,119 (88.2%) | 150 (11.8%) |
| 55 to 64 Years | 1,334 (88.2%) | 178 (11.8%) |
| 65 to 74 Years | 845 (100.0%) | 0 (0.0%) |
| 75 Years and older | 780 (100.0%) | 0 (0.0%) |
| Total | 10,982 (91.2%) | 1,061 (8.8%) |
Health Insurance Coverage by Citizenship Status in Union
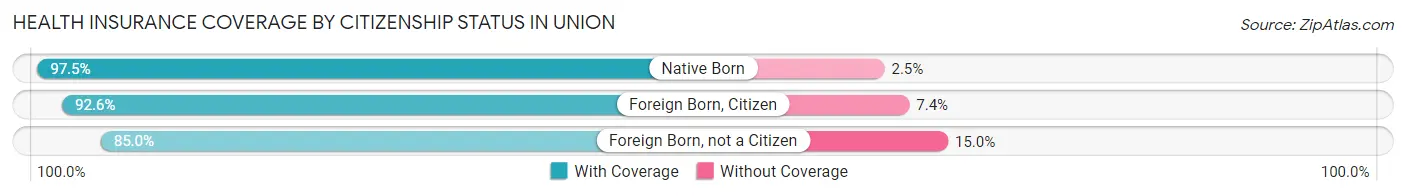
| Citizenship Status | With Coverage | Without Coverage |
| Native Born | 1,052 (97.5%) | 27 (2.5%) |
| Foreign Born, Citizen | 1,932 (92.6%) | 154 (7.4%) |
| Foreign Born, not a Citizen | 1,106 (85.0%) | 195 (15.0%) |
Health Insurance Coverage by Household Income in Union
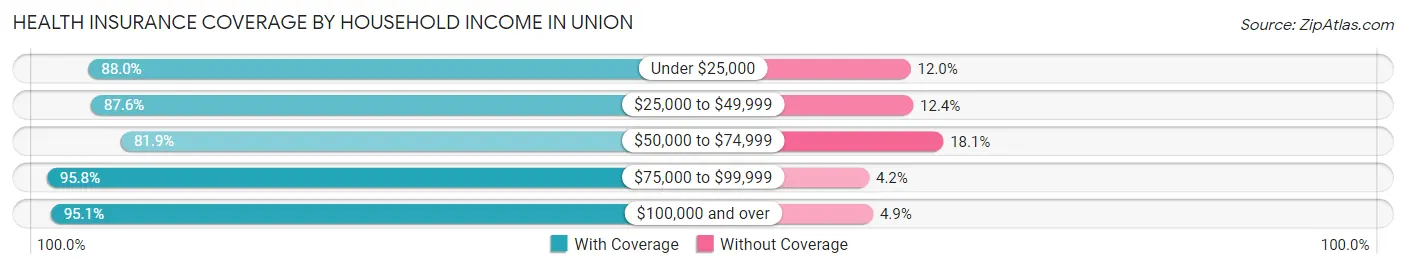
| Household Income | With Coverage | Without Coverage |
| Under $25,000 | 905 (88.0%) | 123 (12.0%) |
| $25,000 to $49,999 | 1,825 (87.6%) | 259 (12.4%) |
| $50,000 to $74,999 | 1,588 (81.9%) | 350 (18.1%) |
| $75,000 to $99,999 | 1,724 (95.8%) | 75 (4.2%) |
| $100,000 and over | 4,934 (95.1%) | 254 (4.9%) |
Public vs Private Health Insurance Coverage by Age in Union
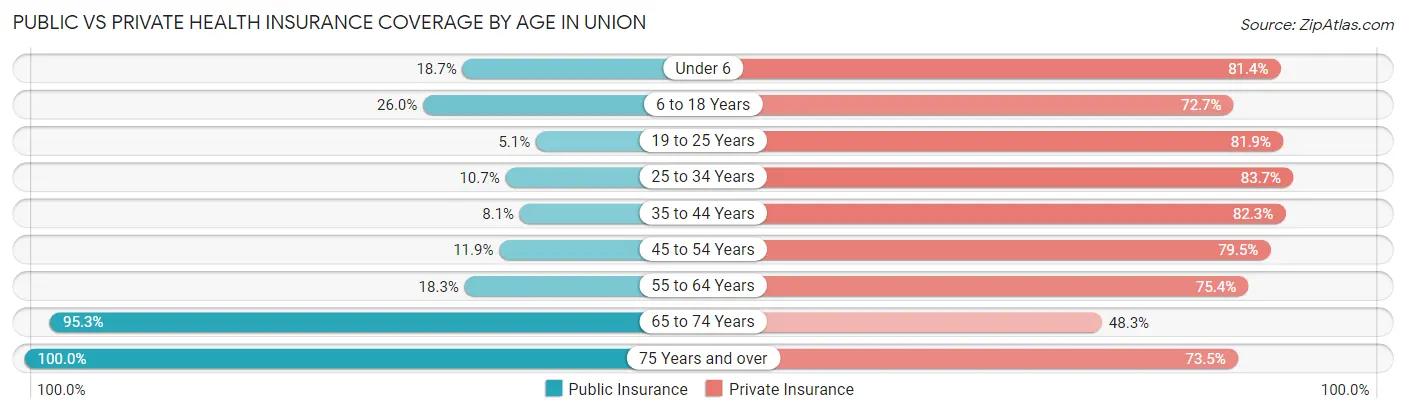
| Age Bracket | Public Insurance | Private Insurance |
| Under 6 | 202 (18.7%) | 878 (81.4%) |
| 6 to 18 Years | 543 (26.0%) | 1,516 (72.7%) |
| 19 to 25 Years | 66 (5.1%) | 1,065 (81.9%) |
| 25 to 34 Years | 186 (10.7%) | 1,450 (83.7%) |
| 35 to 44 Years | 116 (8.1%) | 1,184 (82.3%) |
| 45 to 54 Years | 151 (11.9%) | 1,009 (79.5%) |
| 55 to 64 Years | 277 (18.3%) | 1,140 (75.4%) |
| 65 to 74 Years | 805 (95.3%) | 408 (48.3%) |
| 75 Years and over | 780 (100.0%) | 573 (73.5%) |
| Total | 3,126 (26.0%) | 9,223 (76.6%) |
Disability Status by Sex by Age in Union
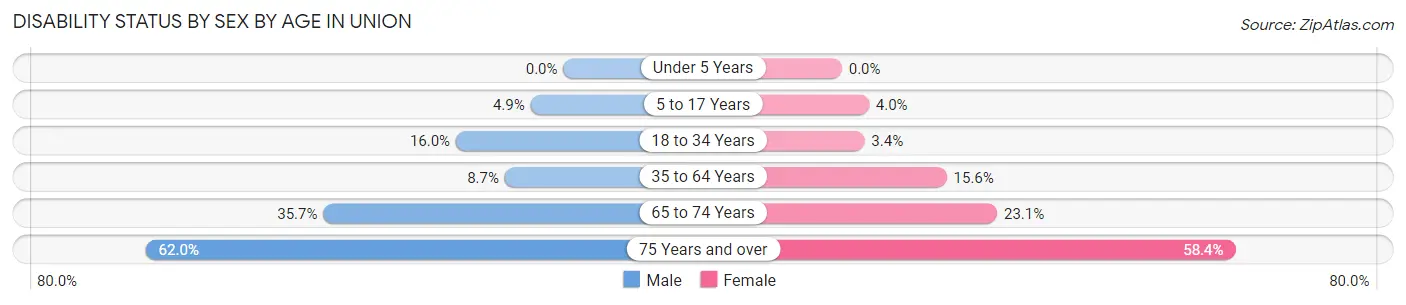
| Age Bracket | Male | Female |
| Under 5 Years | 0 (0.0%) | 0 (0.0%) |
| 5 to 17 Years | 53 (4.9%) | 42 (4.0%) |
| 18 to 34 Years | 252 (16.0%) | 51 (3.4%) |
| 35 to 64 Years | 186 (8.7%) | 324 (15.6%) |
| 65 to 74 Years | 128 (35.6%) | 112 (23.1%) |
| 75 Years and over | 178 (62.0%) | 288 (58.4%) |
Disability Class by Sex by Age in Union
Disability Class: Hearing Difficulty
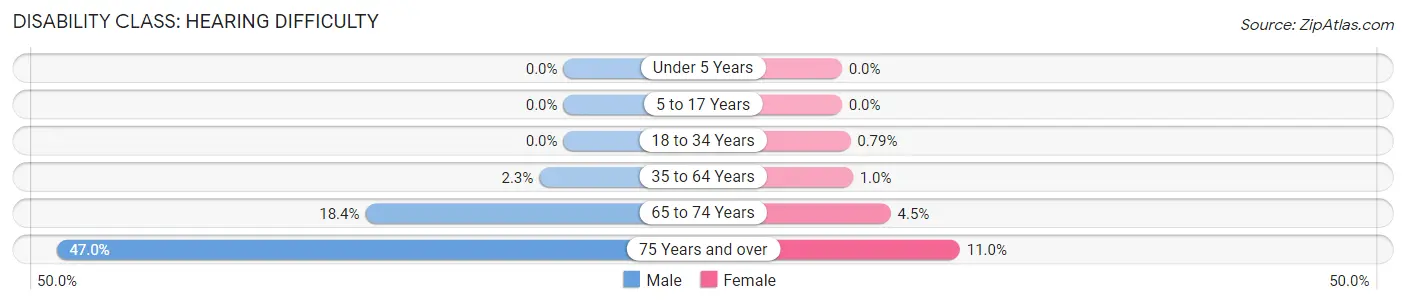
| Age Bracket | Male | Female |
| Under 5 Years | 0 (0.0%) | 0 (0.0%) |
| 5 to 17 Years | 0 (0.0%) | 0 (0.0%) |
| 18 to 34 Years | 0 (0.0%) | 12 (0.8%) |
| 35 to 64 Years | 48 (2.2%) | 21 (1.0%) |
| 65 to 74 Years | 66 (18.4%) | 22 (4.5%) |
| 75 Years and over | 135 (47.0%) | 54 (11.0%) |
Disability Class: Vision Difficulty
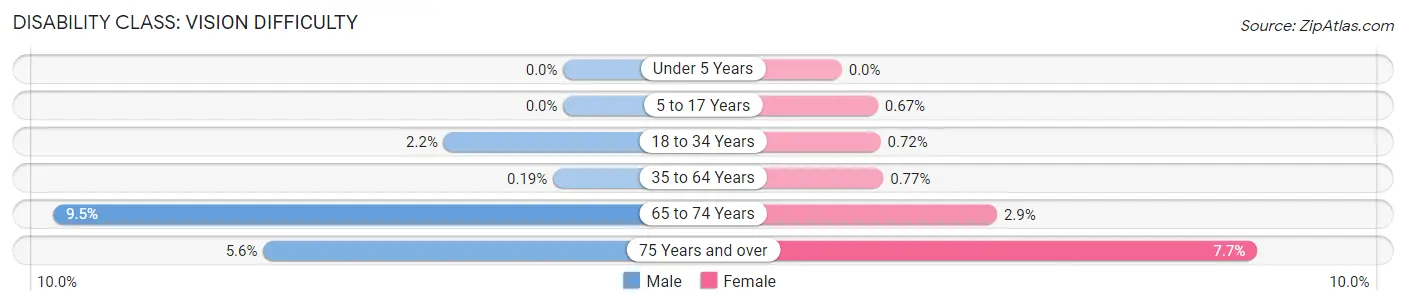
| Age Bracket | Male | Female |
| Under 5 Years | 0 (0.0%) | 0 (0.0%) |
| 5 to 17 Years | 0 (0.0%) | 7 (0.7%) |
| 18 to 34 Years | 35 (2.2%) | 11 (0.7%) |
| 35 to 64 Years | 4 (0.2%) | 16 (0.8%) |
| 65 to 74 Years | 34 (9.5%) | 14 (2.9%) |
| 75 Years and over | 16 (5.6%) | 38 (7.7%) |
Disability Class: Cognitive Difficulty
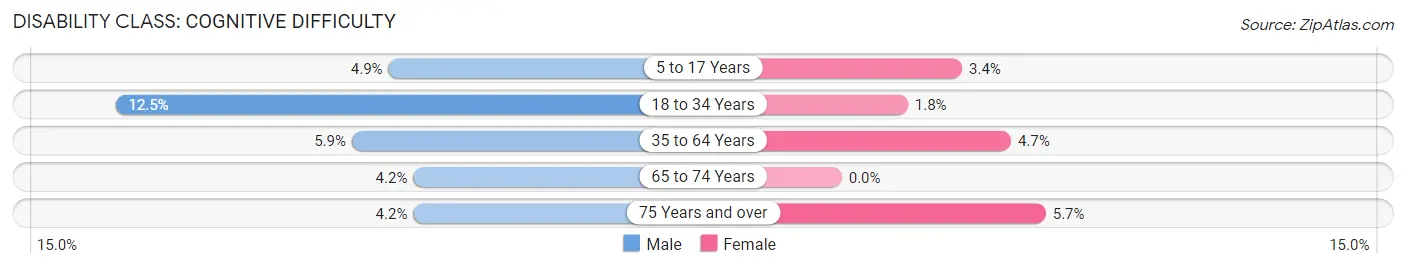
| Age Bracket | Male | Female |
| 5 to 17 Years | 53 (4.9%) | 35 (3.4%) |
| 18 to 34 Years | 197 (12.5%) | 28 (1.8%) |
| 35 to 64 Years | 126 (5.9%) | 98 (4.7%) |
| 65 to 74 Years | 15 (4.2%) | 0 (0.0%) |
| 75 Years and over | 12 (4.2%) | 28 (5.7%) |
Disability Class: Ambulatory Difficulty
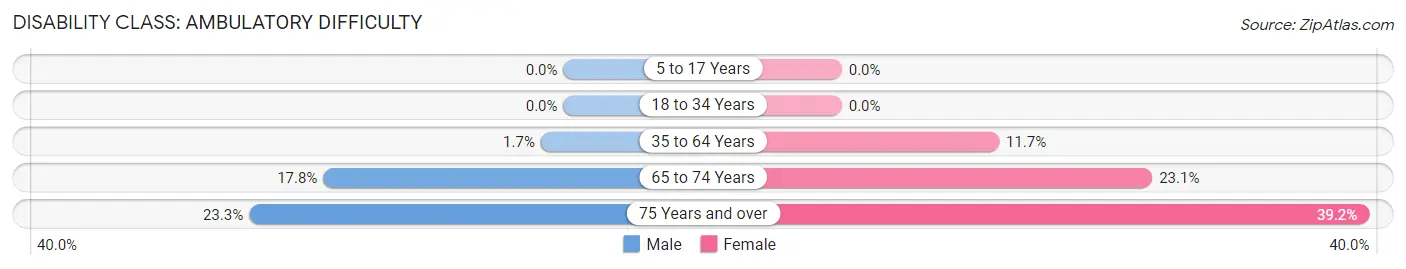
| Age Bracket | Male | Female |
| 5 to 17 Years | 0 (0.0%) | 0 (0.0%) |
| 18 to 34 Years | 0 (0.0%) | 0 (0.0%) |
| 35 to 64 Years | 36 (1.7%) | 243 (11.7%) |
| 65 to 74 Years | 64 (17.8%) | 112 (23.1%) |
| 75 Years and over | 67 (23.3%) | 193 (39.2%) |
Disability Class: Self-Care Difficulty
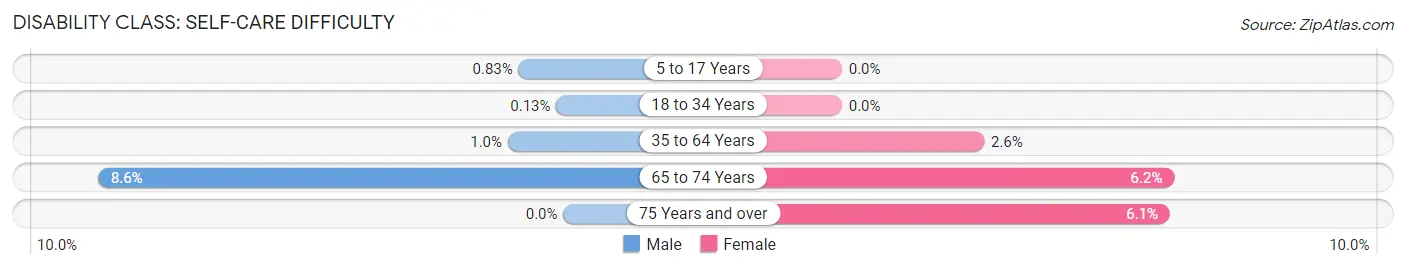
| Age Bracket | Male | Female |
| 5 to 17 Years | 9 (0.8%) | 0 (0.0%) |
| 18 to 34 Years | 2 (0.1%) | 0 (0.0%) |
| 35 to 64 Years | 22 (1.0%) | 55 (2.6%) |
| 65 to 74 Years | 31 (8.6%) | 30 (6.2%) |
| 75 Years and over | 0 (0.0%) | 30 (6.1%) |
Technology Access in Union
Computing Device Access in Union
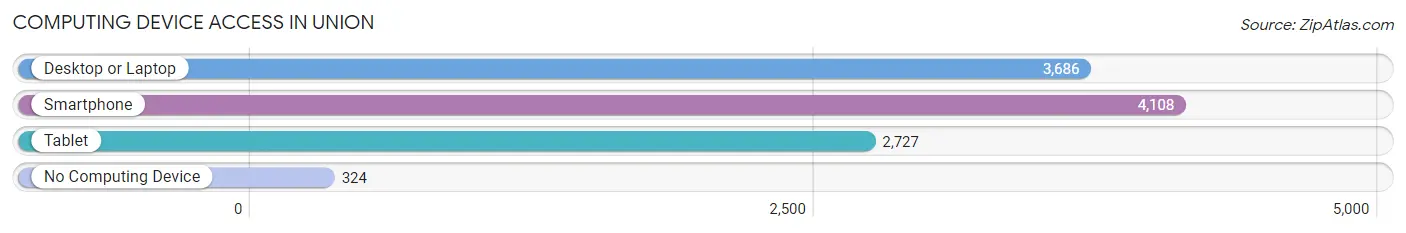
| Device Type | # Households | % Households |
| Desktop or Laptop | 3,686 | 78.3% |
| Smartphone | 4,108 | 87.3% |
| Tablet | 2,727 | 57.9% |
| No Computing Device | 324 | 6.9% |
| Total | 4,708 | 100.0% |
Internet Access in Union
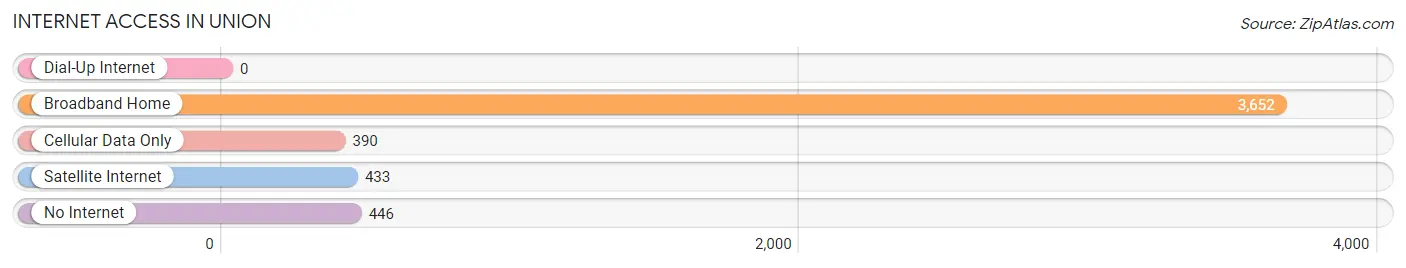
| Internet Type | # Households | % Households |
| Dial-Up Internet | 0 | 0.0% |
| Broadband Home | 3,652 | 77.6% |
| Cellular Data Only | 390 | 8.3% |
| Satellite Internet | 433 | 9.2% |
| No Internet | 446 | 9.5% |
| Total | 4,708 | 100.0% |
Union Summary
Union, Missouri is a small city located in Franklin County, Missouri. It is situated on the banks of the Bourbeuse River, approximately 40 miles southwest of St. Louis. The city has a population of approximately 8,000 people and is the county seat of Franklin County.
Geography
Union is located in the Ozark Mountains region of Missouri. The city is situated on the banks of the Bourbeuse River, which flows through the city and is a major source of recreation for the area. The city is surrounded by rolling hills and forests, and is home to several parks and recreational areas. The city is located in the Central Standard Time Zone and has an average annual temperature of 54 degrees Fahrenheit.
Economy
Union’s economy is largely based on agriculture and manufacturing. The city is home to several large agricultural operations, including dairy farms, poultry farms, and beef cattle farms. The city is also home to several manufacturing companies, including a large automotive parts manufacturer, a plastics manufacturer, and a furniture manufacturer. The city also has a thriving retail sector, with several large stores and shopping centers located in the city.
Demographics
As of the 2010 census, Union had a population of 8,004 people. The racial makeup of the city was 95.3% White, 0.7% African American, 0.3% Native American, 0.7% Asian, 0.1% Pacific Islander, 1.2% from other races, and 1.7% from two or more races. Hispanic or Latino of any race were 3.2% of the population.
The median income for a household in Union was $41,945, and the median income for a family was $50,945. The per capita income for the city was $20,945. About 8.3% of families and 10.2% of the population were below the poverty line, including 14.2% of those under age 18 and 8.2% of those age 65 or over.
Education
Union is served by the Franklin County R-II School District, which includes two elementary schools, one middle school, and one high school. The city is also home to East Central College, a two-year community college.
Conclusion
Union, Missouri is a small city located in Franklin County, Missouri. It is situated on the banks of the Bourbeuse River, approximately 40 miles southwest of St. Louis. The city has a population of approximately 8,000 people and is the county seat of Franklin County. The city’s economy is largely based on agriculture and manufacturing, and the city is home to several large agricultural operations and manufacturing companies. The city is also home to several parks and recreational areas, and is served by the Franklin County R-II School District.
Common Questions
What is Per Capita Income in Union?
Per Capita income in Union is $31,729.
What is the Median Family Income in Union?
Median Family Income in Union is $85,846.
What is the Median Household income in Union?
Median Household Income in Union is $68,864.
What is Income or Wage Gap in Union?
Income or Wage Gap in Union is 10.6%.
Women in Union earn 89.4 cents for every dollar earned by a man.
What is Inequality or Gini Index in Union?
Inequality or Gini Index in Union is 0.39.
What is the Total Population of Union?
Total Population of Union is 12,341.
What is the Total Male Population of Union?
Total Male Population of Union is 6,271.
What is the Total Female Population of Union?
Total Female Population of Union is 6,070.
What is the Ratio of Males per 100 Females in Union?
There are 103.31 Males per 100 Females in Union.
What is the Ratio of Females per 100 Males in Union?
There are 96.79 Females per 100 Males in Union.
What is the Median Population Age in Union?
Median Population Age in Union is 34.2 Years.
What is the Average Family Size in Union
Average Family Size in Union is 3.1 People.
What is the Average Household Size in Union
Average Household Size in Union is 2.6 People.
How Large is the Labor Force in Union?
There are 6,407 People in the Labor Forcein in Union.
What is the Percentage of People in the Labor Force in Union?
65.9% of People are in the Labor Force in Union.
What is the Unemployment Rate in Union?
Unemployment Rate in Union is 5.6%.