Le Center, MN Map & Demographics
Le Center Map
Le Center Overview
$31,173
PER CAPITA INCOME
$89,000
AVG FAMILY INCOME
$63,944
AVG HOUSEHOLD INCOME
20.8%
WAGE / INCOME GAP [ % ]
79.2¢/ $1
WAGE / INCOME GAP [ $ ]
0.37
INEQUALITY / GINI INDEX
2,502
TOTAL POPULATION
1,277
MALE POPULATION
1,225
FEMALE POPULATION
104.24
MALES / 100 FEMALES
95.93
FEMALES / 100 MALES
36.7
MEDIAN AGE
3.0
AVG FAMILY SIZE
2.5
AVG HOUSEHOLD SIZE
1,418
LABOR FORCE [ PEOPLE ]
69.4%
PERCENT IN LABOR FORCE
5.5%
UNEMPLOYMENT RATE
Le Center Zip Codes
Le Center Area Codes
Income in Le Center
Income Overview in Le Center
Per Capita Income in Le Center is $31,173, while median incomes of families and households are $89,000 and $63,944 respectively.
| Characteristic | Number | Measure |
| Per Capita Income | 2,502 | $31,173 |
| Median Family Income | 646 | $89,000 |
| Mean Family Income | 646 | $93,786 |
| Median Household Income | 975 | $63,944 |
| Mean Household Income | 975 | $80,045 |
| Income Deficit | 646 | $0 |
| Wage / Income Gap (%) | 2,502 | 20.80% |
| Wage / Income Gap ($) | 2,502 | 79.20¢ per $1 |
| Gini / Inequality Index | 2,502 | 0.37 |
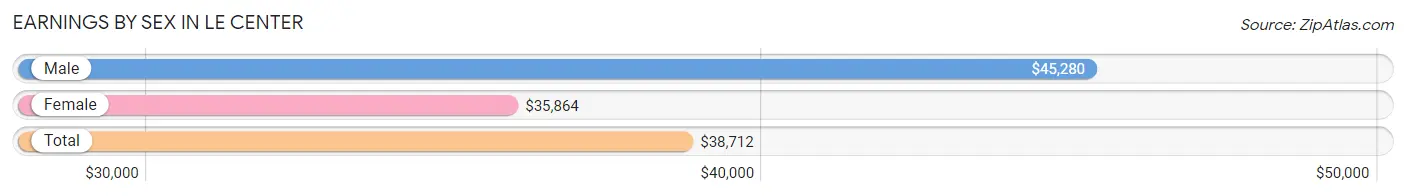
Earnings by Sex in Le Center
Average Earnings in Le Center are $38,712, $45,280 for men and $35,864 for women, a difference of 20.8%.
| Sex | Number | Average Earnings |
| Male | 851 (56.5%) | $45,280 |
| Female | 654 (43.5%) | $35,864 |
| Total | 1,505 (100.0%) | $38,712 |
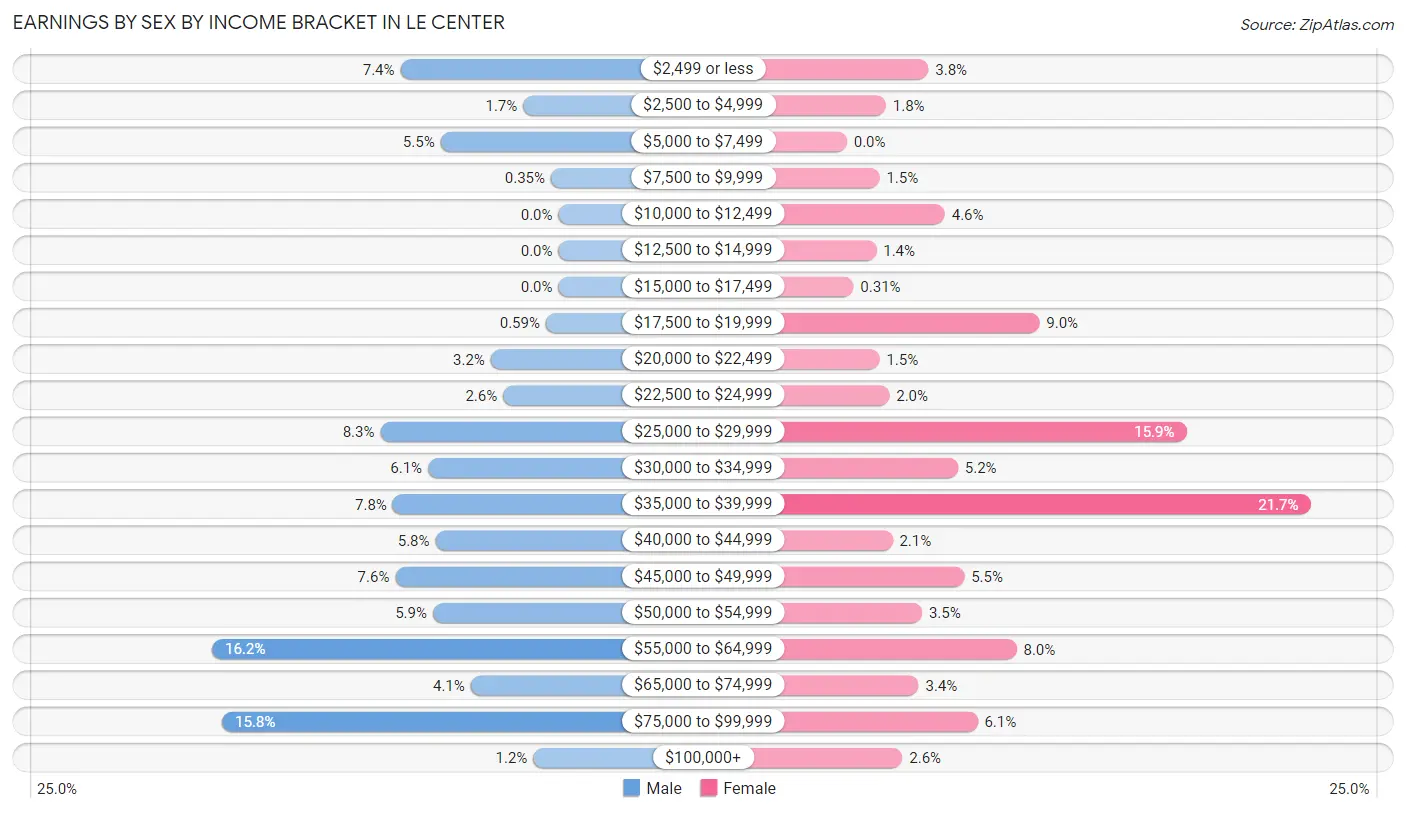
Earnings by Sex by Income Bracket in Le Center
The most common earnings brackets in Le Center are $55,000 to $64,999 for men (138 | 16.2%) and $35,000 to $39,999 for women (142 | 21.7%).
| Income | Male | Female |
| $2,499 or less | 63 (7.4%) | 25 (3.8%) |
| $2,500 to $4,999 | 14 (1.7%) | 12 (1.8%) |
| $5,000 to $7,499 | 47 (5.5%) | 0 (0.0%) |
| $7,500 to $9,999 | 3 (0.4%) | 10 (1.5%) |
| $10,000 to $12,499 | 0 (0.0%) | 30 (4.6%) |
| $12,500 to $14,999 | 0 (0.0%) | 9 (1.4%) |
| $15,000 to $17,499 | 0 (0.0%) | 2 (0.3%) |
| $17,500 to $19,999 | 5 (0.6%) | 59 (9.0%) |
| $20,000 to $22,499 | 27 (3.2%) | 10 (1.5%) |
| $22,500 to $24,999 | 22 (2.6%) | 13 (2.0%) |
| $25,000 to $29,999 | 71 (8.3%) | 104 (15.9%) |
| $30,000 to $34,999 | 52 (6.1%) | 34 (5.2%) |
| $35,000 to $39,999 | 66 (7.8%) | 142 (21.7%) |
| $40,000 to $44,999 | 49 (5.8%) | 14 (2.1%) |
| $45,000 to $49,999 | 65 (7.6%) | 36 (5.5%) |
| $50,000 to $54,999 | 50 (5.9%) | 23 (3.5%) |
| $55,000 to $64,999 | 138 (16.2%) | 52 (8.0%) |
| $65,000 to $74,999 | 35 (4.1%) | 22 (3.4%) |
| $75,000 to $99,999 | 134 (15.8%) | 40 (6.1%) |
| $100,000+ | 10 (1.2%) | 17 (2.6%) |
| Total | 851 (100.0%) | 654 (100.0%) |
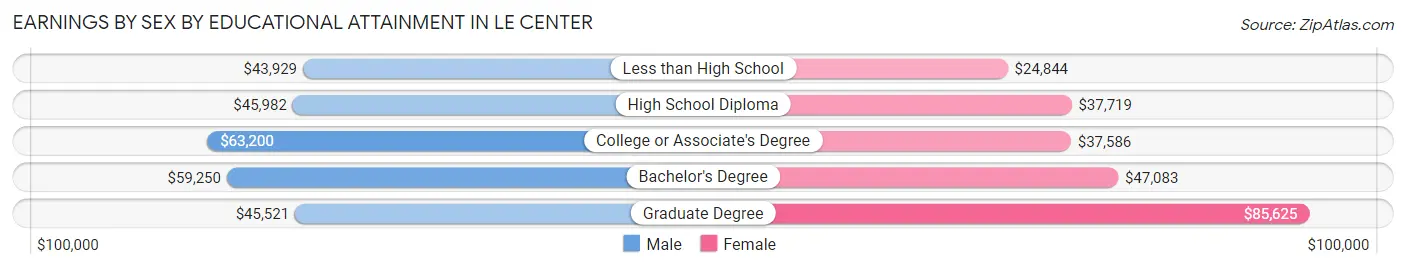
Earnings by Sex by Educational Attainment in Le Center
Average earnings in Le Center are $51,765 for men and $37,517 for women, a difference of 27.5%. Men with an educational attainment of college or associate's degree enjoy the highest average annual earnings of $63,200, while those with less than high school education earn the least with $43,929. Women with an educational attainment of graduate degree earn the most with the average annual earnings of $85,625, while those with less than high school education have the smallest earnings of $24,844.
| Educational Attainment | Male Income | Female Income |
| Less than High School | $43,929 | $24,844 |
| High School Diploma | $45,982 | $37,719 |
| College or Associate's Degree | $63,200 | $37,586 |
| Bachelor's Degree | $59,250 | $47,083 |
| Graduate Degree | $45,521 | $85,625 |
| Total | $51,765 | $37,517 |
Family Income in Le Center
Family Income Brackets in Le Center
According to the Le Center family income data, there are 163 families falling into the $100,000 to $149,999 income range, which is the most common income bracket and makes up 25.2% of all families. Conversely, the $10,000 to $14,999 income bracket is the least frequent group with only 6 families (0.9%) belonging to this category.
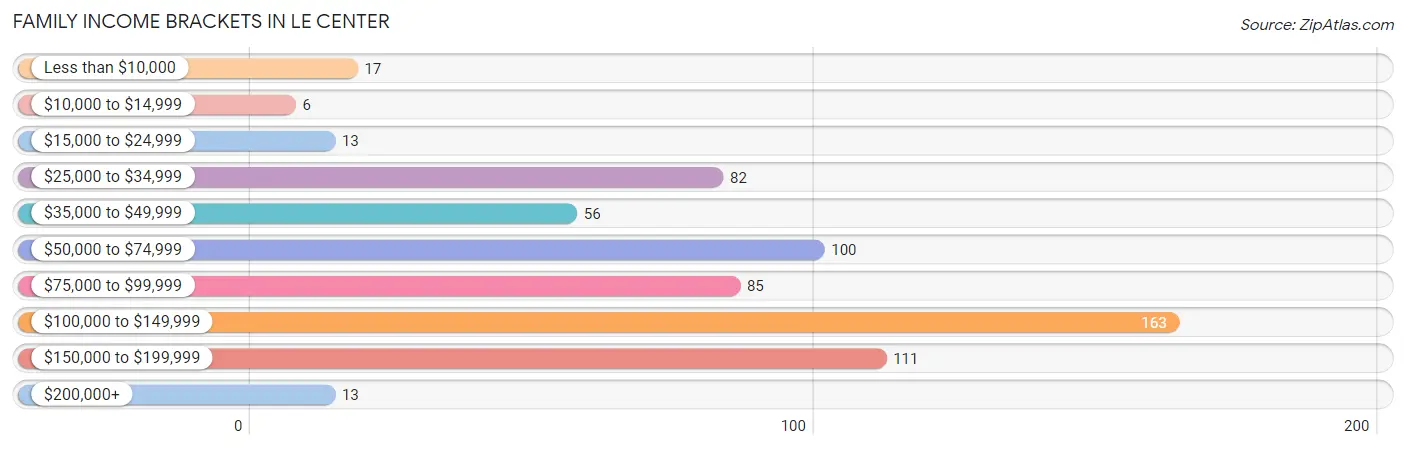
| Income Bracket | # Families | % Families |
| Less than $10,000 | 17 | 2.6% |
| $10,000 to $14,999 | 6 | 0.9% |
| $15,000 to $24,999 | 13 | 2.0% |
| $25,000 to $34,999 | 82 | 12.7% |
| $35,000 to $49,999 | 56 | 8.7% |
| $50,000 to $74,999 | 100 | 15.5% |
| $75,000 to $99,999 | 85 | 13.2% |
| $100,000 to $149,999 | 163 | 25.2% |
| $150,000 to $199,999 | 111 | 17.2% |
| $200,000+ | 13 | 2.0% |
Family Income by Famaliy Size in Le Center
5-person families (98 | 15.2%) account for the highest median family income in Le Center with $136,563 per family, while 3-person families (122 | 18.9%) have the highest median income of $34,905 per family member.
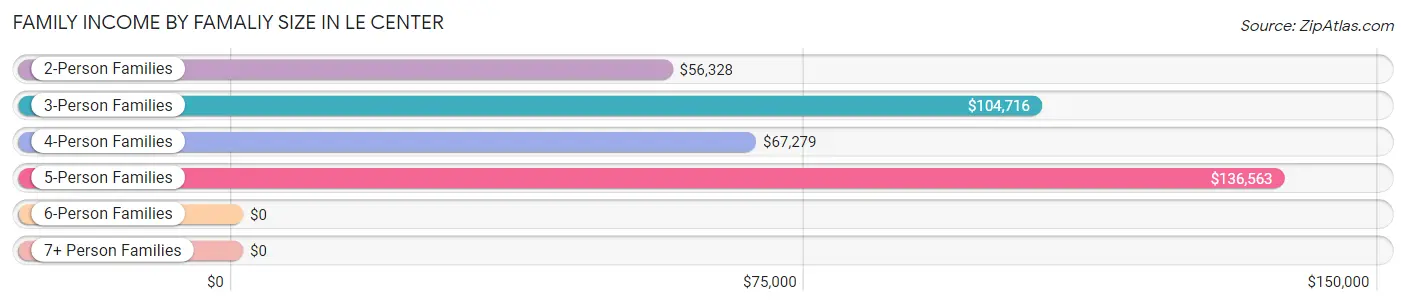
| Income Bracket | # Families | Median Income |
| 2-Person Families | 295 (45.7%) | $56,328 |
| 3-Person Families | 122 (18.9%) | $104,716 |
| 4-Person Families | 113 (17.5%) | $67,279 |
| 5-Person Families | 98 (15.2%) | $136,563 |
| 6-Person Families | 18 (2.8%) | $0 |
| 7+ Person Families | 0 (0.0%) | $0 |
| Total | 646 (100.0%) | $89,000 |
Family Income by Number of Earners in Le Center
The median family income in Le Center is $89,000, with families comprising 3+ earners (170) having the highest median family income of $143,714, while families with no earners (40) have the lowest median family income of $33,333, accounting for 26.3% and 6.2% of families, respectively.
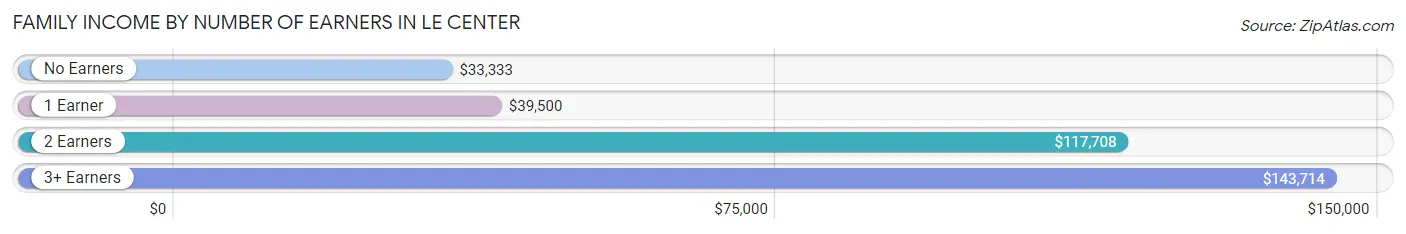
| Number of Earners | # Families | Median Income |
| No Earners | 40 (6.2%) | $33,333 |
| 1 Earner | 224 (34.7%) | $39,500 |
| 2 Earners | 212 (32.8%) | $117,708 |
| 3+ Earners | 170 (26.3%) | $143,714 |
| Total | 646 (100.0%) | $89,000 |
Household Income in Le Center
Household Income Brackets in Le Center
With 198 households falling in the category, the $100,000 to $149,999 income range is the most frequent in Le Center, accounting for 20.3% of all households. In contrast, only 13 households (1.3%) fall into the $200,000+ income bracket, making it the least populous group.
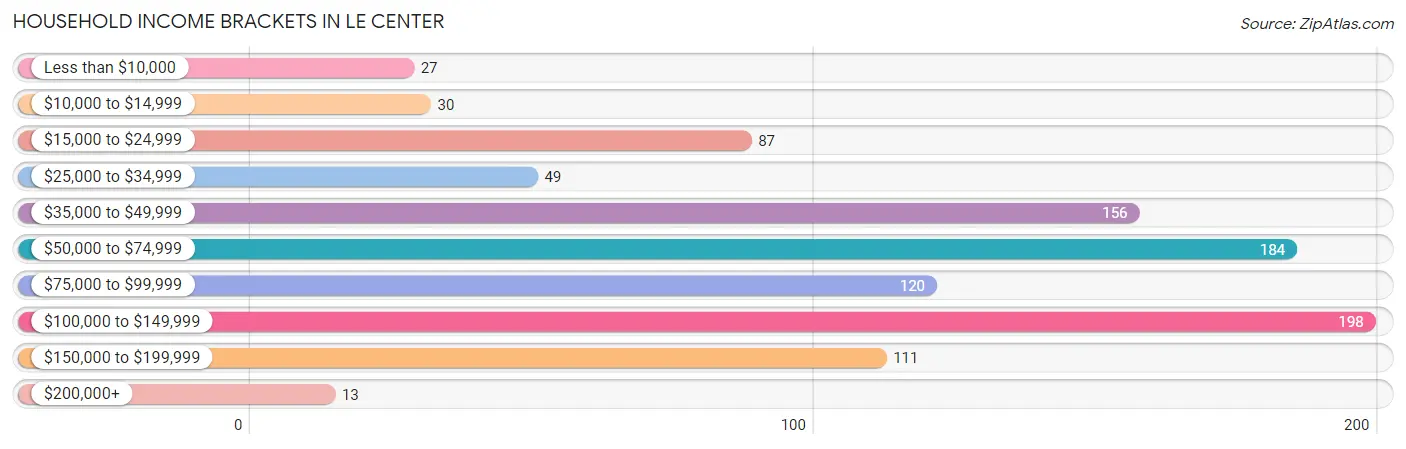
| Income Bracket | # Households | % Households |
| Less than $10,000 | 27 | 2.8% |
| $10,000 to $14,999 | 30 | 3.1% |
| $15,000 to $24,999 | 87 | 8.9% |
| $25,000 to $34,999 | 49 | 5.0% |
| $35,000 to $49,999 | 156 | 16.0% |
| $50,000 to $74,999 | 184 | 18.9% |
| $75,000 to $99,999 | 120 | 12.3% |
| $100,000 to $149,999 | 198 | 20.3% |
| $150,000 to $199,999 | 111 | 11.4% |
| $200,000+ | 13 | 1.3% |
Household Income by Householder Age in Le Center
The median household income in Le Center is $63,944, with the highest median household income of $104,517 found in the 45 to 64 years age bracket for the primary householder. A total of 345 households (35.4%) fall into this category. Meanwhile, the 65+ years age bracket for the primary householder has the lowest median household income of $25,000, with 242 households (24.8%) in this group.
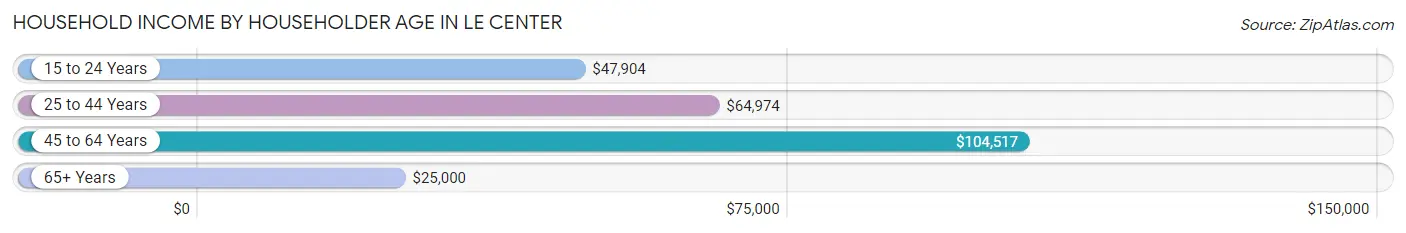
| Income Bracket | # Households | Median Income |
| 15 to 24 Years | 77 (7.9%) | $47,904 |
| 25 to 44 Years | 311 (31.9%) | $64,974 |
| 45 to 64 Years | 345 (35.4%) | $104,517 |
| 65+ Years | 242 (24.8%) | $25,000 |
| Total | 975 (100.0%) | $63,944 |
Poverty in Le Center
Income Below Poverty by Sex and Age in Le Center
With 7.3% poverty level for males and 7.5% for females among the residents of Le Center, 25 to 34 year old males and 65 to 74 year old females are the most vulnerable to poverty, with 28 males (15.9%) and 34 females (29.3%) in their respective age groups living below the poverty level.
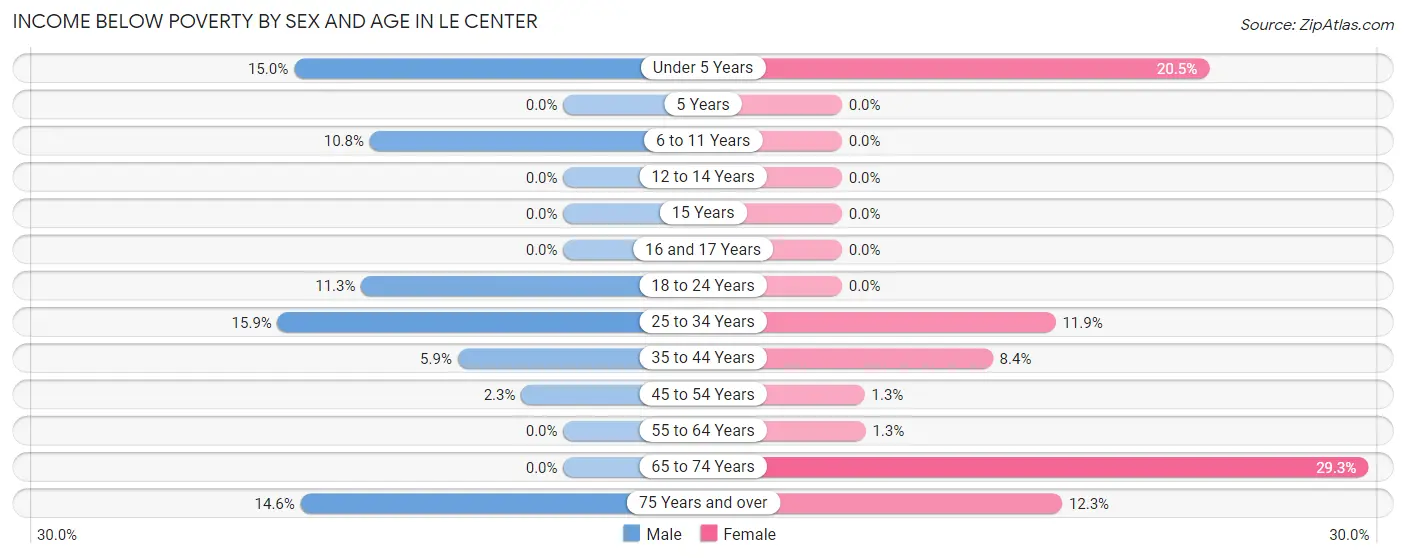
| Age Bracket | Male | Female |
| Under 5 Years | 12 (15.0%) | 9 (20.4%) |
| 5 Years | 0 (0.0%) | 0 (0.0%) |
| 6 to 11 Years | 11 (10.8%) | 0 (0.0%) |
| 12 to 14 Years | 0 (0.0%) | 0 (0.0%) |
| 15 Years | 0 (0.0%) | 0 (0.0%) |
| 16 and 17 Years | 0 (0.0%) | 0 (0.0%) |
| 18 to 24 Years | 18 (11.3%) | 0 (0.0%) |
| 25 to 34 Years | 28 (15.9%) | 20 (11.9%) |
| 35 to 44 Years | 13 (5.9%) | 10 (8.4%) |
| 45 to 54 Years | 4 (2.3%) | 2 (1.3%) |
| 55 to 64 Years | 0 (0.0%) | 2 (1.3%) |
| 65 to 74 Years | 0 (0.0%) | 34 (29.3%) |
| 75 Years and over | 6 (14.6%) | 13 (12.3%) |
| Total | 92 (7.3%) | 90 (7.5%) |
Income Above Poverty by Sex and Age in Le Center
According to the poverty statistics in Le Center, males aged 5 years and females aged 5 years are the age groups that are most secure financially, with 100.0% of males and 100.0% of females in these age groups living above the poverty line.
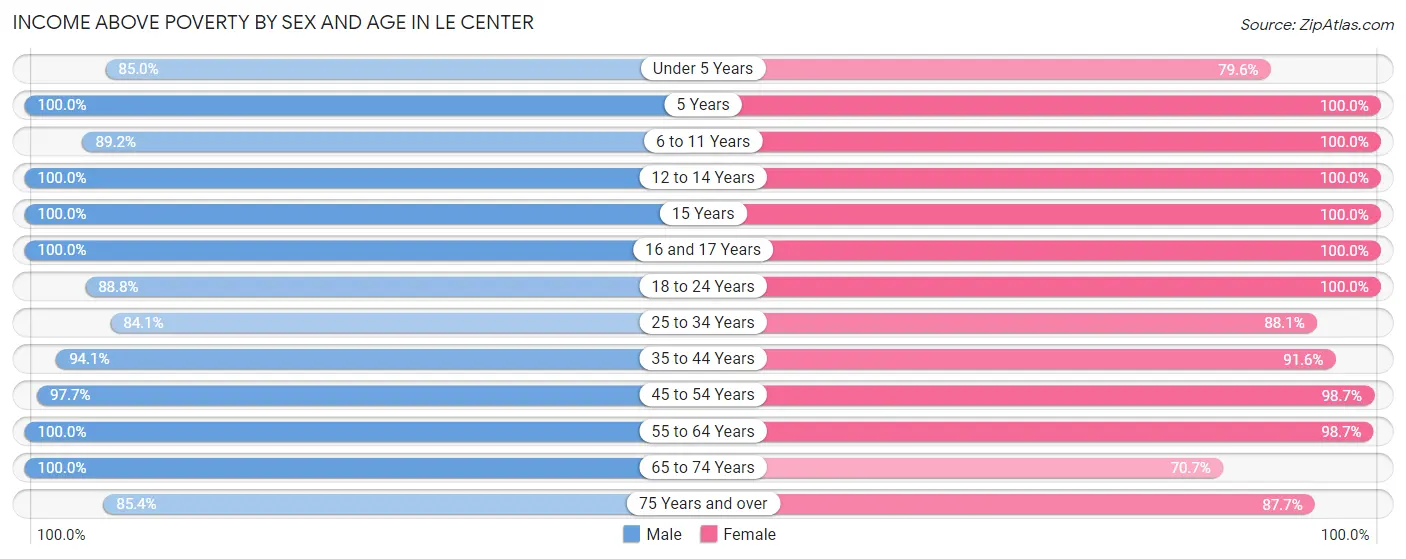
| Age Bracket | Male | Female |
| Under 5 Years | 68 (85.0%) | 35 (79.5%) |
| 5 Years | 16 (100.0%) | 17 (100.0%) |
| 6 to 11 Years | 91 (89.2%) | 91 (100.0%) |
| 12 to 14 Years | 49 (100.0%) | 56 (100.0%) |
| 15 Years | 1 (100.0%) | 3 (100.0%) |
| 16 and 17 Years | 31 (100.0%) | 24 (100.0%) |
| 18 to 24 Years | 142 (88.7%) | 149 (100.0%) |
| 25 to 34 Years | 148 (84.1%) | 148 (88.1%) |
| 35 to 44 Years | 208 (94.1%) | 109 (91.6%) |
| 45 to 54 Years | 167 (97.7%) | 155 (98.7%) |
| 55 to 64 Years | 145 (100.0%) | 150 (98.7%) |
| 65 to 74 Years | 58 (100.0%) | 82 (70.7%) |
| 75 Years and over | 35 (85.4%) | 93 (87.7%) |
| Total | 1,159 (92.6%) | 1,112 (92.5%) |
Income Below Poverty Among Married-Couple Families in Le Center
The poverty statistics for married-couple families in Le Center show that 1.0% or 5 of the total 498 families live below the poverty line. Families with no children have the highest poverty rate of 1.4%, comprising of 5 families. On the other hand, families with 1 or 2 children have the lowest poverty rate of 0.0%, which includes 0 families.
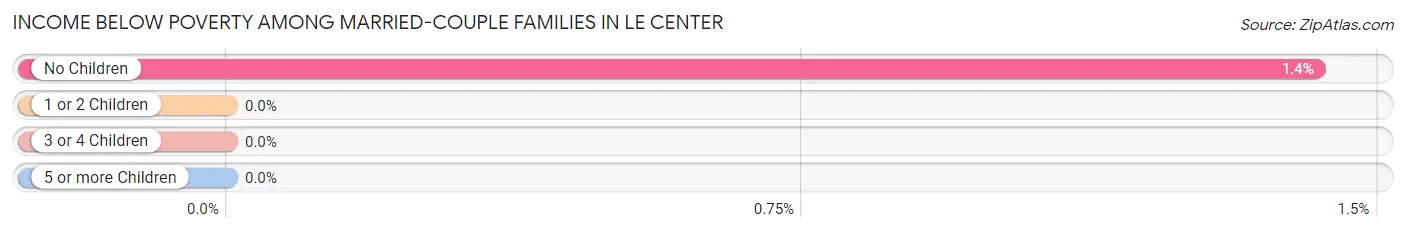
| Children | Above Poverty | Below Poverty |
| No Children | 348 (98.6%) | 5 (1.4%) |
| 1 or 2 Children | 106 (100.0%) | 0 (0.0%) |
| 3 or 4 Children | 39 (100.0%) | 0 (0.0%) |
| 5 or more Children | 0 (0.0%) | 0 (0.0%) |
| Total | 493 (99.0%) | 5 (1.0%) |
Income Below Poverty Among Single-Parent Households in Le Center
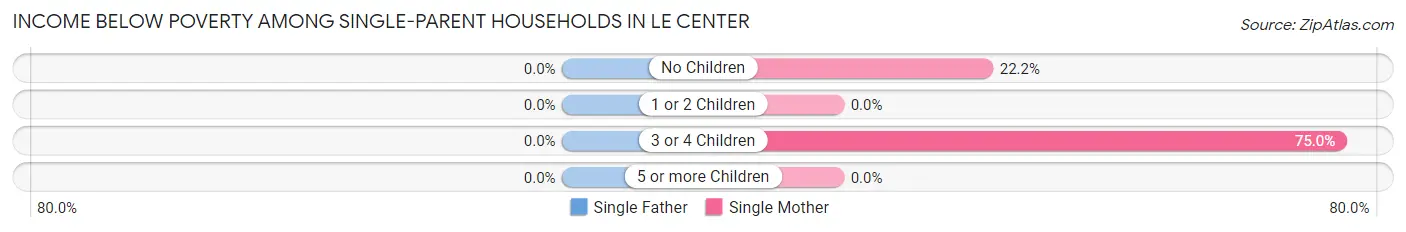
| Children | Single Father | Single Mother |
| No Children | 0 (0.0%) | 6 (22.2%) |
| 1 or 2 Children | 0 (0.0%) | 0 (0.0%) |
| 3 or 4 Children | 0 (0.0%) | 12 (75.0%) |
| 5 or more Children | 0 (0.0%) | 0 (0.0%) |
| Total | 0 (0.0%) | 18 (27.7%) |
Income Below Poverty Among Married-Couple vs Single-Parent Households in Le Center
The poverty data for Le Center shows that 5 of the married-couple family households (1.0%) and 18 of the single-parent households (12.2%) are living below the poverty level. Within the married-couple family households, those with no children have the highest poverty rate, with 5 households (1.4%) falling below the poverty line. Among the single-parent households, those with 3 or 4 children have the highest poverty rate, with 12 household (33.3%) living below poverty.
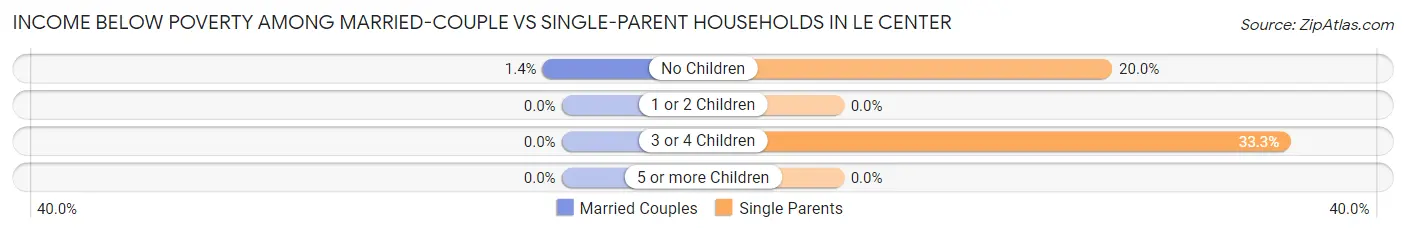
| Children | Married-Couple Families | Single-Parent Households |
| No Children | 5 (1.4%) | 6 (20.0%) |
| 1 or 2 Children | 0 (0.0%) | 0 (0.0%) |
| 3 or 4 Children | 0 (0.0%) | 12 (33.3%) |
| 5 or more Children | 0 (0.0%) | 0 (0.0%) |
| Total | 5 (1.0%) | 18 (12.2%) |
Race in Le Center
The most populous races in Le Center are White / Caucasian (2,152 | 86.0%), Hispanic or Latino (573 | 22.9%), and Some other Race (203 | 8.1%).
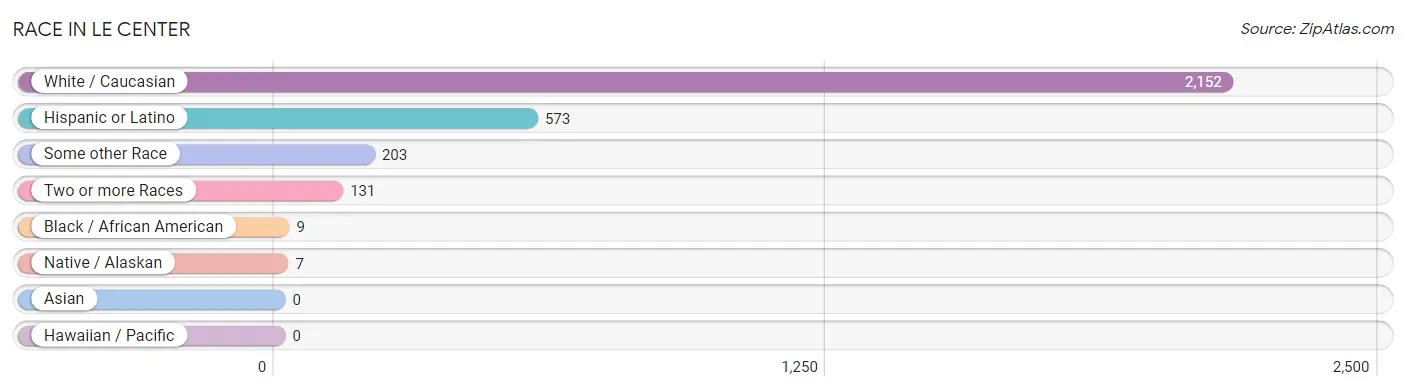
| Race | # Population | % Population |
| Asian | 0 | 0.0% |
| Black / African American | 9 | 0.4% |
| Hawaiian / Pacific | 0 | 0.0% |
| Hispanic or Latino | 573 | 22.9% |
| Native / Alaskan | 7 | 0.3% |
| White / Caucasian | 2,152 | 86.0% |
| Two or more Races | 131 | 5.2% |
| Some other Race | 203 | 8.1% |
| Total | 2,502 | 100.0% |
Ancestry in Le Center
The most populous ancestries reported in Le Center are German (920 | 36.8%), Mexican (557 | 22.3%), Czech (243 | 9.7%), English (239 | 9.6%), and Irish (231 | 9.2%), together accounting for 87.5% of all Le Center residents.
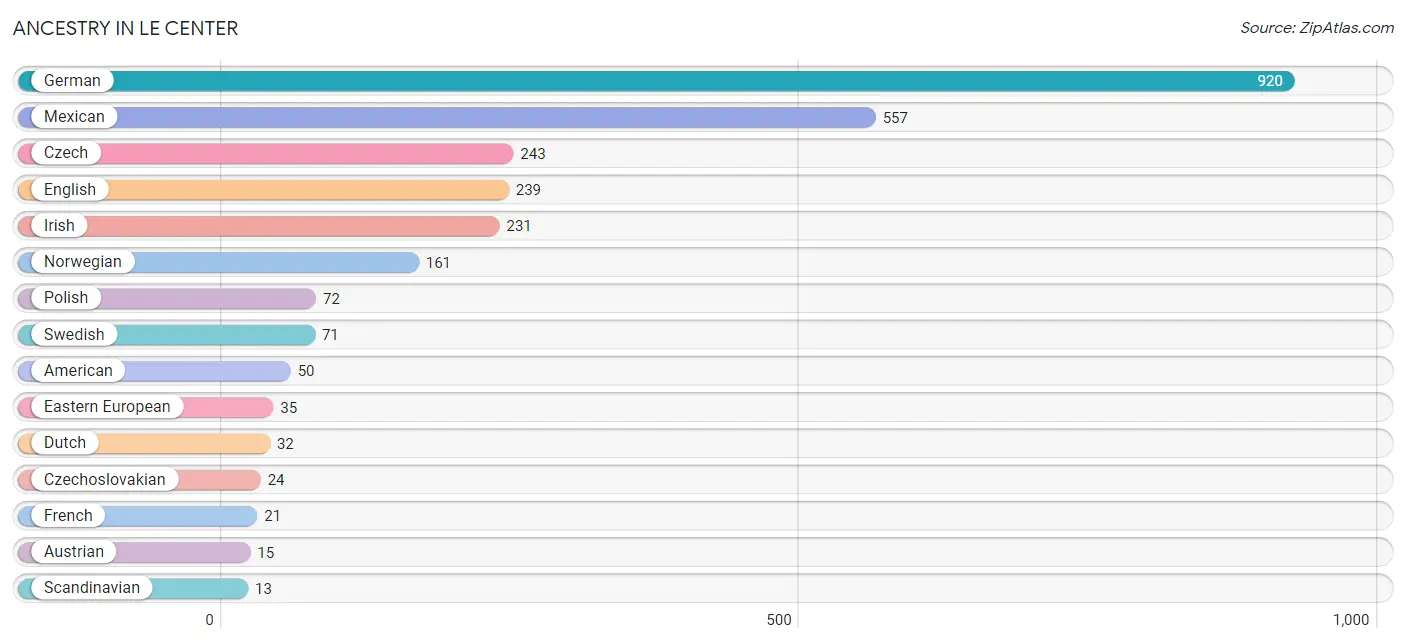
| Ancestry | # Population | % Population |
| American | 50 | 2.0% |
| Austrian | 15 | 0.6% |
| Blackfeet | 1 | 0.0% |
| British | 6 | 0.2% |
| Central American | 10 | 0.4% |
| Chippewa | 2 | 0.1% |
| Czech | 243 | 9.7% |
| Czechoslovakian | 24 | 1.0% |
| Dutch | 32 | 1.3% |
| Eastern European | 35 | 1.4% |
| English | 239 | 9.6% |
| French | 21 | 0.8% |
| German | 920 | 36.8% |
| Honduran | 10 | 0.4% |
| Irish | 231 | 9.2% |
| Italian | 11 | 0.4% |
| Latvian | 5 | 0.2% |
| Mexican | 557 | 22.3% |
| Norwegian | 161 | 6.4% |
| Polish | 72 | 2.9% |
| Scandinavian | 13 | 0.5% |
| Scotch-Irish | 12 | 0.5% |
| Scottish | 5 | 0.2% |
| Sioux | 7 | 0.3% |
| Swedish | 71 | 2.8% |
| Swiss | 4 | 0.2% |
| Welsh | 6 | 0.2% | View All 27 Rows |
Immigrants in Le Center
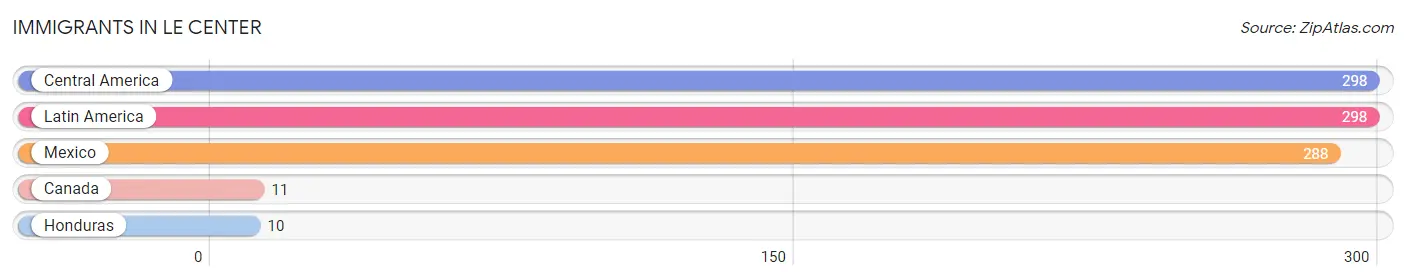
The most numerous immigrant groups reported in Le Center came from Central America (298 | 11.9%), Latin America (298 | 11.9%), Mexico (288 | 11.5%), Canada (11 | 0.4%), and Honduras (10 | 0.4%), together accounting for 36.2% of all Le Center residents.
| Immigration Origin | # Population | % Population |
| Canada | 11 | 0.4% |
| Central America | 298 | 11.9% |
| Honduras | 10 | 0.4% |
| Latin America | 298 | 11.9% |
| Mexico | 288 | 11.5% | View All 5 Rows |
Sex and Age in Le Center
Sex and Age in Le Center
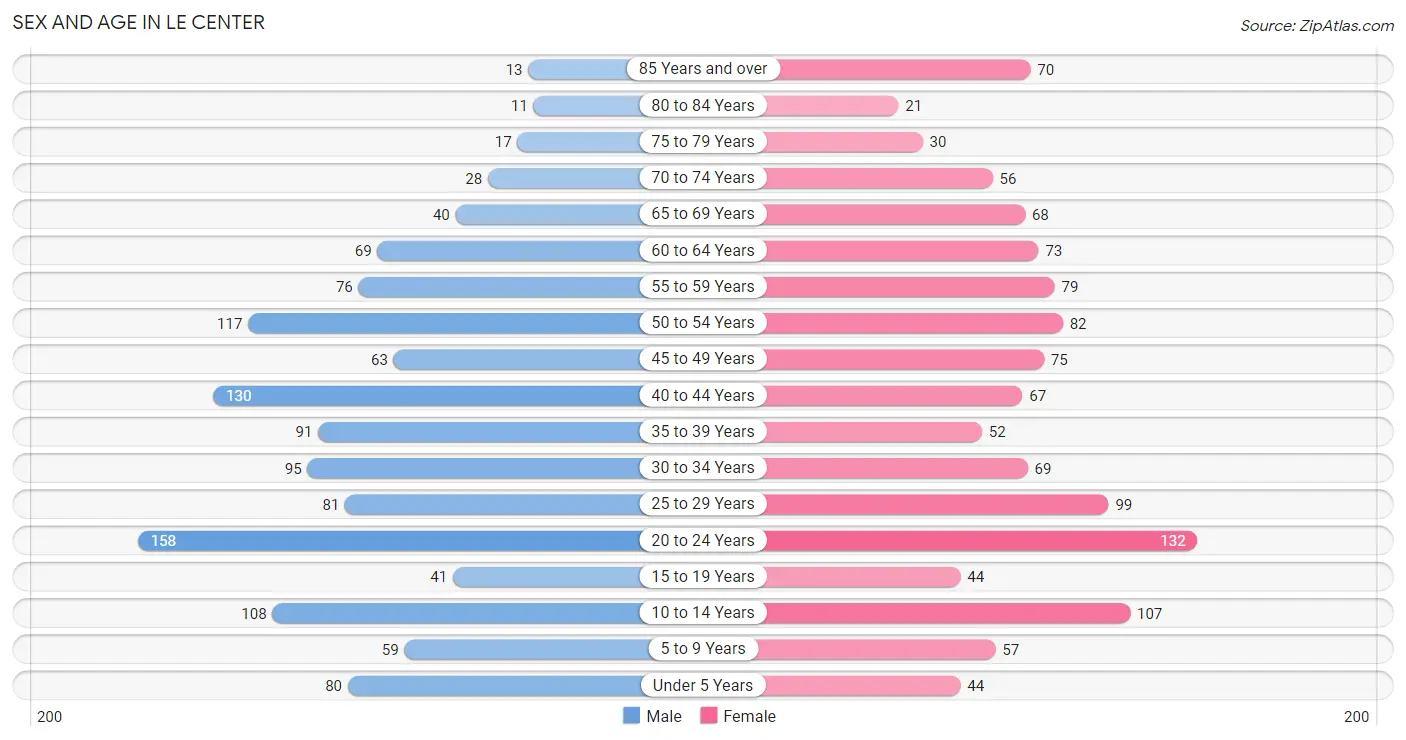
The most populous age groups in Le Center are 20 to 24 Years (158 | 12.4%) for men and 20 to 24 Years (132 | 10.8%) for women.
| Age Bracket | Male | Female |
| Under 5 Years | 80 (6.3%) | 44 (3.6%) |
| 5 to 9 Years | 59 (4.6%) | 57 (4.6%) |
| 10 to 14 Years | 108 (8.5%) | 107 (8.7%) |
| 15 to 19 Years | 41 (3.2%) | 44 (3.6%) |
| 20 to 24 Years | 158 (12.4%) | 132 (10.8%) |
| 25 to 29 Years | 81 (6.3%) | 99 (8.1%) |
| 30 to 34 Years | 95 (7.4%) | 69 (5.6%) |
| 35 to 39 Years | 91 (7.1%) | 52 (4.2%) |
| 40 to 44 Years | 130 (10.2%) | 67 (5.5%) |
| 45 to 49 Years | 63 (4.9%) | 75 (6.1%) |
| 50 to 54 Years | 117 (9.2%) | 82 (6.7%) |
| 55 to 59 Years | 76 (5.9%) | 79 (6.5%) |
| 60 to 64 Years | 69 (5.4%) | 73 (6.0%) |
| 65 to 69 Years | 40 (3.1%) | 68 (5.6%) |
| 70 to 74 Years | 28 (2.2%) | 56 (4.6%) |
| 75 to 79 Years | 17 (1.3%) | 30 (2.5%) |
| 80 to 84 Years | 11 (0.9%) | 21 (1.7%) |
| 85 Years and over | 13 (1.0%) | 70 (5.7%) |
| Total | 1,277 (100.0%) | 1,225 (100.0%) |
Families and Households in Le Center
Median Family Size in Le Center
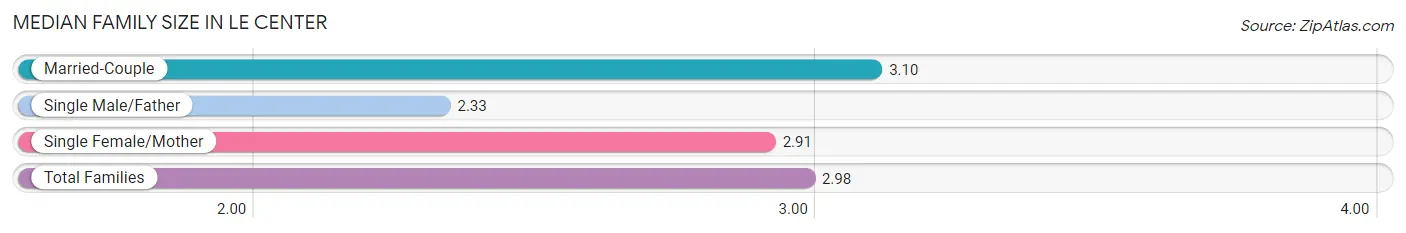
The median family size in Le Center is 2.98 persons per family, with married-couple families (498 | 77.1%) accounting for the largest median family size of 3.1 persons per family. On the other hand, single male/father families (83 | 12.9%) represent the smallest median family size with 2.33 persons per family.
| Family Type | # Families | Family Size |
| Married-Couple | 498 (77.1%) | 3.10 |
| Single Male/Father | 83 (12.9%) | 2.33 |
| Single Female/Mother | 65 (10.1%) | 2.91 |
| Total Families | 646 (100.0%) | 2.98 |
Median Household Size in Le Center
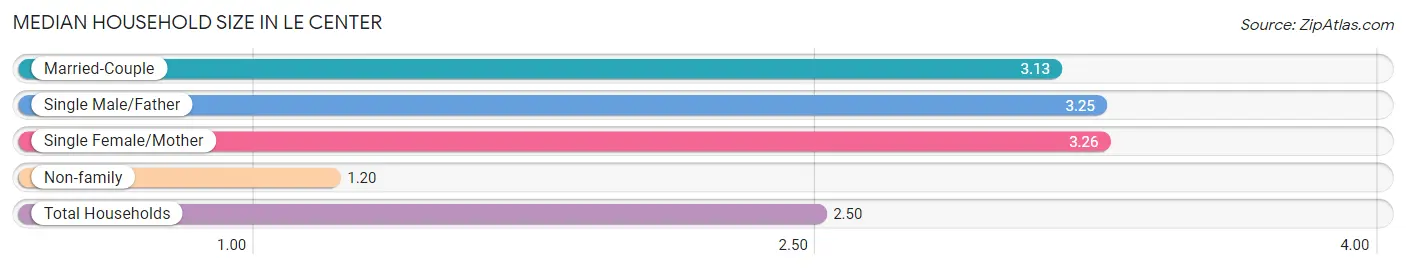
The median household size in Le Center is 2.50 persons per household, with single female/mother households (65 | 6.7%) accounting for the largest median household size of 3.26 persons per household. non-family households (329 | 33.7%) represent the smallest median household size with 1.20 persons per household.
| Household Type | # Households | Household Size |
| Married-Couple | 498 (51.1%) | 3.13 |
| Single Male/Father | 83 (8.5%) | 3.25 |
| Single Female/Mother | 65 (6.7%) | 3.26 |
| Non-family | 329 (33.7%) | 1.20 |
| Total Households | 975 (100.0%) | 2.50 |
Household Size by Marriage Status in Le Center
Out of a total of 975 households in Le Center, 646 (66.3%) are family households, while 329 (33.7%) are nonfamily households. The most numerous type of family households are 2-person households, comprising 218, and the most common type of nonfamily households are 1-person households, comprising 275.
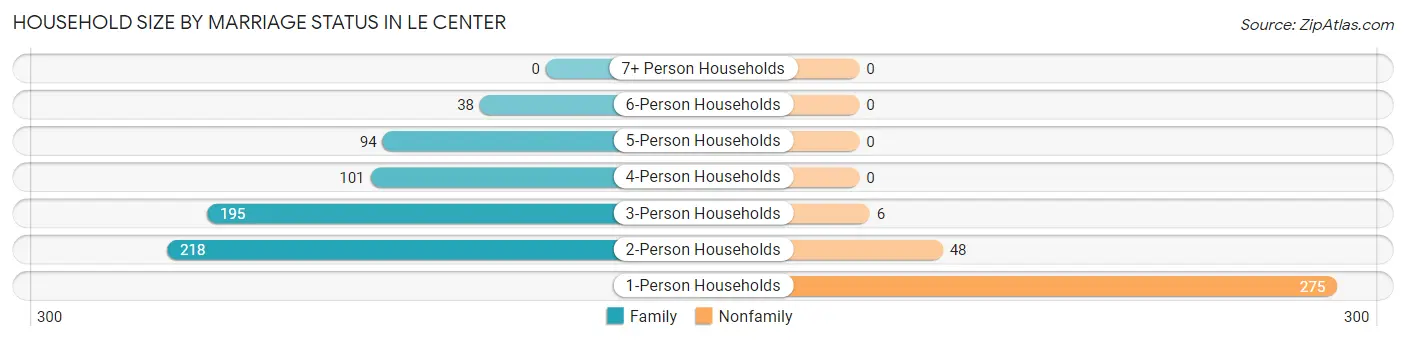
| Household Size | Family Households | Nonfamily Households |
| 1-Person Households | - | 275 (28.2%) |
| 2-Person Households | 218 (22.4%) | 48 (4.9%) |
| 3-Person Households | 195 (20.0%) | 6 (0.6%) |
| 4-Person Households | 101 (10.4%) | 0 (0.0%) |
| 5-Person Households | 94 (9.6%) | 0 (0.0%) |
| 6-Person Households | 38 (3.9%) | 0 (0.0%) |
| 7+ Person Households | 0 (0.0%) | 0 (0.0%) |
| Total | 646 (66.3%) | 329 (33.7%) |
Female Fertility in Le Center
Fertility by Age in Le Center
Average fertility rate in Le Center is 21.0 births per 1,000 women. Women in the age bracket of 20 to 34 years have the highest fertility rate with 40.0 births per 1,000 women. Women in the age bracket of 20 to 34 years acount for 100.0% of all women with births.
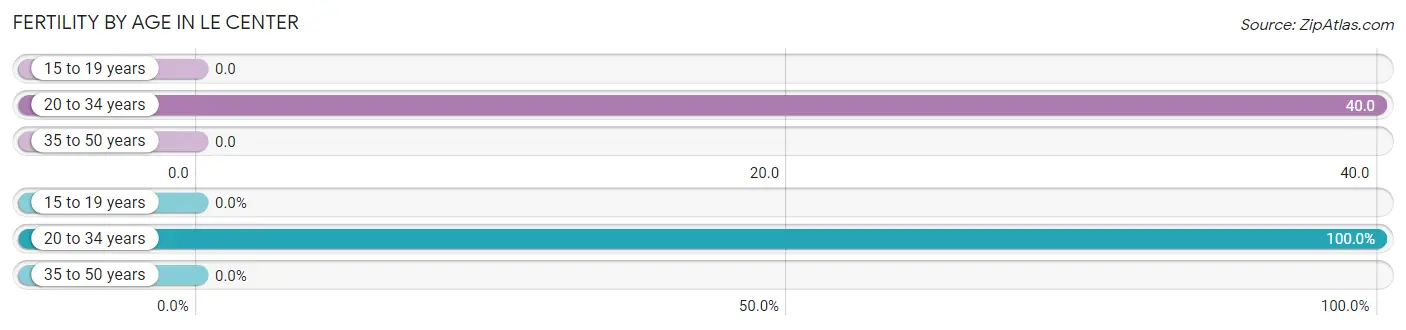
| Age Bracket | Women with Births | Births / 1,000 Women |
| 15 to 19 years | 0 (0.0%) | 0.0 |
| 20 to 34 years | 12 (100.0%) | 40.0 |
| 35 to 50 years | 0 (0.0%) | 0.0 |
| Total | 12 (100.0%) | 21.0 |
Fertility by Age by Marriage Status in Le Center
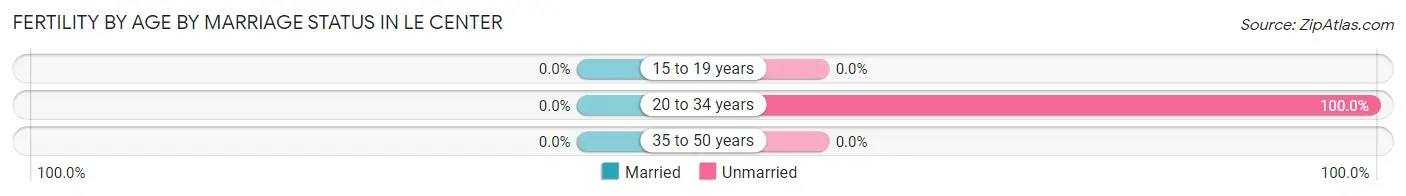
| Age Bracket | Married | Unmarried |
| 15 to 19 years | 0 (0.0%) | 0 (0.0%) |
| 20 to 34 years | 0 (0.0%) | 12 (100.0%) |
| 35 to 50 years | 0 (0.0%) | 0 (0.0%) |
| Total | 0 (0.0%) | 12 (100.0%) |
Fertility by Education in Le Center
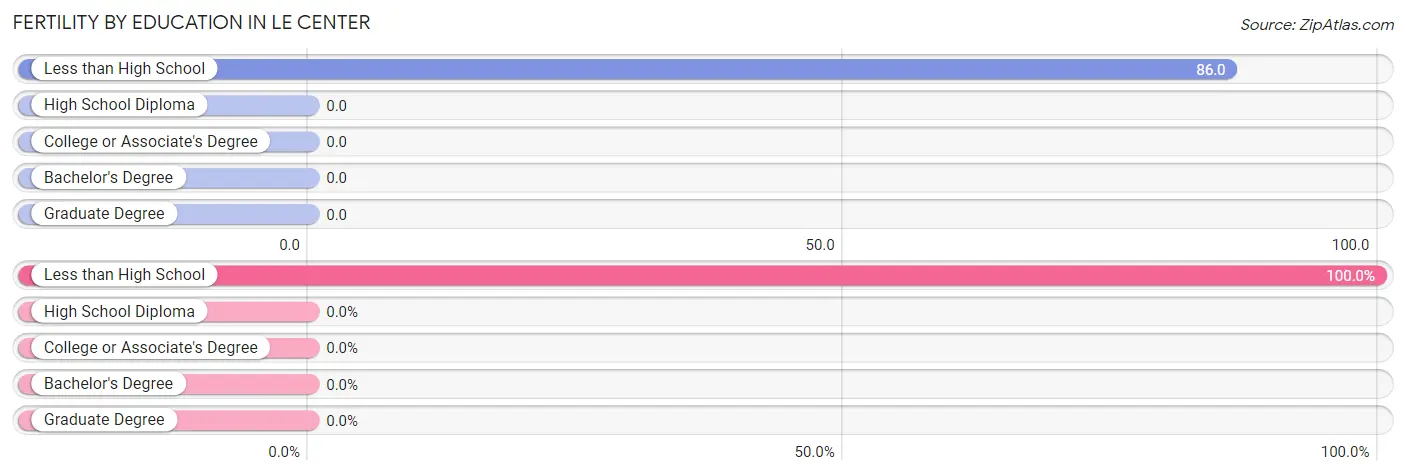
| Educational Attainment | Women with Births | Births / 1,000 Women |
| Less than High School | 12 (100.0%) | 86.0 |
| High School Diploma | 0 (0.0%) | 0.0 |
| College or Associate's Degree | 0 (0.0%) | 0.0 |
| Bachelor's Degree | 0 (0.0%) | 0.0 |
| Graduate Degree | 0 (0.0%) | 0.0 |
| Total | 12 (100.0%) | 21.0 |
Fertility by Education by Marriage Status in Le Center
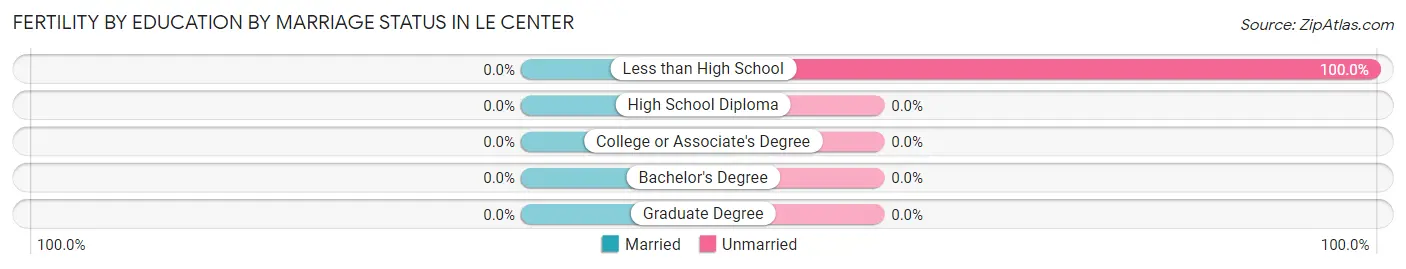
| Educational Attainment | Married | Unmarried |
| Less than High School | 0 (0.0%) | 12 (100.0%) |
| High School Diploma | 0 (0.0%) | 0 (0.0%) |
| College or Associate's Degree | 0 (0.0%) | 0 (0.0%) |
| Bachelor's Degree | 0 (0.0%) | 0 (0.0%) |
| Graduate Degree | 0 (0.0%) | 0 (0.0%) |
| Total | 0 (0.0%) | 12 (100.0%) |
Employment Characteristics in Le Center
Employment by Class of Employer in Le Center
Among the 1,322 employed individuals in Le Center, private company employees (878 | 66.4%), local government employees (169 | 12.8%), and self-employed (not incorporated) (118 | 8.9%) make up the most common classes of employment.
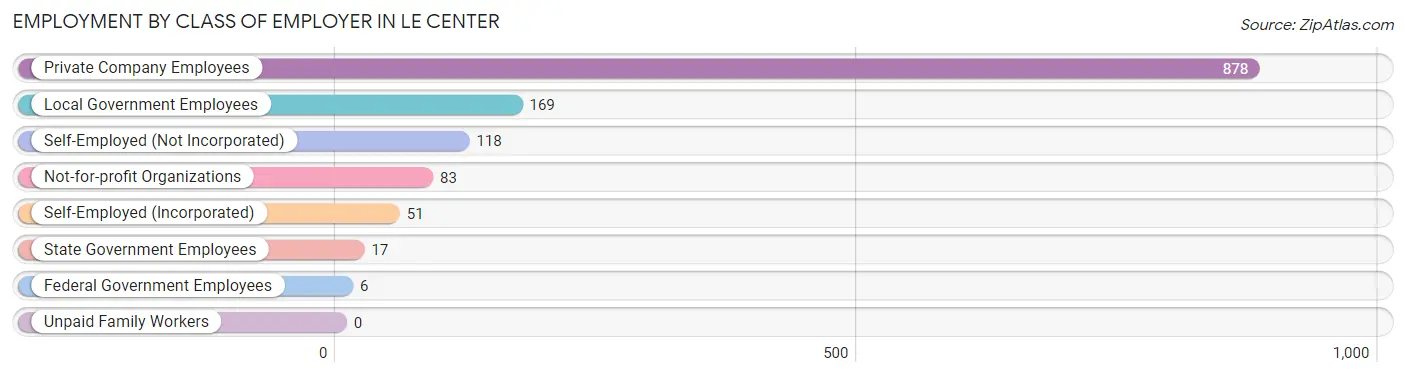
| Employer Class | # Employees | % Employees |
| Private Company Employees | 878 | 66.4% |
| Self-Employed (Incorporated) | 51 | 3.9% |
| Self-Employed (Not Incorporated) | 118 | 8.9% |
| Not-for-profit Organizations | 83 | 6.3% |
| Local Government Employees | 169 | 12.8% |
| State Government Employees | 17 | 1.3% |
| Federal Government Employees | 6 | 0.4% |
| Unpaid Family Workers | 0 | 0.0% |
| Total | 1,322 | 100.0% |
Employment Status by Age in Le Center
According to the labor force statistics for Le Center, out of the total population over 16 years of age (2,043), 69.4% or 1,418 individuals are in the labor force, with 5.5% or 78 of them unemployed. The age group with the highest labor force participation rate is 45 to 54 years, with 92.9% or 313 individuals in the labor force. Within the labor force, the 20 to 24 years age range has the highest percentage of unemployed individuals, with 15.7% or 29 of them being unemployed.
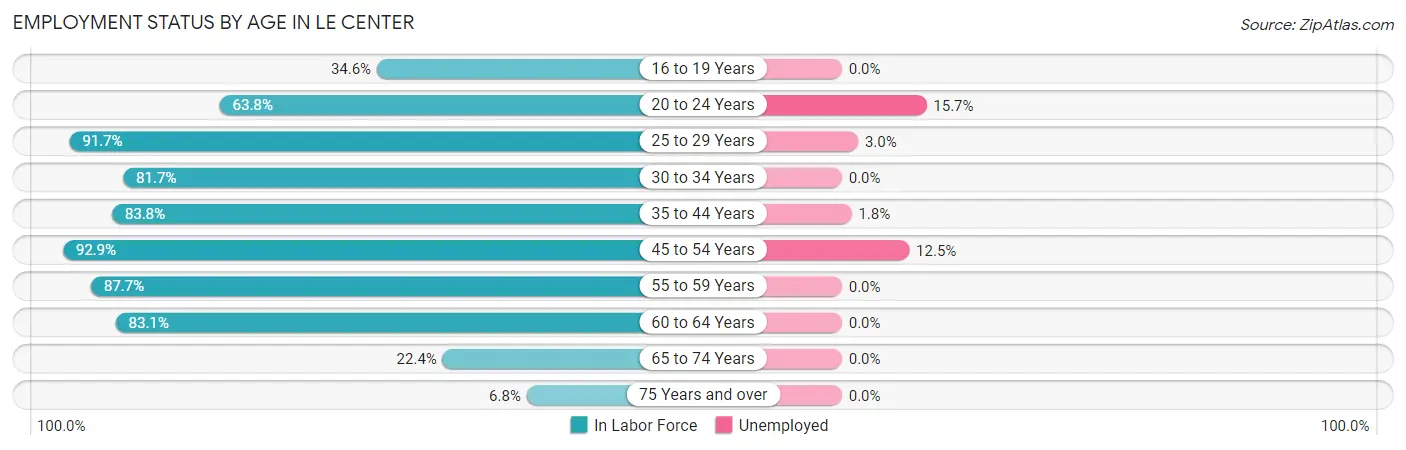
| Age Bracket | In Labor Force | Unemployed |
| 16 to 19 Years | 28 (34.6%) | 0 (0.0%) |
| 20 to 24 Years | 185 (63.8%) | 29 (15.7%) |
| 25 to 29 Years | 165 (91.7%) | 5 (3.0%) |
| 30 to 34 Years | 134 (81.7%) | 0 (0.0%) |
| 35 to 44 Years | 285 (83.8%) | 5 (1.8%) |
| 45 to 54 Years | 313 (92.9%) | 39 (12.5%) |
| 55 to 59 Years | 136 (87.7%) | 0 (0.0%) |
| 60 to 64 Years | 118 (83.1%) | 0 (0.0%) |
| 65 to 74 Years | 43 (22.4%) | 0 (0.0%) |
| 75 Years and over | 11 (6.8%) | 0 (0.0%) |
| Total | 1,418 (69.4%) | 78 (5.5%) |
Employment Status by Educational Attainment in Le Center
According to labor force statistics for Le Center, 87.3% of individuals (1,151) out of the total population between 25 and 64 years of age (1,318) are in the labor force, with 4.3% or 49 of them being unemployed. The group with the highest labor force participation rate are those with the educational attainment of bachelor's degree or higher, with 93.6% or 162 individuals in the labor force. Within the labor force, individuals with college / associate degree education have the highest percentage of unemployment, with 8.5% or 35 of them being unemployed.
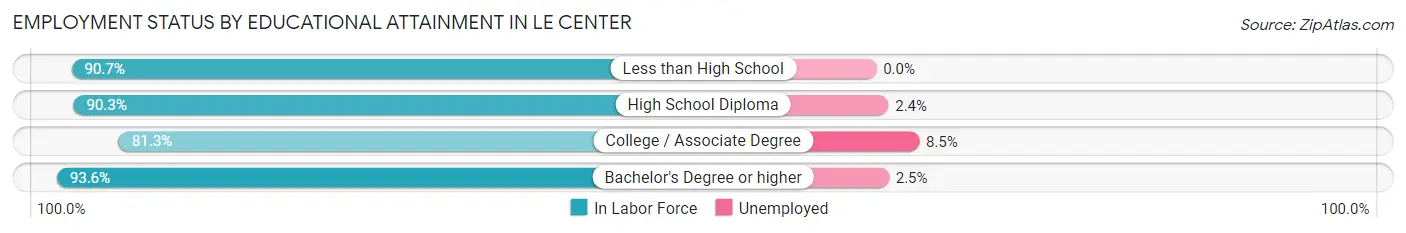
| Educational Attainment | In Labor Force | Unemployed |
| Less than High School | 165 (90.7%) | 0 (0.0%) |
| High School Diploma | 411 (90.3%) | 11 (2.4%) |
| College / Associate Degree | 413 (81.3%) | 43 (8.5%) |
| Bachelor's Degree or higher | 162 (93.6%) | 4 (2.5%) |
| Total | 1,151 (87.3%) | 57 (4.3%) |
Employment Occupations by Sex in Le Center
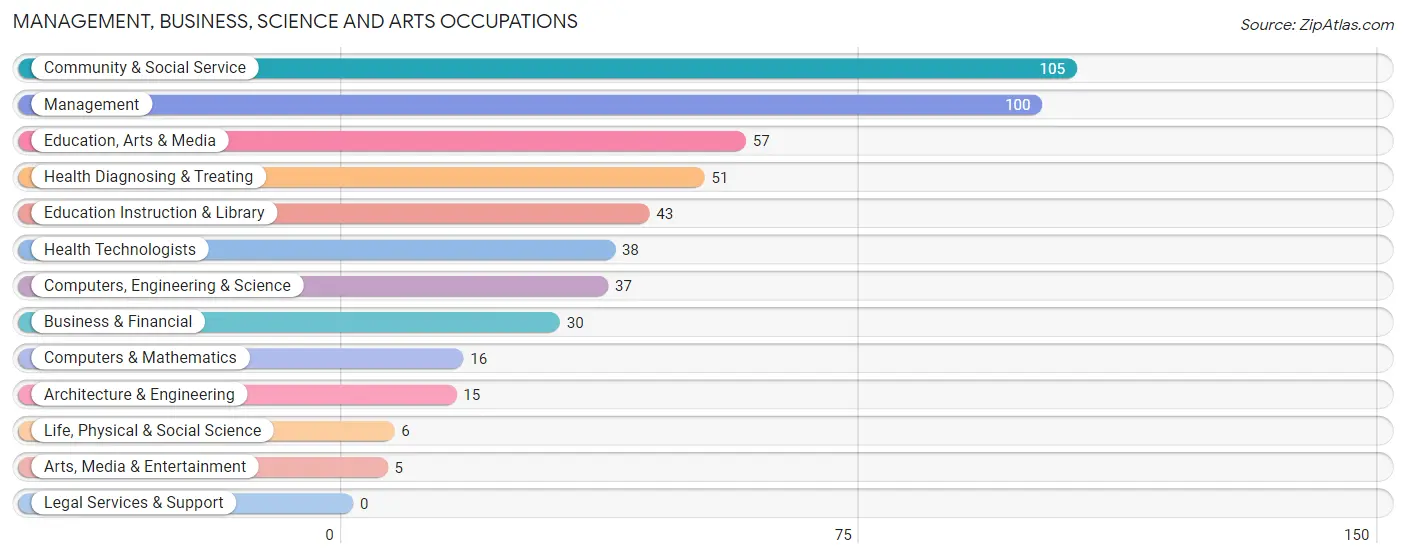
Management, Business, Science and Arts Occupations
The most common Management, Business, Science and Arts occupations in Le Center are Community & Social Service (105 | 7.8%), Management (100 | 7.5%), Education, Arts & Media (57 | 4.3%), Health Diagnosing & Treating (51 | 3.8%), and Education Instruction & Library (43 | 3.2%).
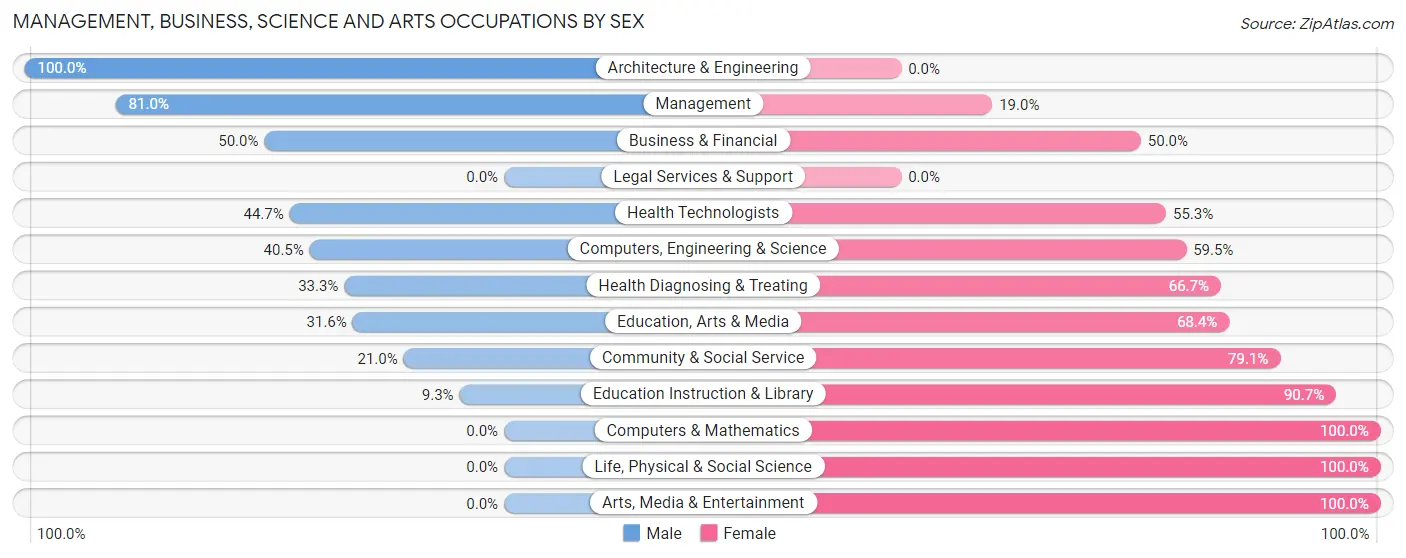
Management, Business, Science and Arts Occupations by Sex
Within the Management, Business, Science and Arts occupations in Le Center, the most male-oriented occupations are Architecture & Engineering (100.0%), Management (81.0%), and Business & Financial (50.0%), while the most female-oriented occupations are Computers & Mathematics (100.0%), Life, Physical & Social Science (100.0%), and Arts, Media & Entertainment (100.0%).
| Occupation | Male | Female |
| Management | 81 (81.0%) | 19 (19.0%) |
| Business & Financial | 15 (50.0%) | 15 (50.0%) |
| Computers, Engineering & Science | 15 (40.5%) | 22 (59.5%) |
| Computers & Mathematics | 0 (0.0%) | 16 (100.0%) |
| Architecture & Engineering | 15 (100.0%) | 0 (0.0%) |
| Life, Physical & Social Science | 0 (0.0%) | 6 (100.0%) |
| Community & Social Service | 22 (20.9%) | 83 (79.0%) |
| Education, Arts & Media | 18 (31.6%) | 39 (68.4%) |
| Legal Services & Support | 0 (0.0%) | 0 (0.0%) |
| Education Instruction & Library | 4 (9.3%) | 39 (90.7%) |
| Arts, Media & Entertainment | 0 (0.0%) | 5 (100.0%) |
| Health Diagnosing & Treating | 17 (33.3%) | 34 (66.7%) |
| Health Technologists | 17 (44.7%) | 21 (55.3%) |
| Total (Category) | 150 (46.4%) | 173 (53.6%) |
| Total (Overall) | 743 (55.4%) | 597 (44.6%) |
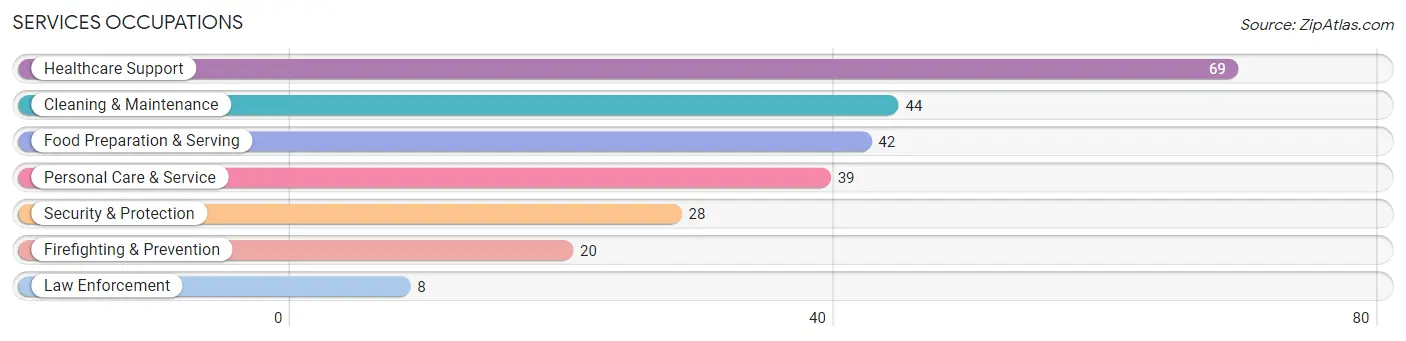
Services Occupations
The most common Services occupations in Le Center are Healthcare Support (69 | 5.1%), Cleaning & Maintenance (44 | 3.3%), Food Preparation & Serving (42 | 3.1%), Personal Care & Service (39 | 2.9%), and Security & Protection (28 | 2.1%).
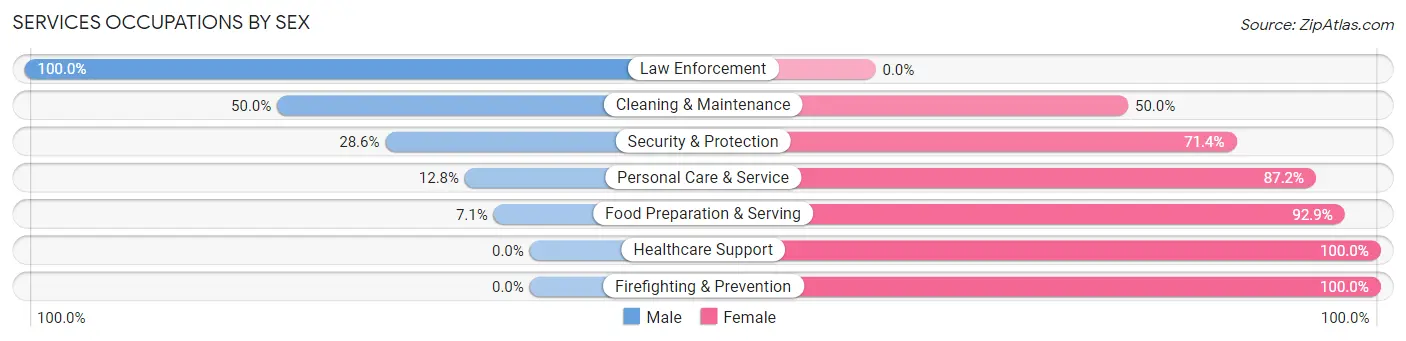
Services Occupations by Sex
Within the Services occupations in Le Center, the most male-oriented occupations are Law Enforcement (100.0%), Cleaning & Maintenance (50.0%), and Security & Protection (28.6%), while the most female-oriented occupations are Healthcare Support (100.0%), Firefighting & Prevention (100.0%), and Food Preparation & Serving (92.9%).
| Occupation | Male | Female |
| Healthcare Support | 0 (0.0%) | 69 (100.0%) |
| Security & Protection | 8 (28.6%) | 20 (71.4%) |
| Firefighting & Prevention | 0 (0.0%) | 20 (100.0%) |
| Law Enforcement | 8 (100.0%) | 0 (0.0%) |
| Food Preparation & Serving | 3 (7.1%) | 39 (92.9%) |
| Cleaning & Maintenance | 22 (50.0%) | 22 (50.0%) |
| Personal Care & Service | 5 (12.8%) | 34 (87.2%) |
| Total (Category) | 38 (17.1%) | 184 (82.9%) |
| Total (Overall) | 743 (55.4%) | 597 (44.6%) |
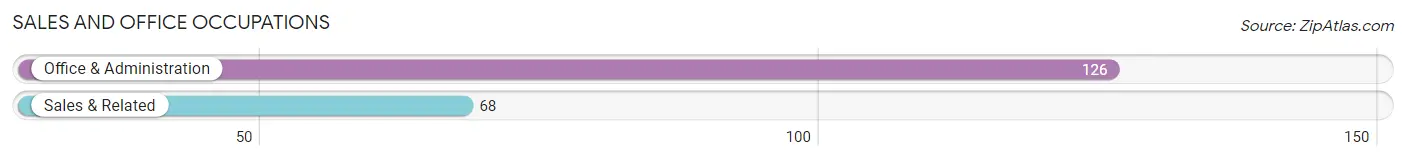
Sales and Office Occupations
The most common Sales and Office occupations in Le Center are Office & Administration (126 | 9.4%), and Sales & Related (68 | 5.1%).
Sales and Office Occupations by Sex
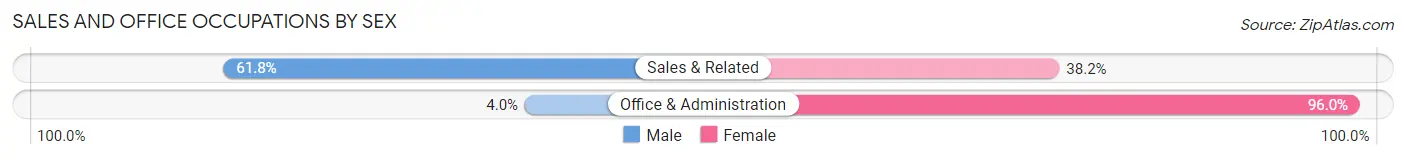
| Occupation | Male | Female |
| Sales & Related | 42 (61.8%) | 26 (38.2%) |
| Office & Administration | 5 (4.0%) | 121 (96.0%) |
| Total (Category) | 47 (24.2%) | 147 (75.8%) |
| Total (Overall) | 743 (55.4%) | 597 (44.6%) |
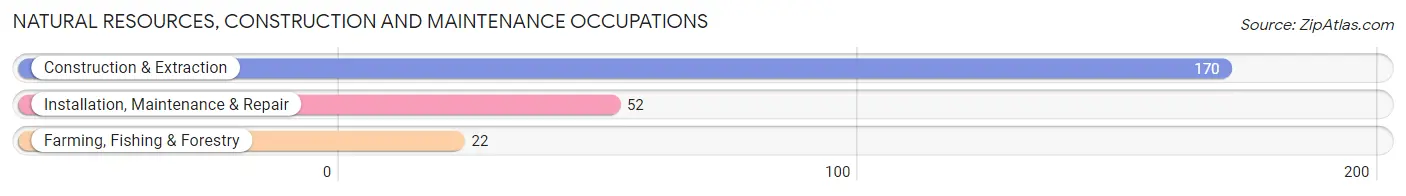
Natural Resources, Construction and Maintenance Occupations
The most common Natural Resources, Construction and Maintenance occupations in Le Center are Construction & Extraction (170 | 12.7%), Installation, Maintenance & Repair (52 | 3.9%), and Farming, Fishing & Forestry (22 | 1.6%).
Natural Resources, Construction and Maintenance Occupations by Sex
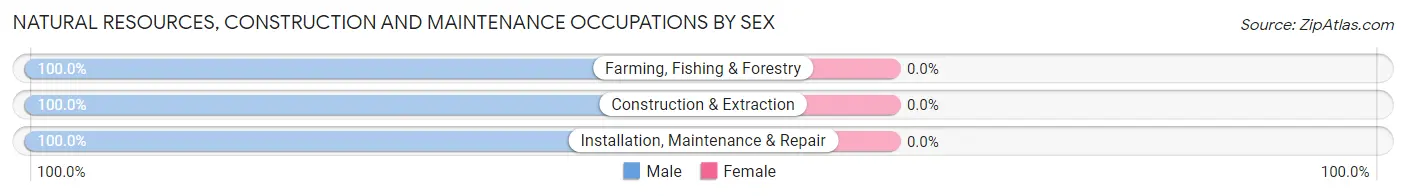
| Occupation | Male | Female |
| Farming, Fishing & Forestry | 22 (100.0%) | 0 (0.0%) |
| Construction & Extraction | 170 (100.0%) | 0 (0.0%) |
| Installation, Maintenance & Repair | 52 (100.0%) | 0 (0.0%) |
| Total (Category) | 244 (100.0%) | 0 (0.0%) |
| Total (Overall) | 743 (55.4%) | 597 (44.6%) |
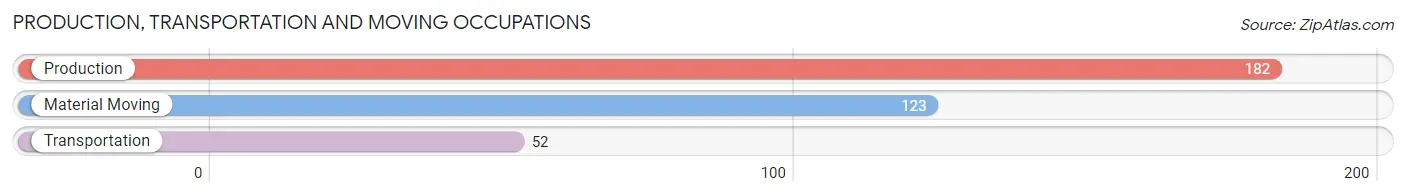
Production, Transportation and Moving Occupations
The most common Production, Transportation and Moving occupations in Le Center are Production (182 | 13.6%), Material Moving (123 | 9.2%), and Transportation (52 | 3.9%).
Production, Transportation and Moving Occupations by Sex
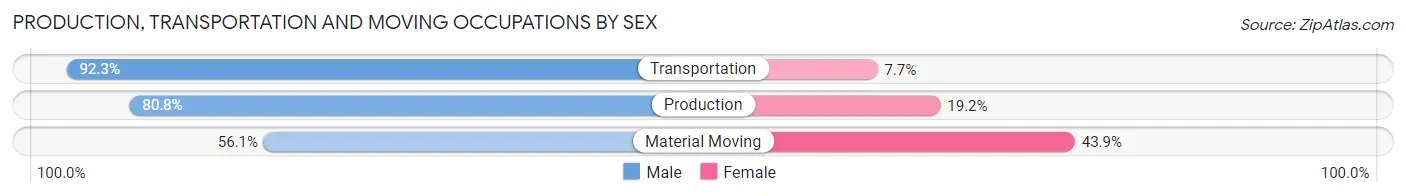
| Occupation | Male | Female |
| Production | 147 (80.8%) | 35 (19.2%) |
| Transportation | 48 (92.3%) | 4 (7.7%) |
| Material Moving | 69 (56.1%) | 54 (43.9%) |
| Total (Category) | 264 (74.0%) | 93 (26.1%) |
| Total (Overall) | 743 (55.4%) | 597 (44.6%) |
Employment Industries by Sex in Le Center
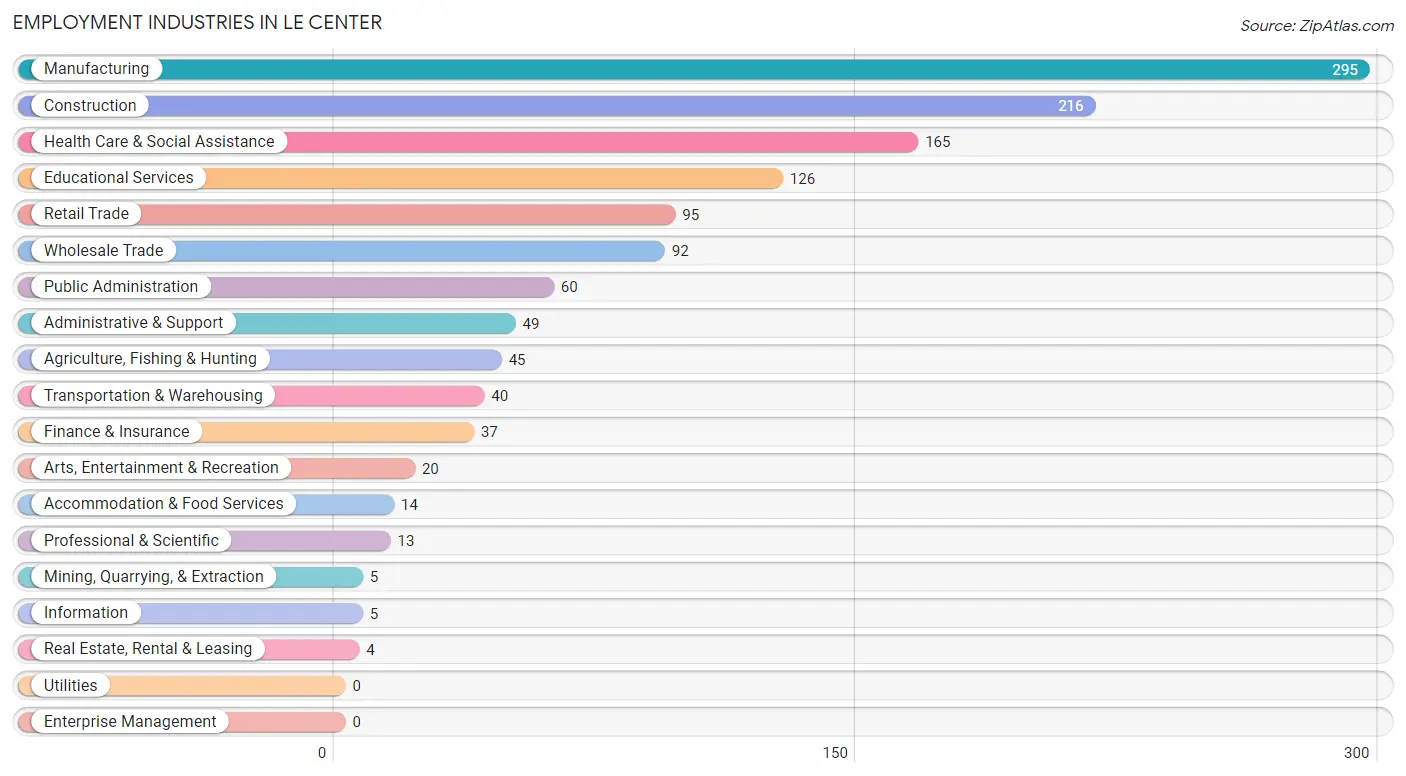
Employment Industries in Le Center
The major employment industries in Le Center include Manufacturing (295 | 22.0%), Construction (216 | 16.1%), Health Care & Social Assistance (165 | 12.3%), Educational Services (126 | 9.4%), and Retail Trade (95 | 7.1%).
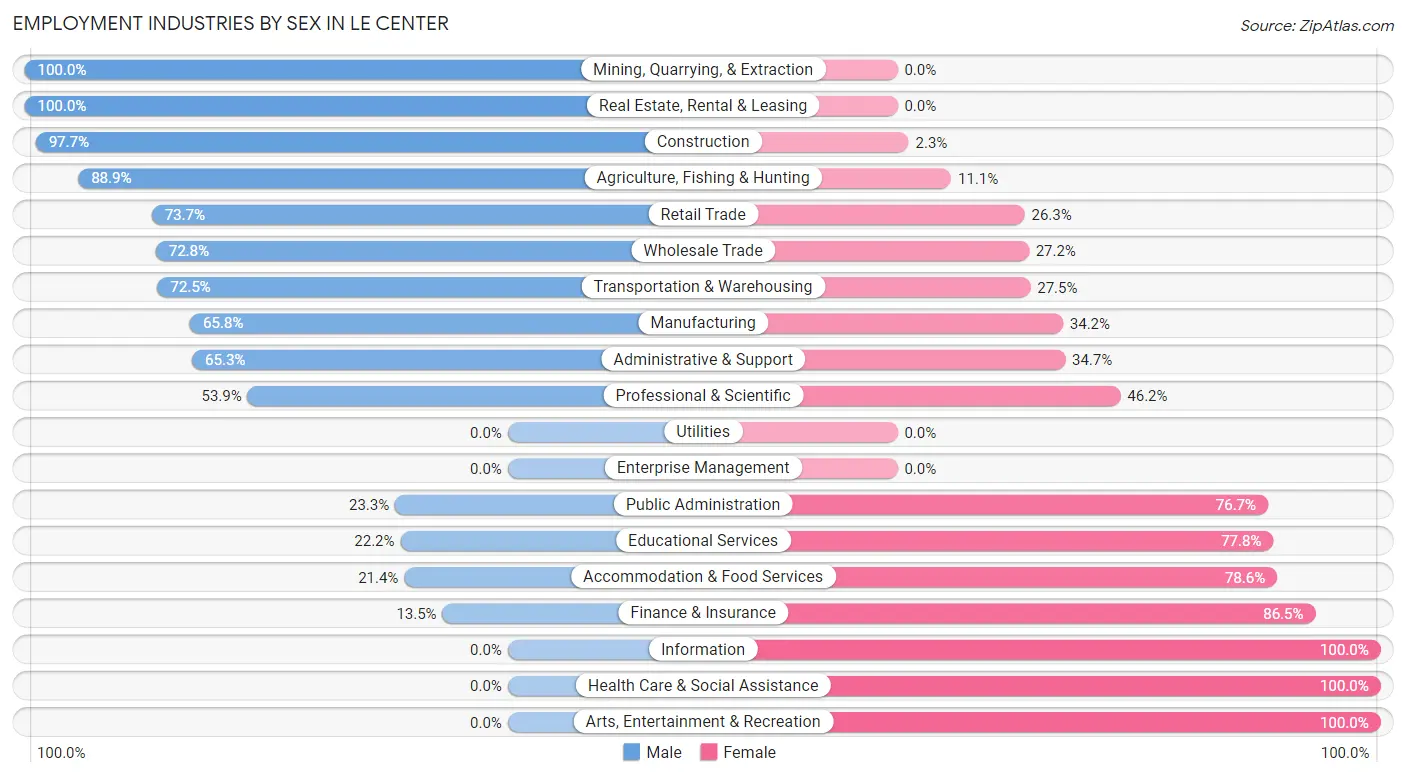
Employment Industries by Sex in Le Center
The Le Center industries that see more men than women are Mining, Quarrying, & Extraction (100.0%), Real Estate, Rental & Leasing (100.0%), and Construction (97.7%), whereas the industries that tend to have a higher number of women are Information (100.0%), Health Care & Social Assistance (100.0%), and Arts, Entertainment & Recreation (100.0%).
| Industry | Male | Female |
| Agriculture, Fishing & Hunting | 40 (88.9%) | 5 (11.1%) |
| Mining, Quarrying, & Extraction | 5 (100.0%) | 0 (0.0%) |
| Construction | 211 (97.7%) | 5 (2.3%) |
| Manufacturing | 194 (65.8%) | 101 (34.2%) |
| Wholesale Trade | 67 (72.8%) | 25 (27.2%) |
| Retail Trade | 70 (73.7%) | 25 (26.3%) |
| Transportation & Warehousing | 29 (72.5%) | 11 (27.5%) |
| Utilities | 0 (0.0%) | 0 (0.0%) |
| Information | 0 (0.0%) | 5 (100.0%) |
| Finance & Insurance | 5 (13.5%) | 32 (86.5%) |
| Real Estate, Rental & Leasing | 4 (100.0%) | 0 (0.0%) |
| Professional & Scientific | 7 (53.8%) | 6 (46.2%) |
| Enterprise Management | 0 (0.0%) | 0 (0.0%) |
| Administrative & Support | 32 (65.3%) | 17 (34.7%) |
| Educational Services | 28 (22.2%) | 98 (77.8%) |
| Health Care & Social Assistance | 0 (0.0%) | 165 (100.0%) |
| Arts, Entertainment & Recreation | 0 (0.0%) | 20 (100.0%) |
| Accommodation & Food Services | 3 (21.4%) | 11 (78.6%) |
| Public Administration | 14 (23.3%) | 46 (76.7%) |
| Total | 743 (55.4%) | 597 (44.6%) |
Education in Le Center
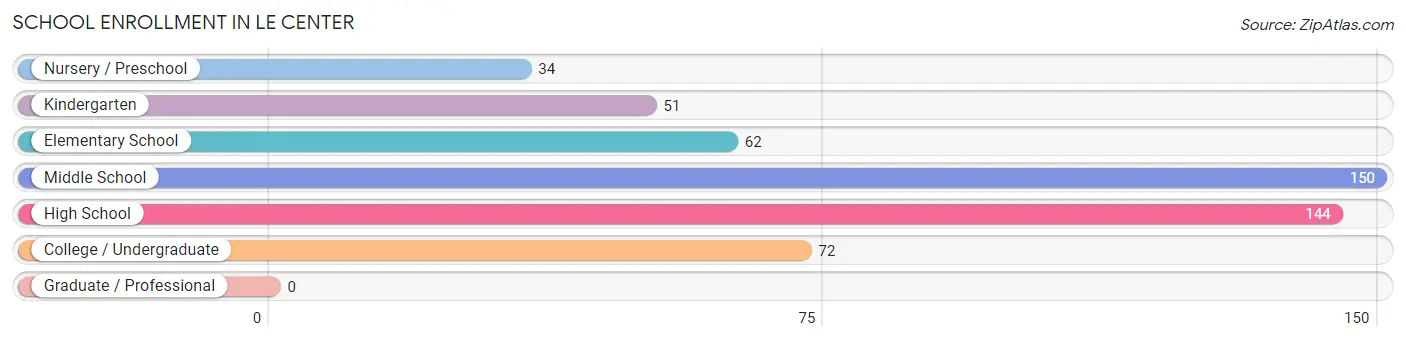
School Enrollment in Le Center
The most common levels of schooling among the 513 students in Le Center are middle school (150 | 29.2%), high school (144 | 28.1%), and college / undergraduate (72 | 14.0%).
| School Level | # Students | % Students |
| Nursery / Preschool | 34 | 6.6% |
| Kindergarten | 51 | 9.9% |
| Elementary School | 62 | 12.1% |
| Middle School | 150 | 29.2% |
| High School | 144 | 28.1% |
| College / Undergraduate | 72 | 14.0% |
| Graduate / Professional | 0 | 0.0% |
| Total | 513 | 100.0% |
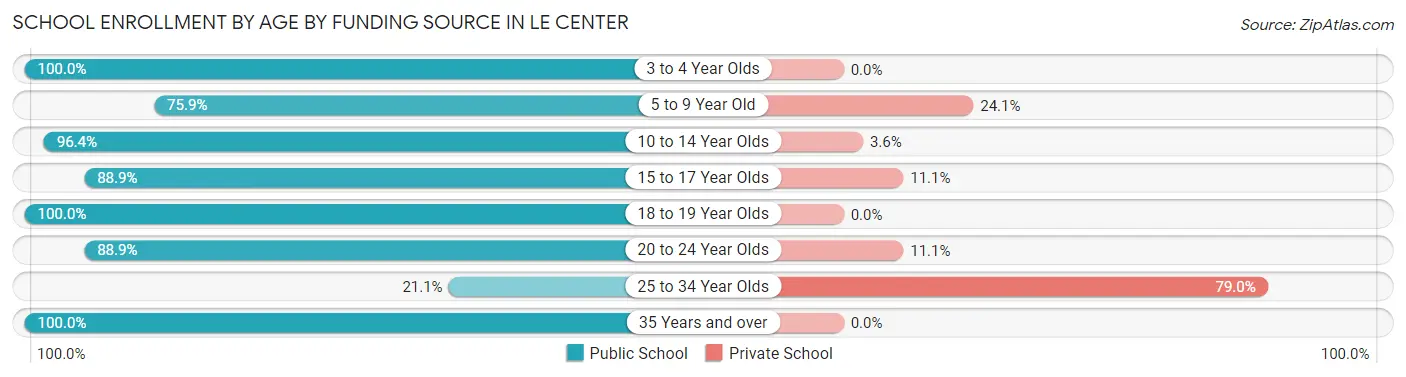
School Enrollment by Age by Funding Source in Le Center
Out of a total of 513 students who are enrolled in schools in Le Center, 78 (15.2%) attend a private institution, while the remaining 435 (84.8%) are enrolled in public schools. The age group of 25 to 34 year olds has the highest likelihood of being enrolled in private schools, with 30 (78.9% in the age bracket) enrolled. Conversely, the age group of 3 to 4 year olds has the lowest likelihood of being enrolled in a private school, with 12 (100.0% in the age bracket) attending a public institution.
| Age Bracket | Public School | Private School |
| 3 to 4 Year Olds | 12 (100.0%) | 0 (0.0%) |
| 5 to 9 Year Old | 88 (75.9%) | 28 (24.1%) |
| 10 to 14 Year Olds | 188 (96.4%) | 7 (3.6%) |
| 15 to 17 Year Olds | 48 (88.9%) | 6 (11.1%) |
| 18 to 19 Year Olds | 26 (100.0%) | 0 (0.0%) |
| 20 to 24 Year Olds | 56 (88.9%) | 7 (11.1%) |
| 25 to 34 Year Olds | 8 (21.0%) | 30 (78.9%) |
| 35 Years and over | 9 (100.0%) | 0 (0.0%) |
| Total | 435 (84.8%) | 78 (15.2%) |
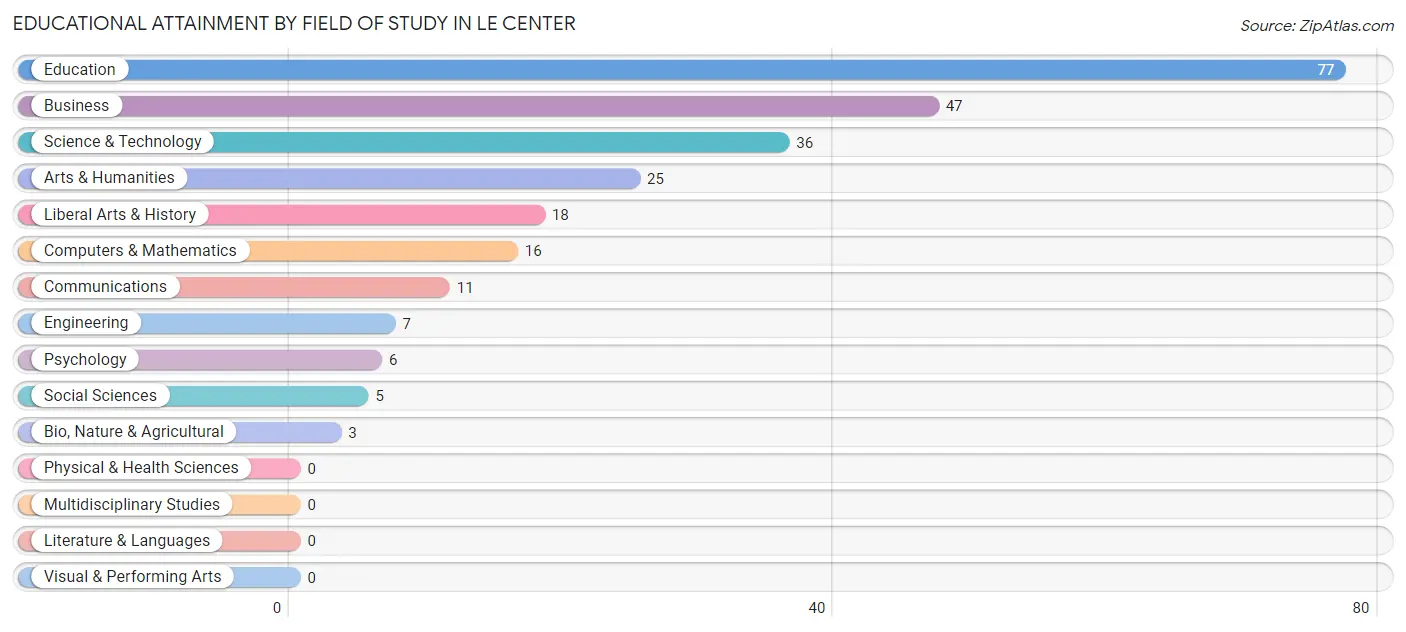
Educational Attainment by Field of Study in Le Center
Education (77 | 30.7%), business (47 | 18.7%), science & technology (36 | 14.3%), arts & humanities (25 | 10.0%), and liberal arts & history (18 | 7.2%) are the most common fields of study among 251 individuals in Le Center who have obtained a bachelor's degree or higher.
| Field of Study | # Graduates | % Graduates |
| Computers & Mathematics | 16 | 6.4% |
| Bio, Nature & Agricultural | 3 | 1.2% |
| Physical & Health Sciences | 0 | 0.0% |
| Psychology | 6 | 2.4% |
| Social Sciences | 5 | 2.0% |
| Engineering | 7 | 2.8% |
| Multidisciplinary Studies | 0 | 0.0% |
| Science & Technology | 36 | 14.3% |
| Business | 47 | 18.7% |
| Education | 77 | 30.7% |
| Literature & Languages | 0 | 0.0% |
| Liberal Arts & History | 18 | 7.2% |
| Visual & Performing Arts | 0 | 0.0% |
| Communications | 11 | 4.4% |
| Arts & Humanities | 25 | 10.0% |
| Total | 251 | 100.0% |
Transportation & Commute in Le Center
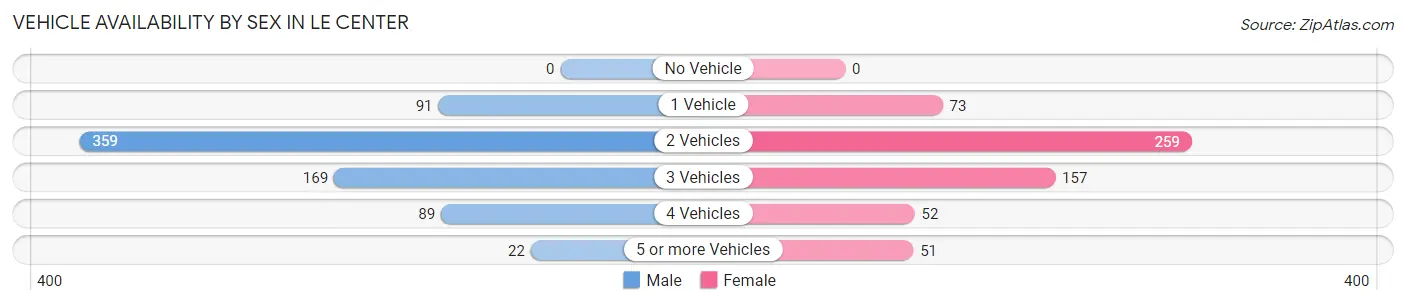
Vehicle Availability by Sex in Le Center
The most prevalent vehicle ownership categories in Le Center are males with 2 vehicles (359, accounting for 49.2%) and females with 2 vehicles (259, making up 60.6%).
| Vehicles Available | Male | Female |
| No Vehicle | 0 (0.0%) | 0 (0.0%) |
| 1 Vehicle | 91 (12.5%) | 73 (12.3%) |
| 2 Vehicles | 359 (49.2%) | 259 (43.8%) |
| 3 Vehicles | 169 (23.2%) | 157 (26.5%) |
| 4 Vehicles | 89 (12.2%) | 52 (8.8%) |
| 5 or more Vehicles | 22 (3.0%) | 51 (8.6%) |
| Total | 730 (100.0%) | 592 (100.0%) |
Commute Time in Le Center
The most frequently occuring commute durations in Le Center are 5 to 9 minutes (317 commuters, 25.0%), 20 to 24 minutes (169 commuters, 13.3%), and 15 to 19 minutes (149 commuters, 11.7%).
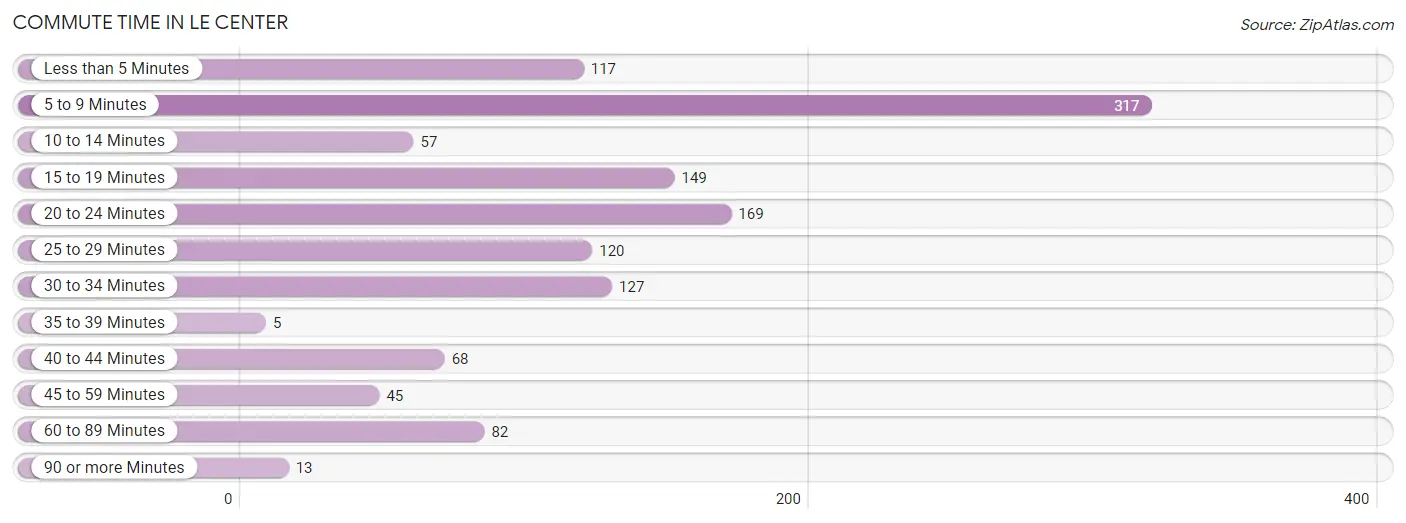
| Commute Time | # Commuters | % Commuters |
| Less than 5 Minutes | 117 | 9.2% |
| 5 to 9 Minutes | 317 | 25.0% |
| 10 to 14 Minutes | 57 | 4.5% |
| 15 to 19 Minutes | 149 | 11.7% |
| 20 to 24 Minutes | 169 | 13.3% |
| 25 to 29 Minutes | 120 | 9.5% |
| 30 to 34 Minutes | 127 | 10.0% |
| 35 to 39 Minutes | 5 | 0.4% |
| 40 to 44 Minutes | 68 | 5.4% |
| 45 to 59 Minutes | 45 | 3.5% |
| 60 to 89 Minutes | 82 | 6.5% |
| 90 or more Minutes | 13 | 1.0% |
Commute Time by Sex in Le Center
The most common commute times in Le Center are 5 to 9 minutes (208 commuters, 29.0%) for males and 5 to 9 minutes (109 commuters, 19.8%) for females.
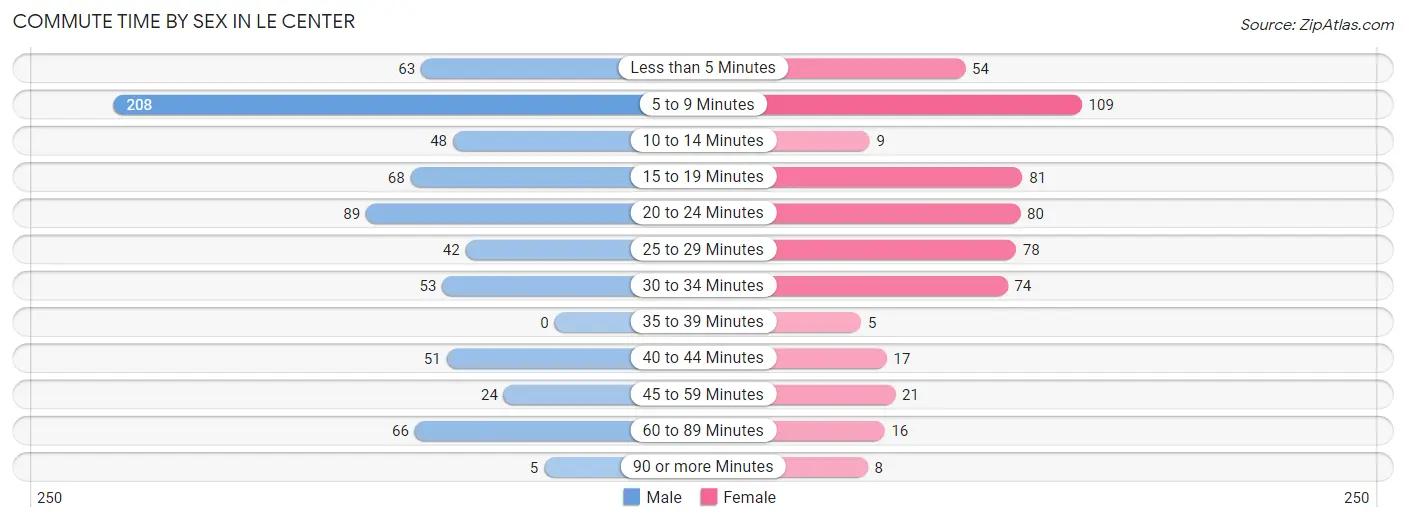
| Commute Time | Male | Female |
| Less than 5 Minutes | 63 (8.8%) | 54 (9.8%) |
| 5 to 9 Minutes | 208 (29.0%) | 109 (19.8%) |
| 10 to 14 Minutes | 48 (6.7%) | 9 (1.6%) |
| 15 to 19 Minutes | 68 (9.5%) | 81 (14.7%) |
| 20 to 24 Minutes | 89 (12.4%) | 80 (14.5%) |
| 25 to 29 Minutes | 42 (5.9%) | 78 (14.1%) |
| 30 to 34 Minutes | 53 (7.4%) | 74 (13.4%) |
| 35 to 39 Minutes | 0 (0.0%) | 5 (0.9%) |
| 40 to 44 Minutes | 51 (7.1%) | 17 (3.1%) |
| 45 to 59 Minutes | 24 (3.4%) | 21 (3.8%) |
| 60 to 89 Minutes | 66 (9.2%) | 16 (2.9%) |
| 90 or more Minutes | 5 (0.7%) | 8 (1.5%) |
Time of Departure to Work by Sex in Le Center
The most frequent times of departure to work in Le Center are 5:30 AM to 5:59 AM (137, 19.1%) for males and 7:30 AM to 7:59 AM (151, 27.4%) for females.
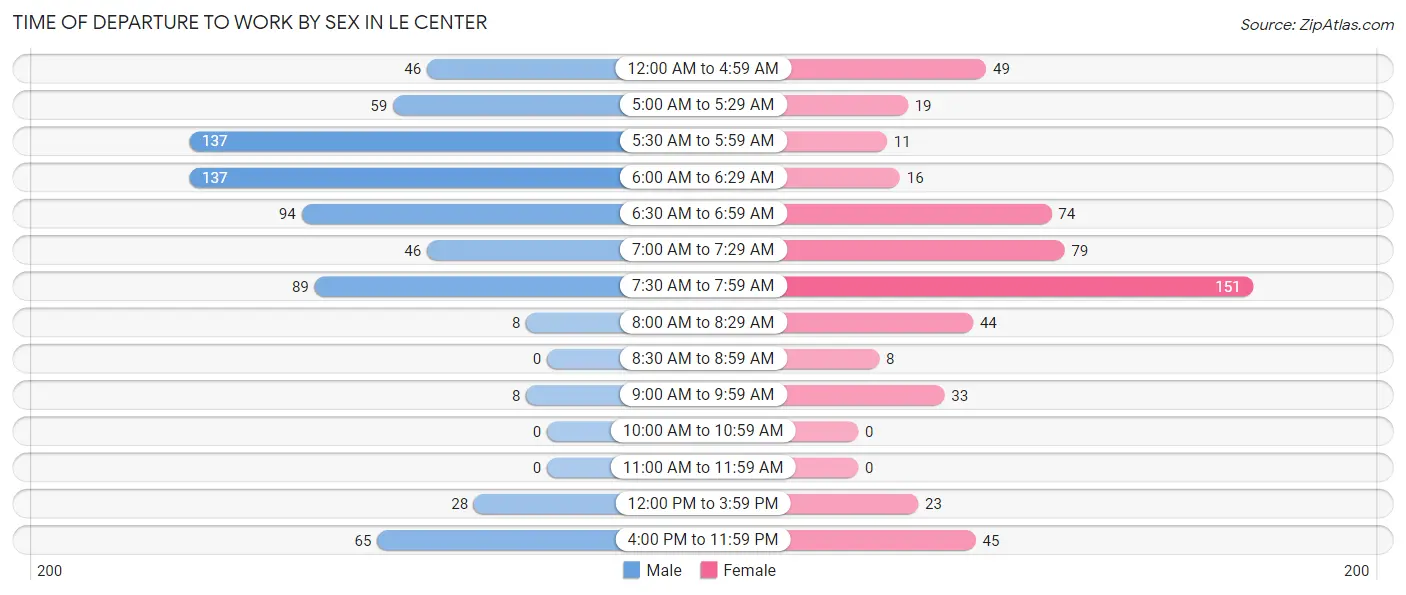
| Time of Departure | Male | Female |
| 12:00 AM to 4:59 AM | 46 (6.4%) | 49 (8.9%) |
| 5:00 AM to 5:29 AM | 59 (8.2%) | 19 (3.4%) |
| 5:30 AM to 5:59 AM | 137 (19.1%) | 11 (2.0%) |
| 6:00 AM to 6:29 AM | 137 (19.1%) | 16 (2.9%) |
| 6:30 AM to 6:59 AM | 94 (13.1%) | 74 (13.4%) |
| 7:00 AM to 7:29 AM | 46 (6.4%) | 79 (14.3%) |
| 7:30 AM to 7:59 AM | 89 (12.4%) | 151 (27.4%) |
| 8:00 AM to 8:29 AM | 8 (1.1%) | 44 (8.0%) |
| 8:30 AM to 8:59 AM | 0 (0.0%) | 8 (1.5%) |
| 9:00 AM to 9:59 AM | 8 (1.1%) | 33 (6.0%) |
| 10:00 AM to 10:59 AM | 0 (0.0%) | 0 (0.0%) |
| 11:00 AM to 11:59 AM | 0 (0.0%) | 0 (0.0%) |
| 12:00 PM to 3:59 PM | 28 (3.9%) | 23 (4.2%) |
| 4:00 PM to 11:59 PM | 65 (9.1%) | 45 (8.2%) |
| Total | 717 (100.0%) | 552 (100.0%) |
Housing Occupancy in Le Center
Occupancy by Ownership in Le Center
Of the total 975 dwellings in Le Center, owner-occupied units account for 707 (72.5%), while renter-occupied units make up 268 (27.5%).
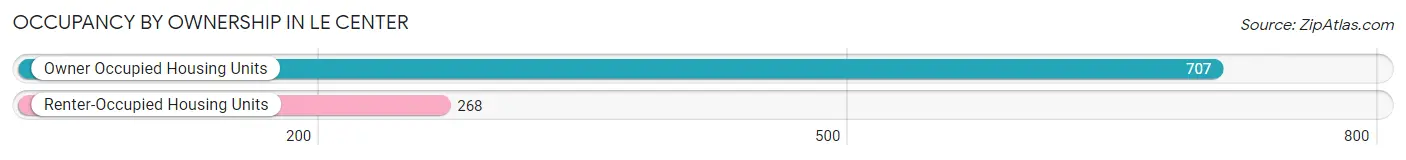
| Occupancy | # Housing Units | % Housing Units |
| Owner Occupied Housing Units | 707 | 72.5% |
| Renter-Occupied Housing Units | 268 | 27.5% |
| Total Occupied Housing Units | 975 | 100.0% |
Occupancy by Household Size in Le Center
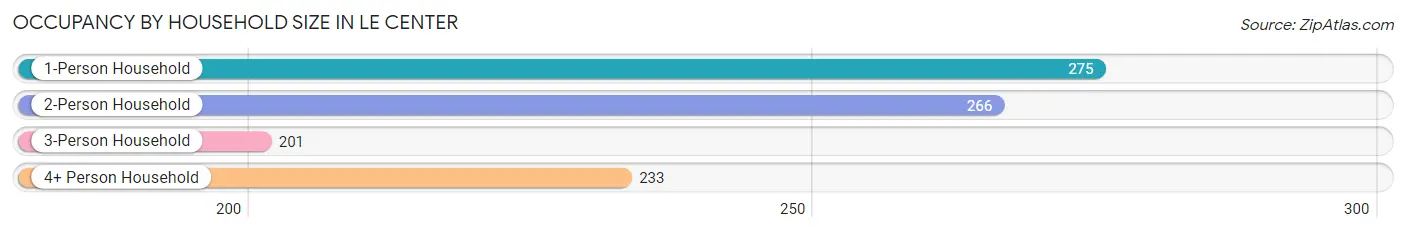
| Household Size | # Housing Units | % Housing Units |
| 1-Person Household | 275 | 28.2% |
| 2-Person Household | 266 | 27.3% |
| 3-Person Household | 201 | 20.6% |
| 4+ Person Household | 233 | 23.9% |
| Total Housing Units | 975 | 100.0% |
Occupancy by Ownership by Household Size in Le Center
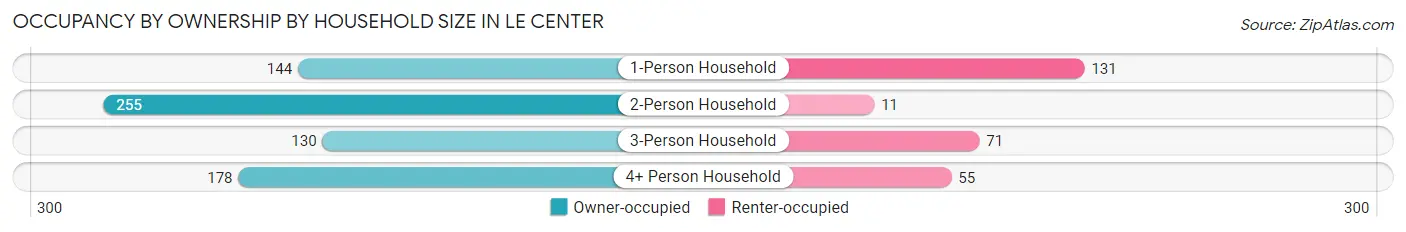
| Household Size | Owner-occupied | Renter-occupied |
| 1-Person Household | 144 (52.4%) | 131 (47.6%) |
| 2-Person Household | 255 (95.9%) | 11 (4.1%) |
| 3-Person Household | 130 (64.7%) | 71 (35.3%) |
| 4+ Person Household | 178 (76.4%) | 55 (23.6%) |
| Total Housing Units | 707 (72.5%) | 268 (27.5%) |
Occupancy by Educational Attainment in Le Center
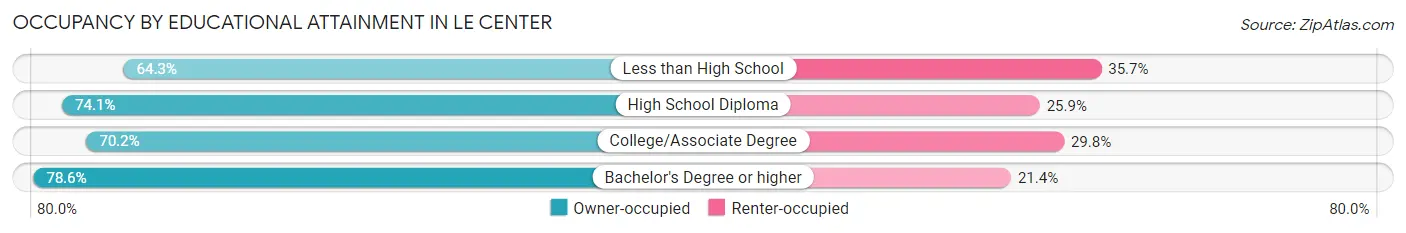
| Household Size | Owner-occupied | Renter-occupied |
| Less than High School | 45 (64.3%) | 25 (35.7%) |
| High School Diploma | 277 (74.1%) | 97 (25.9%) |
| College/Associate Degree | 271 (70.2%) | 115 (29.8%) |
| Bachelor's Degree or higher | 114 (78.6%) | 31 (21.4%) |
Occupancy by Age of Householder in Le Center
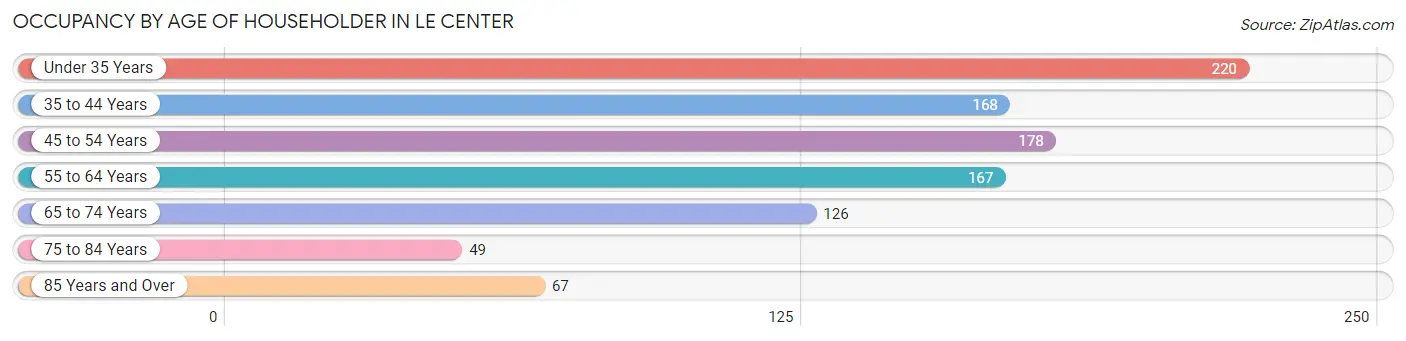
| Age Bracket | # Households | % Households |
| Under 35 Years | 220 | 22.6% |
| 35 to 44 Years | 168 | 17.2% |
| 45 to 54 Years | 178 | 18.3% |
| 55 to 64 Years | 167 | 17.1% |
| 65 to 74 Years | 126 | 12.9% |
| 75 to 84 Years | 49 | 5.0% |
| 85 Years and Over | 67 | 6.9% |
| Total | 975 | 100.0% |
Housing Finances in Le Center
Median Income by Occupancy in Le Center
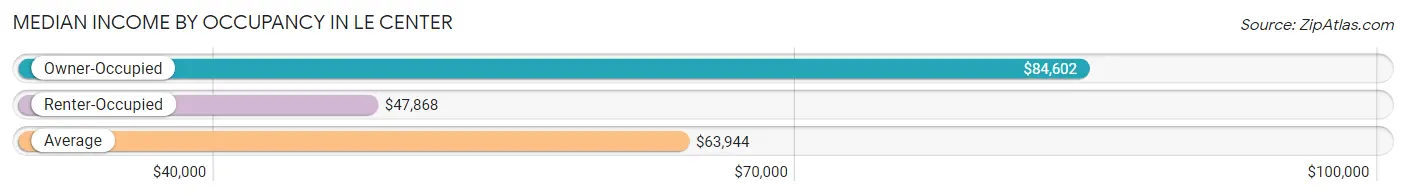
| Occupancy Type | # Households | Median Income |
| Owner-Occupied | 707 (72.5%) | $84,602 |
| Renter-Occupied | 268 (27.5%) | $47,868 |
| Average | 975 (100.0%) | $63,944 |
Occupancy by Householder Income Bracket in Le Center
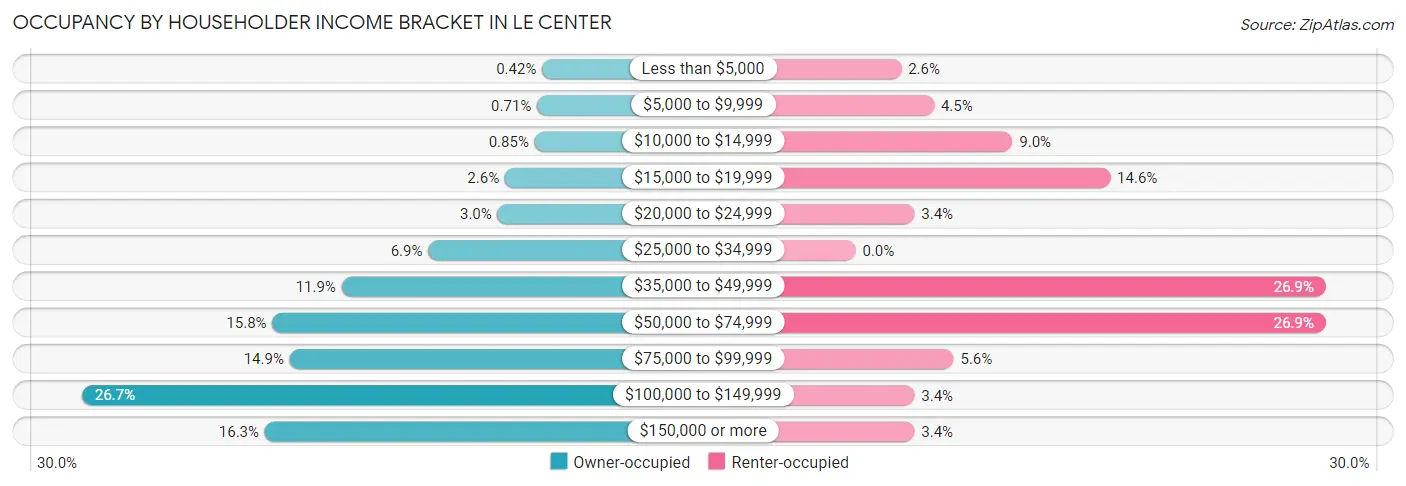
| Income Bracket | Owner-occupied | Renter-occupied |
| Less than $5,000 | 3 (0.4%) | 7 (2.6%) |
| $5,000 to $9,999 | 5 (0.7%) | 12 (4.5%) |
| $10,000 to $14,999 | 6 (0.9%) | 24 (9.0%) |
| $15,000 to $19,999 | 18 (2.5%) | 39 (14.5%) |
| $20,000 to $24,999 | 21 (3.0%) | 9 (3.4%) |
| $25,000 to $34,999 | 49 (6.9%) | 0 (0.0%) |
| $35,000 to $49,999 | 84 (11.9%) | 72 (26.9%) |
| $50,000 to $74,999 | 112 (15.8%) | 72 (26.9%) |
| $75,000 to $99,999 | 105 (14.8%) | 15 (5.6%) |
| $100,000 to $149,999 | 189 (26.7%) | 9 (3.4%) |
| $150,000 or more | 115 (16.3%) | 9 (3.4%) |
| Total | 707 (100.0%) | 268 (100.0%) |
Monthly Housing Cost Tiers in Le Center
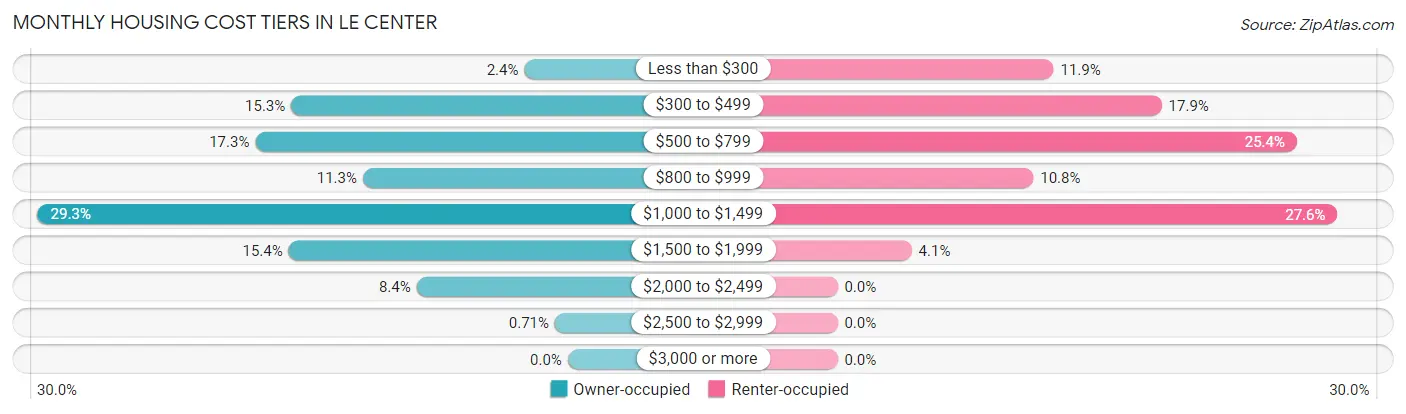
| Monthly Cost | Owner-occupied | Renter-occupied |
| Less than $300 | 17 (2.4%) | 32 (11.9%) |
| $300 to $499 | 108 (15.3%) | 48 (17.9%) |
| $500 to $799 | 122 (17.3%) | 68 (25.4%) |
| $800 to $999 | 80 (11.3%) | 29 (10.8%) |
| $1,000 to $1,499 | 207 (29.3%) | 74 (27.6%) |
| $1,500 to $1,999 | 109 (15.4%) | 11 (4.1%) |
| $2,000 to $2,499 | 59 (8.4%) | 0 (0.0%) |
| $2,500 to $2,999 | 5 (0.7%) | 0 (0.0%) |
| $3,000 or more | 0 (0.0%) | 0 (0.0%) |
| Total | 707 (100.0%) | 268 (100.0%) |
Physical Housing Characteristics in Le Center
Housing Structures in Le Center
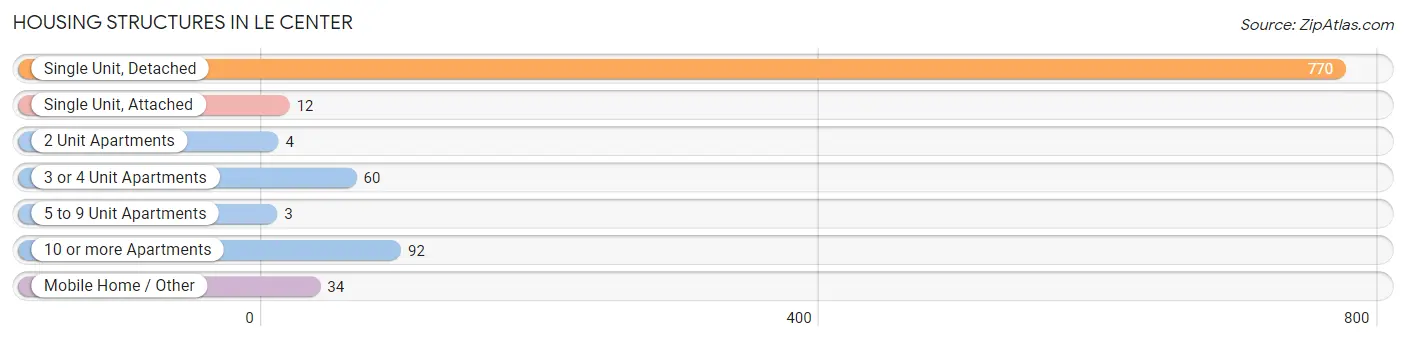
| Structure Type | # Housing Units | % Housing Units |
| Single Unit, Detached | 770 | 79.0% |
| Single Unit, Attached | 12 | 1.2% |
| 2 Unit Apartments | 4 | 0.4% |
| 3 or 4 Unit Apartments | 60 | 6.1% |
| 5 to 9 Unit Apartments | 3 | 0.3% |
| 10 or more Apartments | 92 | 9.4% |
| Mobile Home / Other | 34 | 3.5% |
| Total | 975 | 100.0% |
Housing Structures by Occupancy in Le Center
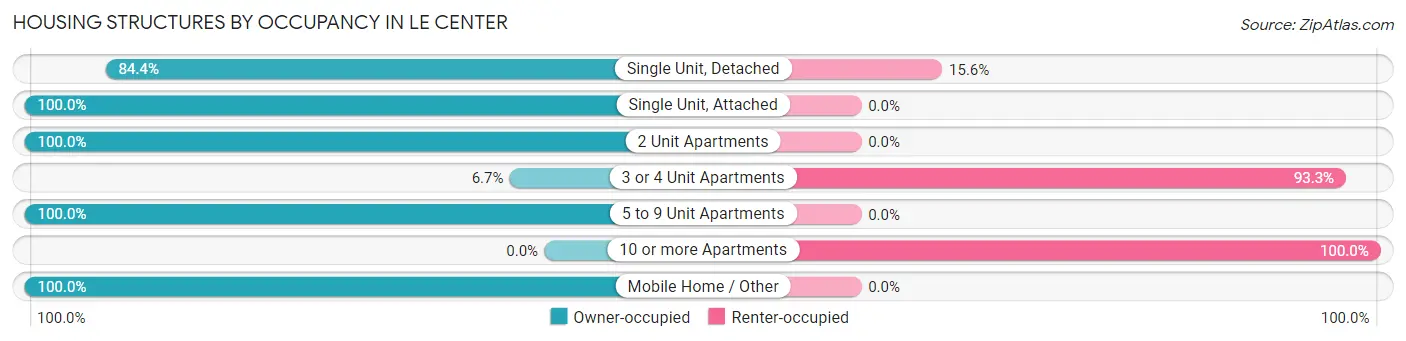
| Structure Type | Owner-occupied | Renter-occupied |
| Single Unit, Detached | 650 (84.4%) | 120 (15.6%) |
| Single Unit, Attached | 12 (100.0%) | 0 (0.0%) |
| 2 Unit Apartments | 4 (100.0%) | 0 (0.0%) |
| 3 or 4 Unit Apartments | 4 (6.7%) | 56 (93.3%) |
| 5 to 9 Unit Apartments | 3 (100.0%) | 0 (0.0%) |
| 10 or more Apartments | 0 (0.0%) | 92 (100.0%) |
| Mobile Home / Other | 34 (100.0%) | 0 (0.0%) |
| Total | 707 (72.5%) | 268 (27.5%) |
Housing Structures by Number of Rooms in Le Center
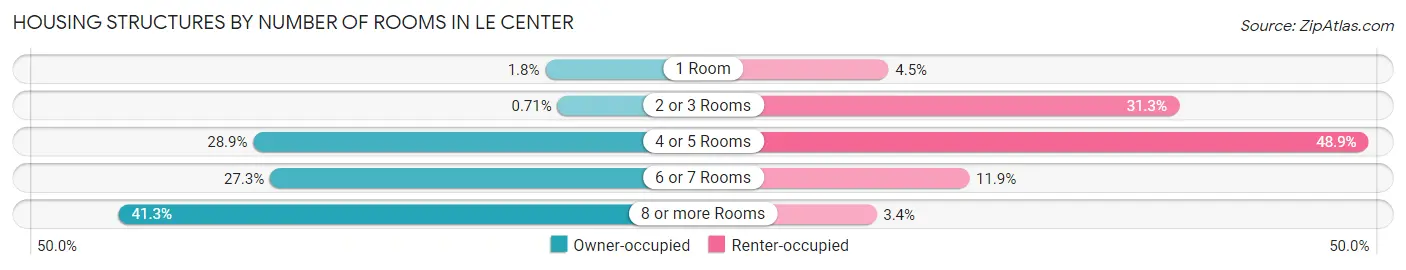
| Number of Rooms | Owner-occupied | Renter-occupied |
| 1 Room | 13 (1.8%) | 12 (4.5%) |
| 2 or 3 Rooms | 5 (0.7%) | 84 (31.3%) |
| 4 or 5 Rooms | 204 (28.8%) | 131 (48.9%) |
| 6 or 7 Rooms | 193 (27.3%) | 32 (11.9%) |
| 8 or more Rooms | 292 (41.3%) | 9 (3.4%) |
| Total | 707 (100.0%) | 268 (100.0%) |
Housing Structure by Heating Type in Le Center
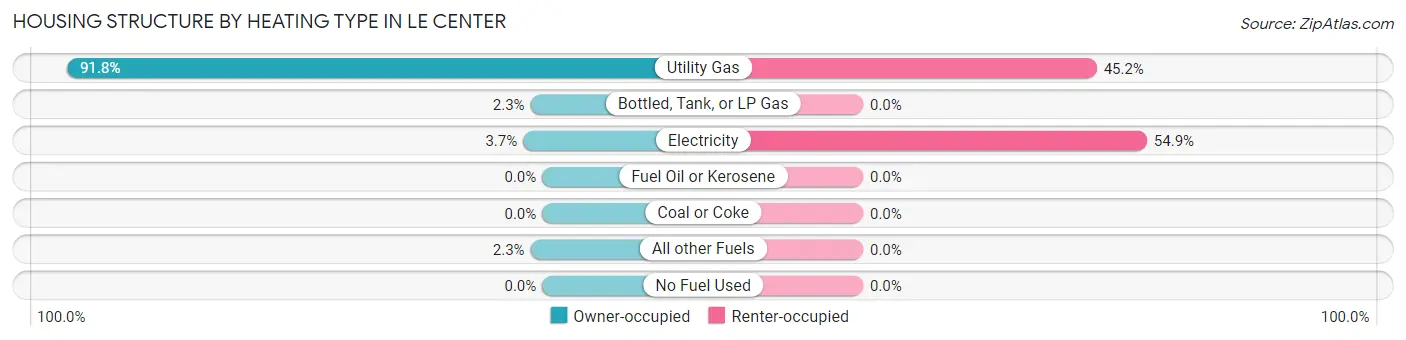
| Heating Type | Owner-occupied | Renter-occupied |
| Utility Gas | 649 (91.8%) | 121 (45.2%) |
| Bottled, Tank, or LP Gas | 16 (2.3%) | 0 (0.0%) |
| Electricity | 26 (3.7%) | 147 (54.8%) |
| Fuel Oil or Kerosene | 0 (0.0%) | 0 (0.0%) |
| Coal or Coke | 0 (0.0%) | 0 (0.0%) |
| All other Fuels | 16 (2.3%) | 0 (0.0%) |
| No Fuel Used | 0 (0.0%) | 0 (0.0%) |
| Total | 707 (100.0%) | 268 (100.0%) |
Household Vehicle Usage in Le Center
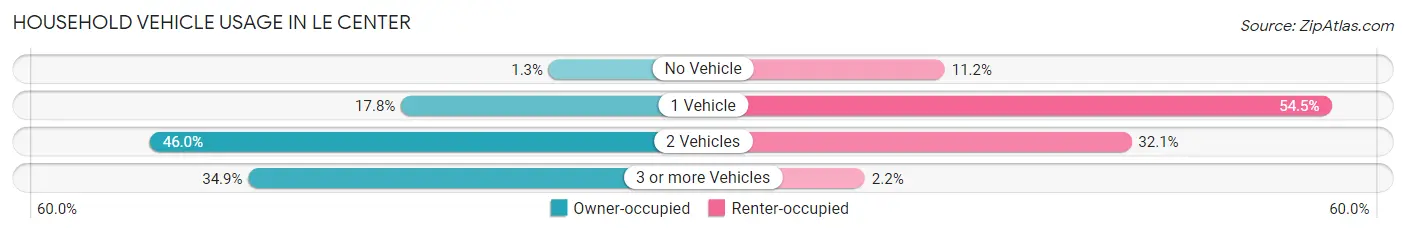
| Vehicles per Household | Owner-occupied | Renter-occupied |
| No Vehicle | 9 (1.3%) | 30 (11.2%) |
| 1 Vehicle | 126 (17.8%) | 146 (54.5%) |
| 2 Vehicles | 325 (46.0%) | 86 (32.1%) |
| 3 or more Vehicles | 247 (34.9%) | 6 (2.2%) |
| Total | 707 (100.0%) | 268 (100.0%) |
Real Estate & Mortgages in Le Center
Real Estate and Mortgage Overview in Le Center
| Characteristic | Without Mortgage | With Mortgage |
| Housing Units | 253 | 454 |
| Median Property Value | $157,400 | $181,000 |
| Median Household Income | $51,938 | $80 |
| Monthly Housing Costs | $502 | $0 |
| Real Estate Taxes | $2,019 | $0 |
Property Value by Mortgage Status in Le Center
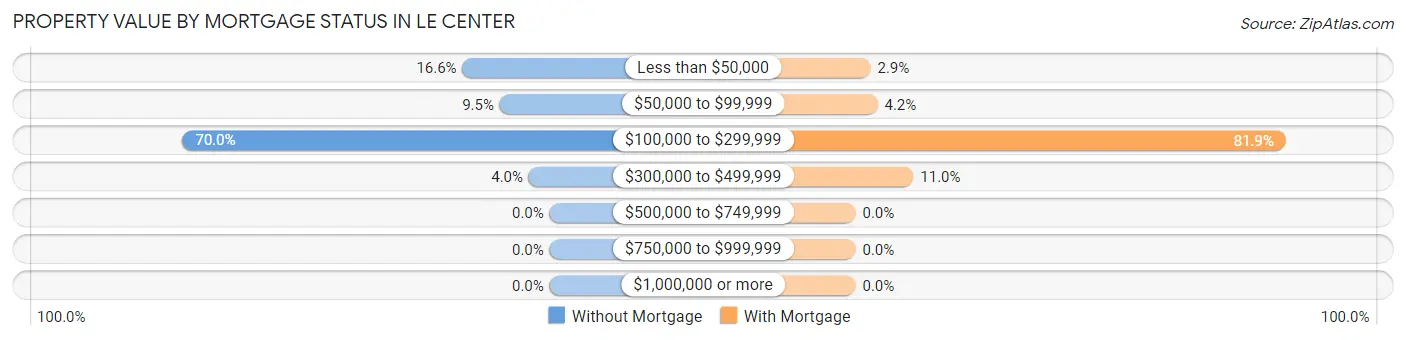
| Property Value | Without Mortgage | With Mortgage |
| Less than $50,000 | 42 (16.6%) | 13 (2.9%) |
| $50,000 to $99,999 | 24 (9.5%) | 19 (4.2%) |
| $100,000 to $299,999 | 177 (70.0%) | 372 (81.9%) |
| $300,000 to $499,999 | 10 (4.0%) | 50 (11.0%) |
| $500,000 to $749,999 | 0 (0.0%) | 0 (0.0%) |
| $750,000 to $999,999 | 0 (0.0%) | 0 (0.0%) |
| $1,000,000 or more | 0 (0.0%) | 0 (0.0%) |
| Total | 253 (100.0%) | 454 (100.0%) |
Household Income by Mortgage Status in Le Center
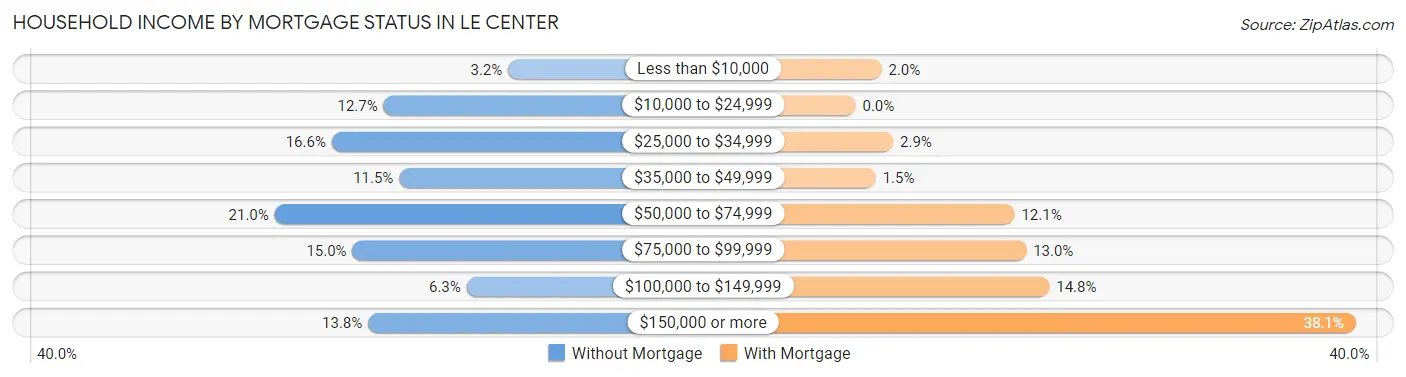
| Household Income | Without Mortgage | With Mortgage |
| Less than $10,000 | 8 (3.2%) | 9 (2.0%) |
| $10,000 to $24,999 | 32 (12.7%) | 0 (0.0%) |
| $25,000 to $34,999 | 42 (16.6%) | 13 (2.9%) |
| $35,000 to $49,999 | 29 (11.5%) | 7 (1.5%) |
| $50,000 to $74,999 | 53 (20.9%) | 55 (12.1%) |
| $75,000 to $99,999 | 38 (15.0%) | 59 (13.0%) |
| $100,000 to $149,999 | 16 (6.3%) | 67 (14.8%) |
| $150,000 or more | 35 (13.8%) | 173 (38.1%) |
| Total | 253 (100.0%) | 454 (100.0%) |
Property Value to Household Income Ratio in Le Center
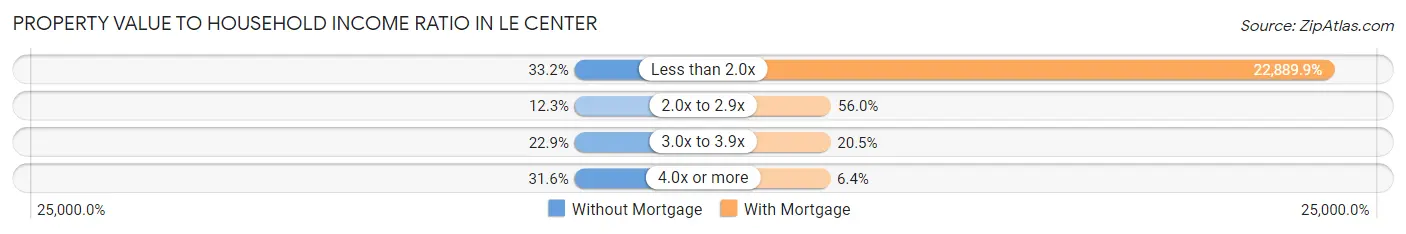
| Value-to-Income Ratio | Without Mortgage | With Mortgage |
| Less than 2.0x | 84 (33.2%) | 103,920 (22,889.9%) |
| 2.0x to 2.9x | 31 (12.2%) | 254 (55.9%) |
| 3.0x to 3.9x | 58 (22.9%) | 93 (20.5%) |
| 4.0x or more | 80 (31.6%) | 29 (6.4%) |
| Total | 253 (100.0%) | 454 (100.0%) |
Real Estate Taxes by Mortgage Status in Le Center
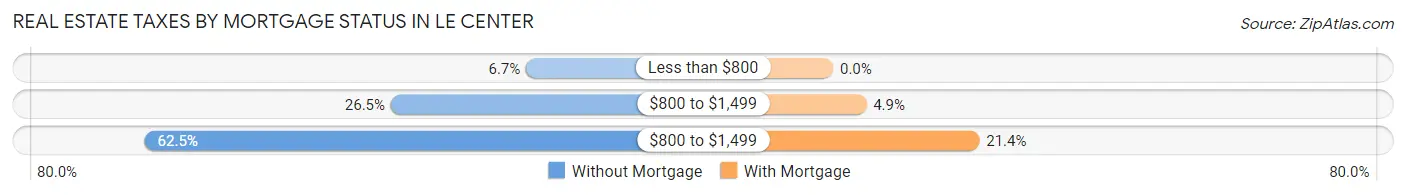
| Property Taxes | Without Mortgage | With Mortgage |
| Less than $800 | 17 (6.7%) | 0 (0.0%) |
| $800 to $1,499 | 67 (26.5%) | 22 (4.9%) |
| $800 to $1,499 | 158 (62.5%) | 97 (21.4%) |
| Total | 253 (100.0%) | 454 (100.0%) |
Health & Disability in Le Center
Health Insurance Coverage by Age in Le Center
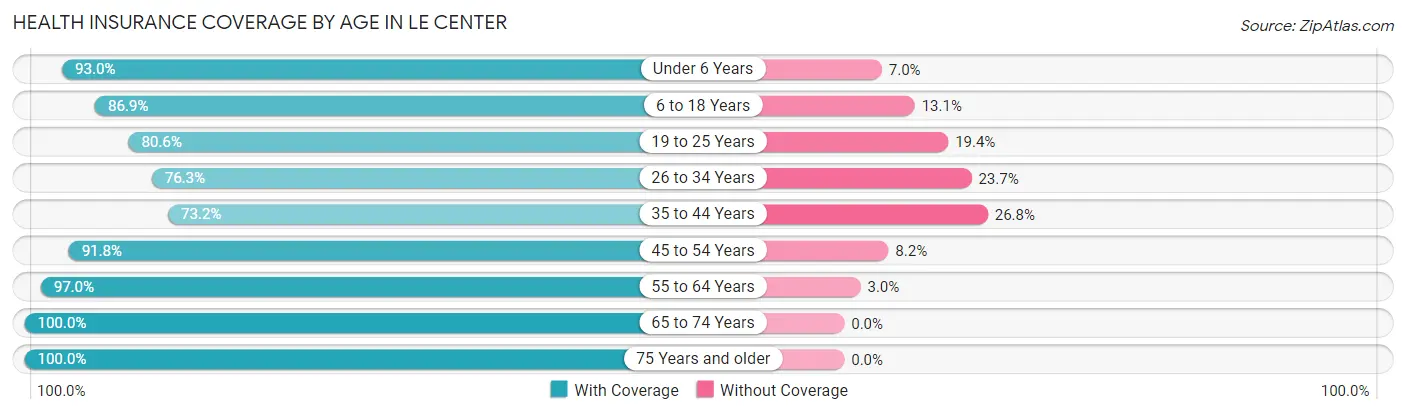
| Age Bracket | With Coverage | Without Coverage |
| Under 6 Years | 146 (93.0%) | 11 (7.0%) |
| 6 to 18 Years | 324 (86.9%) | 49 (13.1%) |
| 19 to 25 Years | 262 (80.6%) | 63 (19.4%) |
| 26 to 34 Years | 238 (76.3%) | 74 (23.7%) |
| 35 to 44 Years | 249 (73.2%) | 91 (26.8%) |
| 45 to 54 Years | 301 (91.8%) | 27 (8.2%) |
| 55 to 64 Years | 288 (97.0%) | 9 (3.0%) |
| 65 to 74 Years | 174 (100.0%) | 0 (0.0%) |
| 75 Years and older | 147 (100.0%) | 0 (0.0%) |
| Total | 2,129 (86.8%) | 324 (13.2%) |
Health Insurance Coverage by Citizenship Status in Le Center
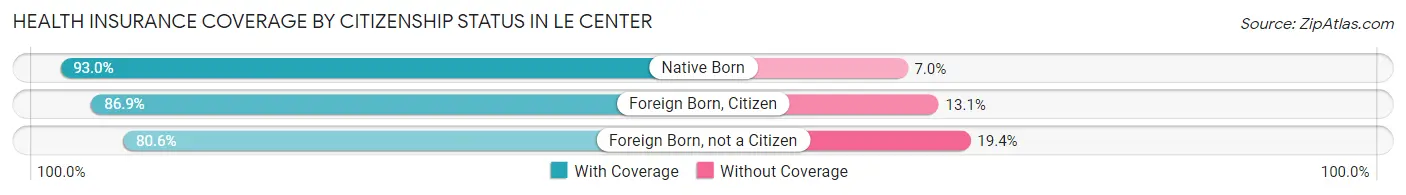
| Citizenship Status | With Coverage | Without Coverage |
| Native Born | 146 (93.0%) | 11 (7.0%) |
| Foreign Born, Citizen | 324 (86.9%) | 49 (13.1%) |
| Foreign Born, not a Citizen | 262 (80.6%) | 63 (19.4%) |
Health Insurance Coverage by Household Income in Le Center
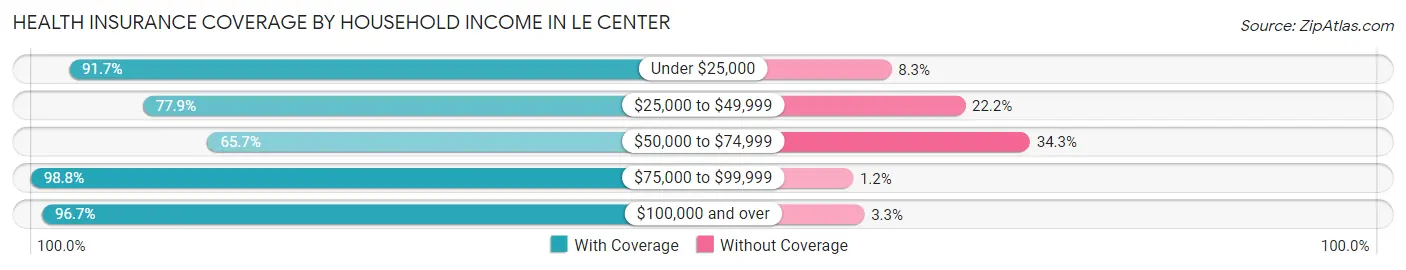
| Household Income | With Coverage | Without Coverage |
| Under $25,000 | 198 (91.7%) | 18 (8.3%) |
| $25,000 to $49,999 | 362 (77.8%) | 103 (22.2%) |
| $50,000 to $74,999 | 324 (65.7%) | 169 (34.3%) |
| $75,000 to $99,999 | 341 (98.8%) | 4 (1.2%) |
| $100,000 and over | 888 (96.7%) | 30 (3.3%) |
Public vs Private Health Insurance Coverage by Age in Le Center
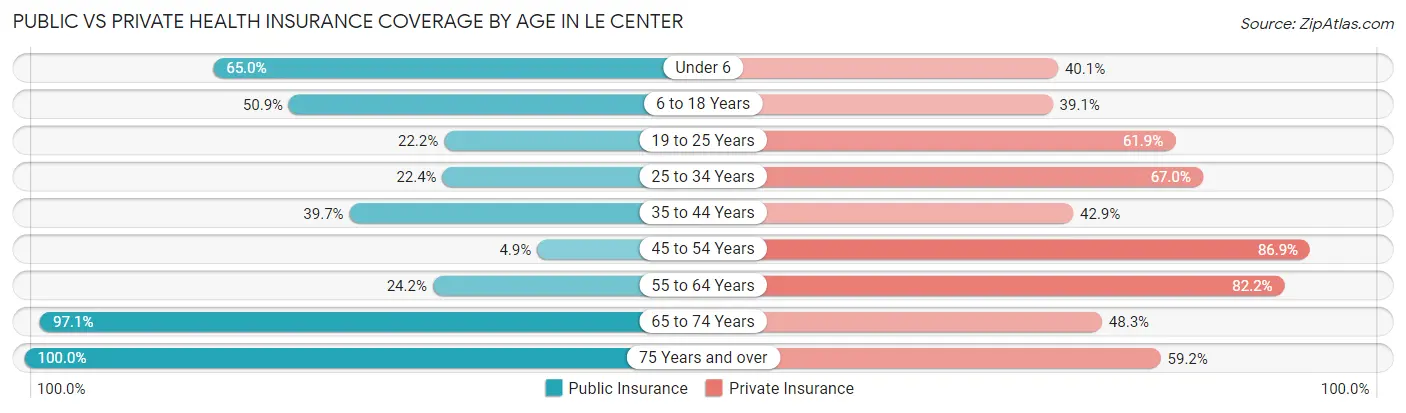
| Age Bracket | Public Insurance | Private Insurance |
| Under 6 | 102 (65.0%) | 63 (40.1%) |
| 6 to 18 Years | 190 (50.9%) | 146 (39.1%) |
| 19 to 25 Years | 72 (22.2%) | 201 (61.9%) |
| 25 to 34 Years | 70 (22.4%) | 209 (67.0%) |
| 35 to 44 Years | 135 (39.7%) | 146 (42.9%) |
| 45 to 54 Years | 16 (4.9%) | 285 (86.9%) |
| 55 to 64 Years | 72 (24.2%) | 244 (82.2%) |
| 65 to 74 Years | 169 (97.1%) | 84 (48.3%) |
| 75 Years and over | 147 (100.0%) | 87 (59.2%) |
| Total | 973 (39.7%) | 1,465 (59.7%) |
Disability Status by Sex by Age in Le Center
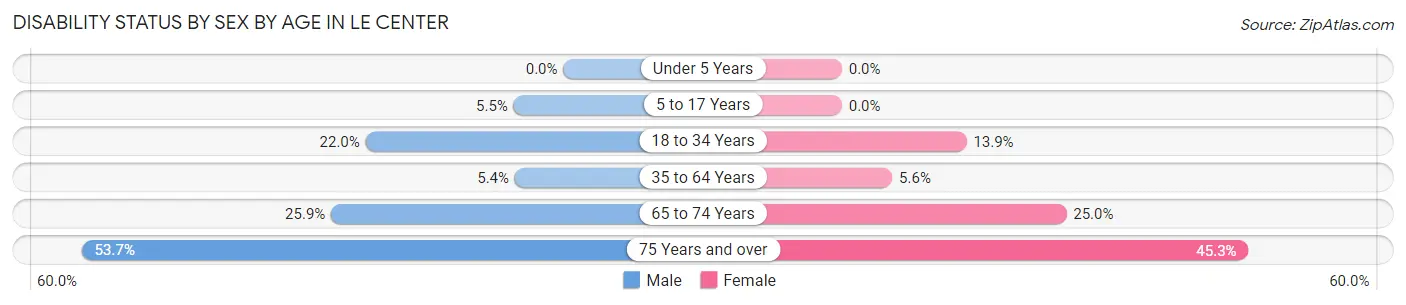
| Age Bracket | Male | Female |
| Under 5 Years | 0 (0.0%) | 0 (0.0%) |
| 5 to 17 Years | 11 (5.5%) | 0 (0.0%) |
| 18 to 34 Years | 74 (22.0%) | 44 (13.9%) |
| 35 to 64 Years | 29 (5.4%) | 24 (5.6%) |
| 65 to 74 Years | 15 (25.9%) | 29 (25.0%) |
| 75 Years and over | 22 (53.7%) | 48 (45.3%) |
Disability Class by Sex by Age in Le Center
Disability Class: Hearing Difficulty
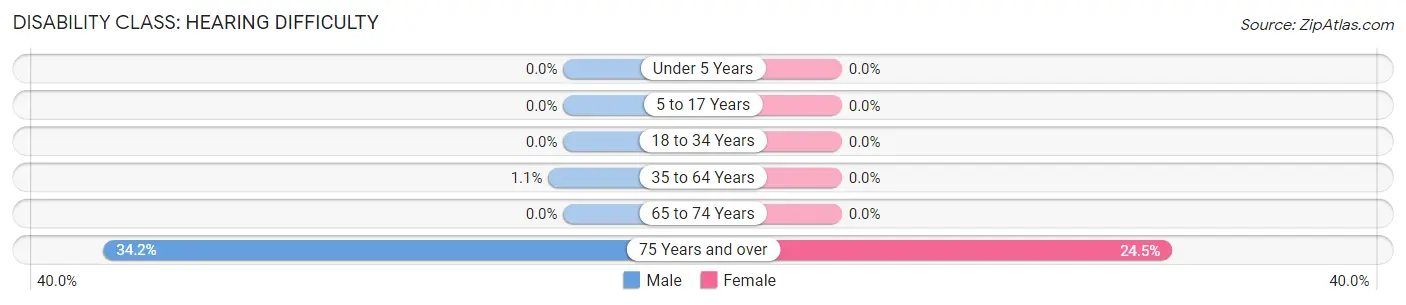
| Age Bracket | Male | Female |
| Under 5 Years | 0 (0.0%) | 0 (0.0%) |
| 5 to 17 Years | 0 (0.0%) | 0 (0.0%) |
| 18 to 34 Years | 0 (0.0%) | 0 (0.0%) |
| 35 to 64 Years | 6 (1.1%) | 0 (0.0%) |
| 65 to 74 Years | 0 (0.0%) | 0 (0.0%) |
| 75 Years and over | 14 (34.2%) | 26 (24.5%) |
Disability Class: Vision Difficulty
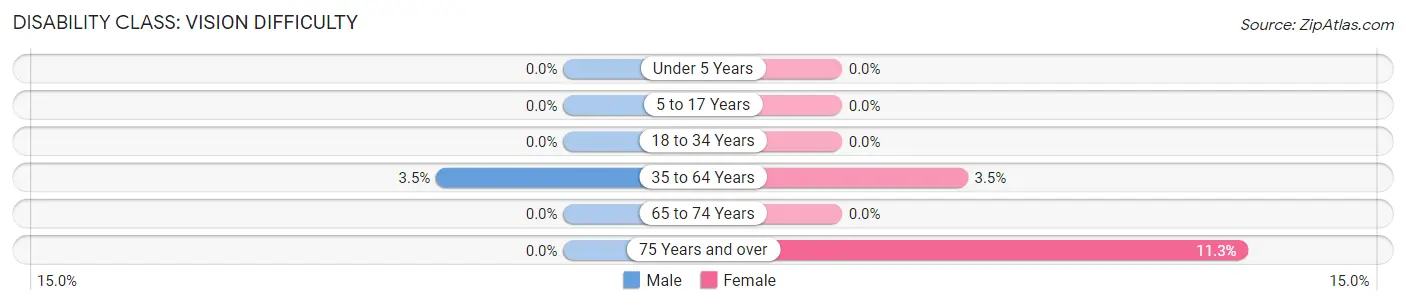
| Age Bracket | Male | Female |
| Under 5 Years | 0 (0.0%) | 0 (0.0%) |
| 5 to 17 Years | 0 (0.0%) | 0 (0.0%) |
| 18 to 34 Years | 0 (0.0%) | 0 (0.0%) |
| 35 to 64 Years | 19 (3.5%) | 15 (3.5%) |
| 65 to 74 Years | 0 (0.0%) | 0 (0.0%) |
| 75 Years and over | 0 (0.0%) | 12 (11.3%) |
Disability Class: Cognitive Difficulty
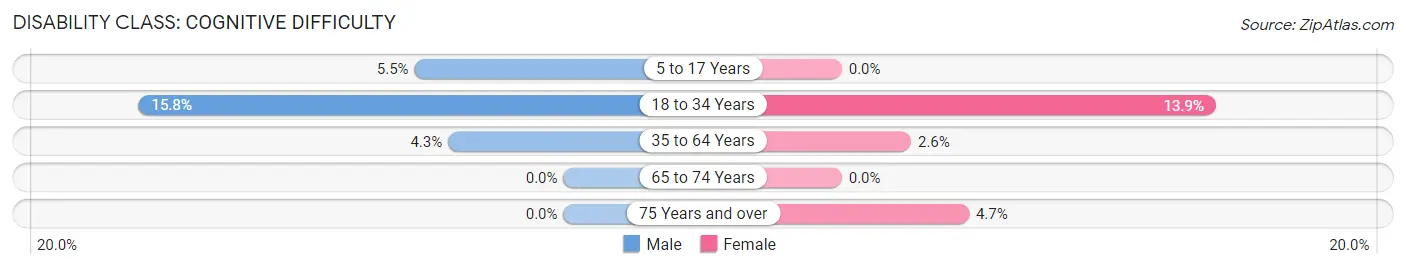
| Age Bracket | Male | Female |
| 5 to 17 Years | 11 (5.5%) | 0 (0.0%) |
| 18 to 34 Years | 53 (15.8%) | 44 (13.9%) |
| 35 to 64 Years | 23 (4.3%) | 11 (2.6%) |
| 65 to 74 Years | 0 (0.0%) | 0 (0.0%) |
| 75 Years and over | 0 (0.0%) | 5 (4.7%) |
Disability Class: Ambulatory Difficulty
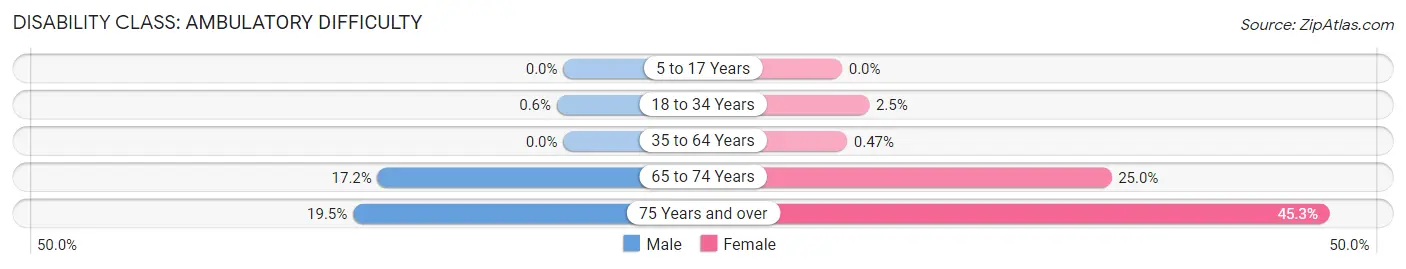
| Age Bracket | Male | Female |
| 5 to 17 Years | 0 (0.0%) | 0 (0.0%) |
| 18 to 34 Years | 2 (0.6%) | 8 (2.5%) |
| 35 to 64 Years | 0 (0.0%) | 2 (0.5%) |
| 65 to 74 Years | 10 (17.2%) | 29 (25.0%) |
| 75 Years and over | 8 (19.5%) | 48 (45.3%) |
Disability Class: Self-Care Difficulty
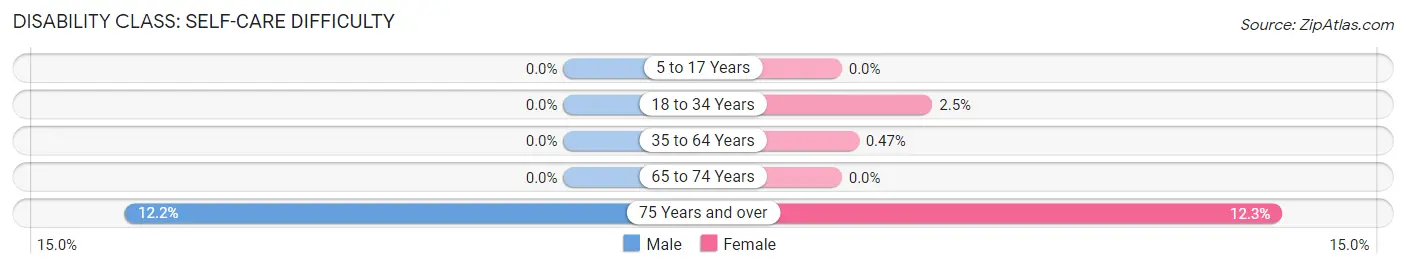
| Age Bracket | Male | Female |
| 5 to 17 Years | 0 (0.0%) | 0 (0.0%) |
| 18 to 34 Years | 0 (0.0%) | 8 (2.5%) |
| 35 to 64 Years | 0 (0.0%) | 2 (0.5%) |
| 65 to 74 Years | 0 (0.0%) | 0 (0.0%) |
| 75 Years and over | 5 (12.2%) | 13 (12.3%) |
Technology Access in Le Center
Computing Device Access in Le Center
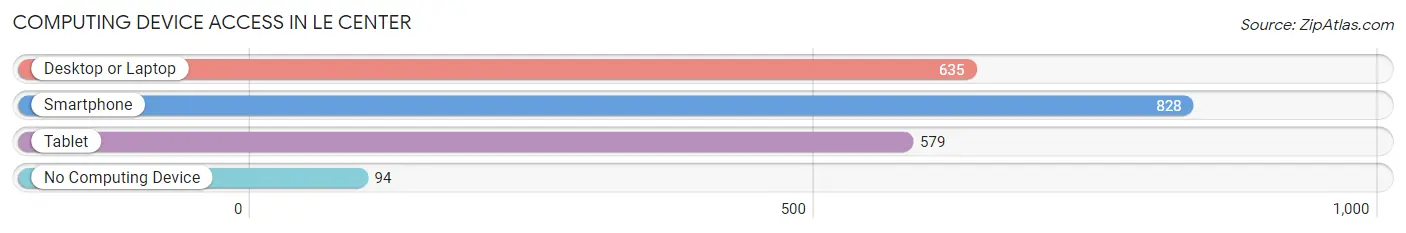
| Device Type | # Households | % Households |
| Desktop or Laptop | 635 | 65.1% |
| Smartphone | 828 | 84.9% |
| Tablet | 579 | 59.4% |
| No Computing Device | 94 | 9.6% |
| Total | 975 | 100.0% |
Internet Access in Le Center
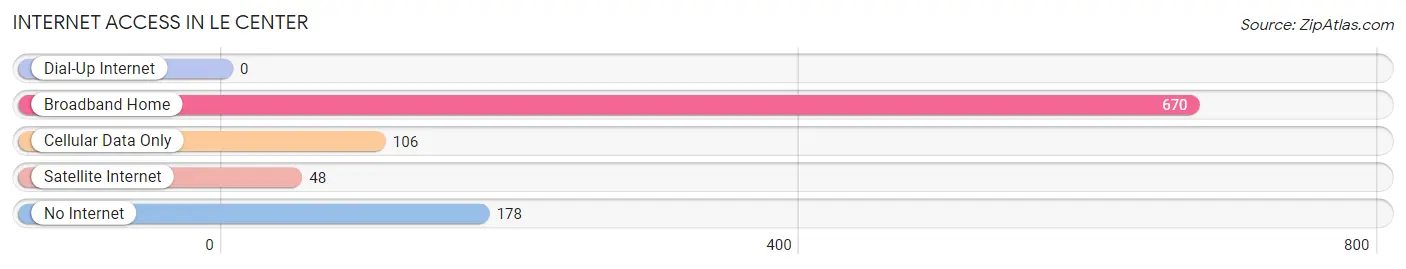
| Internet Type | # Households | % Households |
| Dial-Up Internet | 0 | 0.0% |
| Broadband Home | 670 | 68.7% |
| Cellular Data Only | 106 | 10.9% |
| Satellite Internet | 48 | 4.9% |
| No Internet | 178 | 18.3% |
| Total | 975 | 100.0% |
Le Center Summary
History
Le Center is a city located in Le Sueur County, Minnesota. It is situated along the Minnesota River, approximately 50 miles southwest of Minneapolis. The city was founded in 1853 by a group of settlers from New York, led by William H. Le Center. The city was named after the leader of the group, and the name was later changed to Le Center.
The city was originally a farming community, and the first settlers were primarily of German and Irish descent. The city was incorporated in 1858, and the first mayor was William H. Le Center. The city grew slowly over the years, and by the early 1900s, it had become a thriving agricultural center.
The city experienced a period of growth in the 1950s and 1960s, when the population increased from 1,000 to over 3,000. This growth was largely due to the construction of the Minnesota River Valley Dam, which provided irrigation and hydroelectric power to the area.
The city has continued to grow since then and as of the 2010 census the population was 4 073
Geography
Le Center is located in the Minnesota River Valley, approximately 50 miles southwest of Minneapolis. The city is situated on the banks of the Minnesota River, and is surrounded by rolling hills and farmland. The city is located in the Central Hardwood Forest ecoregion, and is home to a variety of wildlife, including white-tailed deer, wild turkeys, and bald eagles.
The city has a total area of 2.2 square miles, all of which is land. The average elevation is 945 feet above sea level.
Economy
Le Center’s economy is largely based on agriculture and manufacturing. The city is home to several large agricultural operations, including a dairy farm, a hog farm, and a poultry farm. The city is also home to several manufacturing companies, including a plastics manufacturer, a metal fabricator, and a machine shop.
The city is also home to several retail businesses, including a grocery store, a hardware store, and a variety of restaurants.
Demographics
As of the 2010 census, the population of Le Center was 4,073. The racial makeup of the city was 95.2% White, 0.7% African American, 0.3% Native American, 0.4% Asian, 0.1% Pacific Islander, 1.7% from other races, and 1.5% from two or more races. Hispanic or Latino of any race were 3.2% of the population.
The median income for a household in the city was $45,938, and the median income for a family was $51,938. The per capita income for the city was $20,938. About 8.2% of families and 10.2% of the population were below the poverty line, including 14.2% of those under age 18 and 8.2% of those age 65 or over.
Common Questions
What is Per Capita Income in Le Center?
Per Capita income in Le Center is $31,173.
What is the Median Family Income in Le Center?
Median Family Income in Le Center is $89,000.
What is the Median Household income in Le Center?
Median Household Income in Le Center is $63,944.
What is Income or Wage Gap in Le Center?
Income or Wage Gap in Le Center is 20.8%.
Women in Le Center earn 79.2 cents for every dollar earned by a man.
What is Inequality or Gini Index in Le Center?
Inequality or Gini Index in Le Center is 0.37.
What is the Total Population of Le Center?
Total Population of Le Center is 2,502.
What is the Total Male Population of Le Center?
Total Male Population of Le Center is 1,277.
What is the Total Female Population of Le Center?
Total Female Population of Le Center is 1,225.
What is the Ratio of Males per 100 Females in Le Center?
There are 104.24 Males per 100 Females in Le Center.
What is the Ratio of Females per 100 Males in Le Center?
There are 95.93 Females per 100 Males in Le Center.
What is the Median Population Age in Le Center?
Median Population Age in Le Center is 36.7 Years.
What is the Average Family Size in Le Center
Average Family Size in Le Center is 3.0 People.
What is the Average Household Size in Le Center
Average Household Size in Le Center is 2.5 People.
How Large is the Labor Force in Le Center?
There are 1,418 People in the Labor Forcein in Le Center.
What is the Percentage of People in the Labor Force in Le Center?
69.4% of People are in the Labor Force in Le Center.
What is the Unemployment Rate in Le Center?
Unemployment Rate in Le Center is 5.5%.