Richmond, MN Map & Demographics
Richmond Map
Richmond Overview
$31,730
PER CAPITA INCOME
$86,250
AVG FAMILY INCOME
$64,865
AVG HOUSEHOLD INCOME
32.8%
WAGE / INCOME GAP [ % ]
67.2¢/ $1
WAGE / INCOME GAP [ $ ]
0.37
INEQUALITY / GINI INDEX
1,329
TOTAL POPULATION
644
MALE POPULATION
685
FEMALE POPULATION
94.01
MALES / 100 FEMALES
106.37
FEMALES / 100 MALES
38.3
MEDIAN AGE
3.0
AVG FAMILY SIZE
2.4
AVG HOUSEHOLD SIZE
767
LABOR FORCE [ PEOPLE ]
72.9%
PERCENT IN LABOR FORCE
1.4%
UNEMPLOYMENT RATE
Richmond Zip Codes
Richmond Area Codes
Income in Richmond
Income Overview in Richmond
Per Capita Income in Richmond is $31,730, while median incomes of families and households are $86,250 and $64,865 respectively.
| Characteristic | Number | Measure |
| Per Capita Income | 1,329 | $31,730 |
| Median Family Income | 358 | $86,250 |
| Mean Family Income | 358 | $89,066 |
| Median Household Income | 542 | $64,865 |
| Mean Household Income | 542 | $76,362 |
| Income Deficit | 358 | $0 |
| Wage / Income Gap (%) | 1,329 | 32.82% |
| Wage / Income Gap ($) | 1,329 | 67.18¢ per $1 |
| Gini / Inequality Index | 1,329 | 0.37 |
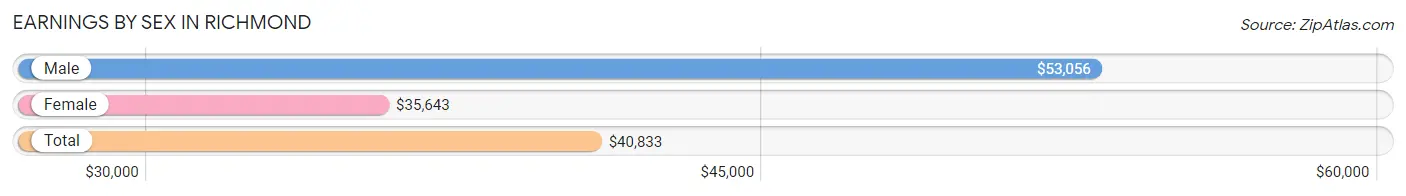
Earnings by Sex in Richmond
Average Earnings in Richmond are $40,833, $53,056 for men and $35,643 for women, a difference of 32.8%.
| Sex | Number | Average Earnings |
| Male | 410 (52.8%) | $53,056 |
| Female | 366 (47.2%) | $35,643 |
| Total | 776 (100.0%) | $40,833 |
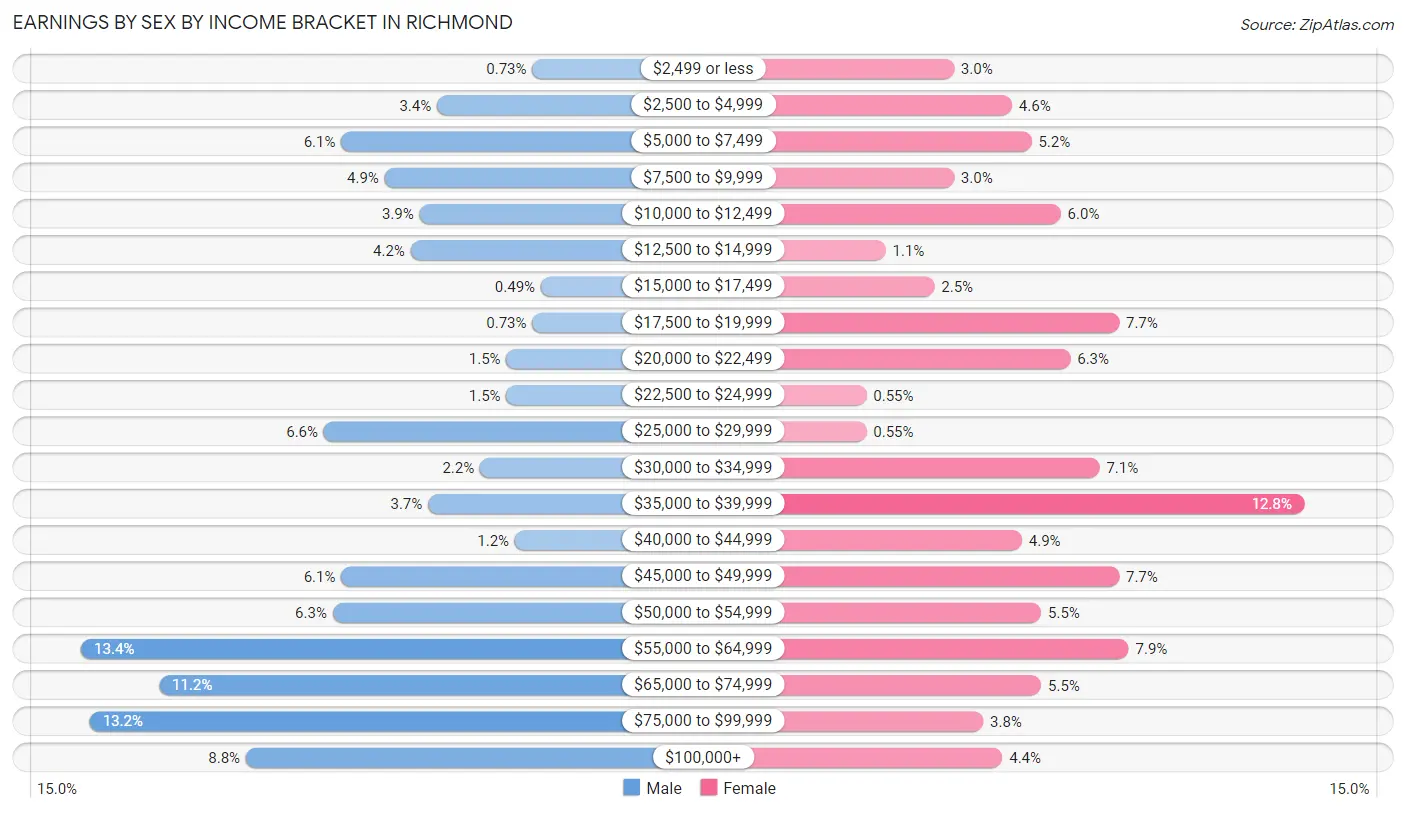
Earnings by Sex by Income Bracket in Richmond
The most common earnings brackets in Richmond are $55,000 to $64,999 for men (55 | 13.4%) and $35,000 to $39,999 for women (47 | 12.8%).
| Income | Male | Female |
| $2,499 or less | 3 (0.7%) | 11 (3.0%) |
| $2,500 to $4,999 | 14 (3.4%) | 17 (4.6%) |
| $5,000 to $7,499 | 25 (6.1%) | 19 (5.2%) |
| $7,500 to $9,999 | 20 (4.9%) | 11 (3.0%) |
| $10,000 to $12,499 | 16 (3.9%) | 22 (6.0%) |
| $12,500 to $14,999 | 17 (4.2%) | 4 (1.1%) |
| $15,000 to $17,499 | 2 (0.5%) | 9 (2.5%) |
| $17,500 to $19,999 | 3 (0.7%) | 28 (7.6%) |
| $20,000 to $22,499 | 6 (1.5%) | 23 (6.3%) |
| $22,500 to $24,999 | 6 (1.5%) | 2 (0.5%) |
| $25,000 to $29,999 | 27 (6.6%) | 2 (0.5%) |
| $30,000 to $34,999 | 9 (2.2%) | 26 (7.1%) |
| $35,000 to $39,999 | 15 (3.7%) | 47 (12.8%) |
| $40,000 to $44,999 | 5 (1.2%) | 18 (4.9%) |
| $45,000 to $49,999 | 25 (6.1%) | 28 (7.6%) |
| $50,000 to $54,999 | 26 (6.3%) | 20 (5.5%) |
| $55,000 to $64,999 | 55 (13.4%) | 29 (7.9%) |
| $65,000 to $74,999 | 46 (11.2%) | 20 (5.5%) |
| $75,000 to $99,999 | 54 (13.2%) | 14 (3.8%) |
| $100,000+ | 36 (8.8%) | 16 (4.4%) |
| Total | 410 (100.0%) | 366 (100.0%) |
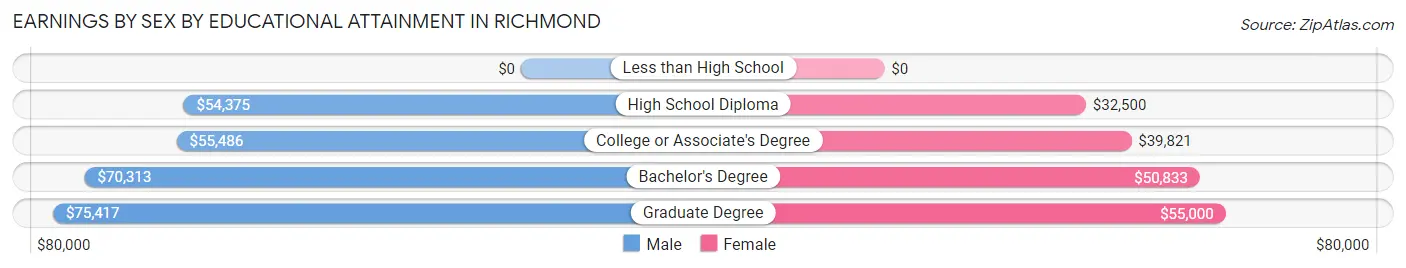
Earnings by Sex by Educational Attainment in Richmond
Average earnings in Richmond are $56,304 for men and $37,500 for women, a difference of 33.4%. Men with an educational attainment of graduate degree enjoy the highest average annual earnings of $75,417, while those with high school diploma education earn the least with $54,375. Women with an educational attainment of graduate degree earn the most with the average annual earnings of $55,000, while those with high school diploma education have the smallest earnings of $32,500.
| Educational Attainment | Male Income | Female Income |
| Less than High School | - | - |
| High School Diploma | $54,375 | $32,500 |
| College or Associate's Degree | $55,486 | $39,821 |
| Bachelor's Degree | $70,313 | $50,833 |
| Graduate Degree | $75,417 | $55,000 |
| Total | $56,304 | $37,500 |
Family Income in Richmond
Family Income Brackets in Richmond
According to the Richmond family income data, there are 92 families falling into the $100,000 to $149,999 income range, which is the most common income bracket and makes up 25.7% of all families.
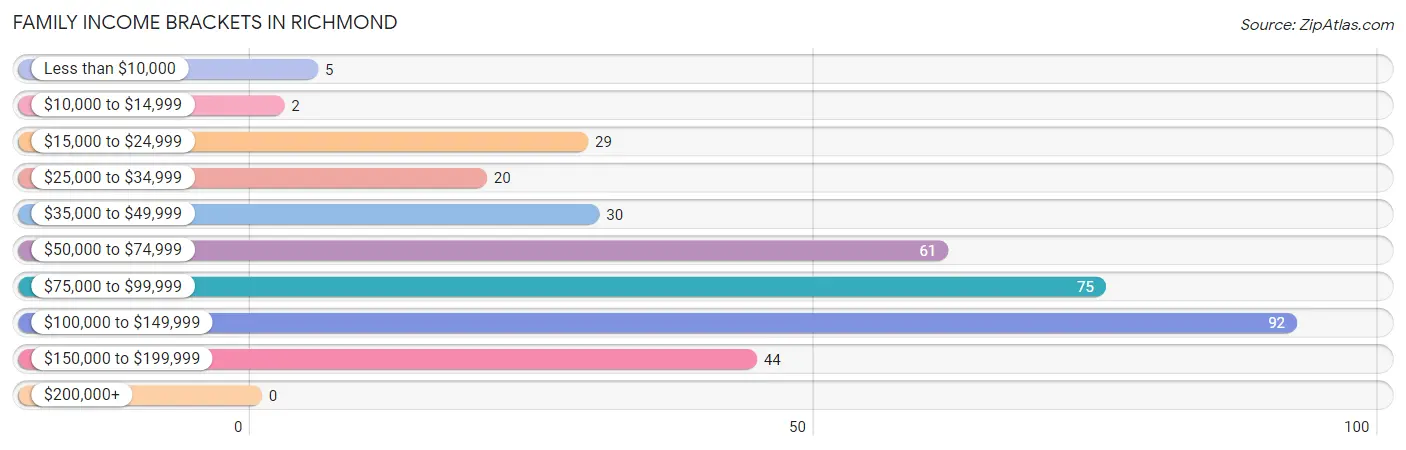
| Income Bracket | # Families | % Families |
| Less than $10,000 | 5 | 1.4% |
| $10,000 to $14,999 | 2 | 0.6% |
| $15,000 to $24,999 | 29 | 8.1% |
| $25,000 to $34,999 | 20 | 5.6% |
| $35,000 to $49,999 | 30 | 8.4% |
| $50,000 to $74,999 | 61 | 17.0% |
| $75,000 to $99,999 | 75 | 20.9% |
| $100,000 to $149,999 | 92 | 25.7% |
| $150,000 to $199,999 | 44 | 12.3% |
| $200,000+ | 0 | 0.0% |
Family Income by Famaliy Size in Richmond
5-person families (20 | 5.6%) account for the highest median family income in Richmond with $167,917 per family, while 5-person families (20 | 5.6%) have the highest median income of $33,583 per family member.
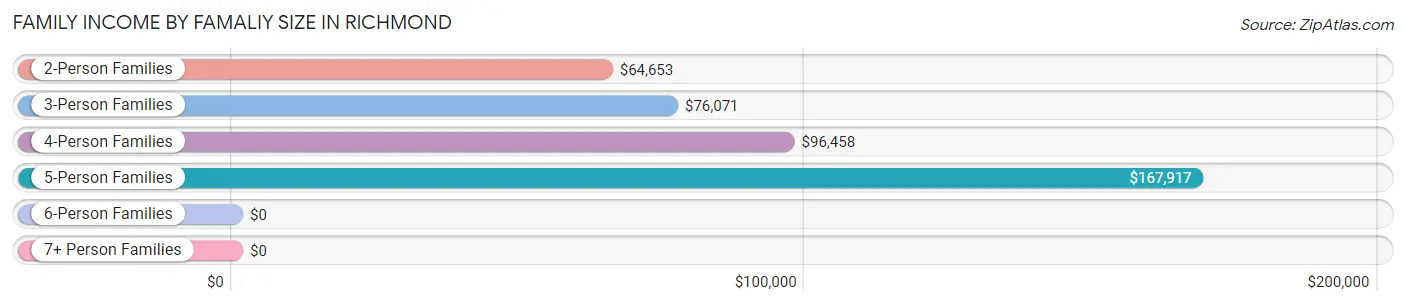
| Income Bracket | # Families | Median Income |
| 2-Person Families | 191 (53.3%) | $64,653 |
| 3-Person Families | 56 (15.6%) | $76,071 |
| 4-Person Families | 85 (23.7%) | $96,458 |
| 5-Person Families | 20 (5.6%) | $167,917 |
| 6-Person Families | 6 (1.7%) | $0 |
| 7+ Person Families | 0 (0.0%) | $0 |
| Total | 358 (100.0%) | $86,250 |
Family Income by Number of Earners in Richmond
The median family income in Richmond is $86,250, with families comprising 3+ earners (43) having the highest median family income of $143,750, while families with no earners (31) have the lowest median family income of $43,750, accounting for 12.0% and 8.7% of families, respectively.
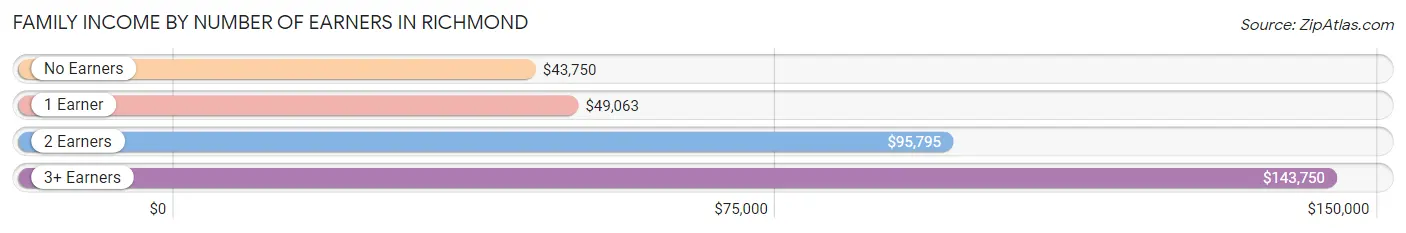
| Number of Earners | # Families | Median Income |
| No Earners | 31 (8.7%) | $43,750 |
| 1 Earner | 83 (23.2%) | $49,063 |
| 2 Earners | 201 (56.1%) | $95,795 |
| 3+ Earners | 43 (12.0%) | $143,750 |
| Total | 358 (100.0%) | $86,250 |
Household Income in Richmond
Household Income Brackets in Richmond
With 111 households falling in the category, the $50,000 to $74,999 income range is the most frequent in Richmond, accounting for 20.5% of all households. In contrast, only 5 households (0.9%) fall into the $200,000+ income bracket, making it the least populous group.
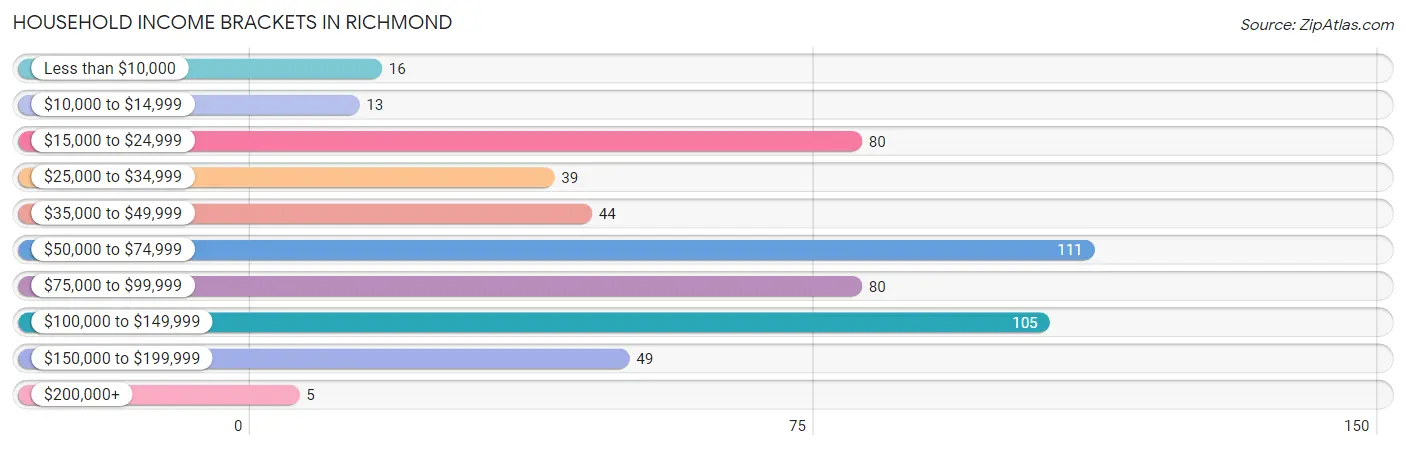
| Income Bracket | # Households | % Households |
| Less than $10,000 | 16 | 3.0% |
| $10,000 to $14,999 | 13 | 2.4% |
| $15,000 to $24,999 | 80 | 14.8% |
| $25,000 to $34,999 | 39 | 7.2% |
| $35,000 to $49,999 | 44 | 8.1% |
| $50,000 to $74,999 | 111 | 20.5% |
| $75,000 to $99,999 | 80 | 14.8% |
| $100,000 to $149,999 | 105 | 19.4% |
| $150,000 to $199,999 | 49 | 9.0% |
| $200,000+ | 5 | 0.9% |
Household Income by Householder Age in Richmond
The median household income in Richmond is $64,865, with the highest median household income of $86,667 found in the 45 to 64 years age bracket for the primary householder. A total of 166 households (30.6%) fall into this category. Meanwhile, the 15 to 24 years age bracket for the primary householder has the lowest median household income of $0, with 15 households (2.8%) in this group.
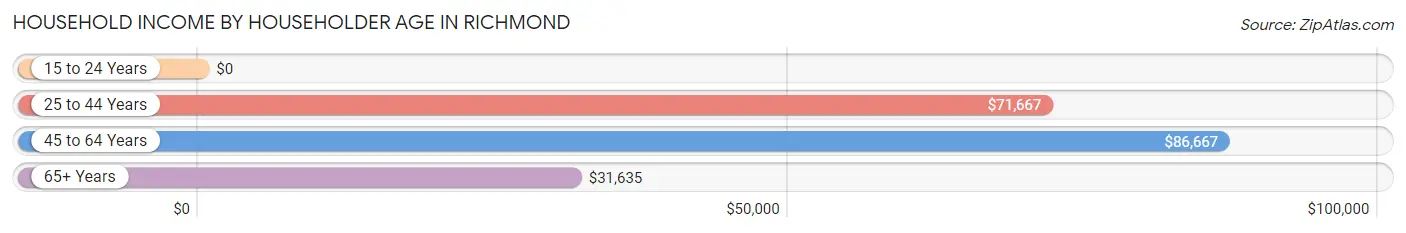
| Income Bracket | # Households | Median Income |
| 15 to 24 Years | 15 (2.8%) | $0 |
| 25 to 44 Years | 198 (36.5%) | $71,667 |
| 45 to 64 Years | 166 (30.6%) | $86,667 |
| 65+ Years | 163 (30.1%) | $31,635 |
| Total | 542 (100.0%) | $64,865 |
Poverty in Richmond
Income Below Poverty by Sex and Age in Richmond
With 5.8% poverty level for males and 14.3% for females among the residents of Richmond, 5 year old males and 18 to 24 year old females are the most vulnerable to poverty, with 3 males (37.5%) and 45 females (52.3%) in their respective age groups living below the poverty level.
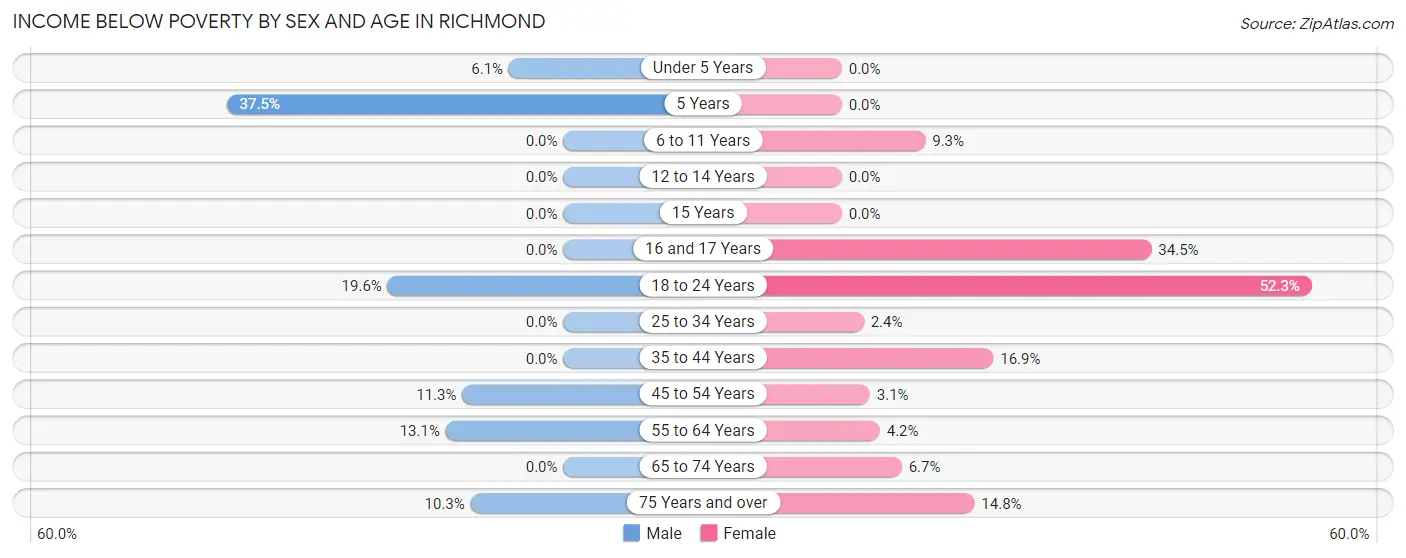
| Age Bracket | Male | Female |
| Under 5 Years | 2 (6.1%) | 0 (0.0%) |
| 5 Years | 3 (37.5%) | 0 (0.0%) |
| 6 to 11 Years | 0 (0.0%) | 4 (9.3%) |
| 12 to 14 Years | 0 (0.0%) | 0 (0.0%) |
| 15 Years | 0 (0.0%) | 0 (0.0%) |
| 16 and 17 Years | 0 (0.0%) | 10 (34.5%) |
| 18 to 24 Years | 9 (19.6%) | 45 (52.3%) |
| 25 to 34 Years | 0 (0.0%) | 2 (2.4%) |
| 35 to 44 Years | 0 (0.0%) | 14 (16.9%) |
| 45 to 54 Years | 9 (11.3%) | 2 (3.1%) |
| 55 to 64 Years | 11 (13.1%) | 3 (4.2%) |
| 65 to 74 Years | 0 (0.0%) | 3 (6.7%) |
| 75 Years and over | 3 (10.3%) | 13 (14.8%) |
| Total | 37 (5.8%) | 96 (14.3%) |
Income Above Poverty by Sex and Age in Richmond
According to the poverty statistics in Richmond, males aged 6 to 11 years and females aged under 5 years are the age groups that are most secure financially, with 100.0% of males and 100.0% of females in these age groups living above the poverty line.
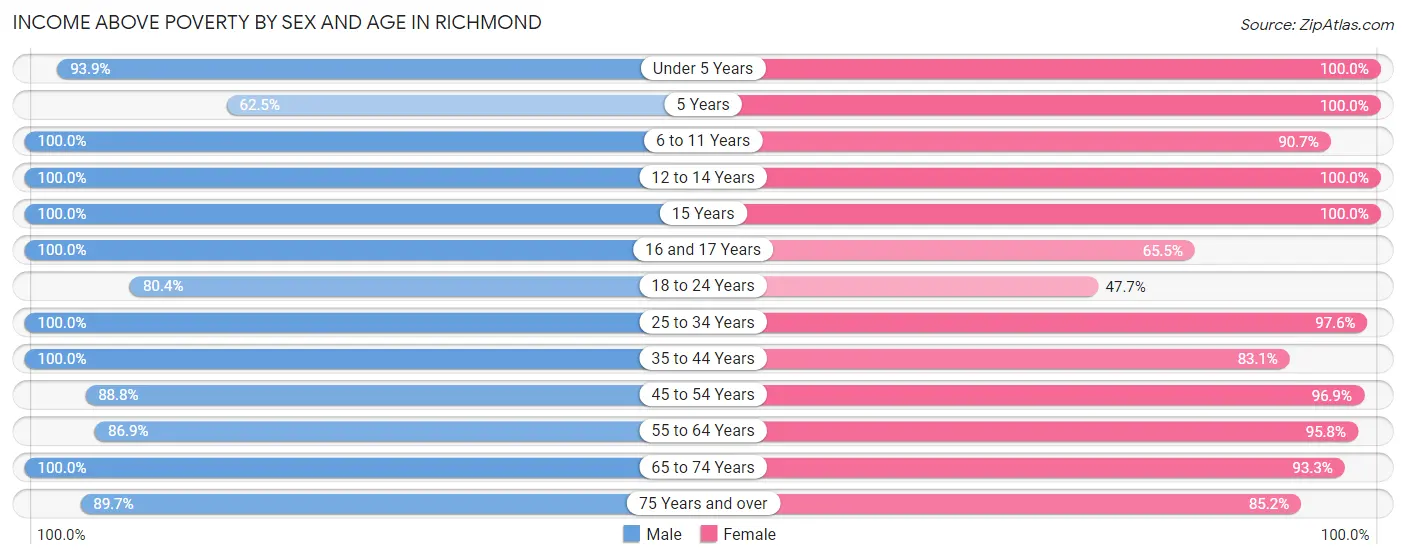
| Age Bracket | Male | Female |
| Under 5 Years | 31 (93.9%) | 62 (100.0%) |
| 5 Years | 5 (62.5%) | 2 (100.0%) |
| 6 to 11 Years | 58 (100.0%) | 39 (90.7%) |
| 12 to 14 Years | 41 (100.0%) | 12 (100.0%) |
| 15 Years | 13 (100.0%) | 3 (100.0%) |
| 16 and 17 Years | 16 (100.0%) | 19 (65.5%) |
| 18 to 24 Years | 37 (80.4%) | 41 (47.7%) |
| 25 to 34 Years | 100 (100.0%) | 80 (97.6%) |
| 35 to 44 Years | 69 (100.0%) | 69 (83.1%) |
| 45 to 54 Years | 71 (88.7%) | 62 (96.9%) |
| 55 to 64 Years | 73 (86.9%) | 68 (95.8%) |
| 65 to 74 Years | 67 (100.0%) | 42 (93.3%) |
| 75 Years and over | 26 (89.7%) | 75 (85.2%) |
| Total | 607 (94.3%) | 574 (85.7%) |
Income Below Poverty Among Married-Couple Families in Richmond
The poverty statistics for married-couple families in Richmond show that 2.0% or 5 of the total 253 families live below the poverty line. Families with 1 or 2 children have the highest poverty rate of 2.3%, comprising of 2 families. On the other hand, families with 3 or 4 children have the lowest poverty rate of 0.0%, which includes 0 families.
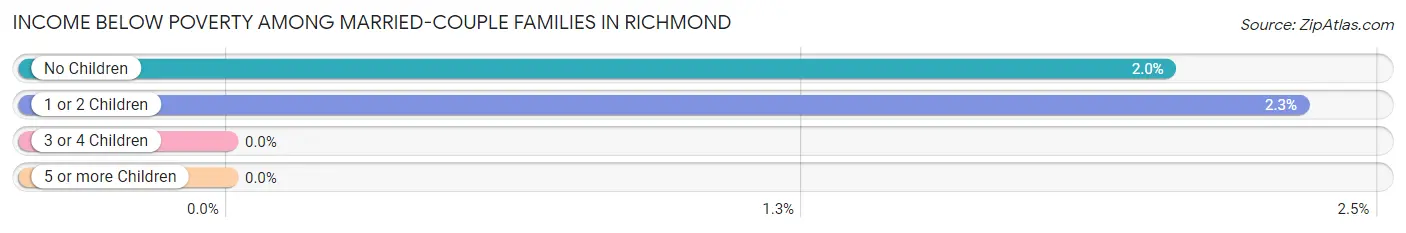
| Children | Above Poverty | Below Poverty |
| No Children | 144 (98.0%) | 3 (2.0%) |
| 1 or 2 Children | 84 (97.7%) | 2 (2.3%) |
| 3 or 4 Children | 20 (100.0%) | 0 (0.0%) |
| 5 or more Children | 0 (0.0%) | 0 (0.0%) |
| Total | 248 (98.0%) | 5 (2.0%) |
Income Below Poverty Among Single-Parent Households in Richmond
According to the poverty data in Richmond, 10.6% or 5 single-father households and 27.6% or 16 single-mother households are living below the poverty line. Among single-father households, those with 1 or 2 children have the highest poverty rate, with 5 households (16.1%) experiencing poverty. Likewise, among single-mother households, those with 3 or 4 children have the highest poverty rate, with 2 households (100.0%) falling below the poverty line.
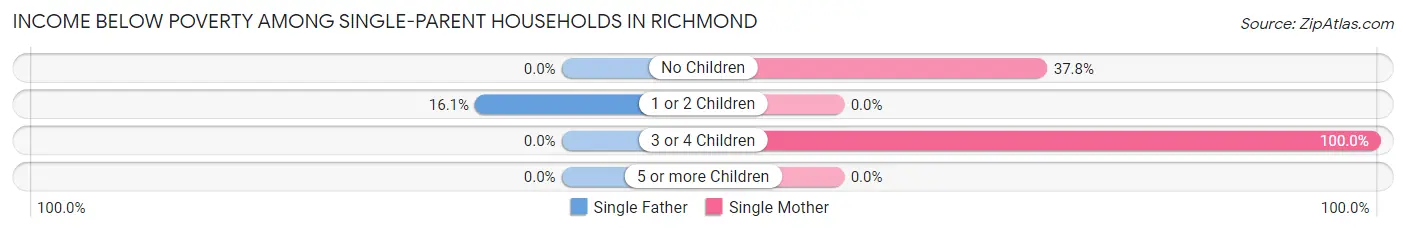
| Children | Single Father | Single Mother |
| No Children | 0 (0.0%) | 14 (37.8%) |
| 1 or 2 Children | 5 (16.1%) | 0 (0.0%) |
| 3 or 4 Children | 0 (0.0%) | 2 (100.0%) |
| 5 or more Children | 0 (0.0%) | 0 (0.0%) |
| Total | 5 (10.6%) | 16 (27.6%) |
Income Below Poverty Among Married-Couple vs Single-Parent Households in Richmond
The poverty data for Richmond shows that 5 of the married-couple family households (2.0%) and 21 of the single-parent households (20.0%) are living below the poverty level. Within the married-couple family households, those with 1 or 2 children have the highest poverty rate, with 2 households (2.3%) falling below the poverty line. Among the single-parent households, those with no children have the highest poverty rate, with 14 household (31.8%) living below poverty.
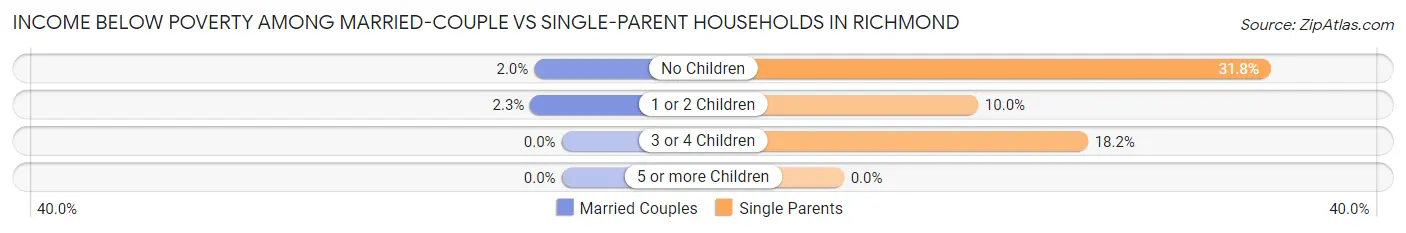
| Children | Married-Couple Families | Single-Parent Households |
| No Children | 3 (2.0%) | 14 (31.8%) |
| 1 or 2 Children | 2 (2.3%) | 5 (10.0%) |
| 3 or 4 Children | 0 (0.0%) | 2 (18.2%) |
| 5 or more Children | 0 (0.0%) | 0 (0.0%) |
| Total | 5 (2.0%) | 21 (20.0%) |
Race in Richmond
The most populous races in Richmond are White / Caucasian (1,238 | 93.1%), Hispanic or Latino (102 | 7.7%), and Two or more Races (47 | 3.5%).
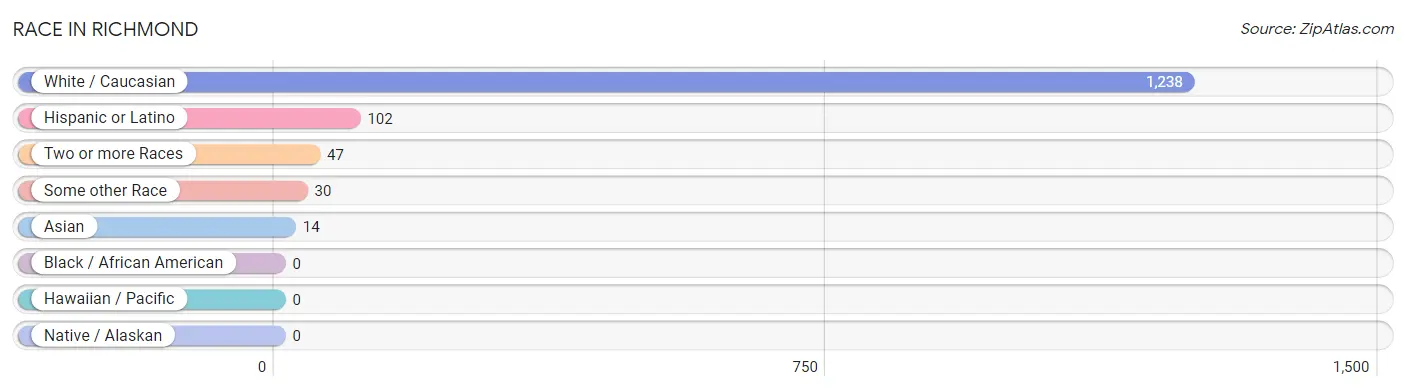
| Race | # Population | % Population |
| Asian | 14 | 1.1% |
| Black / African American | 0 | 0.0% |
| Hawaiian / Pacific | 0 | 0.0% |
| Hispanic or Latino | 102 | 7.7% |
| Native / Alaskan | 0 | 0.0% |
| White / Caucasian | 1,238 | 93.1% |
| Two or more Races | 47 | 3.5% |
| Some other Race | 30 | 2.3% |
| Total | 1,329 | 100.0% |
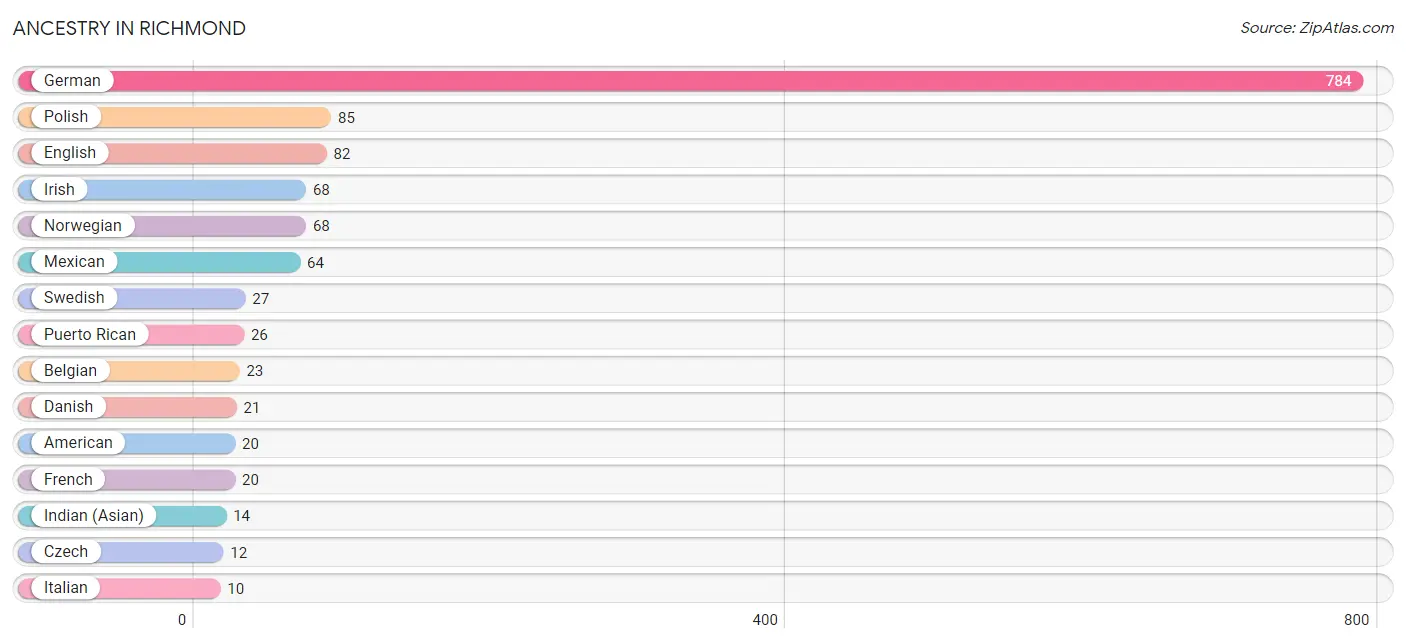
Ancestry in Richmond
The most populous ancestries reported in Richmond are German (784 | 59.0%), Polish (85 | 6.4%), English (82 | 6.2%), Irish (68 | 5.1%), and Norwegian (68 | 5.1%), together accounting for 81.8% of all Richmond residents.
| Ancestry | # Population | % Population |
| American | 20 | 1.5% |
| Arab | 4 | 0.3% |
| Belgian | 23 | 1.7% |
| Central American | 7 | 0.5% |
| Czech | 12 | 0.9% |
| Danish | 21 | 1.6% |
| Dutch | 8 | 0.6% |
| English | 82 | 6.2% |
| European | 2 | 0.2% |
| Finnish | 3 | 0.2% |
| French | 20 | 1.5% |
| French Canadian | 3 | 0.2% |
| German | 784 | 59.0% |
| Honduran | 5 | 0.4% |
| Indian (Asian) | 14 | 1.1% |
| Irish | 68 | 5.1% |
| Italian | 10 | 0.7% |
| Lebanese | 2 | 0.2% |
| Mexican | 64 | 4.8% |
| Nigerian | 7 | 0.5% |
| Norwegian | 68 | 5.1% |
| Panamanian | 2 | 0.2% |
| Polish | 85 | 6.4% |
| Puerto Rican | 26 | 2.0% |
| Russian | 6 | 0.4% |
| Scandinavian | 7 | 0.5% |
| Scottish | 7 | 0.5% |
| Spanish | 5 | 0.4% |
| Subsaharan African | 8 | 0.6% |
| Swedish | 27 | 2.0% |
| Syrian | 2 | 0.2% | View All 31 Rows |
Immigrants in Richmond
The most numerous immigrant groups reported in Richmond came from Central America (16 | 1.2%), Latin America (16 | 1.2%), Asia (14 | 1.1%), China (14 | 1.1%), and Eastern Asia (14 | 1.1%), together accounting for 5.6% of all Richmond residents.
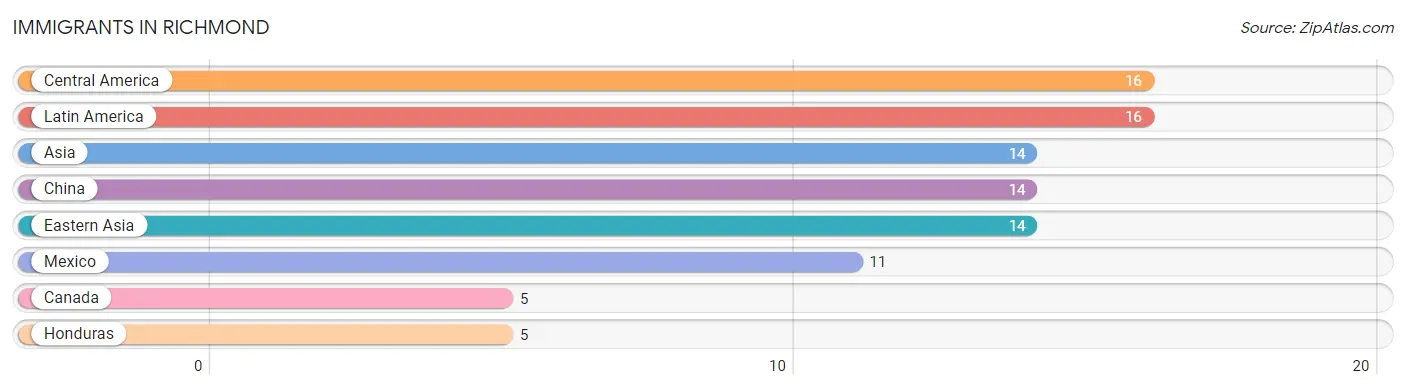
| Immigration Origin | # Population | % Population |
| Asia | 14 | 1.1% |
| Canada | 5 | 0.4% |
| Central America | 16 | 1.2% |
| China | 14 | 1.1% |
| Eastern Asia | 14 | 1.1% |
| Honduras | 5 | 0.4% |
| Latin America | 16 | 1.2% |
| Mexico | 11 | 0.8% | View All 8 Rows |
Sex and Age in Richmond
Sex and Age in Richmond
The most populous age groups in Richmond are 10 to 14 Years (59 | 9.2%) for men and 20 to 24 Years (68 | 9.9%) for women.
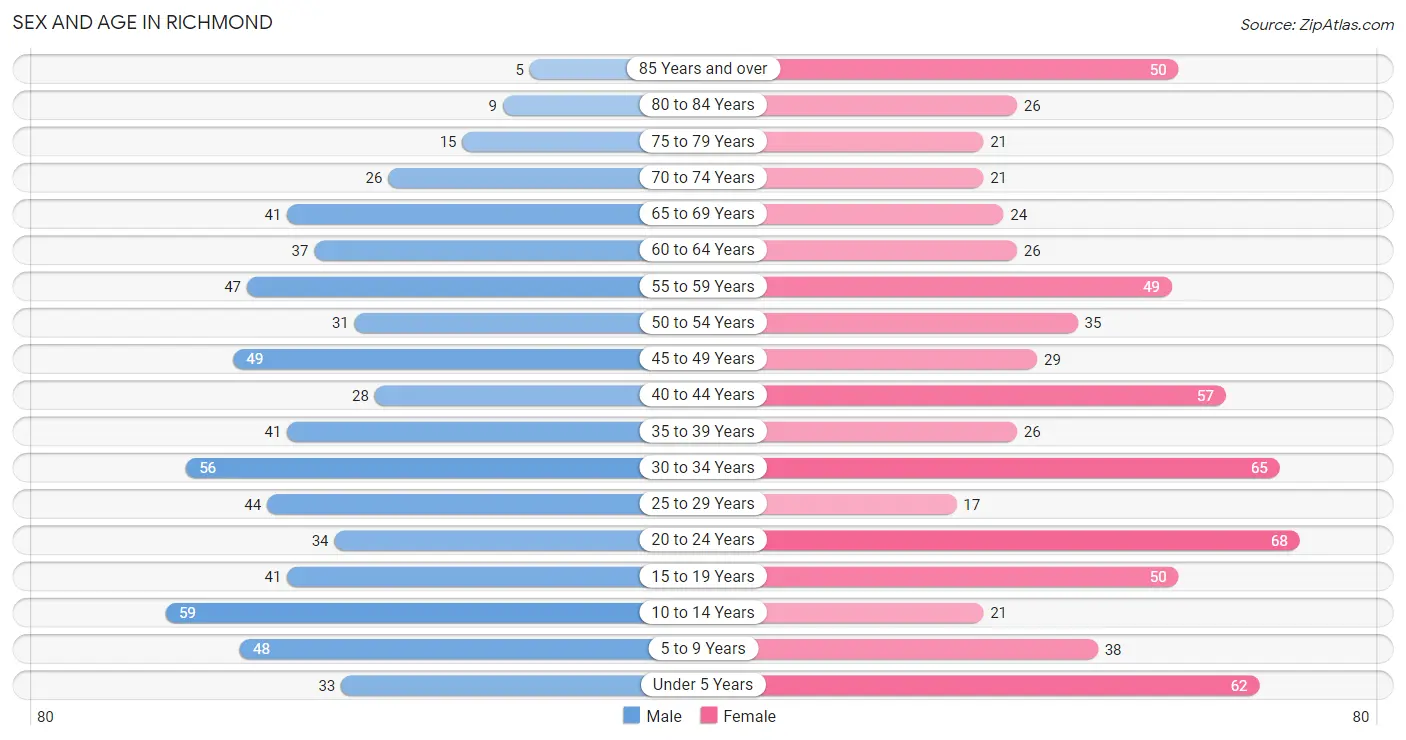
| Age Bracket | Male | Female |
| Under 5 Years | 33 (5.1%) | 62 (9.0%) |
| 5 to 9 Years | 48 (7.4%) | 38 (5.6%) |
| 10 to 14 Years | 59 (9.2%) | 21 (3.1%) |
| 15 to 19 Years | 41 (6.4%) | 50 (7.3%) |
| 20 to 24 Years | 34 (5.3%) | 68 (9.9%) |
| 25 to 29 Years | 44 (6.8%) | 17 (2.5%) |
| 30 to 34 Years | 56 (8.7%) | 65 (9.5%) |
| 35 to 39 Years | 41 (6.4%) | 26 (3.8%) |
| 40 to 44 Years | 28 (4.3%) | 57 (8.3%) |
| 45 to 49 Years | 49 (7.6%) | 29 (4.2%) |
| 50 to 54 Years | 31 (4.8%) | 35 (5.1%) |
| 55 to 59 Years | 47 (7.3%) | 49 (7.1%) |
| 60 to 64 Years | 37 (5.8%) | 26 (3.8%) |
| 65 to 69 Years | 41 (6.4%) | 24 (3.5%) |
| 70 to 74 Years | 26 (4.0%) | 21 (3.1%) |
| 75 to 79 Years | 15 (2.3%) | 21 (3.1%) |
| 80 to 84 Years | 9 (1.4%) | 26 (3.8%) |
| 85 Years and over | 5 (0.8%) | 50 (7.3%) |
| Total | 644 (100.0%) | 685 (100.0%) |
Families and Households in Richmond
Median Family Size in Richmond
The median family size in Richmond is 3.01 persons per family, with single male/father families (47 | 13.1%) accounting for the largest median family size of 3.11 persons per family. On the other hand, single female/mother families (58 | 16.2%) represent the smallest median family size with 2.67 persons per family.
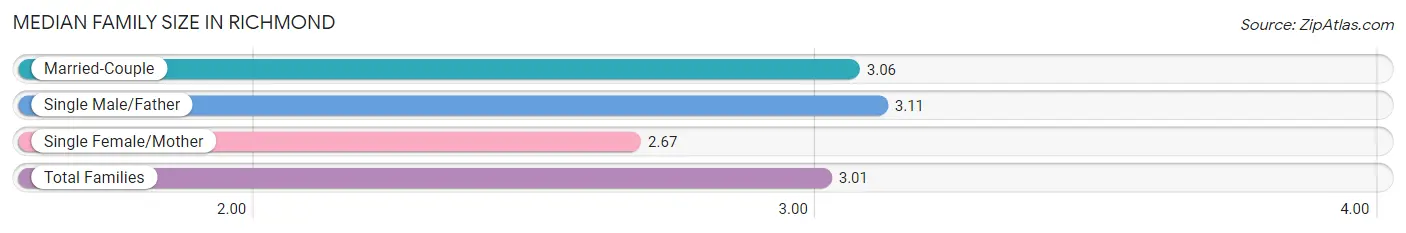
| Family Type | # Families | Family Size |
| Married-Couple | 253 (70.7%) | 3.06 |
| Single Male/Father | 47 (13.1%) | 3.11 |
| Single Female/Mother | 58 (16.2%) | 2.67 |
| Total Families | 358 (100.0%) | 3.01 |
Median Household Size in Richmond
The median household size in Richmond is 2.42 persons per household, with single male/father households (47 | 8.7%) accounting for the largest median household size of 3.83 persons per household. non-family households (184 | 34.0%) represent the smallest median household size with 1.06 persons per household.
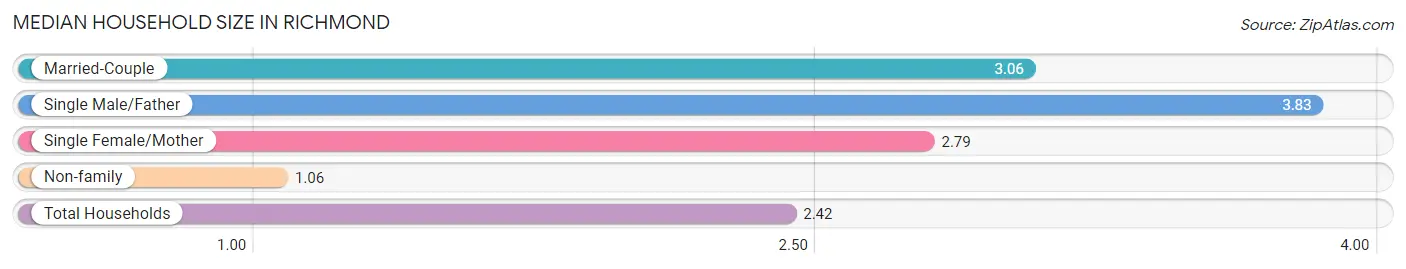
| Household Type | # Households | Household Size |
| Married-Couple | 253 (46.7%) | 3.06 |
| Single Male/Father | 47 (8.7%) | 3.83 |
| Single Female/Mother | 58 (10.7%) | 2.79 |
| Non-family | 184 (34.0%) | 1.06 |
| Total Households | 542 (100.0%) | 2.42 |
Household Size by Marriage Status in Richmond
Out of a total of 542 households in Richmond, 358 (66.0%) are family households, while 184 (34.0%) are nonfamily households. The most numerous type of family households are 2-person households, comprising 181, and the most common type of nonfamily households are 1-person households, comprising 174.
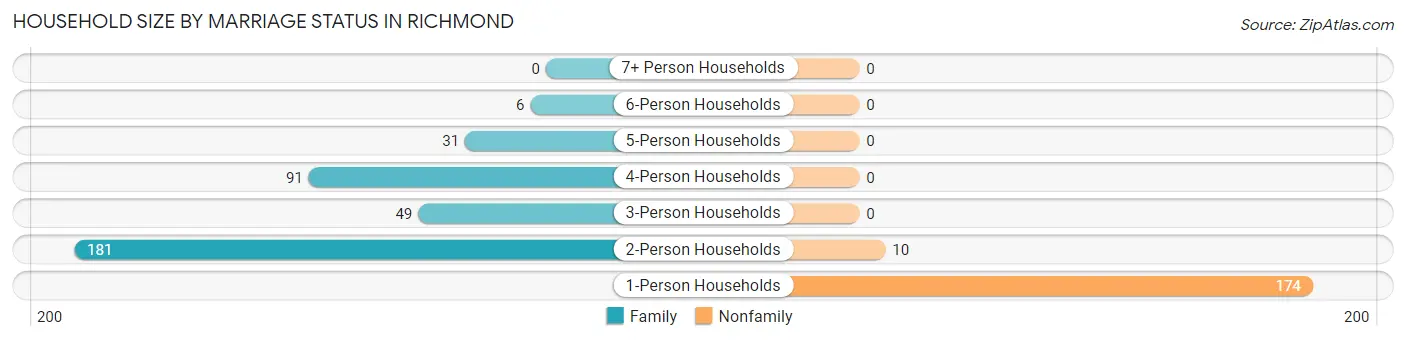
| Household Size | Family Households | Nonfamily Households |
| 1-Person Households | - | 174 (32.1%) |
| 2-Person Households | 181 (33.4%) | 10 (1.8%) |
| 3-Person Households | 49 (9.0%) | 0 (0.0%) |
| 4-Person Households | 91 (16.8%) | 0 (0.0%) |
| 5-Person Households | 31 (5.7%) | 0 (0.0%) |
| 6-Person Households | 6 (1.1%) | 0 (0.0%) |
| 7+ Person Households | 0 (0.0%) | 0 (0.0%) |
| Total | 358 (66.0%) | 184 (34.0%) |
Female Fertility in Richmond
Fertility by Age in Richmond
Average fertility rate in Richmond is 58.0 births per 1,000 women. Women in the age bracket of 20 to 34 years have the highest fertility rate with 120.0 births per 1,000 women. Women in the age bracket of 20 to 34 years acount for 100.0% of all women with births.
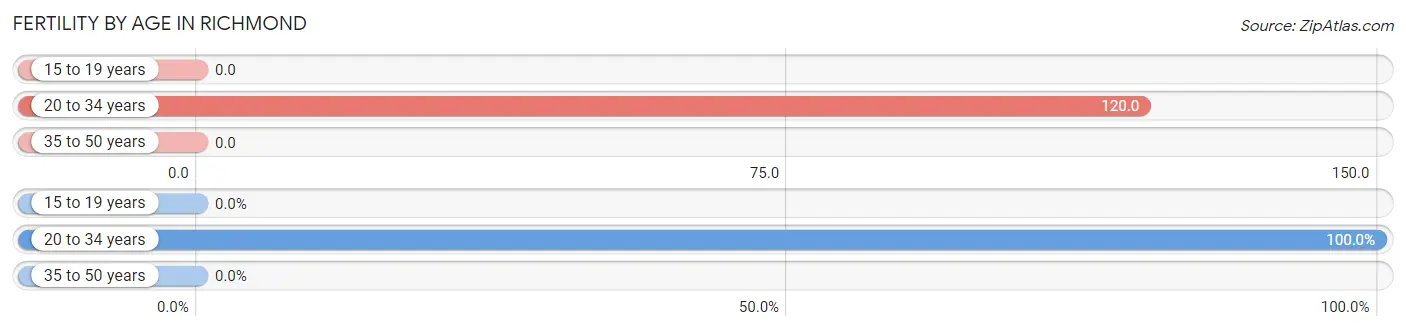
| Age Bracket | Women with Births | Births / 1,000 Women |
| 15 to 19 years | 0 (0.0%) | 0.0 |
| 20 to 34 years | 18 (100.0%) | 120.0 |
| 35 to 50 years | 0 (0.0%) | 0.0 |
| Total | 18 (100.0%) | 58.0 |
Fertility by Age by Marriage Status in Richmond
50.0% of women with births (18) in Richmond are married. The highest percentage of unmarried women with births falls into 20 to 34 years age bracket with 50.0% of them unmarried at the time of birth, while the lowest percentage of unmarried women with births belong to 20 to 34 years age bracket with 50.0% of them unmarried.
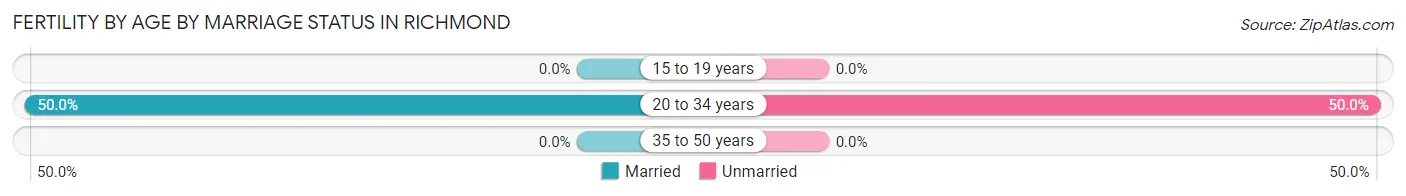
| Age Bracket | Married | Unmarried |
| 15 to 19 years | 0 (0.0%) | 0 (0.0%) |
| 20 to 34 years | 9 (50.0%) | 9 (50.0%) |
| 35 to 50 years | 0 (0.0%) | 0 (0.0%) |
| Total | 9 (50.0%) | 9 (50.0%) |
Fertility by Education in Richmond
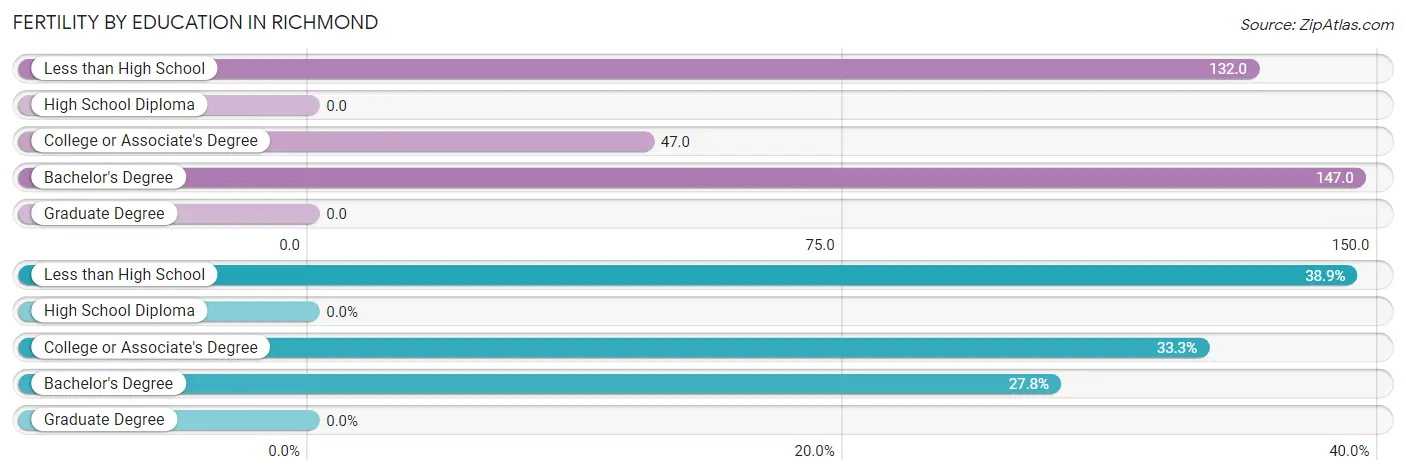
| Educational Attainment | Women with Births | Births / 1,000 Women |
| Less than High School | 7 (38.9%) | 132.0 |
| High School Diploma | 0 (0.0%) | 0.0 |
| College or Associate's Degree | 6 (33.3%) | 47.0 |
| Bachelor's Degree | 5 (27.8%) | 147.0 |
| Graduate Degree | 0 (0.0%) | 0.0 |
| Total | 18 (100.0%) | 58.0 |
Fertility by Education by Marriage Status in Richmond
50.0% of women with births in Richmond are unmarried. Women with the educational attainment of bachelor's degree are most likely to be married with 100.0% of them married at childbirth, while women with the educational attainment of less than high school are least likely to be married with 100.0% of them unmarried at childbirth.
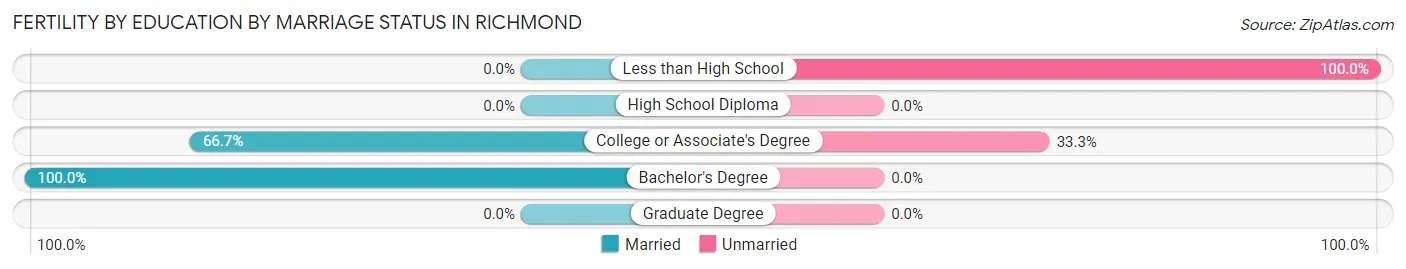
| Educational Attainment | Married | Unmarried |
| Less than High School | 0 (0.0%) | 7 (100.0%) |
| High School Diploma | 0 (0.0%) | 0 (0.0%) |
| College or Associate's Degree | 4 (66.7%) | 2 (33.3%) |
| Bachelor's Degree | 5 (100.0%) | 0 (0.0%) |
| Graduate Degree | 0 (0.0%) | 0 (0.0%) |
| Total | 9 (50.0%) | 9 (50.0%) |
Employment Characteristics in Richmond
Employment by Class of Employer in Richmond
Among the 731 employed individuals in Richmond, private company employees (549 | 75.1%), not-for-profit organizations (57 | 7.8%), and self-employed (incorporated) (37 | 5.1%) make up the most common classes of employment.
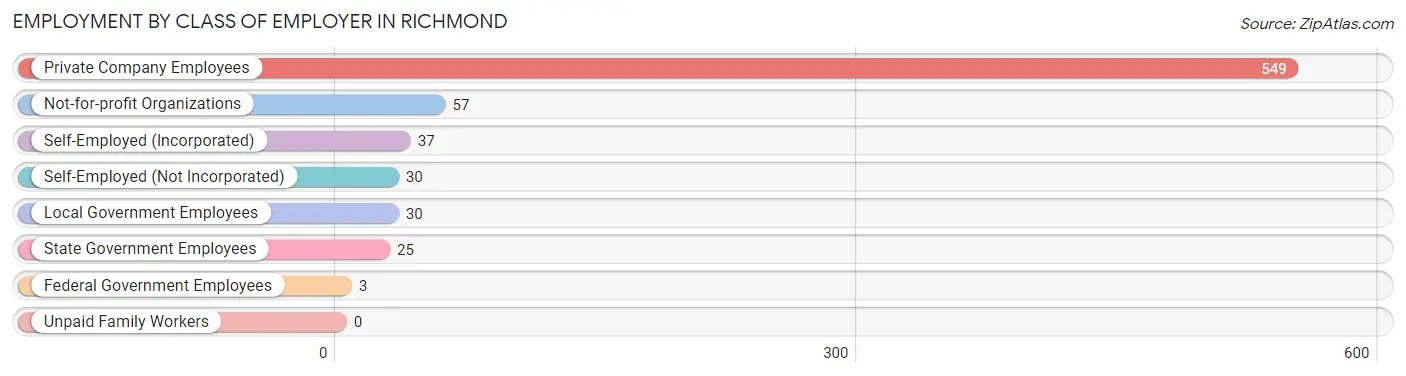
| Employer Class | # Employees | % Employees |
| Private Company Employees | 549 | 75.1% |
| Self-Employed (Incorporated) | 37 | 5.1% |
| Self-Employed (Not Incorporated) | 30 | 4.1% |
| Not-for-profit Organizations | 57 | 7.8% |
| Local Government Employees | 30 | 4.1% |
| State Government Employees | 25 | 3.4% |
| Federal Government Employees | 3 | 0.4% |
| Unpaid Family Workers | 0 | 0.0% |
| Total | 731 | 100.0% |
Employment Status by Age in Richmond
According to the labor force statistics for Richmond, out of the total population over 16 years of age (1,052), 72.9% or 767 individuals are in the labor force, with 1.4% or 11 of them unemployed. The age group with the highest labor force participation rate is 30 to 34 years, with 98.3% or 119 individuals in the labor force. Within the labor force, the 45 to 54 years age range has the highest percentage of unemployed individuals, with 5.0% or 7 of them being unemployed.
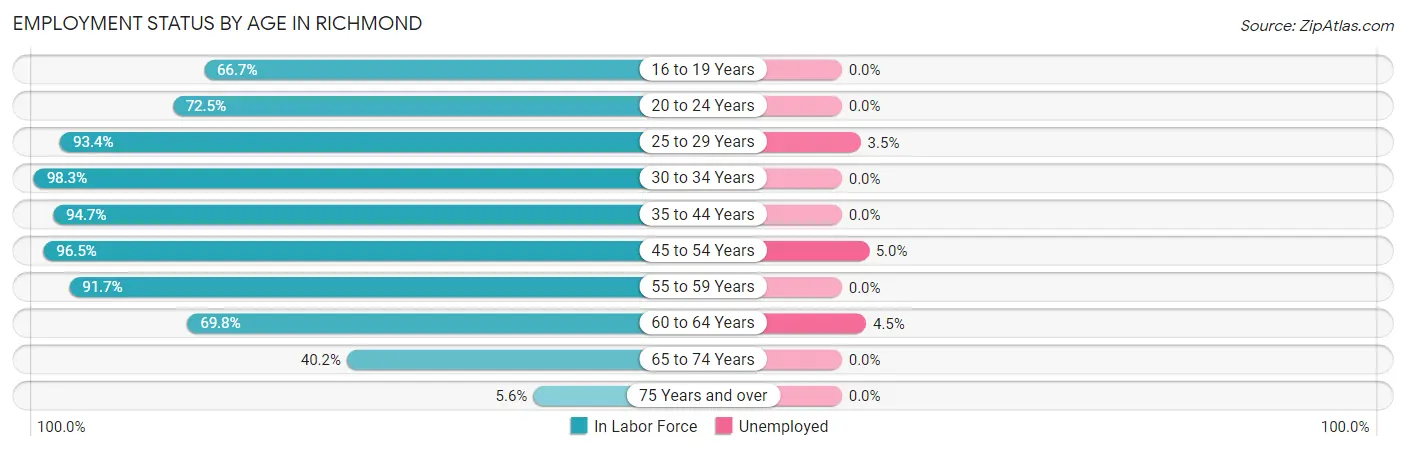
| Age Bracket | In Labor Force | Unemployed |
| 16 to 19 Years | 50 (66.7%) | 0 (0.0%) |
| 20 to 24 Years | 74 (72.5%) | 0 (0.0%) |
| 25 to 29 Years | 57 (93.4%) | 2 (3.5%) |
| 30 to 34 Years | 119 (98.3%) | 0 (0.0%) |
| 35 to 44 Years | 144 (94.7%) | 0 (0.0%) |
| 45 to 54 Years | 139 (96.5%) | 7 (5.0%) |
| 55 to 59 Years | 88 (91.7%) | 0 (0.0%) |
| 60 to 64 Years | 44 (69.8%) | 2 (4.5%) |
| 65 to 74 Years | 45 (40.2%) | 0 (0.0%) |
| 75 Years and over | 7 (5.6%) | 0 (0.0%) |
| Total | 767 (72.9%) | 11 (1.4%) |
Employment Status by Educational Attainment in Richmond
According to labor force statistics for Richmond, 92.8% of individuals (591) out of the total population between 25 and 64 years of age (637) are in the labor force, with 1.9% or 11 of them being unemployed. The group with the highest labor force participation rate are those with the educational attainment of less than high school, with 100.0% or 14 individuals in the labor force. Within the labor force, individuals with bachelor's degree or higher education have the highest percentage of unemployment, with 5.5% or 7 of them being unemployed.
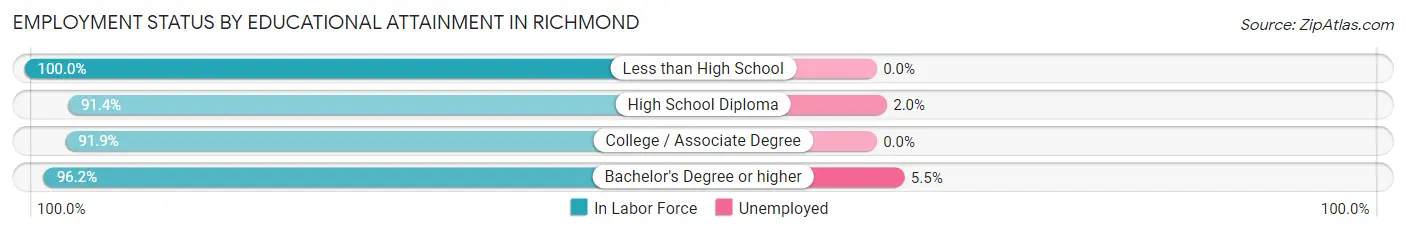
| Educational Attainment | In Labor Force | Unemployed |
| Less than High School | 14 (100.0%) | 0 (0.0%) |
| High School Diploma | 201 (91.4%) | 4 (2.0%) |
| College / Associate Degree | 248 (91.9%) | 0 (0.0%) |
| Bachelor's Degree or higher | 128 (96.2%) | 7 (5.5%) |
| Total | 591 (92.8%) | 12 (1.9%) |
Employment Occupations by Sex in Richmond
Management, Business, Science and Arts Occupations
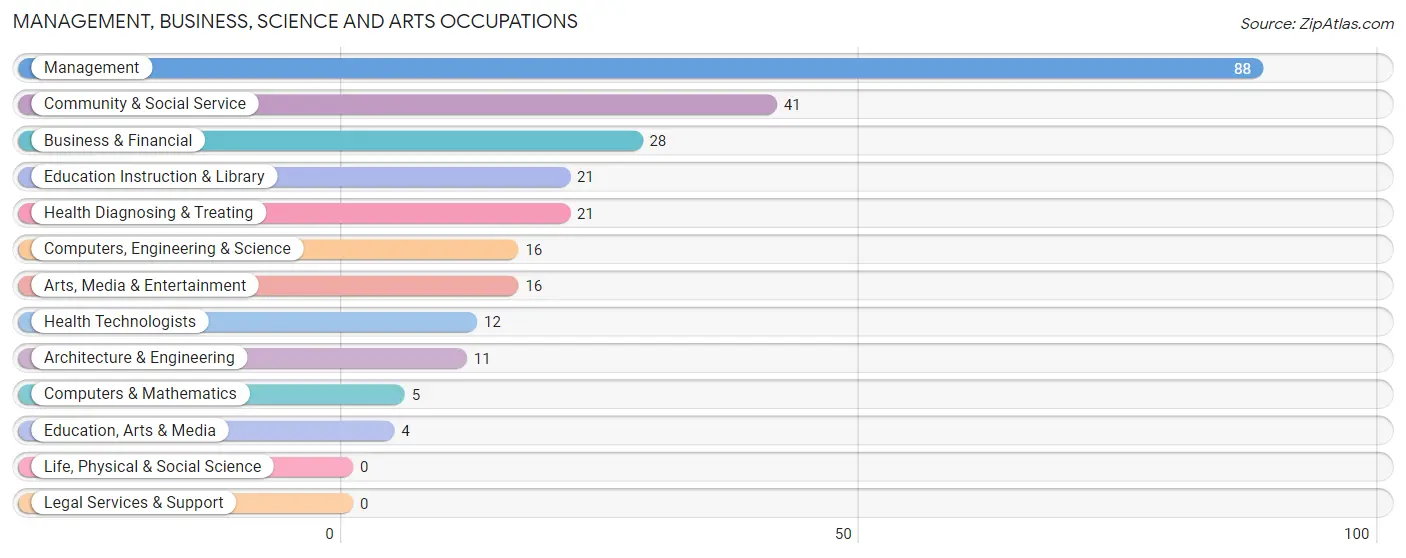
The most common Management, Business, Science and Arts occupations in Richmond are Management (88 | 11.6%), Community & Social Service (41 | 5.4%), Business & Financial (28 | 3.7%), Education Instruction & Library (21 | 2.8%), and Health Diagnosing & Treating (21 | 2.8%).
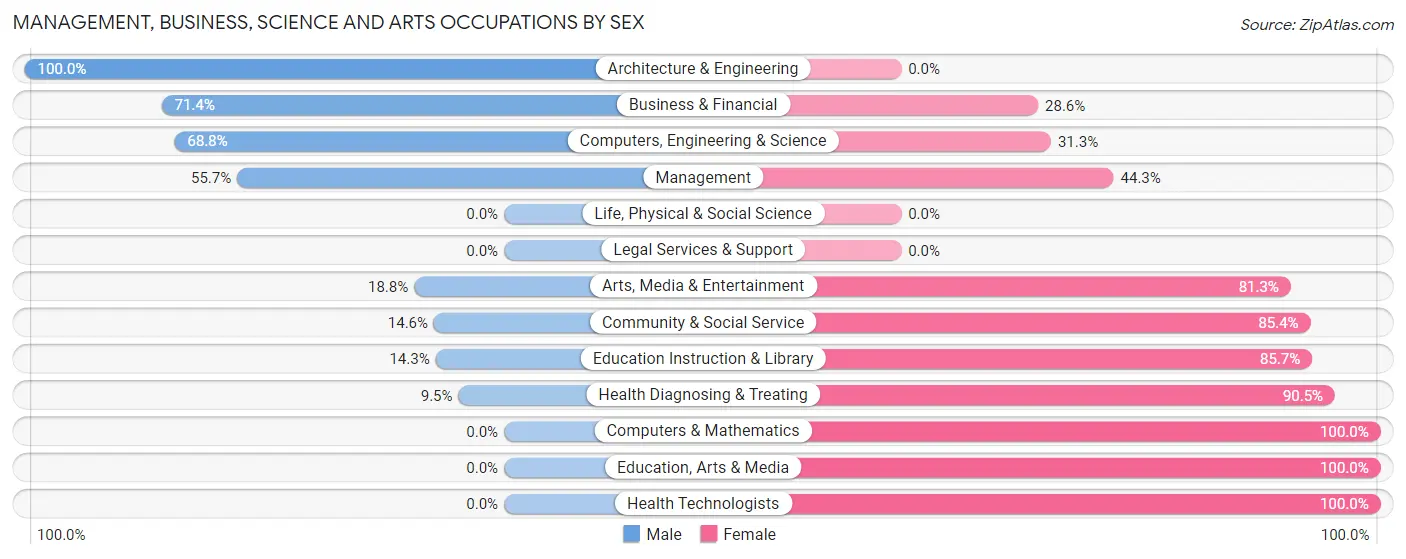
Management, Business, Science and Arts Occupations by Sex
Within the Management, Business, Science and Arts occupations in Richmond, the most male-oriented occupations are Architecture & Engineering (100.0%), Business & Financial (71.4%), and Computers, Engineering & Science (68.8%), while the most female-oriented occupations are Computers & Mathematics (100.0%), Education, Arts & Media (100.0%), and Health Technologists (100.0%).
| Occupation | Male | Female |
| Management | 49 (55.7%) | 39 (44.3%) |
| Business & Financial | 20 (71.4%) | 8 (28.6%) |
| Computers, Engineering & Science | 11 (68.8%) | 5 (31.2%) |
| Computers & Mathematics | 0 (0.0%) | 5 (100.0%) |
| Architecture & Engineering | 11 (100.0%) | 0 (0.0%) |
| Life, Physical & Social Science | 0 (0.0%) | 0 (0.0%) |
| Community & Social Service | 6 (14.6%) | 35 (85.4%) |
| Education, Arts & Media | 0 (0.0%) | 4 (100.0%) |
| Legal Services & Support | 0 (0.0%) | 0 (0.0%) |
| Education Instruction & Library | 3 (14.3%) | 18 (85.7%) |
| Arts, Media & Entertainment | 3 (18.8%) | 13 (81.2%) |
| Health Diagnosing & Treating | 2 (9.5%) | 19 (90.5%) |
| Health Technologists | 0 (0.0%) | 12 (100.0%) |
| Total (Category) | 88 (45.4%) | 106 (54.6%) |
| Total (Overall) | 403 (53.3%) | 353 (46.7%) |
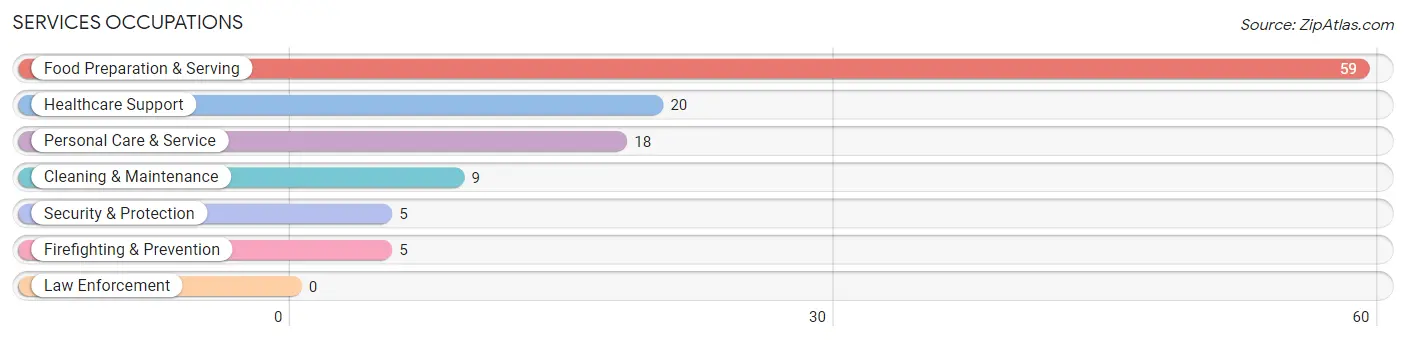
Services Occupations
The most common Services occupations in Richmond are Food Preparation & Serving (59 | 7.8%), Healthcare Support (20 | 2.6%), Personal Care & Service (18 | 2.4%), Cleaning & Maintenance (9 | 1.2%), and Security & Protection (5 | 0.7%).
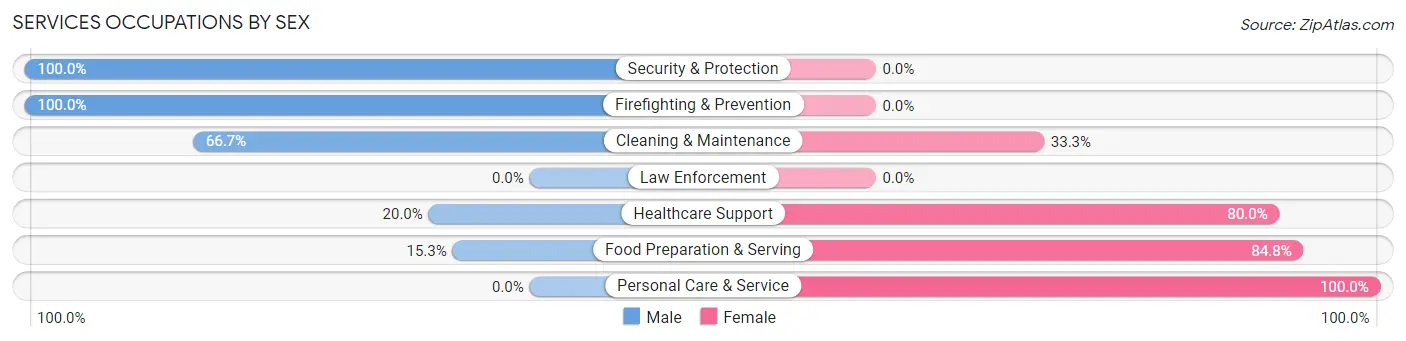
Services Occupations by Sex
Within the Services occupations in Richmond, the most male-oriented occupations are Security & Protection (100.0%), Firefighting & Prevention (100.0%), and Cleaning & Maintenance (66.7%), while the most female-oriented occupations are Personal Care & Service (100.0%), Food Preparation & Serving (84.8%), and Healthcare Support (80.0%).
| Occupation | Male | Female |
| Healthcare Support | 4 (20.0%) | 16 (80.0%) |
| Security & Protection | 5 (100.0%) | 0 (0.0%) |
| Firefighting & Prevention | 5 (100.0%) | 0 (0.0%) |
| Law Enforcement | 0 (0.0%) | 0 (0.0%) |
| Food Preparation & Serving | 9 (15.2%) | 50 (84.8%) |
| Cleaning & Maintenance | 6 (66.7%) | 3 (33.3%) |
| Personal Care & Service | 0 (0.0%) | 18 (100.0%) |
| Total (Category) | 24 (21.6%) | 87 (78.4%) |
| Total (Overall) | 403 (53.3%) | 353 (46.7%) |
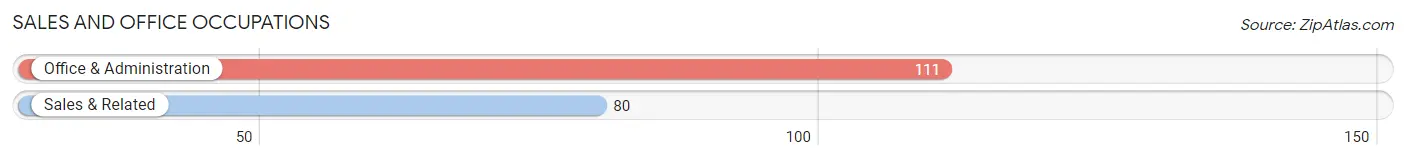
Sales and Office Occupations
The most common Sales and Office occupations in Richmond are Office & Administration (111 | 14.7%), and Sales & Related (80 | 10.6%).
Sales and Office Occupations by Sex
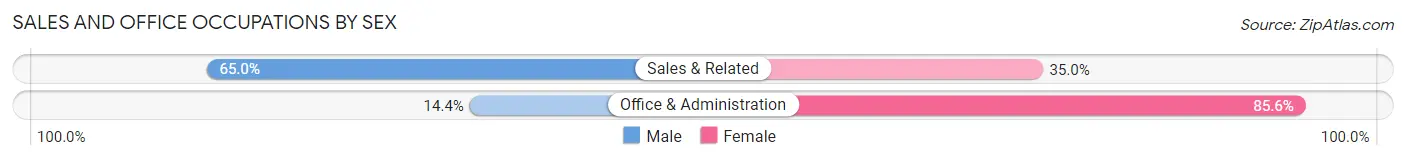
| Occupation | Male | Female |
| Sales & Related | 52 (65.0%) | 28 (35.0%) |
| Office & Administration | 16 (14.4%) | 95 (85.6%) |
| Total (Category) | 68 (35.6%) | 123 (64.4%) |
| Total (Overall) | 403 (53.3%) | 353 (46.7%) |
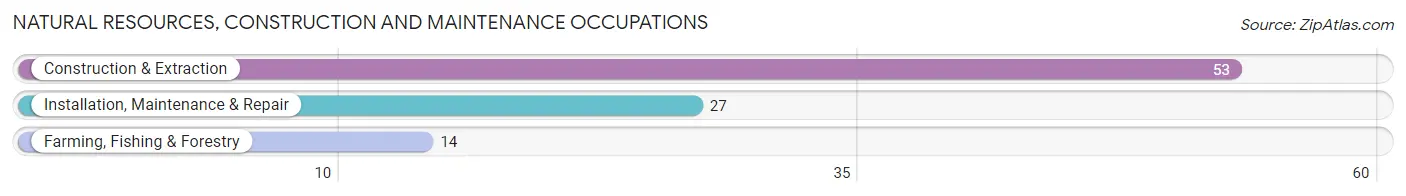
Natural Resources, Construction and Maintenance Occupations
The most common Natural Resources, Construction and Maintenance occupations in Richmond are Construction & Extraction (53 | 7.0%), Installation, Maintenance & Repair (27 | 3.6%), and Farming, Fishing & Forestry (14 | 1.8%).
Natural Resources, Construction and Maintenance Occupations by Sex
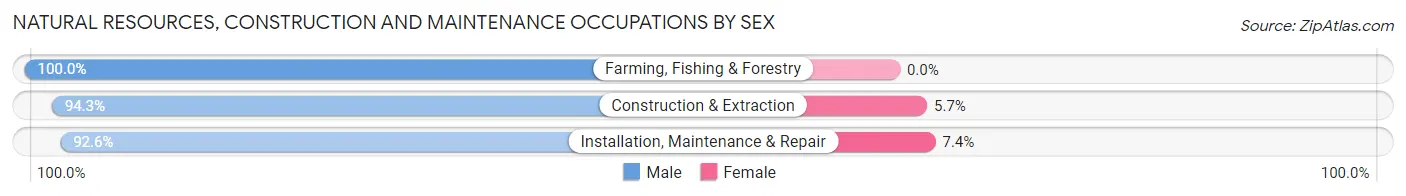
| Occupation | Male | Female |
| Farming, Fishing & Forestry | 14 (100.0%) | 0 (0.0%) |
| Construction & Extraction | 50 (94.3%) | 3 (5.7%) |
| Installation, Maintenance & Repair | 25 (92.6%) | 2 (7.4%) |
| Total (Category) | 89 (94.7%) | 5 (5.3%) |
| Total (Overall) | 403 (53.3%) | 353 (46.7%) |
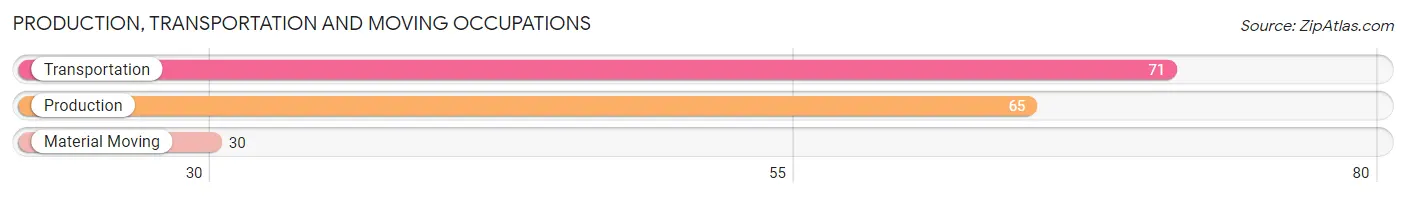
Production, Transportation and Moving Occupations
The most common Production, Transportation and Moving occupations in Richmond are Transportation (71 | 9.4%), Production (65 | 8.6%), and Material Moving (30 | 4.0%).
Production, Transportation and Moving Occupations by Sex
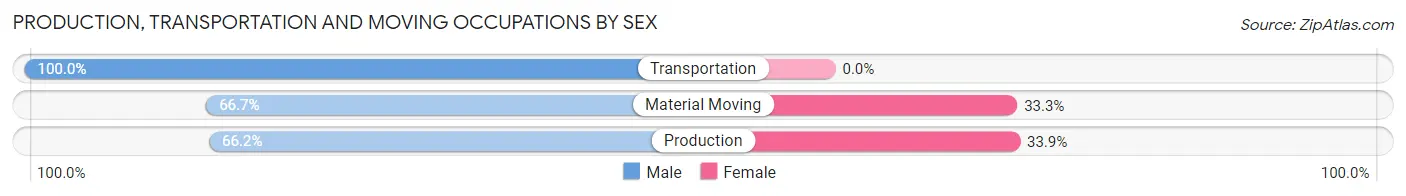
| Occupation | Male | Female |
| Production | 43 (66.1%) | 22 (33.9%) |
| Transportation | 71 (100.0%) | 0 (0.0%) |
| Material Moving | 20 (66.7%) | 10 (33.3%) |
| Total (Category) | 134 (80.7%) | 32 (19.3%) |
| Total (Overall) | 403 (53.3%) | 353 (46.7%) |
Employment Industries by Sex in Richmond
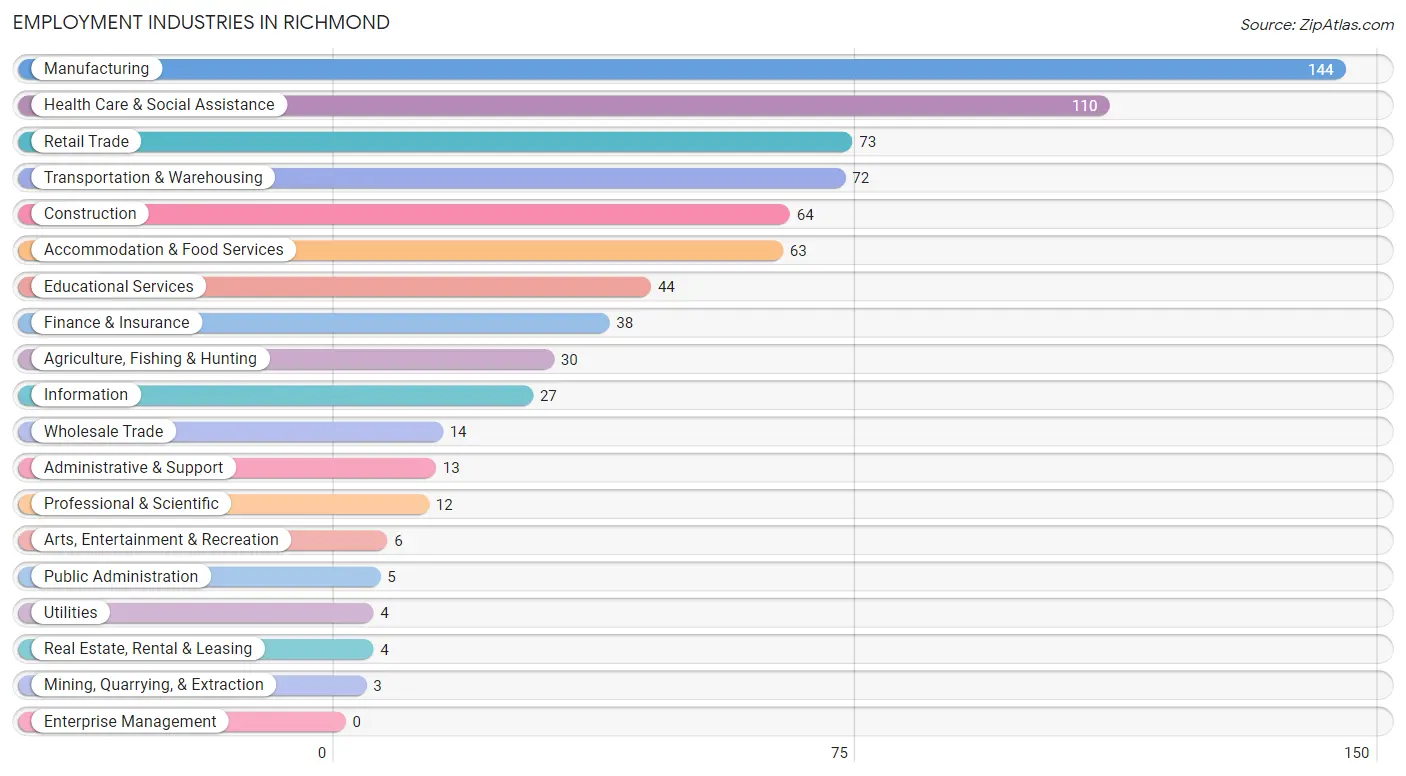
Employment Industries in Richmond
The major employment industries in Richmond include Manufacturing (144 | 19.1%), Health Care & Social Assistance (110 | 14.5%), Retail Trade (73 | 9.7%), Transportation & Warehousing (72 | 9.5%), and Construction (64 | 8.5%).
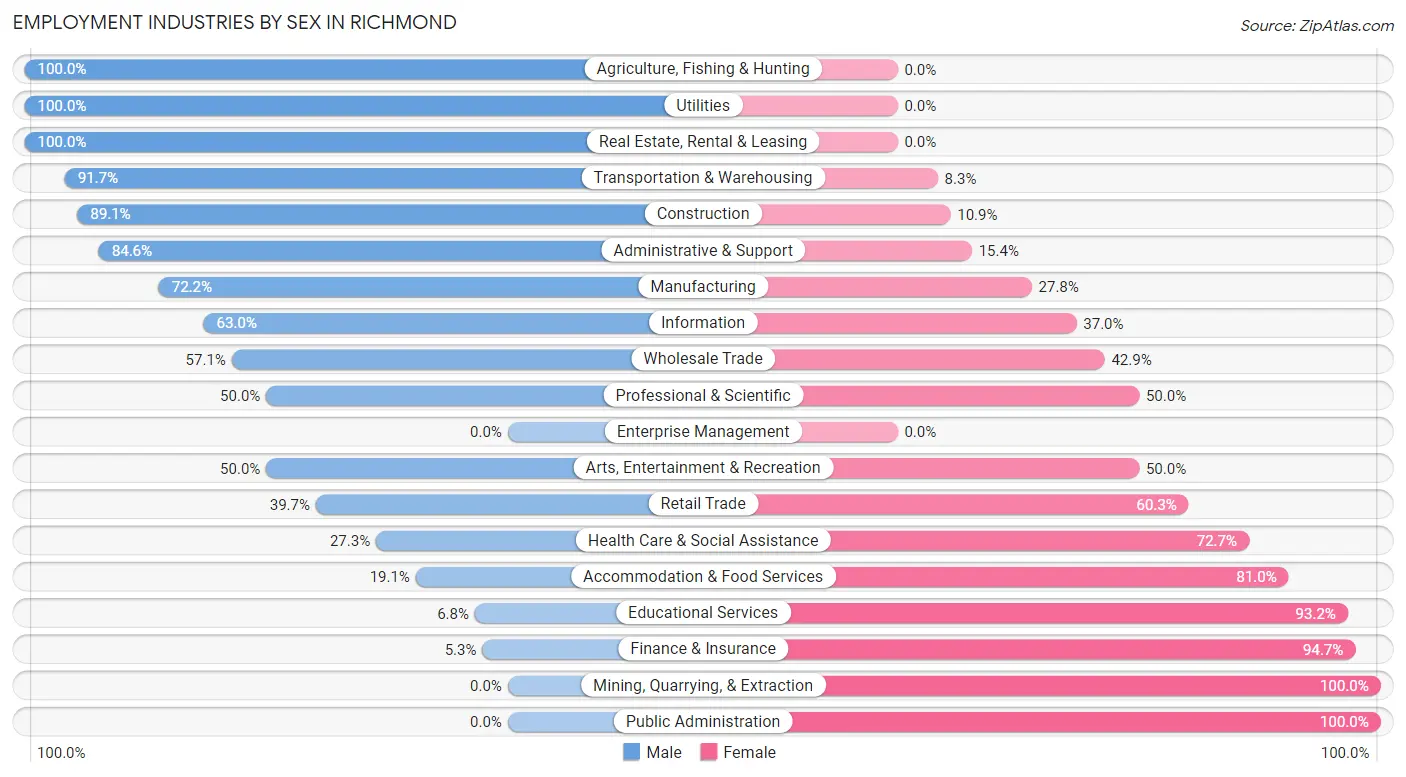
Employment Industries by Sex in Richmond
The Richmond industries that see more men than women are Agriculture, Fishing & Hunting (100.0%), Utilities (100.0%), and Real Estate, Rental & Leasing (100.0%), whereas the industries that tend to have a higher number of women are Mining, Quarrying, & Extraction (100.0%), Public Administration (100.0%), and Finance & Insurance (94.7%).
| Industry | Male | Female |
| Agriculture, Fishing & Hunting | 30 (100.0%) | 0 (0.0%) |
| Mining, Quarrying, & Extraction | 0 (0.0%) | 3 (100.0%) |
| Construction | 57 (89.1%) | 7 (10.9%) |
| Manufacturing | 104 (72.2%) | 40 (27.8%) |
| Wholesale Trade | 8 (57.1%) | 6 (42.9%) |
| Retail Trade | 29 (39.7%) | 44 (60.3%) |
| Transportation & Warehousing | 66 (91.7%) | 6 (8.3%) |
| Utilities | 4 (100.0%) | 0 (0.0%) |
| Information | 17 (63.0%) | 10 (37.0%) |
| Finance & Insurance | 2 (5.3%) | 36 (94.7%) |
| Real Estate, Rental & Leasing | 4 (100.0%) | 0 (0.0%) |
| Professional & Scientific | 6 (50.0%) | 6 (50.0%) |
| Enterprise Management | 0 (0.0%) | 0 (0.0%) |
| Administrative & Support | 11 (84.6%) | 2 (15.4%) |
| Educational Services | 3 (6.8%) | 41 (93.2%) |
| Health Care & Social Assistance | 30 (27.3%) | 80 (72.7%) |
| Arts, Entertainment & Recreation | 3 (50.0%) | 3 (50.0%) |
| Accommodation & Food Services | 12 (19.1%) | 51 (80.9%) |
| Public Administration | 0 (0.0%) | 5 (100.0%) |
| Total | 403 (53.3%) | 353 (46.7%) |
Education in Richmond
School Enrollment in Richmond
The most common levels of schooling among the 270 students in Richmond are elementary school (75 | 27.8%), high school (72 | 26.7%), and middle school (55 | 20.4%).
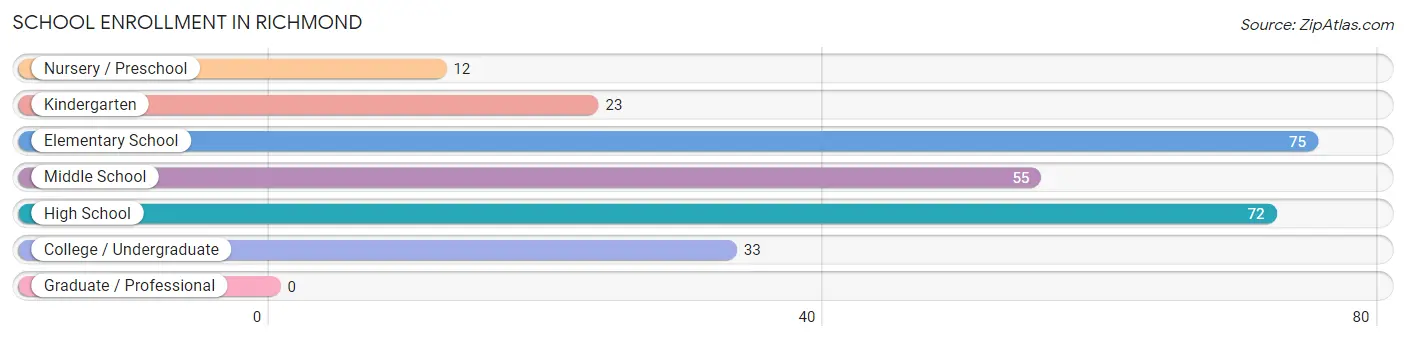
| School Level | # Students | % Students |
| Nursery / Preschool | 12 | 4.4% |
| Kindergarten | 23 | 8.5% |
| Elementary School | 75 | 27.8% |
| Middle School | 55 | 20.4% |
| High School | 72 | 26.7% |
| College / Undergraduate | 33 | 12.2% |
| Graduate / Professional | 0 | 0.0% |
| Total | 270 | 100.0% |
School Enrollment by Age by Funding Source in Richmond
Out of a total of 270 students who are enrolled in schools in Richmond, 48 (17.8%) attend a private institution, while the remaining 222 (82.2%) are enrolled in public schools. The age group of 18 to 19 year olds has the highest likelihood of being enrolled in private schools, with 14 (77.8% in the age bracket) enrolled. Conversely, the age group of 3 to 4 year olds has the lowest likelihood of being enrolled in a private school, with 12 (100.0% in the age bracket) attending a public institution.
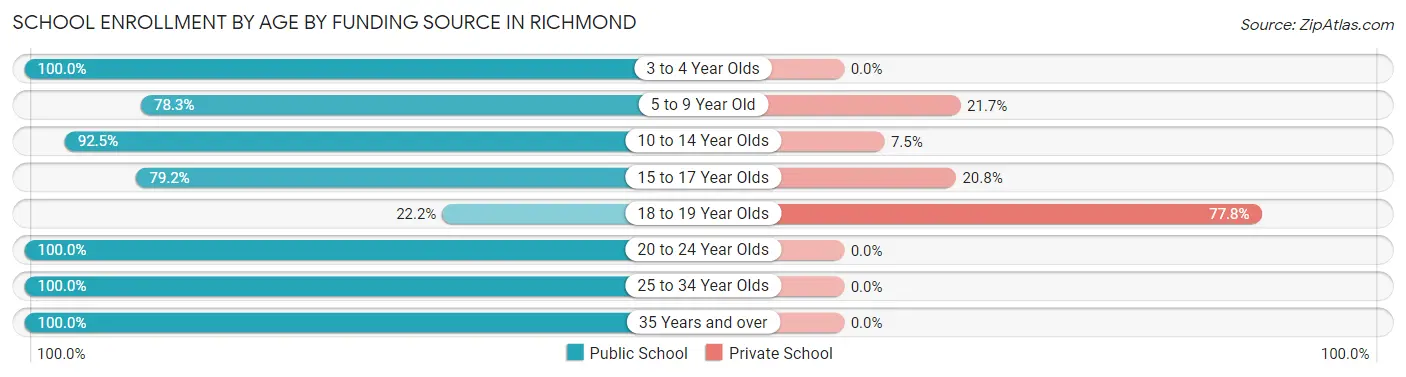
| Age Bracket | Public School | Private School |
| 3 to 4 Year Olds | 12 (100.0%) | 0 (0.0%) |
| 5 to 9 Year Old | 65 (78.3%) | 18 (21.7%) |
| 10 to 14 Year Olds | 74 (92.5%) | 6 (7.5%) |
| 15 to 17 Year Olds | 38 (79.2%) | 10 (20.8%) |
| 18 to 19 Year Olds | 4 (22.2%) | 14 (77.8%) |
| 20 to 24 Year Olds | 18 (100.0%) | 0 (0.0%) |
| 25 to 34 Year Olds | 2 (100.0%) | 0 (0.0%) |
| 35 Years and over | 9 (100.0%) | 0 (0.0%) |
| Total | 222 (82.2%) | 48 (17.8%) |
Educational Attainment by Field of Study in Richmond
Business (54 | 29.7%), education (35 | 19.2%), computers & mathematics (21 | 11.5%), science & technology (14 | 7.7%), and bio, nature & agricultural (13 | 7.1%) are the most common fields of study among 182 individuals in Richmond who have obtained a bachelor's degree or higher.
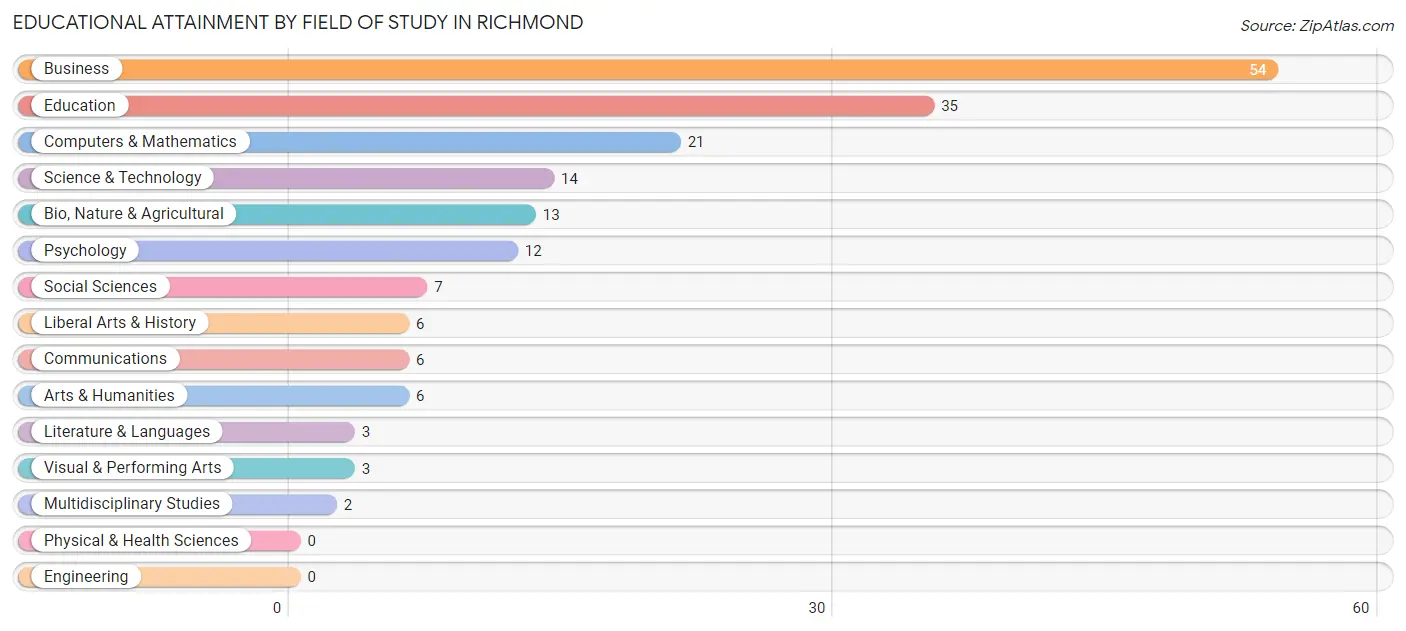
| Field of Study | # Graduates | % Graduates |
| Computers & Mathematics | 21 | 11.5% |
| Bio, Nature & Agricultural | 13 | 7.1% |
| Physical & Health Sciences | 0 | 0.0% |
| Psychology | 12 | 6.6% |
| Social Sciences | 7 | 3.8% |
| Engineering | 0 | 0.0% |
| Multidisciplinary Studies | 2 | 1.1% |
| Science & Technology | 14 | 7.7% |
| Business | 54 | 29.7% |
| Education | 35 | 19.2% |
| Literature & Languages | 3 | 1.7% |
| Liberal Arts & History | 6 | 3.3% |
| Visual & Performing Arts | 3 | 1.7% |
| Communications | 6 | 3.3% |
| Arts & Humanities | 6 | 3.3% |
| Total | 182 | 100.0% |
Transportation & Commute in Richmond
Vehicle Availability by Sex in Richmond
The most prevalent vehicle ownership categories in Richmond are males with 2 vehicles (165, accounting for 43.4%) and females with 2 vehicles (129, making up 47.5%).
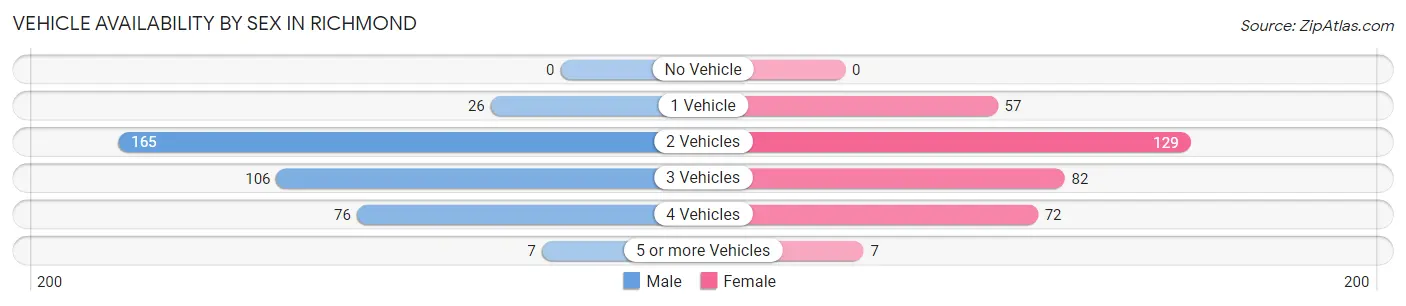
| Vehicles Available | Male | Female |
| No Vehicle | 0 (0.0%) | 0 (0.0%) |
| 1 Vehicle | 26 (6.8%) | 57 (16.4%) |
| 2 Vehicles | 165 (43.4%) | 129 (37.2%) |
| 3 Vehicles | 106 (27.9%) | 82 (23.6%) |
| 4 Vehicles | 76 (20.0%) | 72 (20.7%) |
| 5 or more Vehicles | 7 (1.8%) | 7 (2.0%) |
| Total | 380 (100.0%) | 347 (100.0%) |
Commute Time in Richmond
The most frequently occuring commute durations in Richmond are 5 to 9 minutes (145 commuters, 22.1%), 10 to 14 minutes (97 commuters, 14.8%), and 15 to 19 minutes (89 commuters, 13.6%).
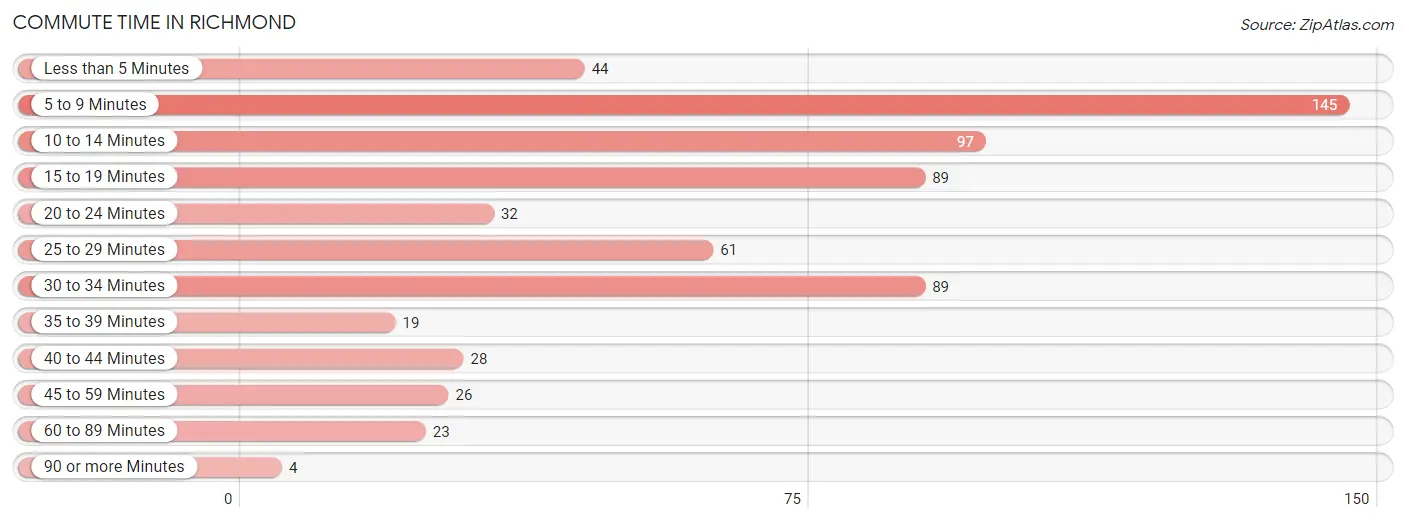
| Commute Time | # Commuters | % Commuters |
| Less than 5 Minutes | 44 | 6.7% |
| 5 to 9 Minutes | 145 | 22.1% |
| 10 to 14 Minutes | 97 | 14.8% |
| 15 to 19 Minutes | 89 | 13.6% |
| 20 to 24 Minutes | 32 | 4.9% |
| 25 to 29 Minutes | 61 | 9.3% |
| 30 to 34 Minutes | 89 | 13.6% |
| 35 to 39 Minutes | 19 | 2.9% |
| 40 to 44 Minutes | 28 | 4.3% |
| 45 to 59 Minutes | 26 | 4.0% |
| 60 to 89 Minutes | 23 | 3.5% |
| 90 or more Minutes | 4 | 0.6% |
Commute Time by Sex in Richmond
The most common commute times in Richmond are 15 to 19 minutes (64 commuters, 17.6%) for males and 5 to 9 minutes (99 commuters, 33.8%) for females.
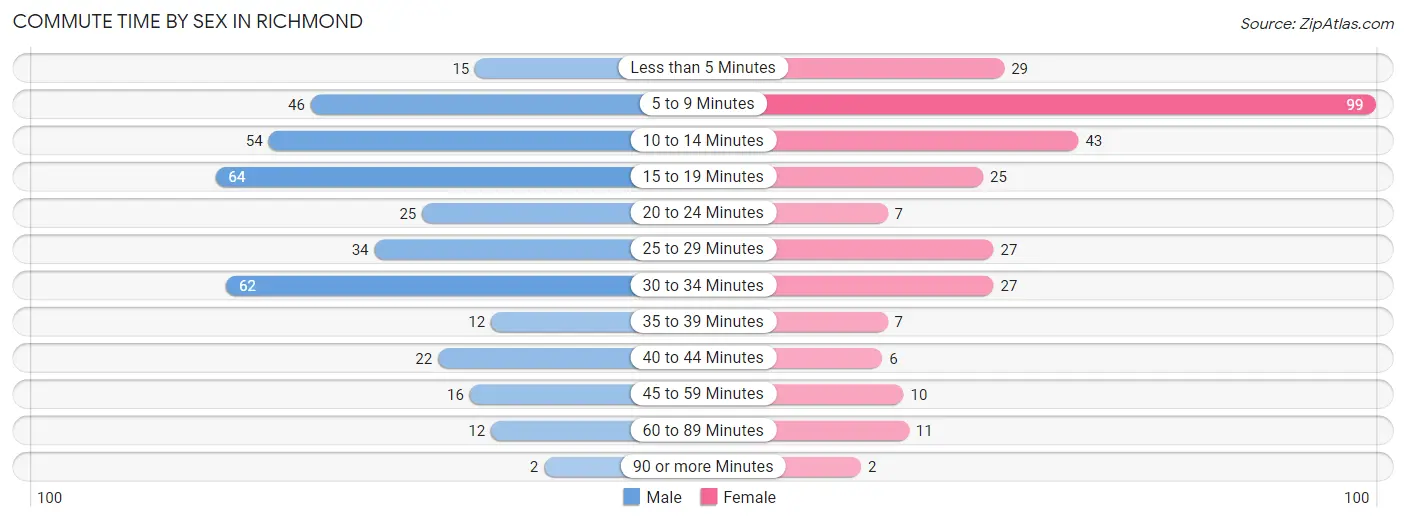
| Commute Time | Male | Female |
| Less than 5 Minutes | 15 (4.1%) | 29 (9.9%) |
| 5 to 9 Minutes | 46 (12.6%) | 99 (33.8%) |
| 10 to 14 Minutes | 54 (14.8%) | 43 (14.7%) |
| 15 to 19 Minutes | 64 (17.6%) | 25 (8.5%) |
| 20 to 24 Minutes | 25 (6.9%) | 7 (2.4%) |
| 25 to 29 Minutes | 34 (9.3%) | 27 (9.2%) |
| 30 to 34 Minutes | 62 (17.0%) | 27 (9.2%) |
| 35 to 39 Minutes | 12 (3.3%) | 7 (2.4%) |
| 40 to 44 Minutes | 22 (6.0%) | 6 (2.1%) |
| 45 to 59 Minutes | 16 (4.4%) | 10 (3.4%) |
| 60 to 89 Minutes | 12 (3.3%) | 11 (3.7%) |
| 90 or more Minutes | 2 (0.5%) | 2 (0.7%) |
Time of Departure to Work by Sex in Richmond
The most frequent times of departure to work in Richmond are 6:00 AM to 6:29 AM (67, 18.4%) for males and 12:00 PM to 3:59 PM (49, 16.7%) for females.
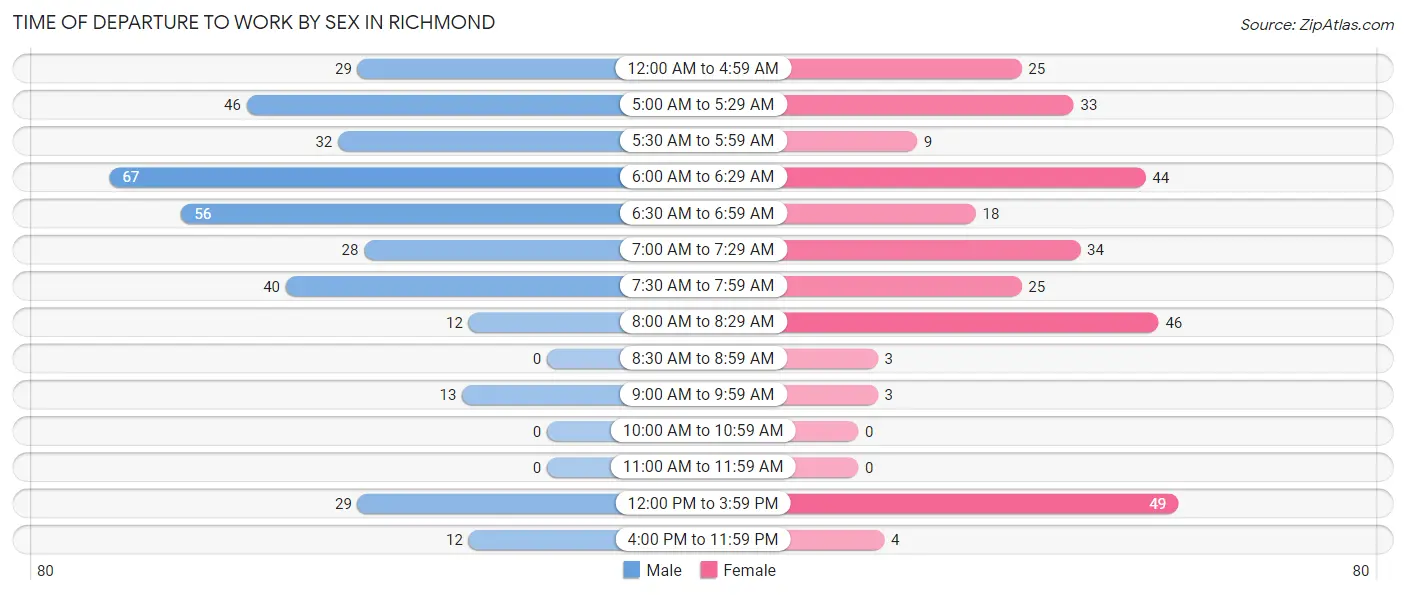
| Time of Departure | Male | Female |
| 12:00 AM to 4:59 AM | 29 (8.0%) | 25 (8.5%) |
| 5:00 AM to 5:29 AM | 46 (12.6%) | 33 (11.3%) |
| 5:30 AM to 5:59 AM | 32 (8.8%) | 9 (3.1%) |
| 6:00 AM to 6:29 AM | 67 (18.4%) | 44 (15.0%) |
| 6:30 AM to 6:59 AM | 56 (15.4%) | 18 (6.1%) |
| 7:00 AM to 7:29 AM | 28 (7.7%) | 34 (11.6%) |
| 7:30 AM to 7:59 AM | 40 (11.0%) | 25 (8.5%) |
| 8:00 AM to 8:29 AM | 12 (3.3%) | 46 (15.7%) |
| 8:30 AM to 8:59 AM | 0 (0.0%) | 3 (1.0%) |
| 9:00 AM to 9:59 AM | 13 (3.6%) | 3 (1.0%) |
| 10:00 AM to 10:59 AM | 0 (0.0%) | 0 (0.0%) |
| 11:00 AM to 11:59 AM | 0 (0.0%) | 0 (0.0%) |
| 12:00 PM to 3:59 PM | 29 (8.0%) | 49 (16.7%) |
| 4:00 PM to 11:59 PM | 12 (3.3%) | 4 (1.4%) |
| Total | 364 (100.0%) | 293 (100.0%) |
Housing Occupancy in Richmond
Occupancy by Ownership in Richmond
Of the total 542 dwellings in Richmond, owner-occupied units account for 474 (87.5%), while renter-occupied units make up 68 (12.6%).

| Occupancy | # Housing Units | % Housing Units |
| Owner Occupied Housing Units | 474 | 87.5% |
| Renter-Occupied Housing Units | 68 | 12.6% |
| Total Occupied Housing Units | 542 | 100.0% |
Occupancy by Household Size in Richmond
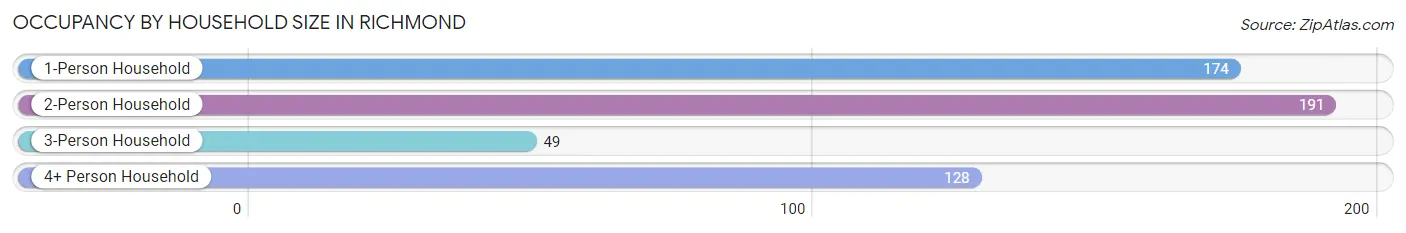
| Household Size | # Housing Units | % Housing Units |
| 1-Person Household | 174 | 32.1% |
| 2-Person Household | 191 | 35.2% |
| 3-Person Household | 49 | 9.0% |
| 4+ Person Household | 128 | 23.6% |
| Total Housing Units | 542 | 100.0% |
Occupancy by Ownership by Household Size in Richmond
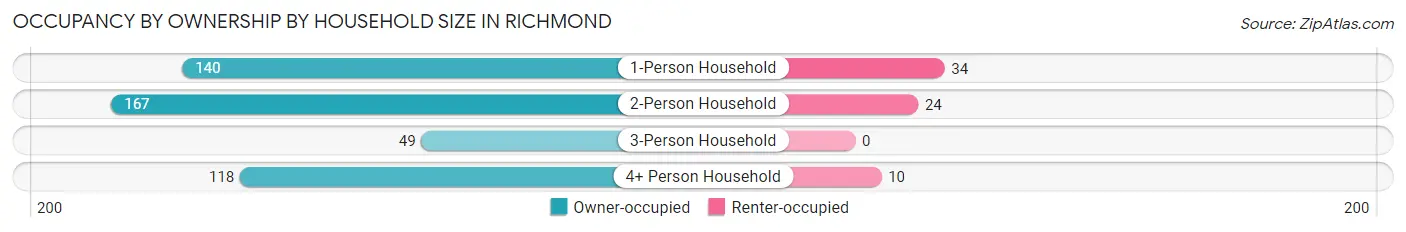
| Household Size | Owner-occupied | Renter-occupied |
| 1-Person Household | 140 (80.5%) | 34 (19.5%) |
| 2-Person Household | 167 (87.4%) | 24 (12.6%) |
| 3-Person Household | 49 (100.0%) | 0 (0.0%) |
| 4+ Person Household | 118 (92.2%) | 10 (7.8%) |
| Total Housing Units | 474 (87.5%) | 68 (12.6%) |
Occupancy by Educational Attainment in Richmond
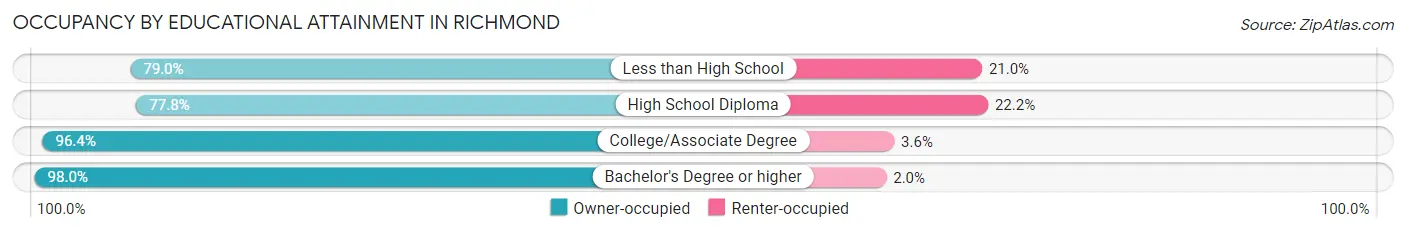
| Household Size | Owner-occupied | Renter-occupied |
| Less than High School | 49 (79.0%) | 13 (21.0%) |
| High School Diploma | 165 (77.8%) | 47 (22.2%) |
| College/Associate Degree | 162 (96.4%) | 6 (3.6%) |
| Bachelor's Degree or higher | 98 (98.0%) | 2 (2.0%) |
Occupancy by Age of Householder in Richmond
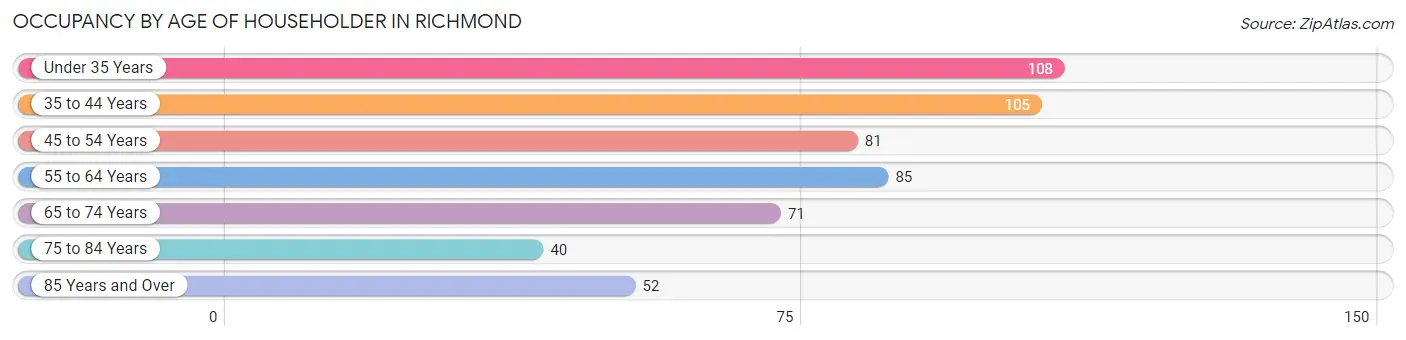
| Age Bracket | # Households | % Households |
| Under 35 Years | 108 | 19.9% |
| 35 to 44 Years | 105 | 19.4% |
| 45 to 54 Years | 81 | 14.9% |
| 55 to 64 Years | 85 | 15.7% |
| 65 to 74 Years | 71 | 13.1% |
| 75 to 84 Years | 40 | 7.4% |
| 85 Years and Over | 52 | 9.6% |
| Total | 542 | 100.0% |
Housing Finances in Richmond
Median Income by Occupancy in Richmond
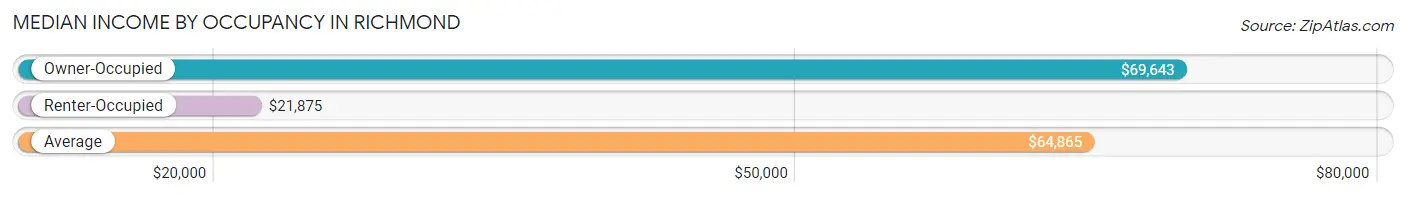
| Occupancy Type | # Households | Median Income |
| Owner-Occupied | 474 (87.5%) | $69,643 |
| Renter-Occupied | 68 (12.6%) | $21,875 |
| Average | 542 (100.0%) | $64,865 |
Occupancy by Householder Income Bracket in Richmond
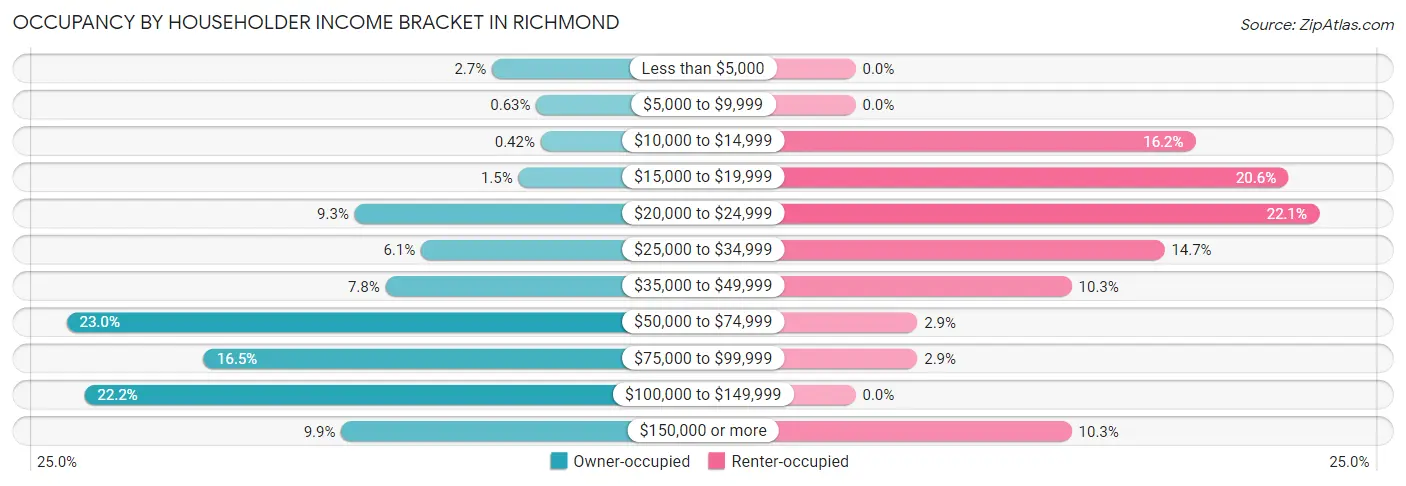
| Income Bracket | Owner-occupied | Renter-occupied |
| Less than $5,000 | 13 (2.7%) | 0 (0.0%) |
| $5,000 to $9,999 | 3 (0.6%) | 0 (0.0%) |
| $10,000 to $14,999 | 2 (0.4%) | 11 (16.2%) |
| $15,000 to $19,999 | 7 (1.5%) | 14 (20.6%) |
| $20,000 to $24,999 | 44 (9.3%) | 15 (22.1%) |
| $25,000 to $34,999 | 29 (6.1%) | 10 (14.7%) |
| $35,000 to $49,999 | 37 (7.8%) | 7 (10.3%) |
| $50,000 to $74,999 | 109 (23.0%) | 2 (2.9%) |
| $75,000 to $99,999 | 78 (16.5%) | 2 (2.9%) |
| $100,000 to $149,999 | 105 (22.2%) | 0 (0.0%) |
| $150,000 or more | 47 (9.9%) | 7 (10.3%) |
| Total | 474 (100.0%) | 68 (100.0%) |
Monthly Housing Cost Tiers in Richmond
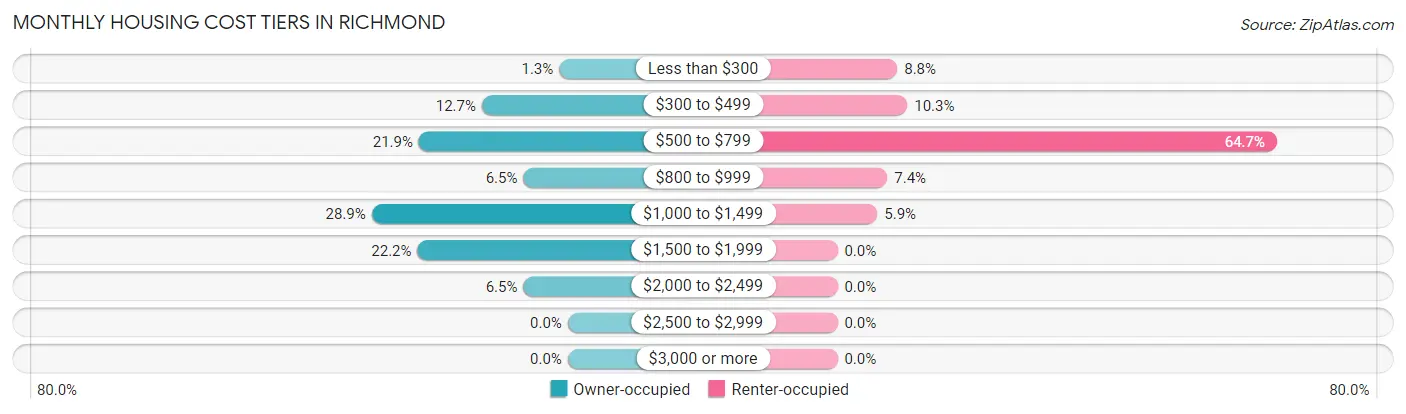
| Monthly Cost | Owner-occupied | Renter-occupied |
| Less than $300 | 6 (1.3%) | 6 (8.8%) |
| $300 to $499 | 60 (12.7%) | 7 (10.3%) |
| $500 to $799 | 104 (21.9%) | 44 (64.7%) |
| $800 to $999 | 31 (6.5%) | 5 (7.3%) |
| $1,000 to $1,499 | 137 (28.9%) | 4 (5.9%) |
| $1,500 to $1,999 | 105 (22.2%) | 0 (0.0%) |
| $2,000 to $2,499 | 31 (6.5%) | 0 (0.0%) |
| $2,500 to $2,999 | 0 (0.0%) | 0 (0.0%) |
| $3,000 or more | 0 (0.0%) | 0 (0.0%) |
| Total | 474 (100.0%) | 68 (100.0%) |
Physical Housing Characteristics in Richmond
Housing Structures in Richmond
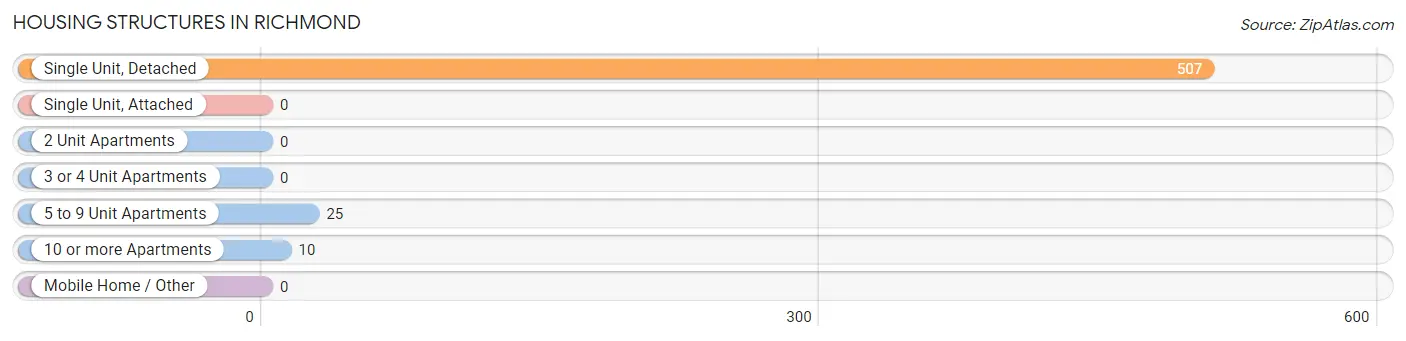
| Structure Type | # Housing Units | % Housing Units |
| Single Unit, Detached | 507 | 93.5% |
| Single Unit, Attached | 0 | 0.0% |
| 2 Unit Apartments | 0 | 0.0% |
| 3 or 4 Unit Apartments | 0 | 0.0% |
| 5 to 9 Unit Apartments | 25 | 4.6% |
| 10 or more Apartments | 10 | 1.8% |
| Mobile Home / Other | 0 | 0.0% |
| Total | 542 | 100.0% |
Housing Structures by Occupancy in Richmond
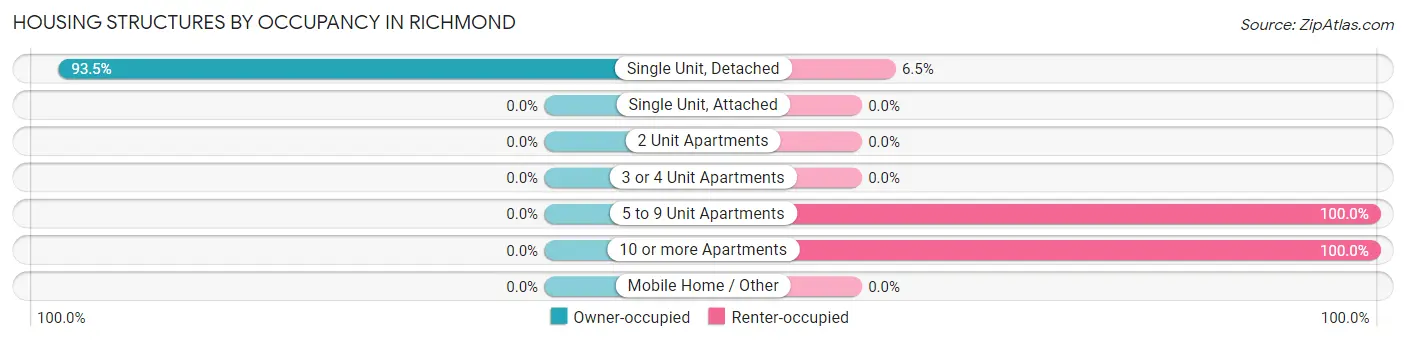
| Structure Type | Owner-occupied | Renter-occupied |
| Single Unit, Detached | 474 (93.5%) | 33 (6.5%) |
| Single Unit, Attached | 0 (0.0%) | 0 (0.0%) |
| 2 Unit Apartments | 0 (0.0%) | 0 (0.0%) |
| 3 or 4 Unit Apartments | 0 (0.0%) | 0 (0.0%) |
| 5 to 9 Unit Apartments | 0 (0.0%) | 25 (100.0%) |
| 10 or more Apartments | 0 (0.0%) | 10 (100.0%) |
| Mobile Home / Other | 0 (0.0%) | 0 (0.0%) |
| Total | 474 (87.5%) | 68 (12.6%) |
Housing Structures by Number of Rooms in Richmond
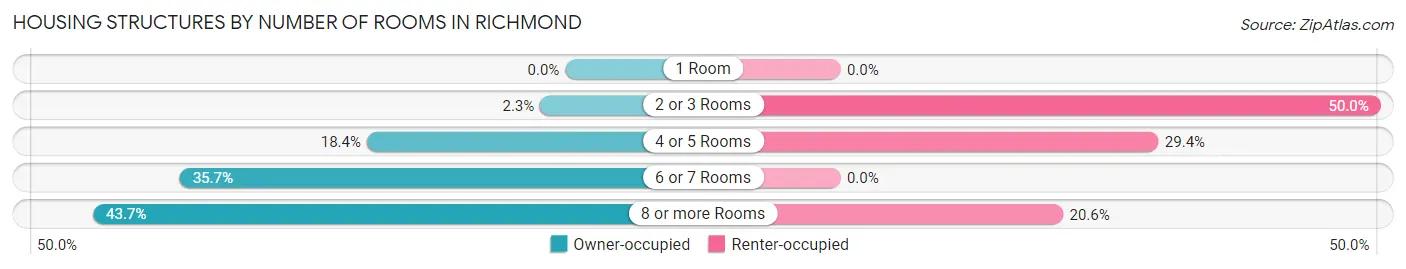
| Number of Rooms | Owner-occupied | Renter-occupied |
| 1 Room | 0 (0.0%) | 0 (0.0%) |
| 2 or 3 Rooms | 11 (2.3%) | 34 (50.0%) |
| 4 or 5 Rooms | 87 (18.3%) | 20 (29.4%) |
| 6 or 7 Rooms | 169 (35.6%) | 0 (0.0%) |
| 8 or more Rooms | 207 (43.7%) | 14 (20.6%) |
| Total | 474 (100.0%) | 68 (100.0%) |
Housing Structure by Heating Type in Richmond
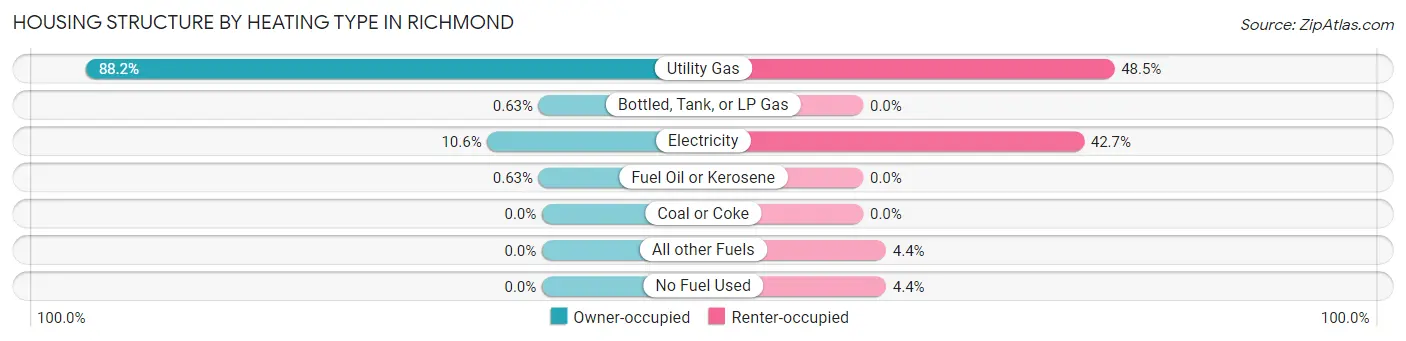
| Heating Type | Owner-occupied | Renter-occupied |
| Utility Gas | 418 (88.2%) | 33 (48.5%) |
| Bottled, Tank, or LP Gas | 3 (0.6%) | 0 (0.0%) |
| Electricity | 50 (10.5%) | 29 (42.6%) |
| Fuel Oil or Kerosene | 3 (0.6%) | 0 (0.0%) |
| Coal or Coke | 0 (0.0%) | 0 (0.0%) |
| All other Fuels | 0 (0.0%) | 3 (4.4%) |
| No Fuel Used | 0 (0.0%) | 3 (4.4%) |
| Total | 474 (100.0%) | 68 (100.0%) |
Household Vehicle Usage in Richmond
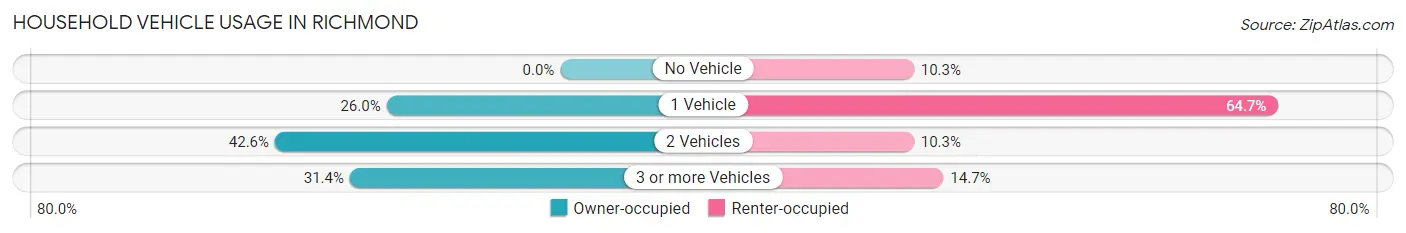
| Vehicles per Household | Owner-occupied | Renter-occupied |
| No Vehicle | 0 (0.0%) | 7 (10.3%) |
| 1 Vehicle | 123 (26.0%) | 44 (64.7%) |
| 2 Vehicles | 202 (42.6%) | 7 (10.3%) |
| 3 or more Vehicles | 149 (31.4%) | 10 (14.7%) |
| Total | 474 (100.0%) | 68 (100.0%) |
Real Estate & Mortgages in Richmond
Real Estate and Mortgage Overview in Richmond
| Characteristic | Without Mortgage | With Mortgage |
| Housing Units | 164 | 310 |
| Median Property Value | $210,000 | $216,900 |
| Median Household Income | $38,750 | $32 |
| Monthly Housing Costs | $537 | $0 |
| Real Estate Taxes | $2,321 | $5 |
Property Value by Mortgage Status in Richmond
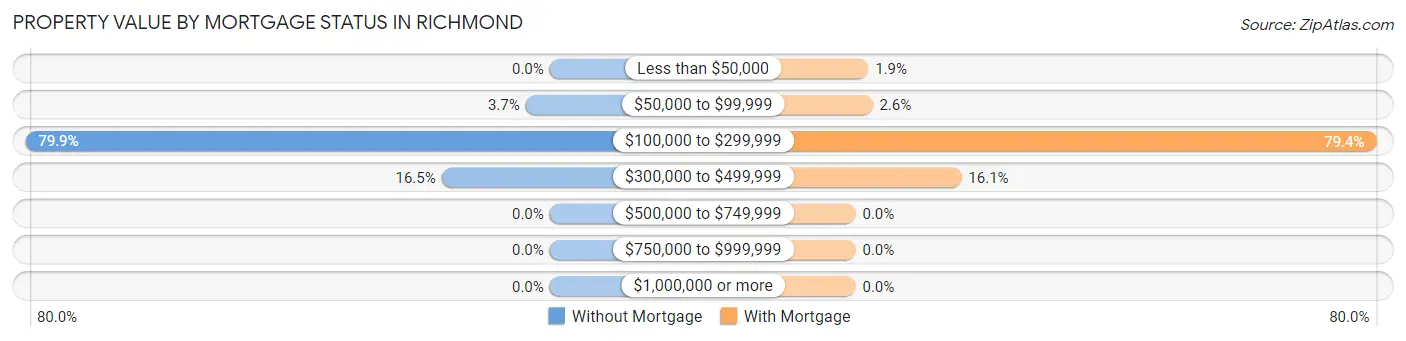
| Property Value | Without Mortgage | With Mortgage |
| Less than $50,000 | 0 (0.0%) | 6 (1.9%) |
| $50,000 to $99,999 | 6 (3.7%) | 8 (2.6%) |
| $100,000 to $299,999 | 131 (79.9%) | 246 (79.3%) |
| $300,000 to $499,999 | 27 (16.5%) | 50 (16.1%) |
| $500,000 to $749,999 | 0 (0.0%) | 0 (0.0%) |
| $750,000 to $999,999 | 0 (0.0%) | 0 (0.0%) |
| $1,000,000 or more | 0 (0.0%) | 0 (0.0%) |
| Total | 164 (100.0%) | 310 (100.0%) |
Household Income by Mortgage Status in Richmond
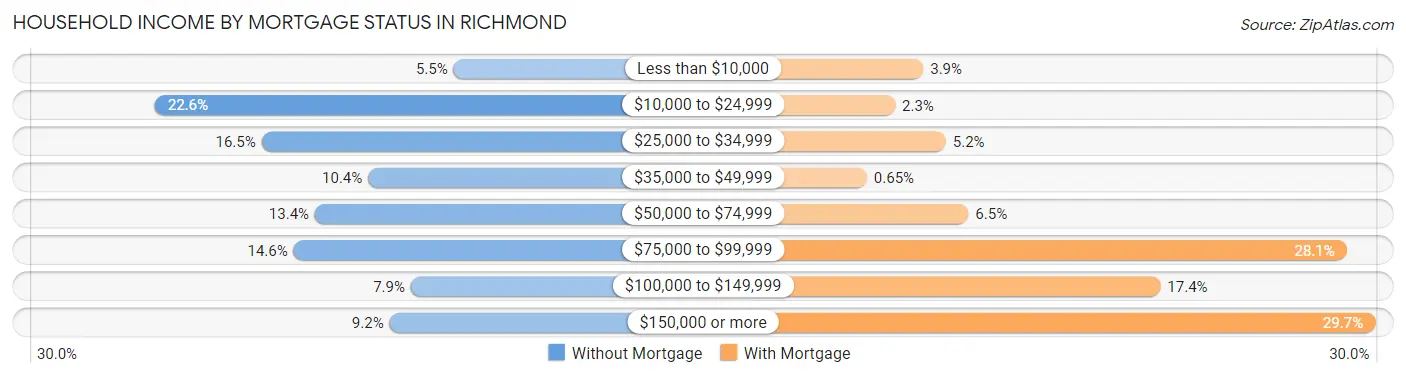
| Household Income | Without Mortgage | With Mortgage |
| Less than $10,000 | 9 (5.5%) | 12 (3.9%) |
| $10,000 to $24,999 | 37 (22.6%) | 7 (2.3%) |
| $25,000 to $34,999 | 27 (16.5%) | 16 (5.2%) |
| $35,000 to $49,999 | 17 (10.4%) | 2 (0.6%) |
| $50,000 to $74,999 | 22 (13.4%) | 20 (6.5%) |
| $75,000 to $99,999 | 24 (14.6%) | 87 (28.1%) |
| $100,000 to $149,999 | 13 (7.9%) | 54 (17.4%) |
| $150,000 or more | 15 (9.1%) | 92 (29.7%) |
| Total | 164 (100.0%) | 310 (100.0%) |
Property Value to Household Income Ratio in Richmond
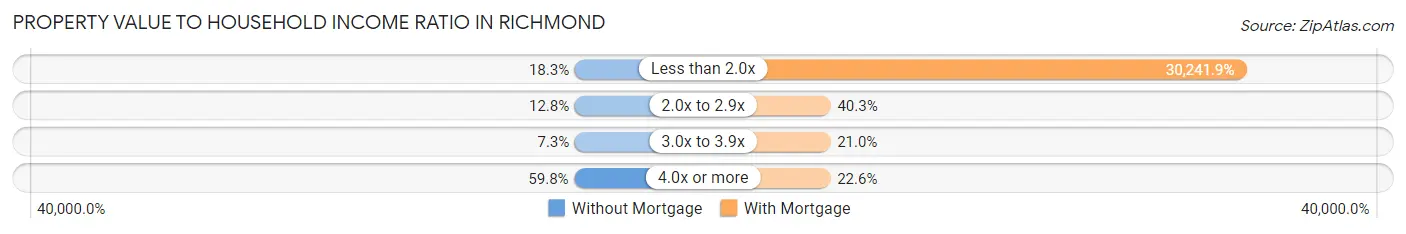
| Value-to-Income Ratio | Without Mortgage | With Mortgage |
| Less than 2.0x | 30 (18.3%) | 93,750 (30,241.9%) |
| 2.0x to 2.9x | 21 (12.8%) | 125 (40.3%) |
| 3.0x to 3.9x | 12 (7.3%) | 65 (21.0%) |
| 4.0x or more | 98 (59.8%) | 70 (22.6%) |
| Total | 164 (100.0%) | 310 (100.0%) |
Real Estate Taxes by Mortgage Status in Richmond
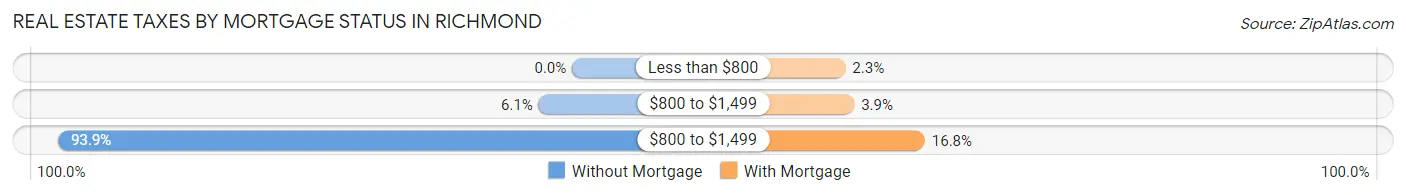
| Property Taxes | Without Mortgage | With Mortgage |
| Less than $800 | 0 (0.0%) | 7 (2.3%) |
| $800 to $1,499 | 10 (6.1%) | 12 (3.9%) |
| $800 to $1,499 | 154 (93.9%) | 52 (16.8%) |
| Total | 164 (100.0%) | 310 (100.0%) |
Health & Disability in Richmond
Health Insurance Coverage by Age in Richmond
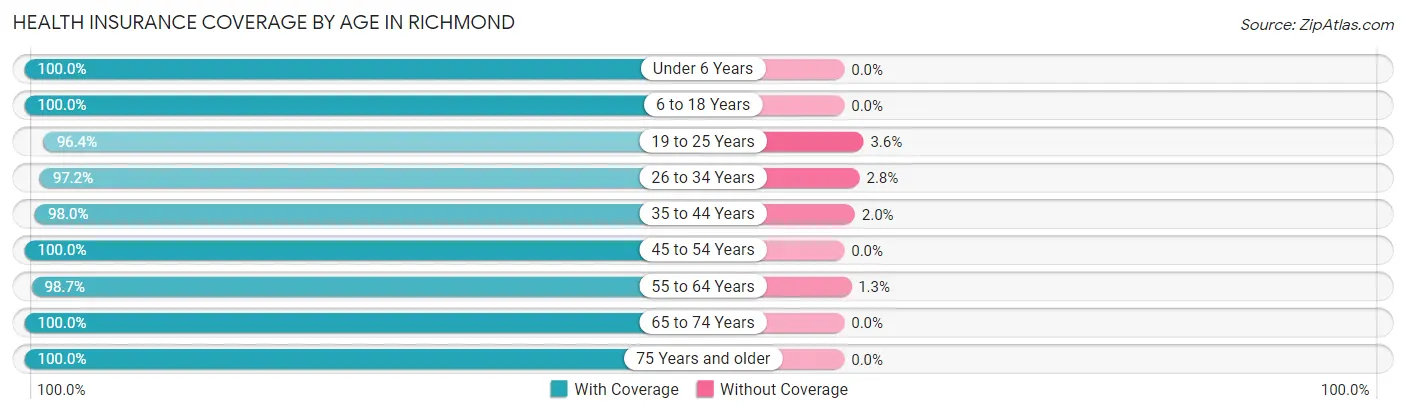
| Age Bracket | With Coverage | Without Coverage |
| Under 6 Years | 105 (100.0%) | 0 (0.0%) |
| 6 to 18 Years | 243 (100.0%) | 0 (0.0%) |
| 19 to 25 Years | 108 (96.4%) | 4 (3.6%) |
| 26 to 34 Years | 171 (97.2%) | 5 (2.8%) |
| 35 to 44 Years | 149 (98.0%) | 3 (2.0%) |
| 45 to 54 Years | 144 (100.0%) | 0 (0.0%) |
| 55 to 64 Years | 153 (98.7%) | 2 (1.3%) |
| 65 to 74 Years | 112 (100.0%) | 0 (0.0%) |
| 75 Years and older | 117 (100.0%) | 0 (0.0%) |
| Total | 1,302 (98.9%) | 14 (1.1%) |
Health Insurance Coverage by Citizenship Status in Richmond
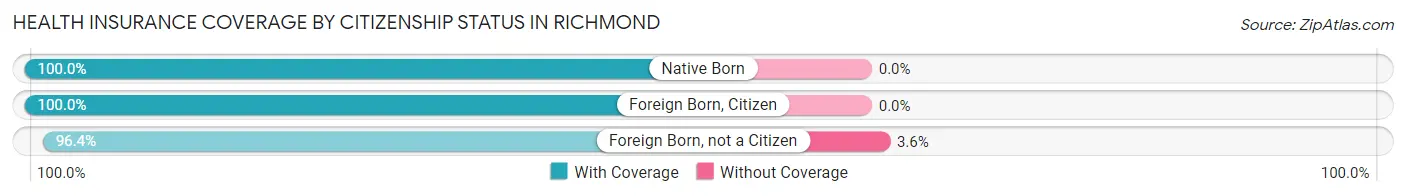
| Citizenship Status | With Coverage | Without Coverage |
| Native Born | 105 (100.0%) | 0 (0.0%) |
| Foreign Born, Citizen | 243 (100.0%) | 0 (0.0%) |
| Foreign Born, not a Citizen | 108 (96.4%) | 4 (3.6%) |
Health Insurance Coverage by Household Income in Richmond
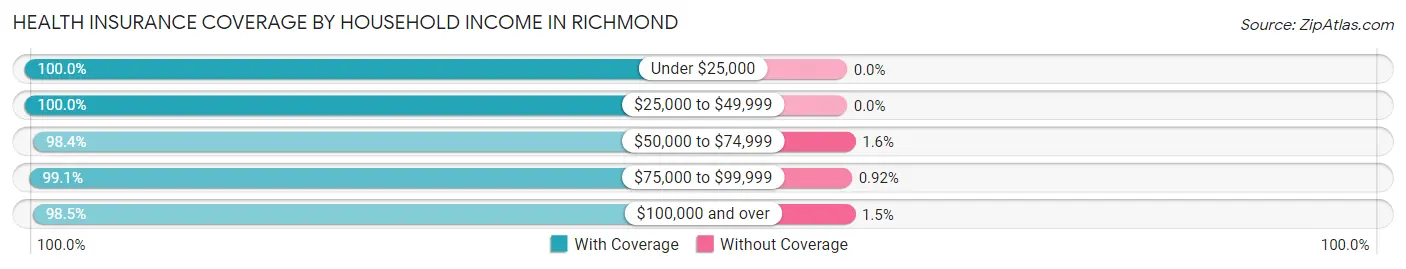
| Household Income | With Coverage | Without Coverage |
| Under $25,000 | 174 (100.0%) | 0 (0.0%) |
| $25,000 to $49,999 | 147 (100.0%) | 0 (0.0%) |
| $50,000 to $74,999 | 248 (98.4%) | 4 (1.6%) |
| $75,000 to $99,999 | 215 (99.1%) | 2 (0.9%) |
| $100,000 and over | 514 (98.5%) | 8 (1.5%) |
Public vs Private Health Insurance Coverage by Age in Richmond
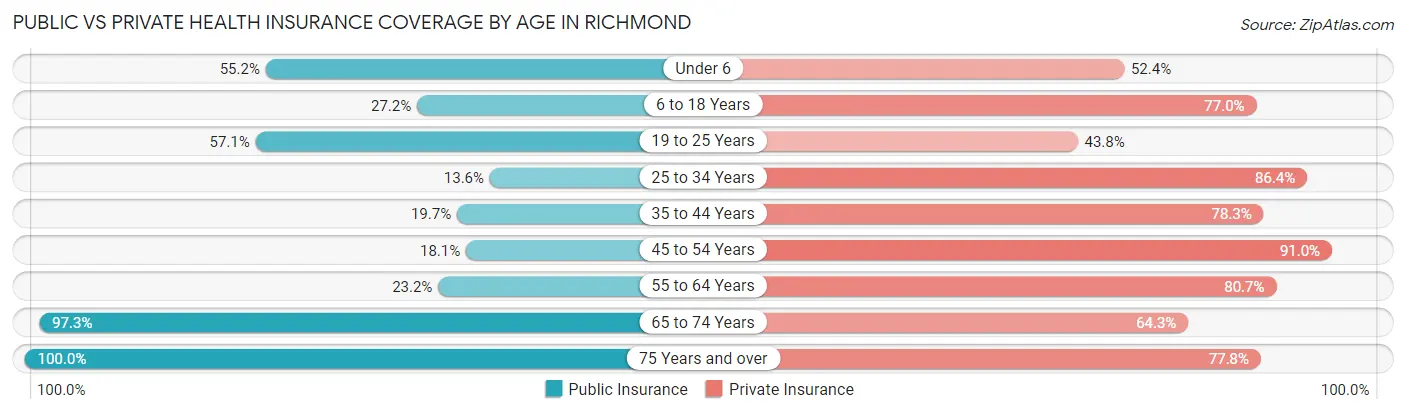
| Age Bracket | Public Insurance | Private Insurance |
| Under 6 | 58 (55.2%) | 55 (52.4%) |
| 6 to 18 Years | 66 (27.2%) | 187 (76.9%) |
| 19 to 25 Years | 64 (57.1%) | 49 (43.8%) |
| 25 to 34 Years | 24 (13.6%) | 152 (86.4%) |
| 35 to 44 Years | 30 (19.7%) | 119 (78.3%) |
| 45 to 54 Years | 26 (18.1%) | 131 (91.0%) |
| 55 to 64 Years | 36 (23.2%) | 125 (80.6%) |
| 65 to 74 Years | 109 (97.3%) | 72 (64.3%) |
| 75 Years and over | 117 (100.0%) | 91 (77.8%) |
| Total | 530 (40.3%) | 981 (74.5%) |
Disability Status by Sex by Age in Richmond
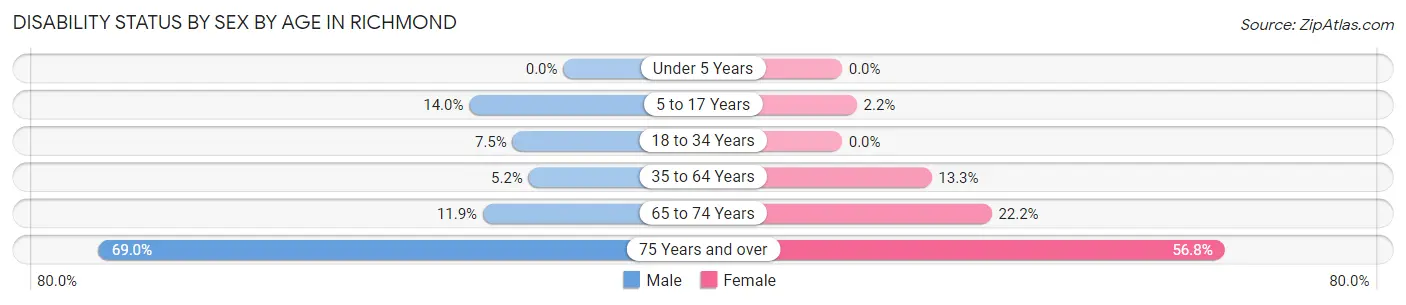
| Age Bracket | Male | Female |
| Under 5 Years | 0 (0.0%) | 0 (0.0%) |
| 5 to 17 Years | 19 (14.0%) | 2 (2.2%) |
| 18 to 34 Years | 11 (7.5%) | 0 (0.0%) |
| 35 to 64 Years | 12 (5.1%) | 29 (13.3%) |
| 65 to 74 Years | 8 (11.9%) | 10 (22.2%) |
| 75 Years and over | 20 (69.0%) | 50 (56.8%) |
Disability Class by Sex by Age in Richmond
Disability Class: Hearing Difficulty
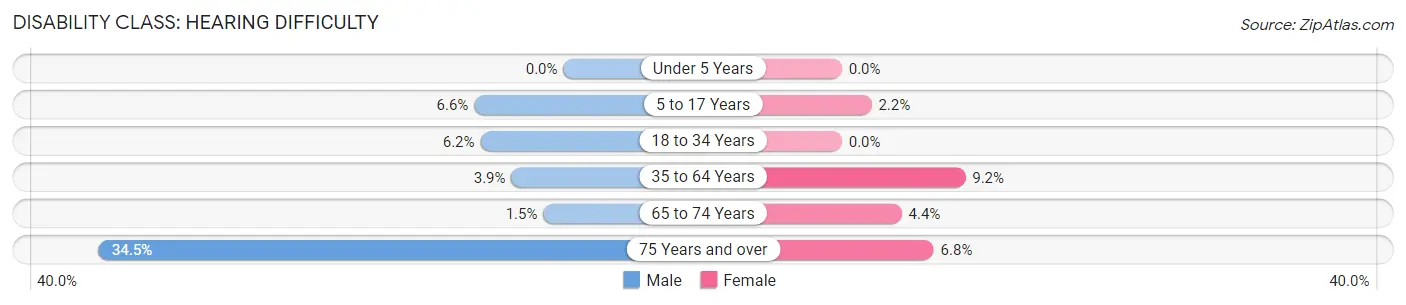
| Age Bracket | Male | Female |
| Under 5 Years | 0 (0.0%) | 0 (0.0%) |
| 5 to 17 Years | 9 (6.6%) | 2 (2.2%) |
| 18 to 34 Years | 9 (6.2%) | 0 (0.0%) |
| 35 to 64 Years | 9 (3.9%) | 20 (9.2%) |
| 65 to 74 Years | 1 (1.5%) | 2 (4.4%) |
| 75 Years and over | 10 (34.5%) | 6 (6.8%) |
Disability Class: Vision Difficulty
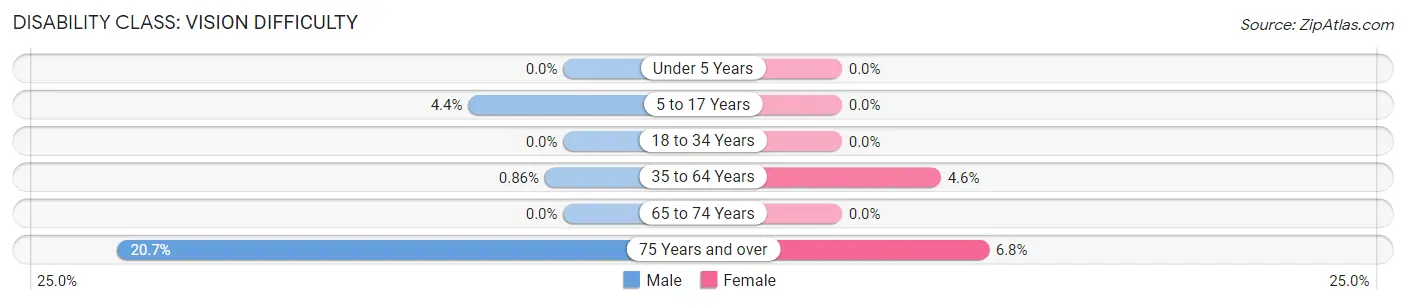
| Age Bracket | Male | Female |
| Under 5 Years | 0 (0.0%) | 0 (0.0%) |
| 5 to 17 Years | 6 (4.4%) | 0 (0.0%) |
| 18 to 34 Years | 0 (0.0%) | 0 (0.0%) |
| 35 to 64 Years | 2 (0.9%) | 10 (4.6%) |
| 65 to 74 Years | 0 (0.0%) | 0 (0.0%) |
| 75 Years and over | 6 (20.7%) | 6 (6.8%) |
Disability Class: Cognitive Difficulty
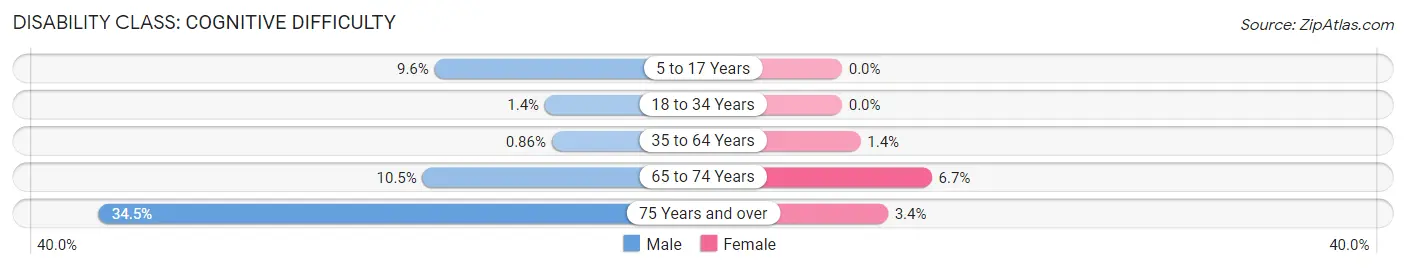
| Age Bracket | Male | Female |
| 5 to 17 Years | 13 (9.6%) | 0 (0.0%) |
| 18 to 34 Years | 2 (1.4%) | 0 (0.0%) |
| 35 to 64 Years | 2 (0.9%) | 3 (1.4%) |
| 65 to 74 Years | 7 (10.4%) | 3 (6.7%) |
| 75 Years and over | 10 (34.5%) | 3 (3.4%) |
Disability Class: Ambulatory Difficulty
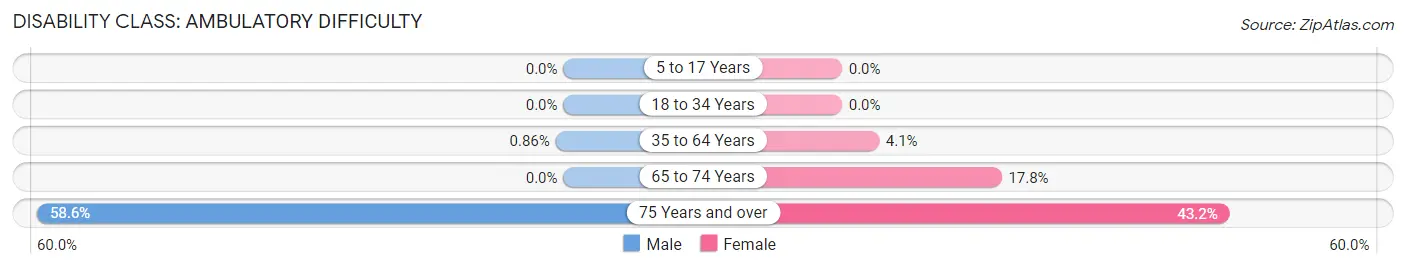
| Age Bracket | Male | Female |
| 5 to 17 Years | 0 (0.0%) | 0 (0.0%) |
| 18 to 34 Years | 0 (0.0%) | 0 (0.0%) |
| 35 to 64 Years | 2 (0.9%) | 9 (4.1%) |
| 65 to 74 Years | 0 (0.0%) | 8 (17.8%) |
| 75 Years and over | 17 (58.6%) | 38 (43.2%) |
Disability Class: Self-Care Difficulty
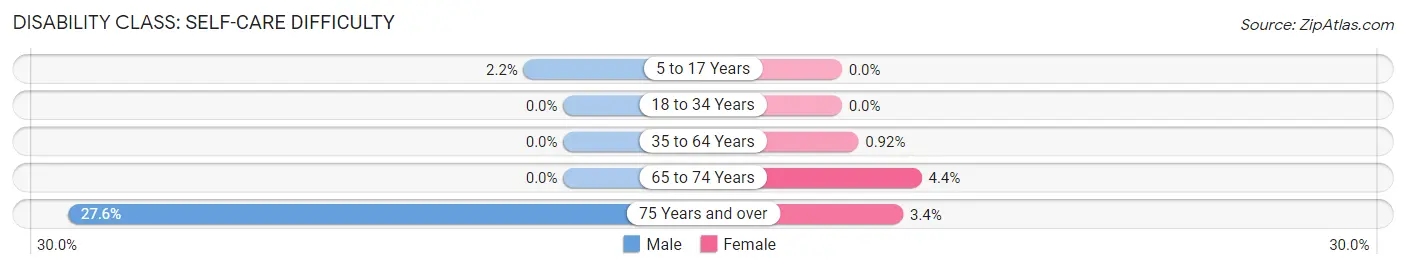
| Age Bracket | Male | Female |
| 5 to 17 Years | 3 (2.2%) | 0 (0.0%) |
| 18 to 34 Years | 0 (0.0%) | 0 (0.0%) |
| 35 to 64 Years | 0 (0.0%) | 2 (0.9%) |
| 65 to 74 Years | 0 (0.0%) | 2 (4.4%) |
| 75 Years and over | 8 (27.6%) | 3 (3.4%) |
Technology Access in Richmond
Computing Device Access in Richmond
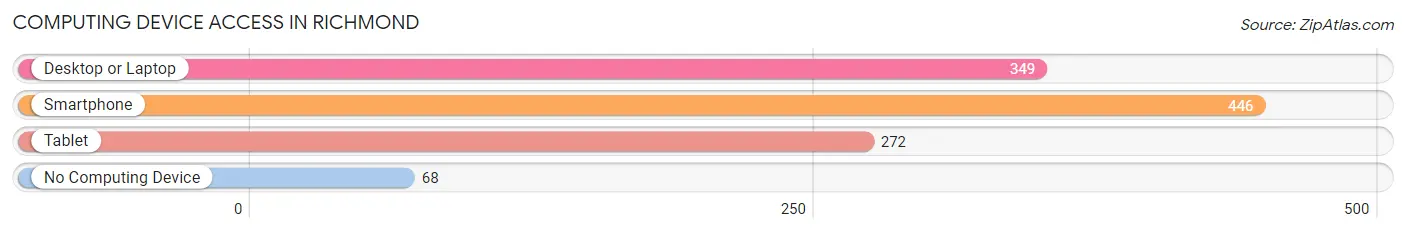
| Device Type | # Households | % Households |
| Desktop or Laptop | 349 | 64.4% |
| Smartphone | 446 | 82.3% |
| Tablet | 272 | 50.2% |
| No Computing Device | 68 | 12.6% |
| Total | 542 | 100.0% |
Internet Access in Richmond
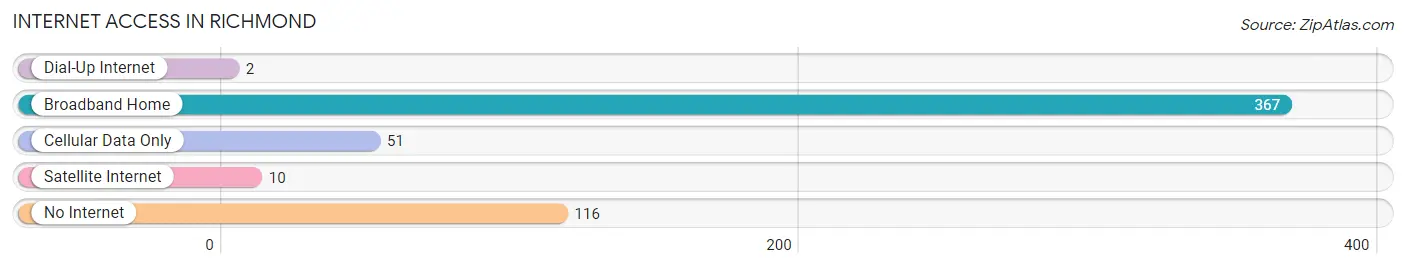
| Internet Type | # Households | % Households |
| Dial-Up Internet | 2 | 0.4% |
| Broadband Home | 367 | 67.7% |
| Cellular Data Only | 51 | 9.4% |
| Satellite Internet | 10 | 1.8% |
| No Internet | 116 | 21.4% |
| Total | 542 | 100.0% |
Richmond Summary
Richmond, Minnesota is a small city located in Stearns County, Minnesota, United States. It is situated on the banks of the Sauk River, approximately 20 miles northwest of St. Cloud. The city has a population of 1,845 as of the 2010 census.
History
Richmond was first settled in 1856 by a group of German immigrants. The city was named after Richmond, Virginia, and was incorporated in 1887. The city was originally a farming community, but in the early 1900s, the city began to develop into a manufacturing center. The city was home to a number of factories, including a flour mill, a creamery, a furniture factory, and a canning factory.
Geography
Richmond is located at the intersection of Minnesota State Highways 23 and 25. The city is situated on the banks of the Sauk River, which flows through the city. The city is located in a rural area, with the nearest large city being St. Cloud, which is approximately 20 miles to the southeast.
Economy
Richmond’s economy is largely based on agriculture and manufacturing. The city is home to a number of factories, including a flour mill, a creamery, a furniture factory, and a canning factory. The city is also home to a number of small businesses, including restaurants, retail stores, and service providers.
Demographics
As of the 2010 census, Richmond had a population of 1,845. The racial makeup of the city was 95.2% White, 0.7% African American, 0.3% Native American, 0.3% Asian, 0.1% Pacific Islander, 1.7% from other races, and 1.9% from two or more races. Hispanic or Latino of any race were 3.2% of the population.
The median income for a household in the city was $41,250, and the median income for a family was $50,000. The per capita income for the city was $20,845. About 8.2% of families and 10.2% of the population were below the poverty line, including 14.2% of those under age 18 and 8.3% of those age 65 or over.
Richmond is served by the Stearns County School District. The city is home to two elementary schools, one middle school, and one high school. The city also has a public library and a number of parks and recreational facilities.
Richmond is a small city with a rich history and a diverse economy. The city is home to a number of factories and small businesses, and is served by the Stearns County School District. The city has a population of 1,845 as of the 2010 census, and the median income for a household in the city was $41,250. Richmond is a great place to live and work, and is a great example of a small city with a lot to offer.
Common Questions
What is Per Capita Income in Richmond?
Per Capita income in Richmond is $31,730.
What is the Median Family Income in Richmond?
Median Family Income in Richmond is $86,250.
What is the Median Household income in Richmond?
Median Household Income in Richmond is $64,865.
What is Income or Wage Gap in Richmond?
Income or Wage Gap in Richmond is 32.8%.
Women in Richmond earn 67.2 cents for every dollar earned by a man.
What is Inequality or Gini Index in Richmond?
Inequality or Gini Index in Richmond is 0.37.
What is the Total Population of Richmond?
Total Population of Richmond is 1,329.
What is the Total Male Population of Richmond?
Total Male Population of Richmond is 644.
What is the Total Female Population of Richmond?
Total Female Population of Richmond is 685.
What is the Ratio of Males per 100 Females in Richmond?
There are 94.01 Males per 100 Females in Richmond.
What is the Ratio of Females per 100 Males in Richmond?
There are 106.37 Females per 100 Males in Richmond.
What is the Median Population Age in Richmond?
Median Population Age in Richmond is 38.3 Years.
What is the Average Family Size in Richmond
Average Family Size in Richmond is 3.0 People.
What is the Average Household Size in Richmond
Average Household Size in Richmond is 2.4 People.
How Large is the Labor Force in Richmond?
There are 767 People in the Labor Forcein in Richmond.
What is the Percentage of People in the Labor Force in Richmond?
72.9% of People are in the Labor Force in Richmond.
What is the Unemployment Rate in Richmond?
Unemployment Rate in Richmond is 1.4%.