Arlington, MN Map & Demographics
Arlington Map
Arlington Overview
$27,321
PER CAPITA INCOME
$80,625
AVG FAMILY INCOME
$64,457
AVG HOUSEHOLD INCOME
29.9%
WAGE / INCOME GAP [ % ]
70.1¢/ $1
WAGE / INCOME GAP [ $ ]
0.38
INEQUALITY / GINI INDEX
2,428
TOTAL POPULATION
1,090
MALE POPULATION
1,338
FEMALE POPULATION
81.46
MALES / 100 FEMALES
122.75
FEMALES / 100 MALES
32.6
MEDIAN AGE
3.5
AVG FAMILY SIZE
2.7
AVG HOUSEHOLD SIZE
1,168
LABOR FORCE [ PEOPLE ]
66.3%
PERCENT IN LABOR FORCE
2.7%
UNEMPLOYMENT RATE
Arlington Zip Codes
Arlington Area Codes
Income in Arlington
Income Overview in Arlington
Per Capita Income in Arlington is $27,321, while median incomes of families and households are $80,625 and $64,457 respectively.
| Characteristic | Number | Measure |
| Per Capita Income | 2,428 | $27,321 |
| Median Family Income | 544 | $80,625 |
| Mean Family Income | 544 | $87,940 |
| Median Household Income | 888 | $64,457 |
| Mean Household Income | 888 | $70,608 |
| Income Deficit | 544 | $0 |
| Wage / Income Gap (%) | 2,428 | 29.87% |
| Wage / Income Gap ($) | 2,428 | 70.13¢ per $1 |
| Gini / Inequality Index | 2,428 | 0.38 |
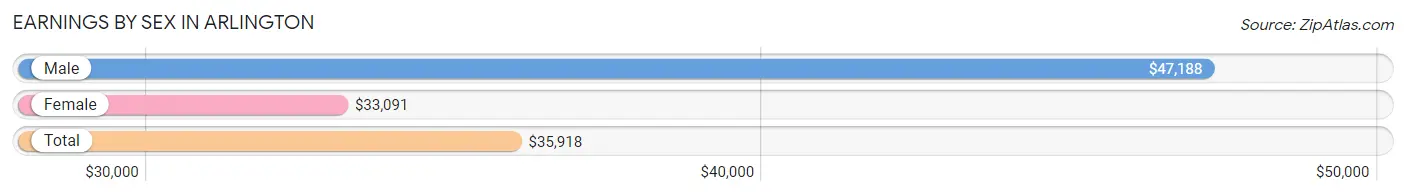
Earnings by Sex in Arlington
Average Earnings in Arlington are $35,918, $47,188 for men and $33,091 for women, a difference of 29.9%.
| Sex | Number | Average Earnings |
| Male | 626 (49.0%) | $47,188 |
| Female | 652 (51.0%) | $33,091 |
| Total | 1,278 (100.0%) | $35,918 |
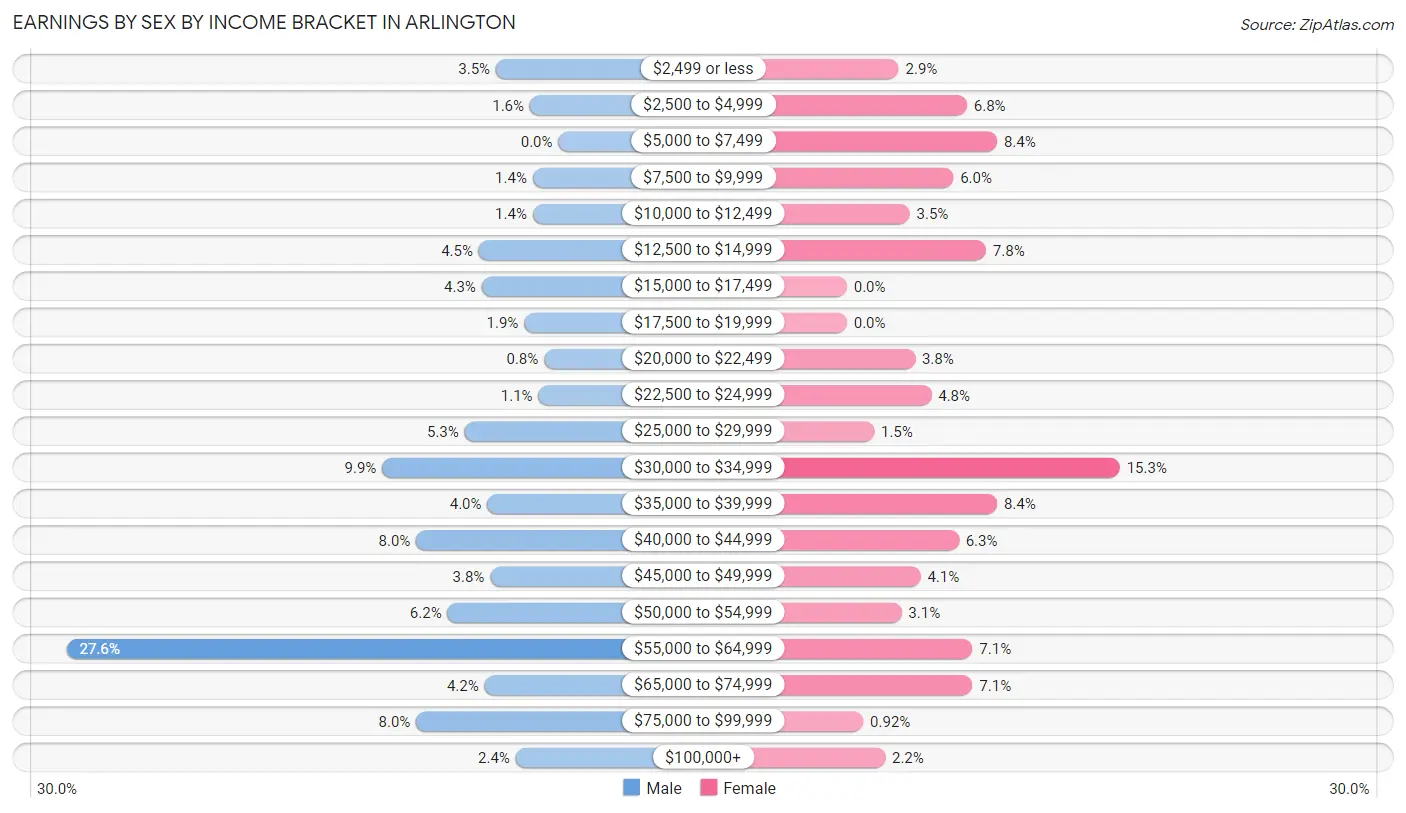
Earnings by Sex by Income Bracket in Arlington
The most common earnings brackets in Arlington are $55,000 to $64,999 for men (173 | 27.6%) and $30,000 to $34,999 for women (100 | 15.3%).
| Income | Male | Female |
| $2,499 or less | 22 (3.5%) | 19 (2.9%) |
| $2,500 to $4,999 | 10 (1.6%) | 44 (6.8%) |
| $5,000 to $7,499 | 0 (0.0%) | 55 (8.4%) |
| $7,500 to $9,999 | 9 (1.4%) | 39 (6.0%) |
| $10,000 to $12,499 | 9 (1.4%) | 23 (3.5%) |
| $12,500 to $14,999 | 28 (4.5%) | 51 (7.8%) |
| $15,000 to $17,499 | 27 (4.3%) | 0 (0.0%) |
| $17,500 to $19,999 | 12 (1.9%) | 0 (0.0%) |
| $20,000 to $22,499 | 5 (0.8%) | 25 (3.8%) |
| $22,500 to $24,999 | 7 (1.1%) | 31 (4.8%) |
| $25,000 to $29,999 | 33 (5.3%) | 10 (1.5%) |
| $30,000 to $34,999 | 62 (9.9%) | 100 (15.3%) |
| $35,000 to $39,999 | 25 (4.0%) | 55 (8.4%) |
| $40,000 to $44,999 | 50 (8.0%) | 41 (6.3%) |
| $45,000 to $49,999 | 24 (3.8%) | 27 (4.1%) |
| $50,000 to $54,999 | 39 (6.2%) | 20 (3.1%) |
| $55,000 to $64,999 | 173 (27.6%) | 46 (7.1%) |
| $65,000 to $74,999 | 26 (4.2%) | 46 (7.1%) |
| $75,000 to $99,999 | 50 (8.0%) | 6 (0.9%) |
| $100,000+ | 15 (2.4%) | 14 (2.1%) |
| Total | 626 (100.0%) | 652 (100.0%) |
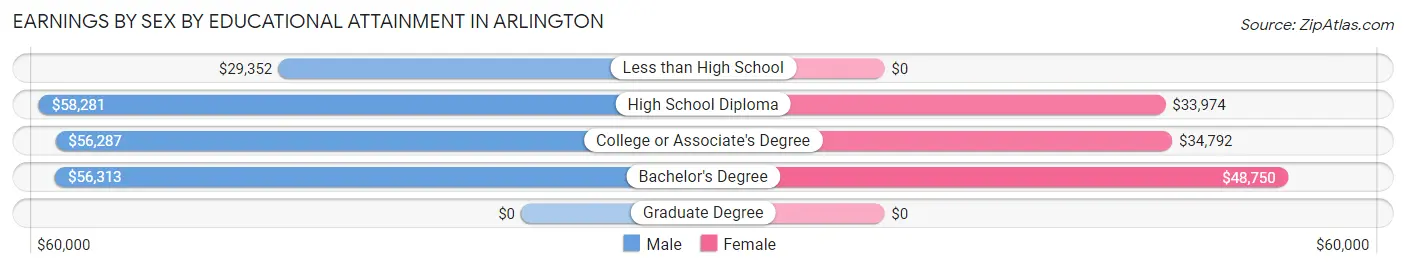
Earnings by Sex by Educational Attainment in Arlington
Average earnings in Arlington are $55,482 for men and $34,556 for women, a difference of 37.7%. Men with an educational attainment of high school diploma enjoy the highest average annual earnings of $58,281, while those with less than high school education earn the least with $29,352. Women with an educational attainment of bachelor's degree earn the most with the average annual earnings of $48,750, while those with high school diploma education have the smallest earnings of $33,974.
| Educational Attainment | Male Income | Female Income |
| Less than High School | $29,352 | $0 |
| High School Diploma | $58,281 | $33,974 |
| College or Associate's Degree | $56,287 | $34,792 |
| Bachelor's Degree | $56,313 | $48,750 |
| Graduate Degree | - | - |
| Total | $55,482 | $34,556 |
Family Income in Arlington
Family Income Brackets in Arlington
According to the Arlington family income data, there are 138 families falling into the $100,000 to $149,999 income range, which is the most common income bracket and makes up 25.4% of all families.
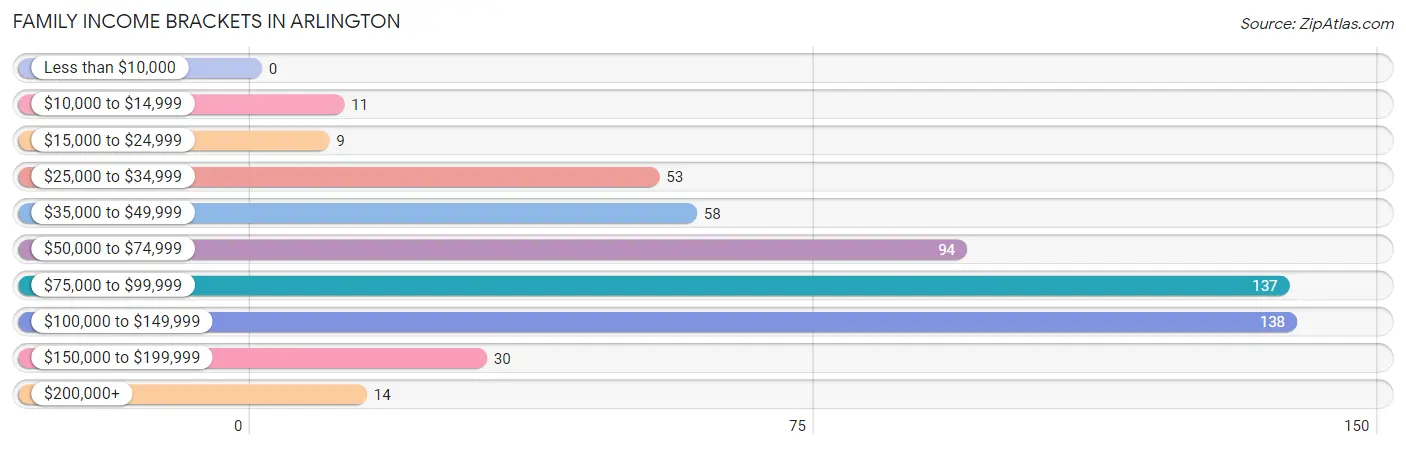
| Income Bracket | # Families | % Families |
| Less than $10,000 | 0 | 0.0% |
| $10,000 to $14,999 | 11 | 2.0% |
| $15,000 to $24,999 | 9 | 1.7% |
| $25,000 to $34,999 | 53 | 9.7% |
| $35,000 to $49,999 | 58 | 10.7% |
| $50,000 to $74,999 | 94 | 17.3% |
| $75,000 to $99,999 | 137 | 25.2% |
| $100,000 to $149,999 | 138 | 25.4% |
| $150,000 to $199,999 | 30 | 5.5% |
| $200,000+ | 14 | 2.6% |
Family Income by Famaliy Size in Arlington
5-person families (25 | 4.6%) account for the highest median family income in Arlington with $129,063 per family, while 2-person families (242 | 44.5%) have the highest median income of $36,250 per family member.
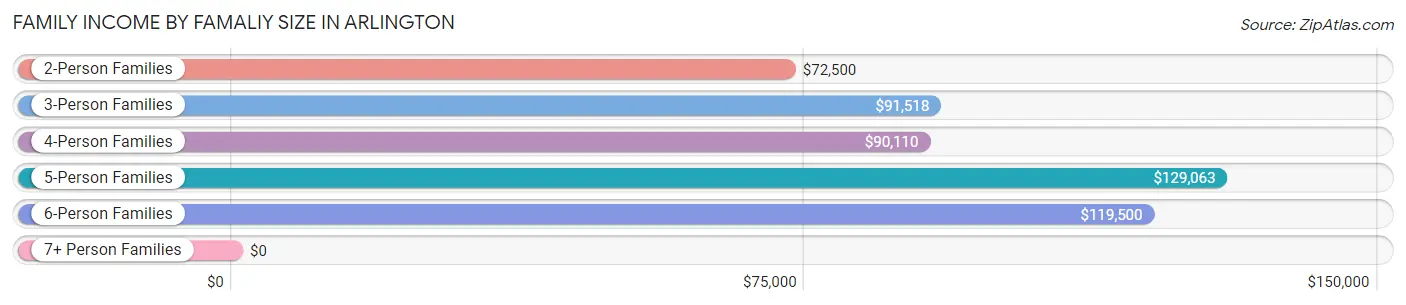
| Income Bracket | # Families | Median Income |
| 2-Person Families | 242 (44.5%) | $72,500 |
| 3-Person Families | 99 (18.2%) | $91,518 |
| 4-Person Families | 127 (23.4%) | $90,110 |
| 5-Person Families | 25 (4.6%) | $129,063 |
| 6-Person Families | 24 (4.4%) | $119,500 |
| 7+ Person Families | 27 (5.0%) | $0 |
| Total | 544 (100.0%) | $80,625 |
Family Income by Number of Earners in Arlington
The median family income in Arlington is $80,625, with families comprising 2 earners (351) having the highest median family income of $90,651, while families with no earners (75) have the lowest median family income of $39,688, accounting for 64.5% and 13.8% of families, respectively.
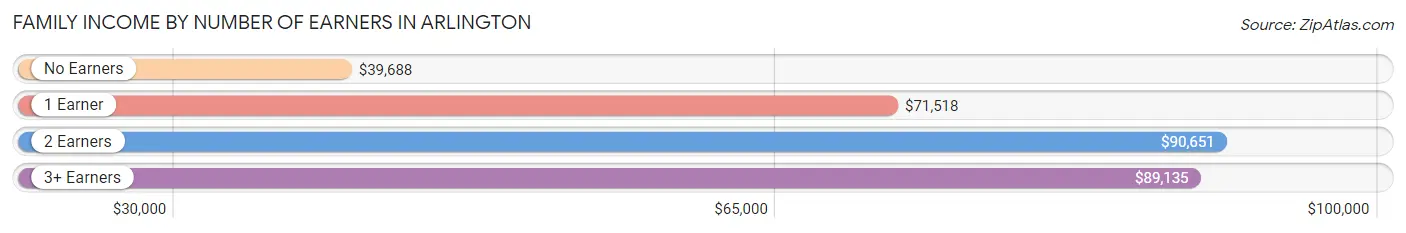
| Number of Earners | # Families | Median Income |
| No Earners | 75 (13.8%) | $39,688 |
| 1 Earner | 53 (9.7%) | $71,518 |
| 2 Earners | 351 (64.5%) | $90,651 |
| 3+ Earners | 65 (11.9%) | $89,135 |
| Total | 544 (100.0%) | $80,625 |
Household Income in Arlington
Household Income Brackets in Arlington
With 188 households falling in the category, the $100,000 to $149,999 income range is the most frequent in Arlington, accounting for 21.2% of all households. In contrast, only 14 households (1.6%) fall into the $200,000+ income bracket, making it the least populous group.
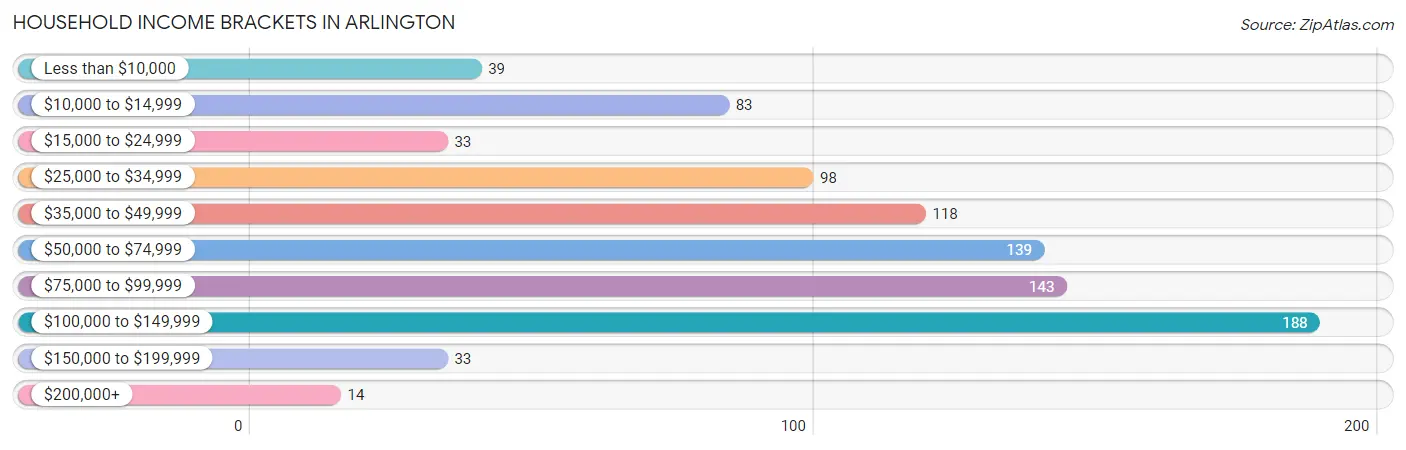
| Income Bracket | # Households | % Households |
| Less than $10,000 | 39 | 4.4% |
| $10,000 to $14,999 | 83 | 9.3% |
| $15,000 to $24,999 | 33 | 3.7% |
| $25,000 to $34,999 | 98 | 11.0% |
| $35,000 to $49,999 | 118 | 13.3% |
| $50,000 to $74,999 | 139 | 15.7% |
| $75,000 to $99,999 | 143 | 16.1% |
| $100,000 to $149,999 | 188 | 21.2% |
| $150,000 to $199,999 | 33 | 3.7% |
| $200,000+ | 14 | 1.6% |
Household Income by Householder Age in Arlington
The median household income in Arlington is $64,457, with the highest median household income of $77,917 found in the 25 to 44 years age bracket for the primary householder. A total of 311 households (35.0%) fall into this category. Meanwhile, the 65+ years age bracket for the primary householder has the lowest median household income of $42,857, with 276 households (31.1%) in this group.
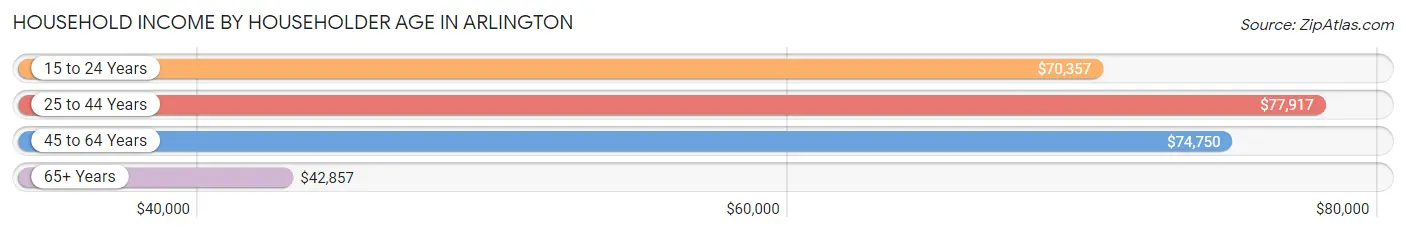
| Income Bracket | # Households | Median Income |
| 15 to 24 Years | 44 (5.0%) | $70,357 |
| 25 to 44 Years | 311 (35.0%) | $77,917 |
| 45 to 64 Years | 257 (28.9%) | $74,750 |
| 65+ Years | 276 (31.1%) | $42,857 |
| Total | 888 (100.0%) | $64,457 |
Poverty in Arlington
Income Below Poverty by Sex and Age in Arlington
With 13.2% poverty level for males and 20.2% for females among the residents of Arlington, 45 to 54 year old males and 12 to 14 year old females are the most vulnerable to poverty, with 46 males (40.4%) and 32 females (43.2%) in their respective age groups living below the poverty level.
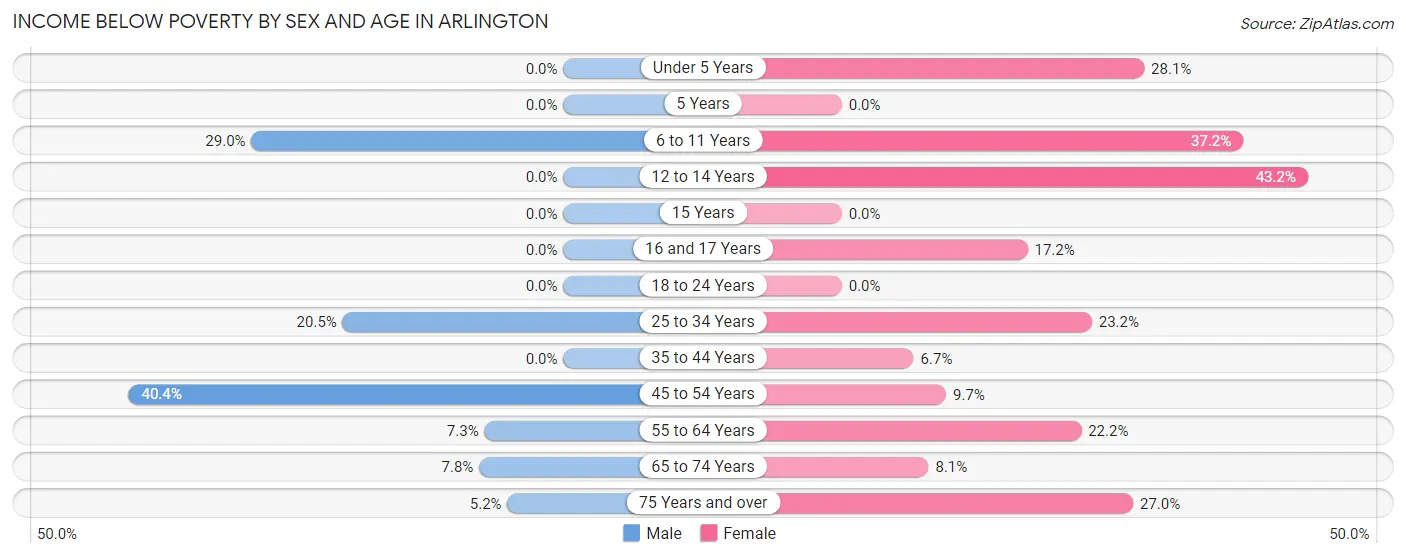
| Age Bracket | Male | Female |
| Under 5 Years | 0 (0.0%) | 39 (28.1%) |
| 5 Years | 0 (0.0%) | 0 (0.0%) |
| 6 to 11 Years | 44 (28.9%) | 54 (37.2%) |
| 12 to 14 Years | 0 (0.0%) | 32 (43.2%) |
| 15 Years | 0 (0.0%) | 0 (0.0%) |
| 16 and 17 Years | 0 (0.0%) | 5 (17.2%) |
| 18 to 24 Years | 0 (0.0%) | 0 (0.0%) |
| 25 to 34 Years | 34 (20.5%) | 58 (23.2%) |
| 35 to 44 Years | 0 (0.0%) | 6 (6.7%) |
| 45 to 54 Years | 46 (40.4%) | 12 (9.7%) |
| 55 to 64 Years | 9 (7.3%) | 16 (22.2%) |
| 65 to 74 Years | 5 (7.8%) | 12 (8.1%) |
| 75 Years and over | 4 (5.2%) | 30 (27.0%) |
| Total | 142 (13.2%) | 264 (20.2%) |
Income Above Poverty by Sex and Age in Arlington
According to the poverty statistics in Arlington, males aged under 5 years and females aged 5 years are the age groups that are most secure financially, with 100.0% of males and 100.0% of females in these age groups living above the poverty line.
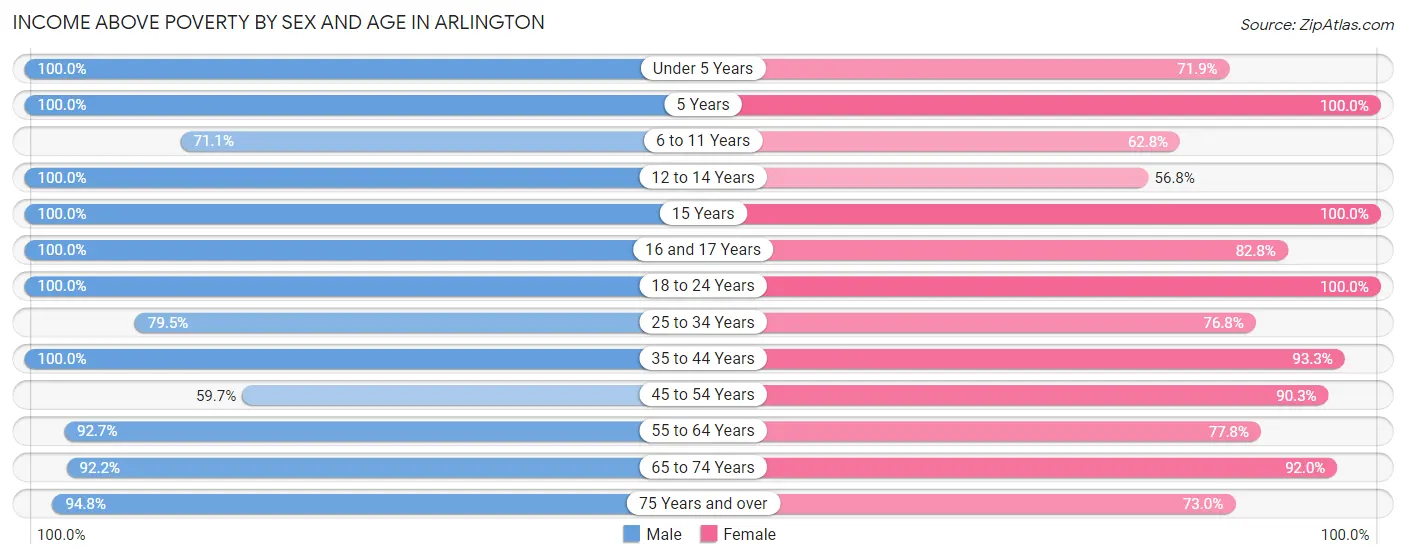
| Age Bracket | Male | Female |
| Under 5 Years | 43 (100.0%) | 100 (71.9%) |
| 5 Years | 37 (100.0%) | 11 (100.0%) |
| 6 to 11 Years | 108 (71.1%) | 91 (62.8%) |
| 12 to 14 Years | 10 (100.0%) | 42 (56.8%) |
| 15 Years | 27 (100.0%) | 21 (100.0%) |
| 16 and 17 Years | 7 (100.0%) | 24 (82.8%) |
| 18 to 24 Years | 130 (100.0%) | 94 (100.0%) |
| 25 to 34 Years | 132 (79.5%) | 192 (76.8%) |
| 35 to 44 Years | 130 (100.0%) | 84 (93.3%) |
| 45 to 54 Years | 68 (59.7%) | 112 (90.3%) |
| 55 to 64 Years | 114 (92.7%) | 56 (77.8%) |
| 65 to 74 Years | 59 (92.2%) | 137 (91.9%) |
| 75 Years and over | 73 (94.8%) | 81 (73.0%) |
| Total | 938 (86.9%) | 1,045 (79.8%) |
Income Below Poverty Among Married-Couple Families in Arlington
The poverty statistics for married-couple families in Arlington show that 8.5% or 37 of the total 434 families live below the poverty line. Families with 5 or more children have the highest poverty rate of 100.0%, comprising of 27 families. On the other hand, families with 1 or 2 children have the lowest poverty rate of 0.0%, which includes 0 families.
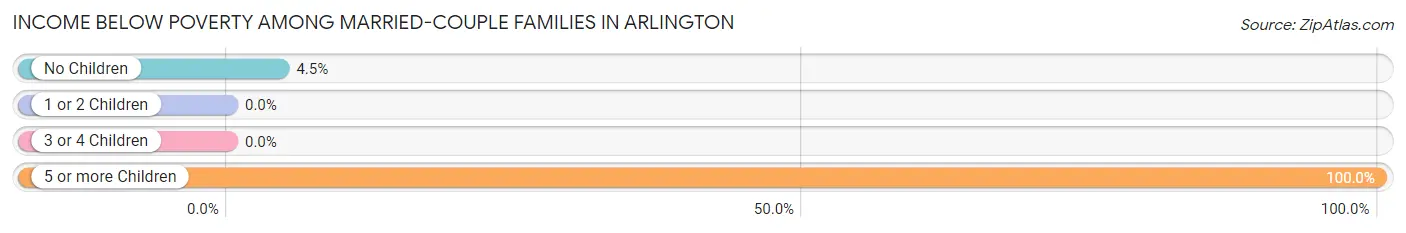
| Children | Above Poverty | Below Poverty |
| No Children | 213 (95.5%) | 10 (4.5%) |
| 1 or 2 Children | 135 (100.0%) | 0 (0.0%) |
| 3 or 4 Children | 49 (100.0%) | 0 (0.0%) |
| 5 or more Children | 0 (0.0%) | 27 (100.0%) |
| Total | 397 (91.5%) | 37 (8.5%) |
Income Below Poverty Among Single-Parent Households in Arlington
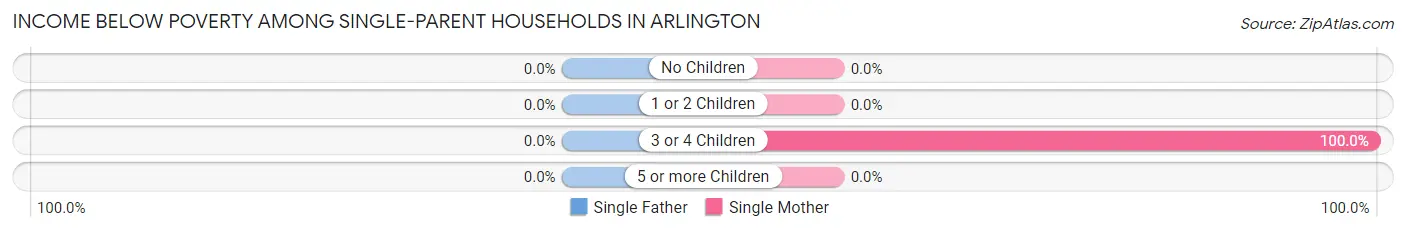
| Children | Single Father | Single Mother |
| No Children | 0 (0.0%) | 0 (0.0%) |
| 1 or 2 Children | 0 (0.0%) | 0 (0.0%) |
| 3 or 4 Children | 0 (0.0%) | 6 (100.0%) |
| 5 or more Children | 0 (0.0%) | 0 (0.0%) |
| Total | 0 (0.0%) | 6 (7.8%) |
Income Below Poverty Among Married-Couple vs Single-Parent Households in Arlington
The poverty data for Arlington shows that 37 of the married-couple family households (8.5%) and 6 of the single-parent households (5.4%) are living below the poverty level. Within the married-couple family households, those with 5 or more children have the highest poverty rate, with 27 households (100.0%) falling below the poverty line. Among the single-parent households, those with 3 or 4 children have the highest poverty rate, with 6 household (100.0%) living below poverty.
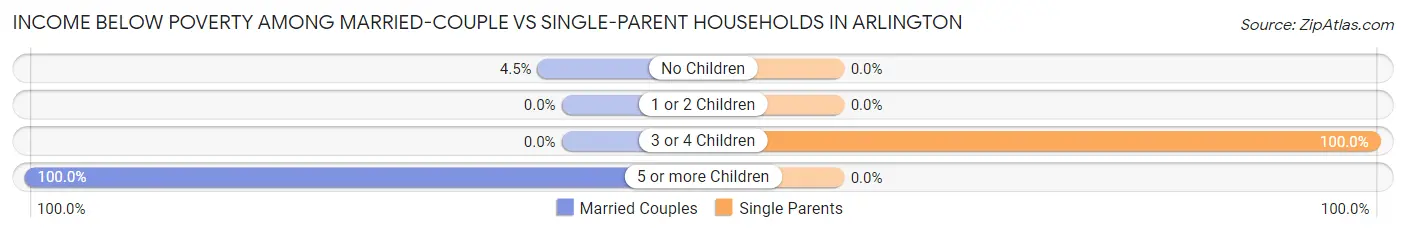
| Children | Married-Couple Families | Single-Parent Households |
| No Children | 10 (4.5%) | 0 (0.0%) |
| 1 or 2 Children | 0 (0.0%) | 0 (0.0%) |
| 3 or 4 Children | 0 (0.0%) | 6 (100.0%) |
| 5 or more Children | 27 (100.0%) | 0 (0.0%) |
| Total | 37 (8.5%) | 6 (5.4%) |
Race in Arlington
The most populous races in Arlington are White / Caucasian (2,309 | 95.1%), Hispanic or Latino (391 | 16.1%), and Two or more Races (87 | 3.6%).
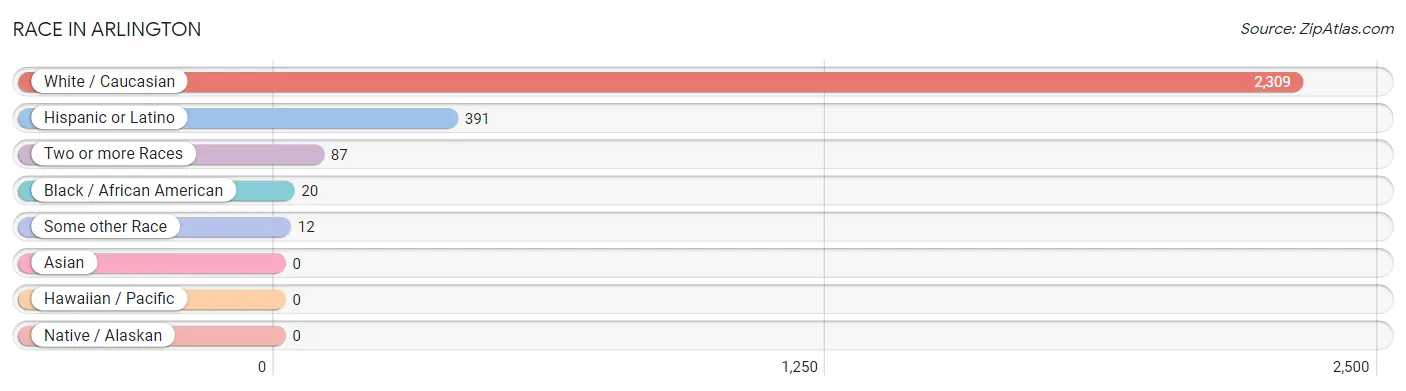
| Race | # Population | % Population |
| Asian | 0 | 0.0% |
| Black / African American | 20 | 0.8% |
| Hawaiian / Pacific | 0 | 0.0% |
| Hispanic or Latino | 391 | 16.1% |
| Native / Alaskan | 0 | 0.0% |
| White / Caucasian | 2,309 | 95.1% |
| Two or more Races | 87 | 3.6% |
| Some other Race | 12 | 0.5% |
| Total | 2,428 | 100.0% |
Ancestry in Arlington
The most populous ancestries reported in Arlington are German (1,381 | 56.9%), Mexican (335 | 13.8%), Irish (220 | 9.1%), English (153 | 6.3%), and Norwegian (113 | 4.6%), together accounting for 90.7% of all Arlington residents.
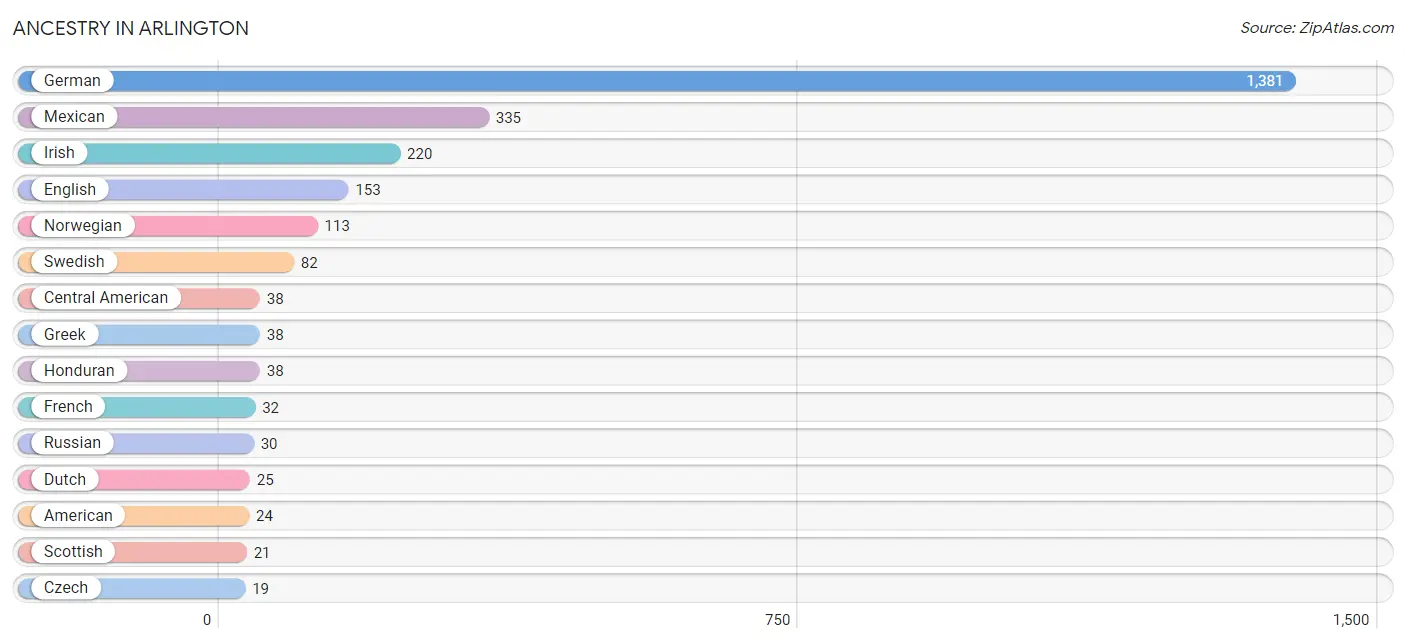
| Ancestry | # Population | % Population |
| American | 24 | 1.0% |
| Belgian | 17 | 0.7% |
| Burmese | 5 | 0.2% |
| Central American | 38 | 1.6% |
| Czech | 19 | 0.8% |
| Dutch | 25 | 1.0% |
| English | 153 | 6.3% |
| French | 32 | 1.3% |
| German | 1,381 | 56.9% |
| Greek | 38 | 1.6% |
| Honduran | 38 | 1.6% |
| Hungarian | 4 | 0.2% |
| Irish | 220 | 9.1% |
| Italian | 10 | 0.4% |
| Kenyan | 3 | 0.1% |
| Luxembourger | 12 | 0.5% |
| Mexican | 335 | 13.8% |
| Norwegian | 113 | 4.6% |
| Polish | 13 | 0.5% |
| Puerto Rican | 18 | 0.7% |
| Russian | 30 | 1.2% |
| Scandinavian | 9 | 0.4% |
| Scottish | 21 | 0.9% |
| Sioux | 6 | 0.3% |
| Subsaharan African | 3 | 0.1% |
| Swedish | 82 | 3.4% | View All 26 Rows |
Immigrants in Arlington
The most numerous immigrant groups reported in Arlington came from Central America (98 | 4.0%), Latin America (98 | 4.0%), Mexico (60 | 2.5%), Honduras (38 | 1.6%), and Europe (10 | 0.4%), together accounting for 12.5% of all Arlington residents.
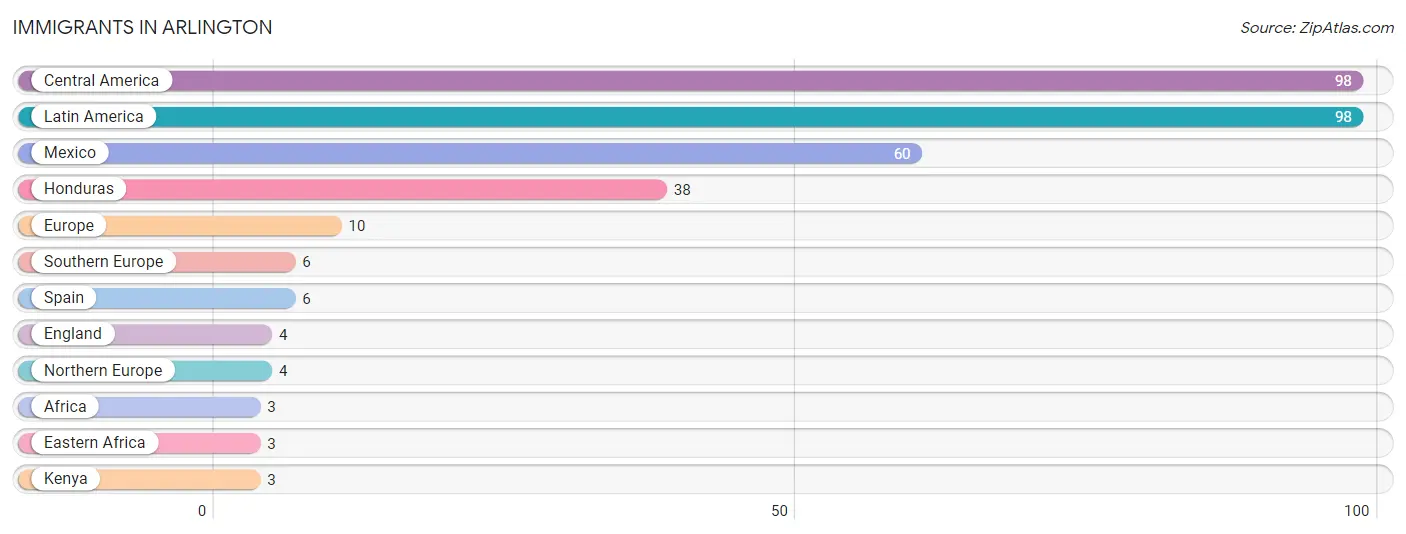
| Immigration Origin | # Population | % Population |
| Africa | 3 | 0.1% |
| Central America | 98 | 4.0% |
| Eastern Africa | 3 | 0.1% |
| England | 4 | 0.2% |
| Europe | 10 | 0.4% |
| Honduras | 38 | 1.6% |
| Kenya | 3 | 0.1% |
| Latin America | 98 | 4.0% |
| Mexico | 60 | 2.5% |
| Northern Europe | 4 | 0.2% |
| Southern Europe | 6 | 0.3% |
| Spain | 6 | 0.3% | View All 12 Rows |
Sex and Age in Arlington
Sex and Age in Arlington
The most populous age groups in Arlington are 5 to 9 Years (132 | 12.1%) for men and Under 5 Years (139 | 10.4%) for women.
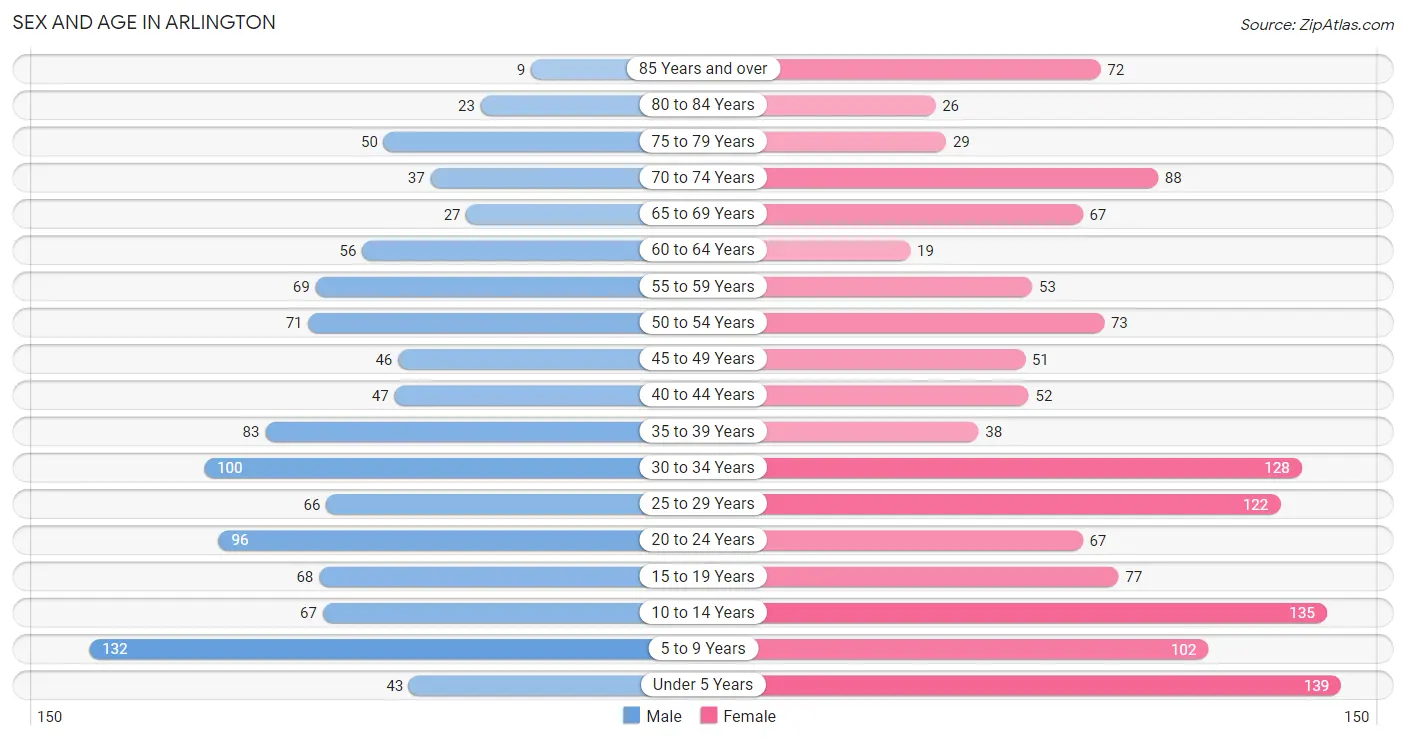
| Age Bracket | Male | Female |
| Under 5 Years | 43 (3.9%) | 139 (10.4%) |
| 5 to 9 Years | 132 (12.1%) | 102 (7.6%) |
| 10 to 14 Years | 67 (6.1%) | 135 (10.1%) |
| 15 to 19 Years | 68 (6.2%) | 77 (5.8%) |
| 20 to 24 Years | 96 (8.8%) | 67 (5.0%) |
| 25 to 29 Years | 66 (6.1%) | 122 (9.1%) |
| 30 to 34 Years | 100 (9.2%) | 128 (9.6%) |
| 35 to 39 Years | 83 (7.6%) | 38 (2.8%) |
| 40 to 44 Years | 47 (4.3%) | 52 (3.9%) |
| 45 to 49 Years | 46 (4.2%) | 51 (3.8%) |
| 50 to 54 Years | 71 (6.5%) | 73 (5.5%) |
| 55 to 59 Years | 69 (6.3%) | 53 (4.0%) |
| 60 to 64 Years | 56 (5.1%) | 19 (1.4%) |
| 65 to 69 Years | 27 (2.5%) | 67 (5.0%) |
| 70 to 74 Years | 37 (3.4%) | 88 (6.6%) |
| 75 to 79 Years | 50 (4.6%) | 29 (2.2%) |
| 80 to 84 Years | 23 (2.1%) | 26 (1.9%) |
| 85 Years and over | 9 (0.8%) | 72 (5.4%) |
| Total | 1,090 (100.0%) | 1,338 (100.0%) |
Families and Households in Arlington
Median Family Size in Arlington
The median family size in Arlington is 3.51 persons per family, with single female/mother families (77 | 14.1%) accounting for the largest median family size of 3.6 persons per family. On the other hand, single male/father families (33 | 6.1%) represent the smallest median family size with 2.33 persons per family.
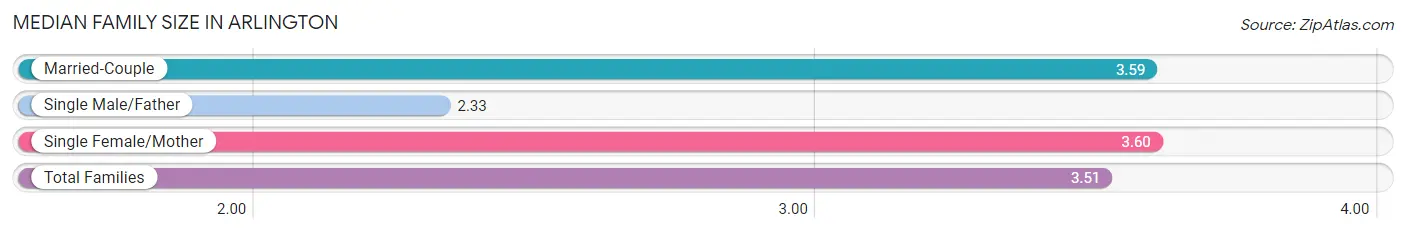
| Family Type | # Families | Family Size |
| Married-Couple | 434 (79.8%) | 3.59 |
| Single Male/Father | 33 (6.1%) | 2.33 |
| Single Female/Mother | 77 (14.1%) | 3.60 |
| Total Families | 544 (100.0%) | 3.51 |
Median Household Size in Arlington
The median household size in Arlington is 2.68 persons per household, with single female/mother households (77 | 8.7%) accounting for the largest median household size of 3.75 persons per household. non-family households (344 | 38.7%) represent the smallest median household size with 1.33 persons per household.
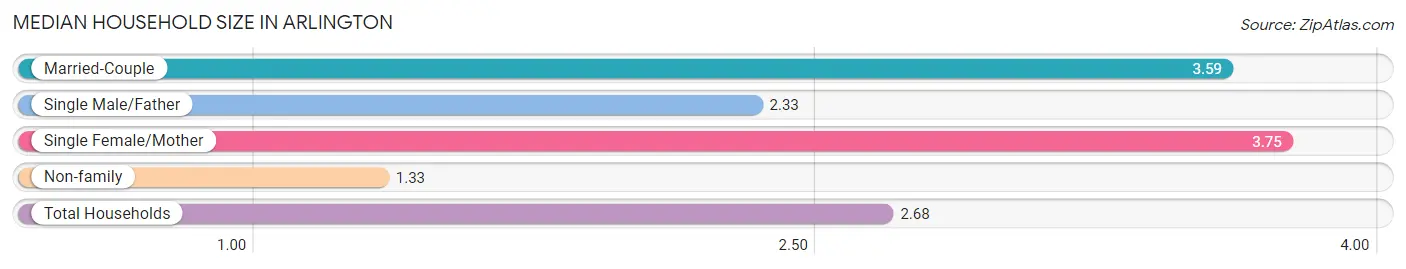
| Household Type | # Households | Household Size |
| Married-Couple | 434 (48.9%) | 3.59 |
| Single Male/Father | 33 (3.7%) | 2.33 |
| Single Female/Mother | 77 (8.7%) | 3.75 |
| Non-family | 344 (38.7%) | 1.33 |
| Total Households | 888 (100.0%) | 2.68 |
Household Size by Marriage Status in Arlington
Out of a total of 888 households in Arlington, 544 (61.3%) are family households, while 344 (38.7%) are nonfamily households. The most numerous type of family households are 2-person households, comprising 242, and the most common type of nonfamily households are 1-person households, comprising 270.
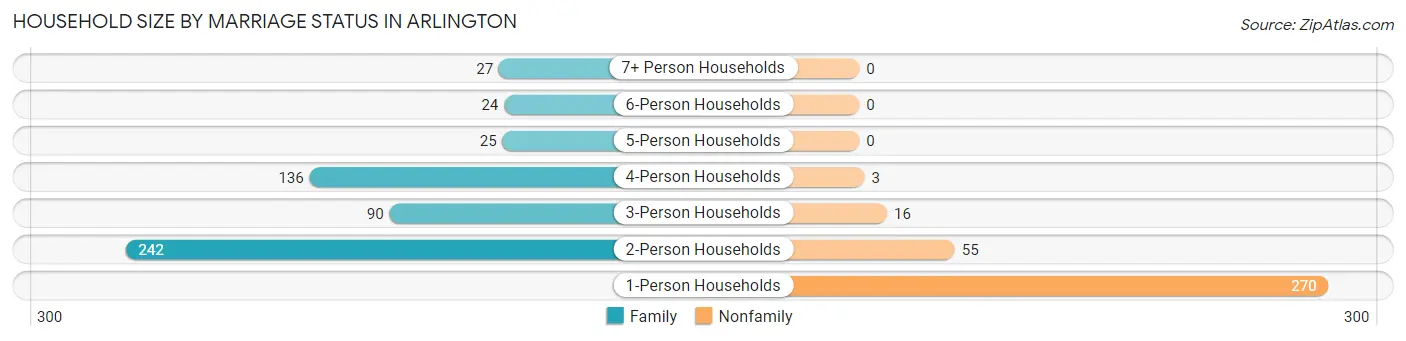
| Household Size | Family Households | Nonfamily Households |
| 1-Person Households | - | 270 (30.4%) |
| 2-Person Households | 242 (27.3%) | 55 (6.2%) |
| 3-Person Households | 90 (10.1%) | 16 (1.8%) |
| 4-Person Households | 136 (15.3%) | 3 (0.3%) |
| 5-Person Households | 25 (2.8%) | 0 (0.0%) |
| 6-Person Households | 24 (2.7%) | 0 (0.0%) |
| 7+ Person Households | 27 (3.0%) | 0 (0.0%) |
| Total | 544 (61.3%) | 344 (38.7%) |
Female Fertility in Arlington
Fertility by Age in Arlington
Average fertility rate in Arlington is 104.0 births per 1,000 women. Women in the age bracket of 20 to 34 years have the highest fertility rate with 180.0 births per 1,000 women. Women in the age bracket of 20 to 34 years acount for 100.0% of all women with births.
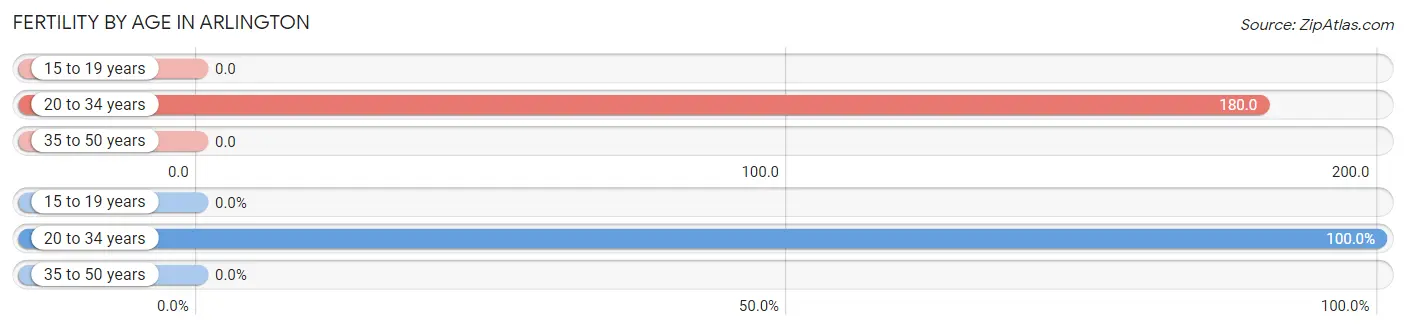
| Age Bracket | Women with Births | Births / 1,000 Women |
| 15 to 19 years | 0 (0.0%) | 0.0 |
| 20 to 34 years | 57 (100.0%) | 180.0 |
| 35 to 50 years | 0 (0.0%) | 0.0 |
| Total | 57 (100.0%) | 104.0 |
Fertility by Age by Marriage Status in Arlington
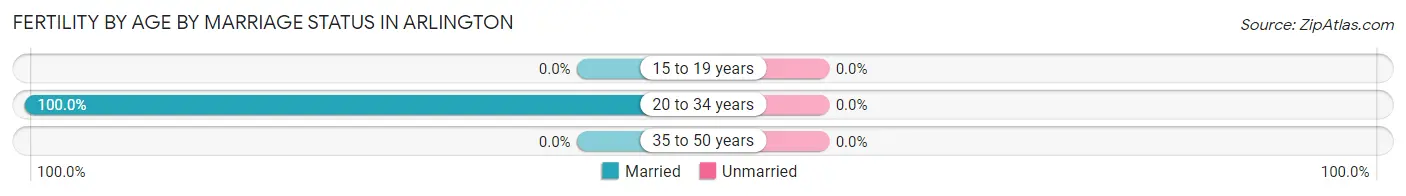
| Age Bracket | Married | Unmarried |
| 15 to 19 years | 0 (0.0%) | 0 (0.0%) |
| 20 to 34 years | 57 (100.0%) | 0 (0.0%) |
| 35 to 50 years | 0 (0.0%) | 0 (0.0%) |
| Total | 57 (100.0%) | 0 (0.0%) |
Fertility by Education in Arlington
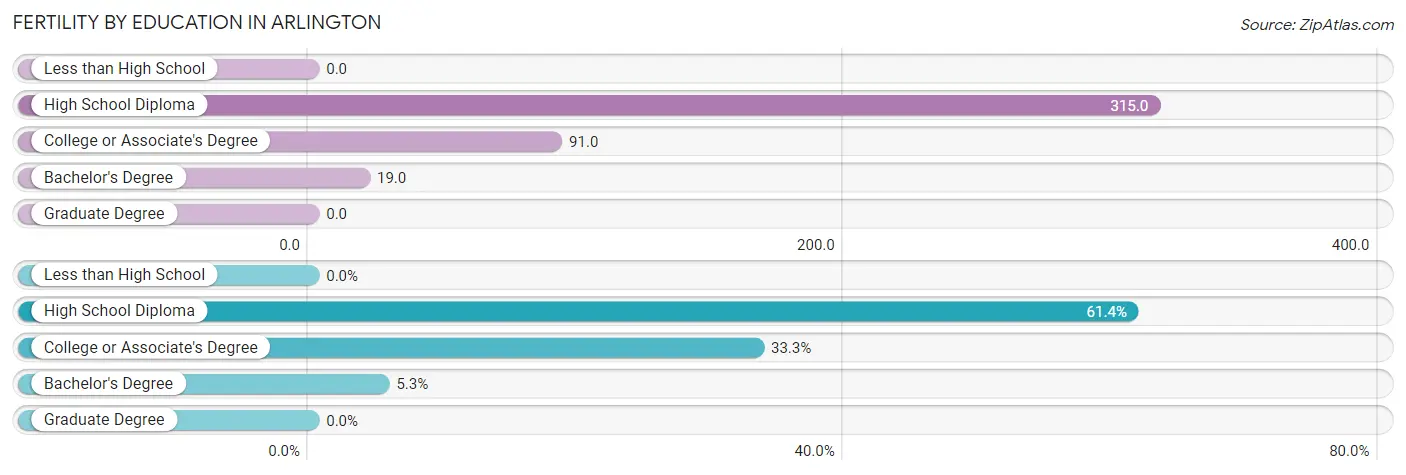
| Educational Attainment | Women with Births | Births / 1,000 Women |
| Less than High School | 0 (0.0%) | 0.0 |
| High School Diploma | 35 (61.4%) | 315.0 |
| College or Associate's Degree | 19 (33.3%) | 91.0 |
| Bachelor's Degree | 3 (5.3%) | 19.0 |
| Graduate Degree | 0 (0.0%) | 0.0 |
| Total | 57 (100.0%) | 104.0 |
Fertility by Education by Marriage Status in Arlington
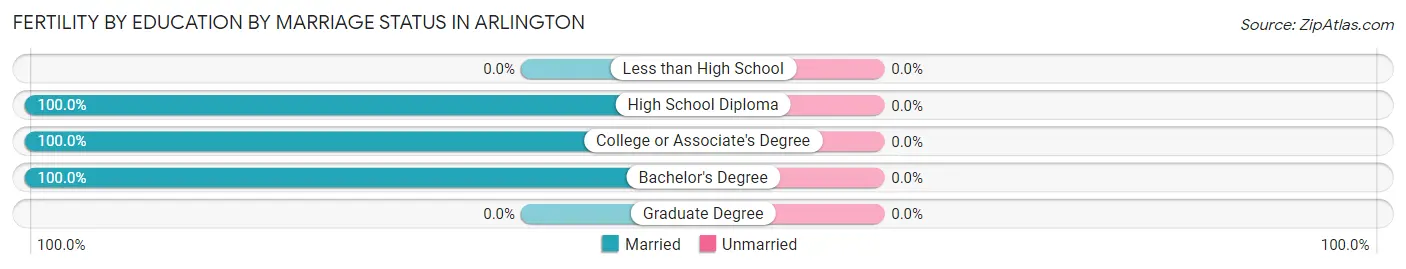
| Educational Attainment | Married | Unmarried |
| Less than High School | 0 (0.0%) | 0 (0.0%) |
| High School Diploma | 35 (100.0%) | 0 (0.0%) |
| College or Associate's Degree | 19 (100.0%) | 0 (0.0%) |
| Bachelor's Degree | 3 (100.0%) | 0 (0.0%) |
| Graduate Degree | 0 (0.0%) | 0 (0.0%) |
| Total | 57 (100.0%) | 0 (0.0%) |
Employment Characteristics in Arlington
Employment by Class of Employer in Arlington
Among the 1,130 employed individuals in Arlington, private company employees (818 | 72.4%), not-for-profit organizations (115 | 10.2%), and local government employees (98 | 8.7%) make up the most common classes of employment.
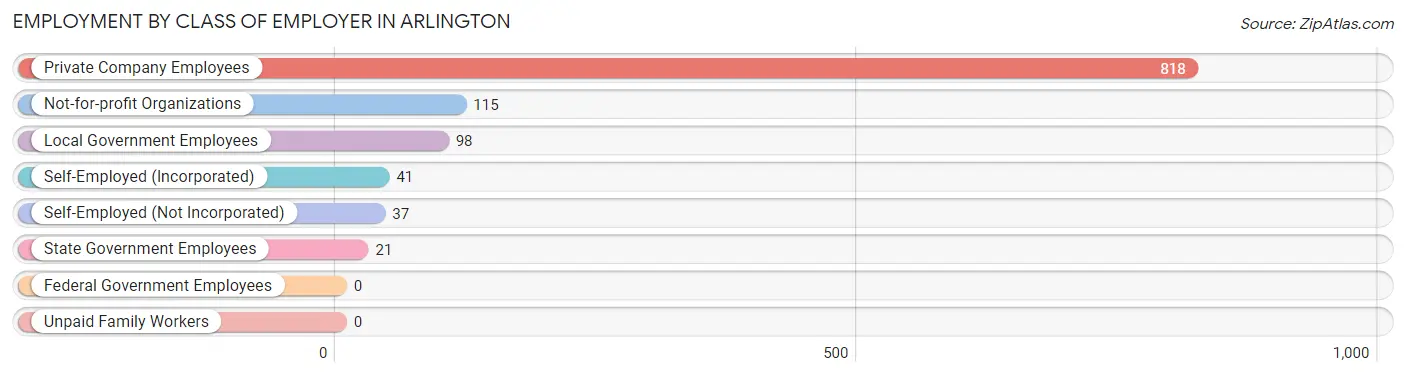
| Employer Class | # Employees | % Employees |
| Private Company Employees | 818 | 72.4% |
| Self-Employed (Incorporated) | 41 | 3.6% |
| Self-Employed (Not Incorporated) | 37 | 3.3% |
| Not-for-profit Organizations | 115 | 10.2% |
| Local Government Employees | 98 | 8.7% |
| State Government Employees | 21 | 1.9% |
| Federal Government Employees | 0 | 0.0% |
| Unpaid Family Workers | 0 | 0.0% |
| Total | 1,130 | 100.0% |
Employment Status by Age in Arlington
According to the labor force statistics for Arlington, out of the total population over 16 years of age (1,762), 66.3% or 1,168 individuals are in the labor force, with 2.7% or 32 of them unemployed. The age group with the highest labor force participation rate is 30 to 34 years, with 96.9% or 221 individuals in the labor force. Within the labor force, the 30 to 34 years age range has the highest percentage of unemployed individuals, with 12.2% or 27 of them being unemployed.
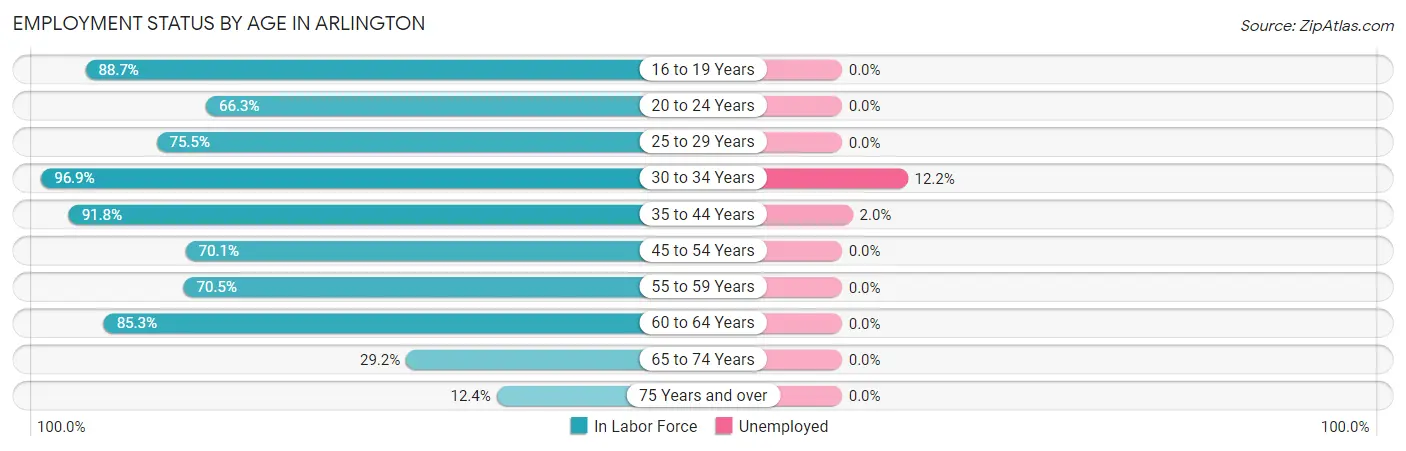
| Age Bracket | In Labor Force | Unemployed |
| 16 to 19 Years | 86 (88.7%) | 0 (0.0%) |
| 20 to 24 Years | 108 (66.3%) | 0 (0.0%) |
| 25 to 29 Years | 142 (75.5%) | 0 (0.0%) |
| 30 to 34 Years | 221 (96.9%) | 27 (12.2%) |
| 35 to 44 Years | 202 (91.8%) | 4 (2.0%) |
| 45 to 54 Years | 169 (70.1%) | 0 (0.0%) |
| 55 to 59 Years | 86 (70.5%) | 0 (0.0%) |
| 60 to 64 Years | 64 (85.3%) | 0 (0.0%) |
| 65 to 74 Years | 64 (29.2%) | 0 (0.0%) |
| 75 Years and over | 26 (12.4%) | 0 (0.0%) |
| Total | 1,168 (66.3%) | 32 (2.7%) |
Employment Status by Educational Attainment in Arlington
According to labor force statistics for Arlington, 82.3% of individuals (884) out of the total population between 25 and 64 years of age (1,074) are in the labor force, with 3.5% or 31 of them being unemployed. The group with the highest labor force participation rate are those with the educational attainment of less than high school, with 100.0% or 81 individuals in the labor force. Within the labor force, individuals with less than high school education have the highest percentage of unemployment, with 38.3% or 31 of them being unemployed.
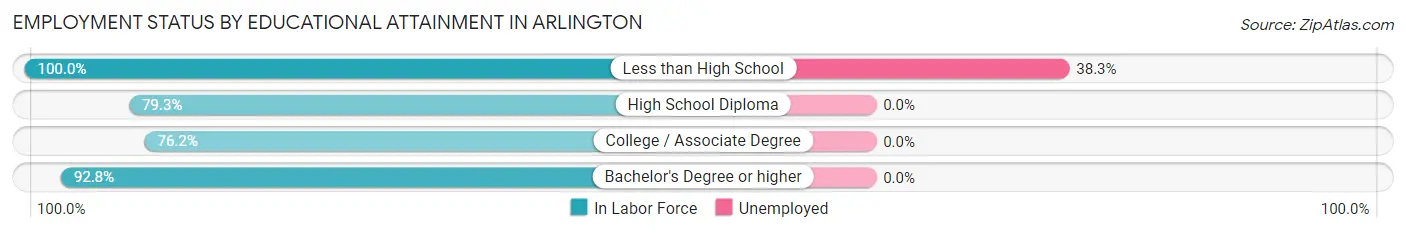
| Educational Attainment | In Labor Force | Unemployed |
| Less than High School | 81 (100.0%) | 31 (38.3%) |
| High School Diploma | 241 (79.3%) | 0 (0.0%) |
| College / Associate Degree | 355 (76.2%) | 0 (0.0%) |
| Bachelor's Degree or higher | 207 (92.8%) | 0 (0.0%) |
| Total | 884 (82.3%) | 38 (3.5%) |
Employment Occupations by Sex in Arlington
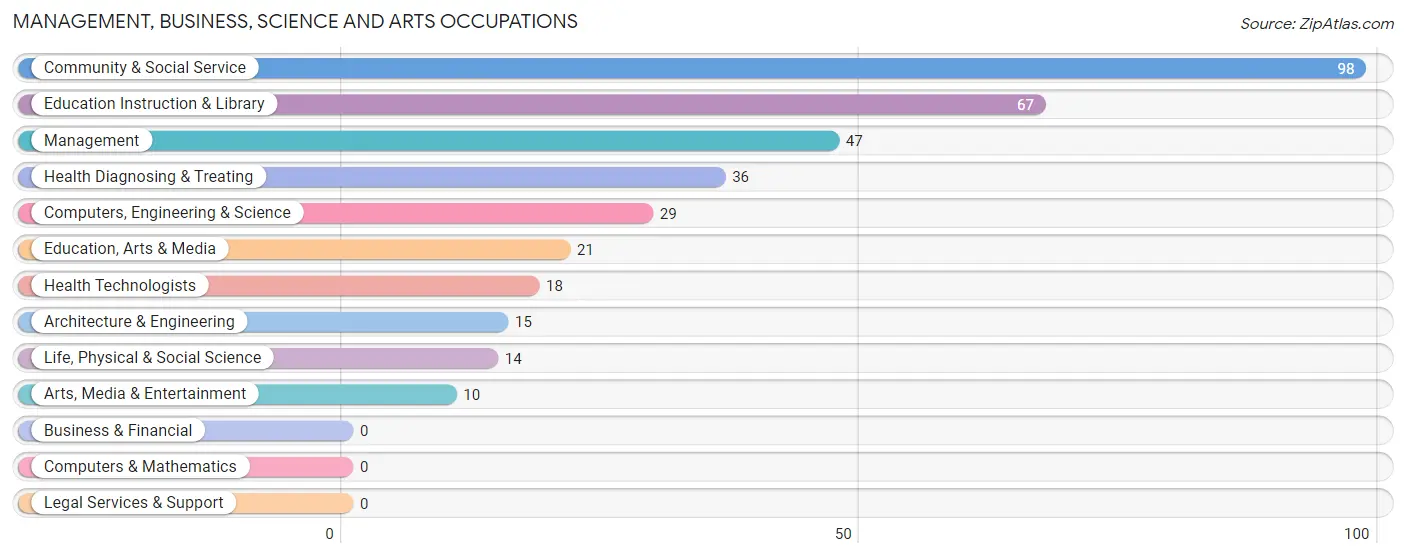
Management, Business, Science and Arts Occupations
The most common Management, Business, Science and Arts occupations in Arlington are Community & Social Service (98 | 8.6%), Education Instruction & Library (67 | 5.9%), Management (47 | 4.1%), Health Diagnosing & Treating (36 | 3.2%), and Computers, Engineering & Science (29 | 2.5%).
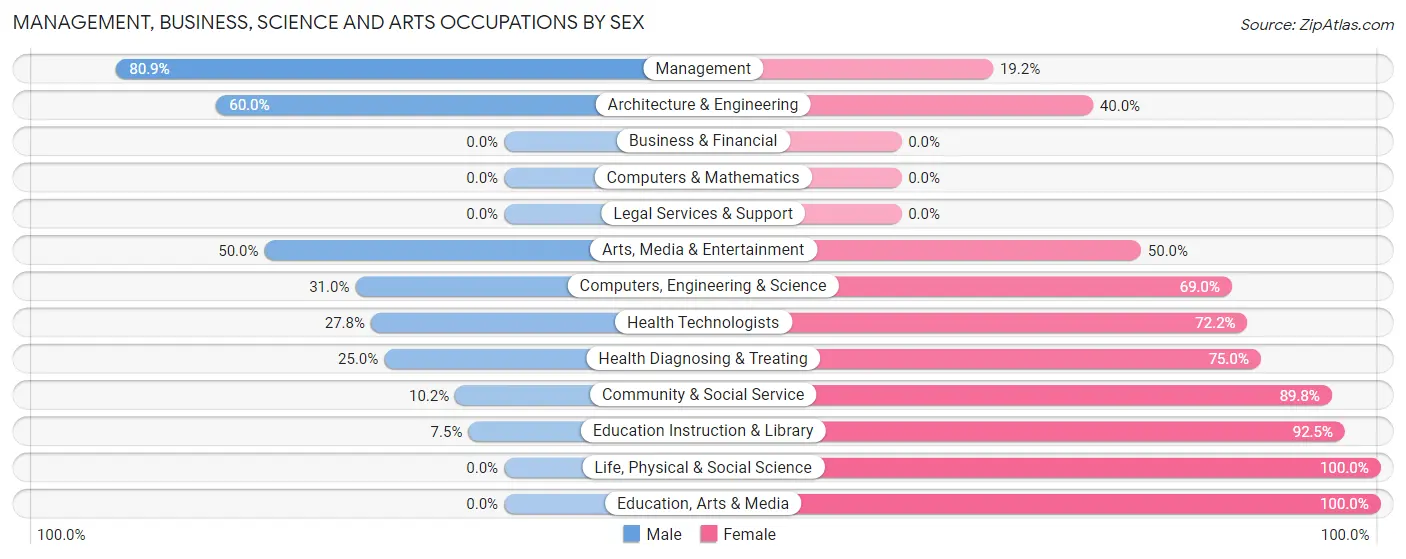
Management, Business, Science and Arts Occupations by Sex
Within the Management, Business, Science and Arts occupations in Arlington, the most male-oriented occupations are Management (80.8%), Architecture & Engineering (60.0%), and Arts, Media & Entertainment (50.0%), while the most female-oriented occupations are Life, Physical & Social Science (100.0%), Education, Arts & Media (100.0%), and Education Instruction & Library (92.5%).
| Occupation | Male | Female |
| Management | 38 (80.8%) | 9 (19.2%) |
| Business & Financial | 0 (0.0%) | 0 (0.0%) |
| Computers, Engineering & Science | 9 (31.0%) | 20 (69.0%) |
| Computers & Mathematics | 0 (0.0%) | 0 (0.0%) |
| Architecture & Engineering | 9 (60.0%) | 6 (40.0%) |
| Life, Physical & Social Science | 0 (0.0%) | 14 (100.0%) |
| Community & Social Service | 10 (10.2%) | 88 (89.8%) |
| Education, Arts & Media | 0 (0.0%) | 21 (100.0%) |
| Legal Services & Support | 0 (0.0%) | 0 (0.0%) |
| Education Instruction & Library | 5 (7.5%) | 62 (92.5%) |
| Arts, Media & Entertainment | 5 (50.0%) | 5 (50.0%) |
| Health Diagnosing & Treating | 9 (25.0%) | 27 (75.0%) |
| Health Technologists | 5 (27.8%) | 13 (72.2%) |
| Total (Category) | 66 (31.4%) | 144 (68.6%) |
| Total (Overall) | 571 (50.2%) | 566 (49.8%) |
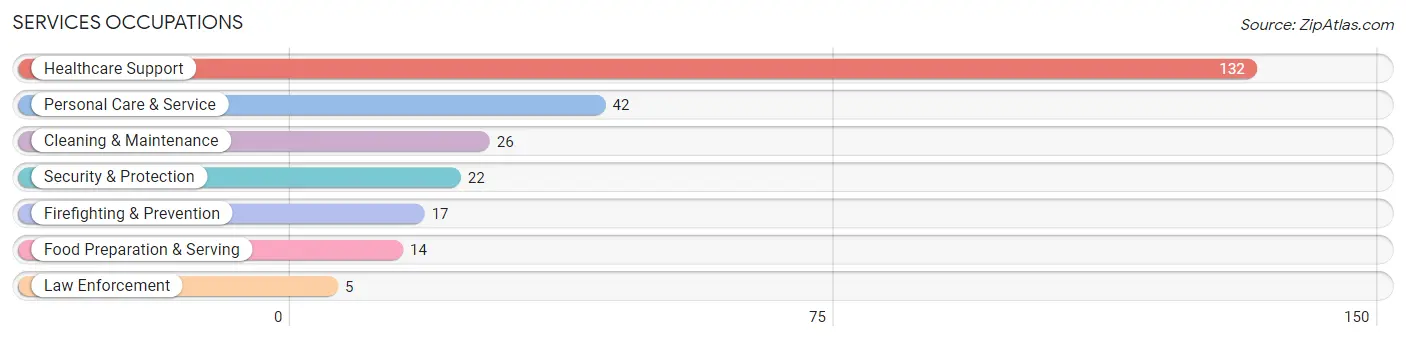
Services Occupations
The most common Services occupations in Arlington are Healthcare Support (132 | 11.6%), Personal Care & Service (42 | 3.7%), Cleaning & Maintenance (26 | 2.3%), Security & Protection (22 | 1.9%), and Firefighting & Prevention (17 | 1.5%).
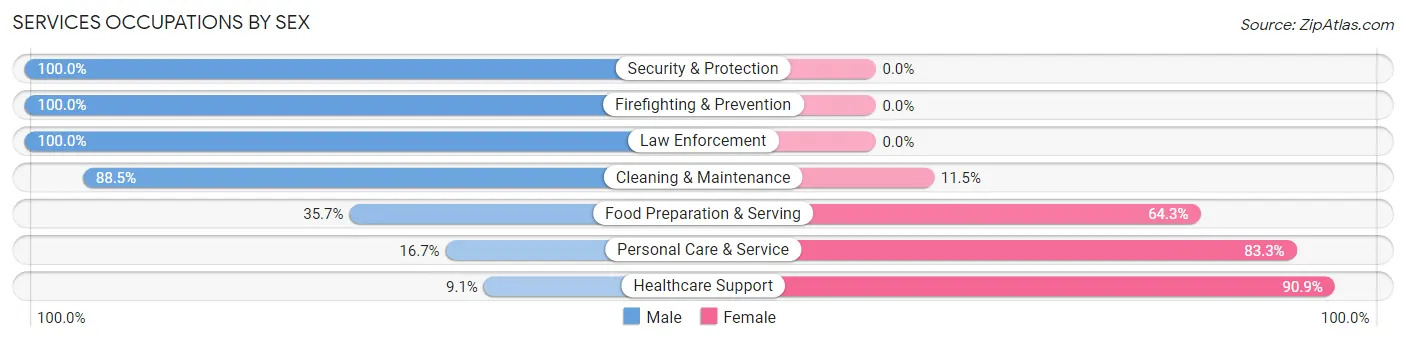
Services Occupations by Sex
Within the Services occupations in Arlington, the most male-oriented occupations are Security & Protection (100.0%), Firefighting & Prevention (100.0%), and Law Enforcement (100.0%), while the most female-oriented occupations are Healthcare Support (90.9%), Personal Care & Service (83.3%), and Food Preparation & Serving (64.3%).
| Occupation | Male | Female |
| Healthcare Support | 12 (9.1%) | 120 (90.9%) |
| Security & Protection | 22 (100.0%) | 0 (0.0%) |
| Firefighting & Prevention | 17 (100.0%) | 0 (0.0%) |
| Law Enforcement | 5 (100.0%) | 0 (0.0%) |
| Food Preparation & Serving | 5 (35.7%) | 9 (64.3%) |
| Cleaning & Maintenance | 23 (88.5%) | 3 (11.5%) |
| Personal Care & Service | 7 (16.7%) | 35 (83.3%) |
| Total (Category) | 69 (29.2%) | 167 (70.8%) |
| Total (Overall) | 571 (50.2%) | 566 (49.8%) |
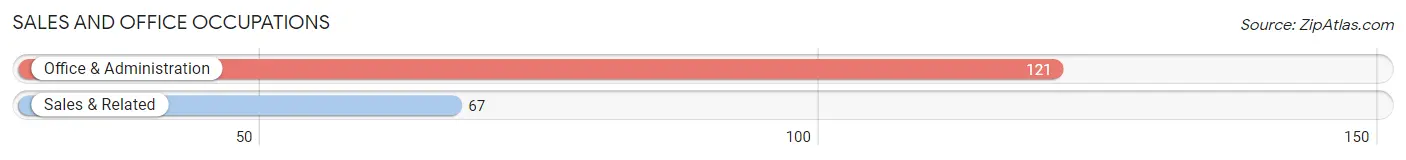
Sales and Office Occupations
The most common Sales and Office occupations in Arlington are Office & Administration (121 | 10.6%), and Sales & Related (67 | 5.9%).
Sales and Office Occupations by Sex
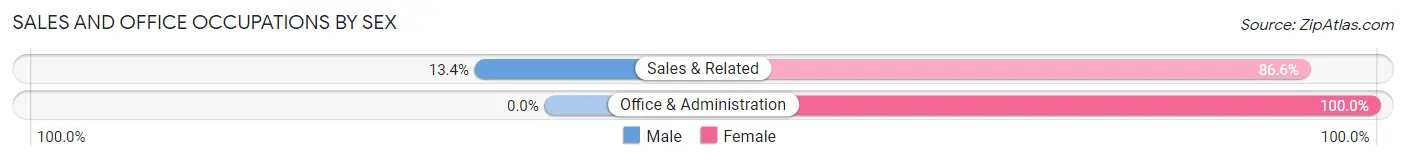
| Occupation | Male | Female |
| Sales & Related | 9 (13.4%) | 58 (86.6%) |
| Office & Administration | 0 (0.0%) | 121 (100.0%) |
| Total (Category) | 9 (4.8%) | 179 (95.2%) |
| Total (Overall) | 571 (50.2%) | 566 (49.8%) |
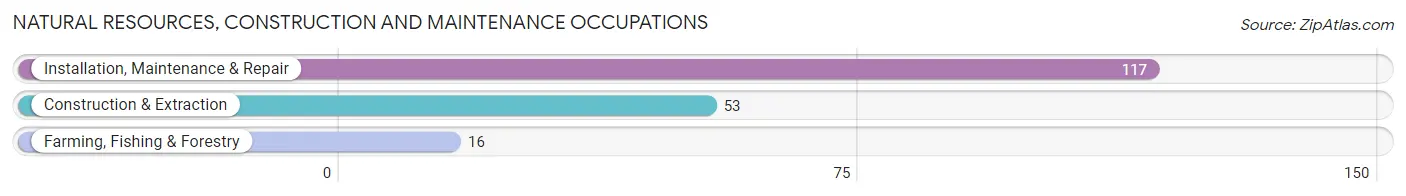
Natural Resources, Construction and Maintenance Occupations
The most common Natural Resources, Construction and Maintenance occupations in Arlington are Installation, Maintenance & Repair (117 | 10.3%), Construction & Extraction (53 | 4.7%), and Farming, Fishing & Forestry (16 | 1.4%).
Natural Resources, Construction and Maintenance Occupations by Sex
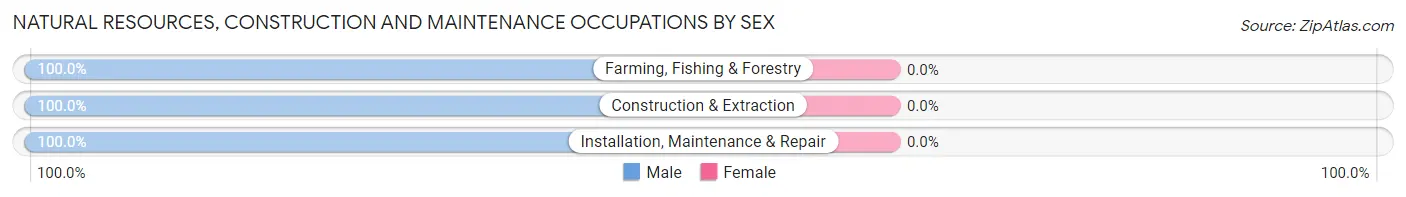
| Occupation | Male | Female |
| Farming, Fishing & Forestry | 16 (100.0%) | 0 (0.0%) |
| Construction & Extraction | 53 (100.0%) | 0 (0.0%) |
| Installation, Maintenance & Repair | 117 (100.0%) | 0 (0.0%) |
| Total (Category) | 186 (100.0%) | 0 (0.0%) |
| Total (Overall) | 571 (50.2%) | 566 (49.8%) |
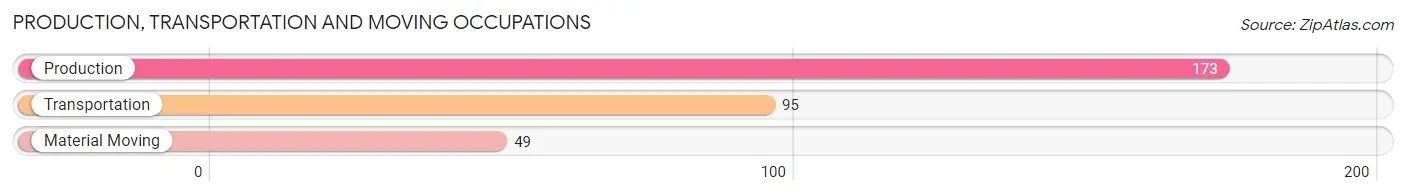
Production, Transportation and Moving Occupations
The most common Production, Transportation and Moving occupations in Arlington are Production (173 | 15.2%), Transportation (95 | 8.4%), and Material Moving (49 | 4.3%).
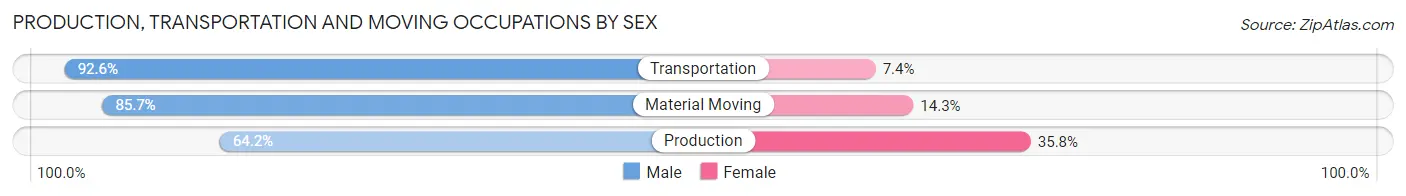
Production, Transportation and Moving Occupations by Sex
| Occupation | Male | Female |
| Production | 111 (64.2%) | 62 (35.8%) |
| Transportation | 88 (92.6%) | 7 (7.4%) |
| Material Moving | 42 (85.7%) | 7 (14.3%) |
| Total (Category) | 241 (76.0%) | 76 (24.0%) |
| Total (Overall) | 571 (50.2%) | 566 (49.8%) |
Employment Industries by Sex in Arlington
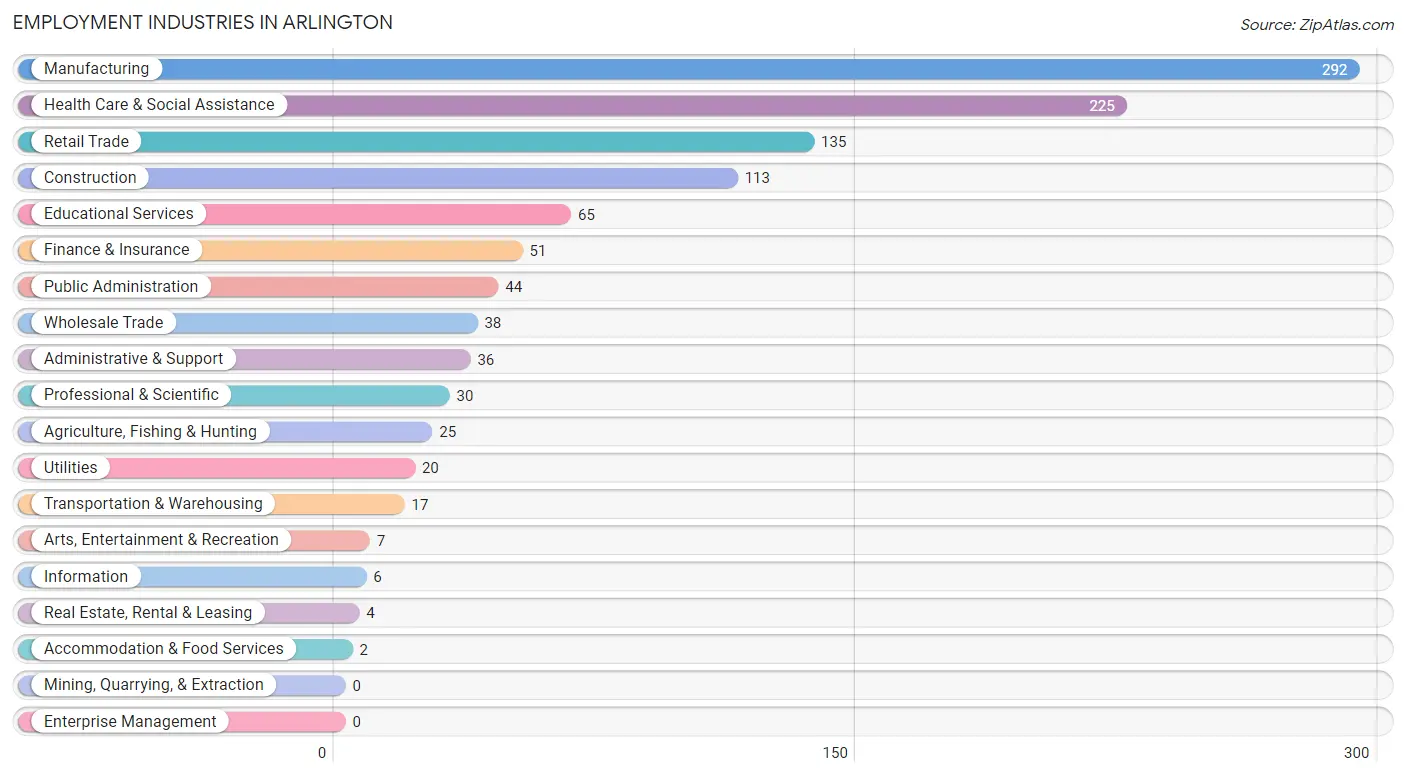
Employment Industries in Arlington
The major employment industries in Arlington include Manufacturing (292 | 25.7%), Health Care & Social Assistance (225 | 19.8%), Retail Trade (135 | 11.9%), Construction (113 | 9.9%), and Educational Services (65 | 5.7%).
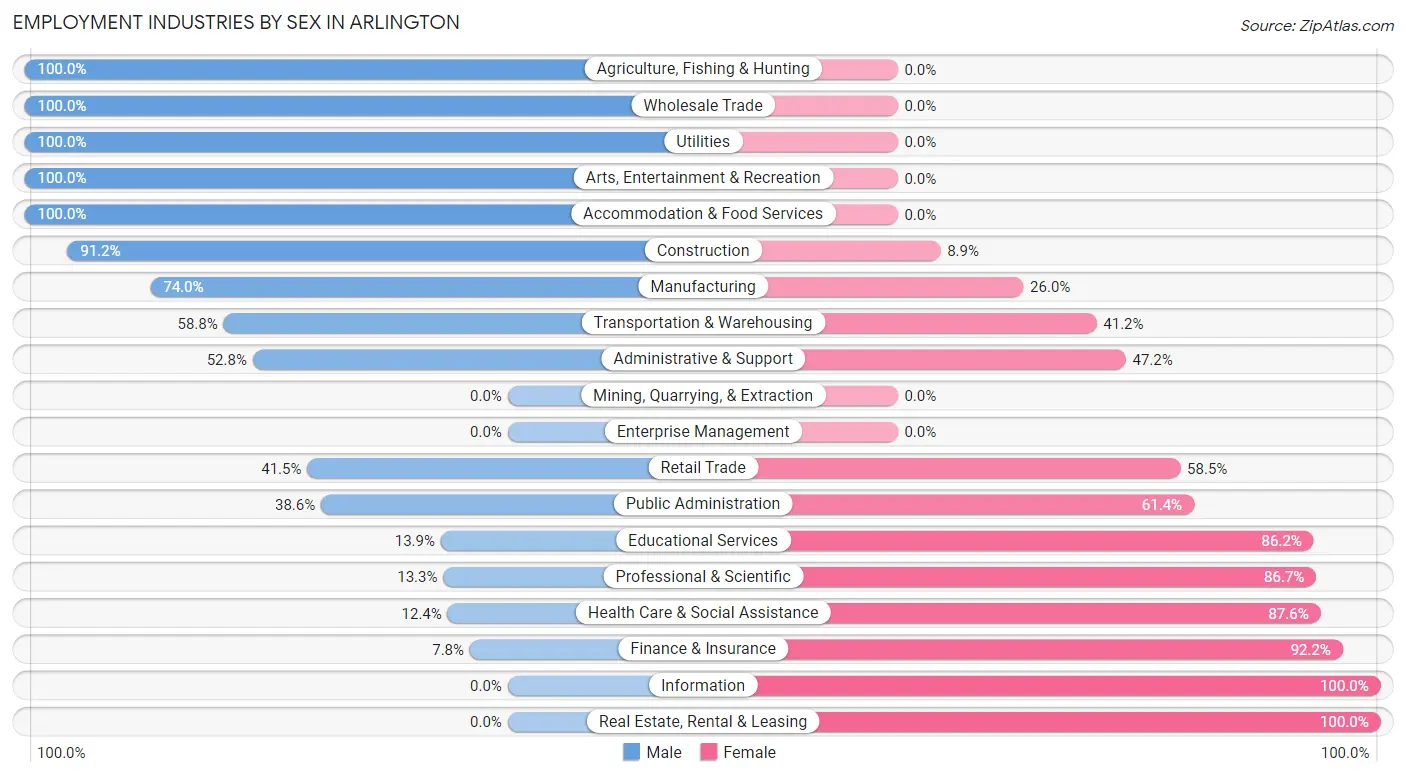
Employment Industries by Sex in Arlington
The Arlington industries that see more men than women are Agriculture, Fishing & Hunting (100.0%), Wholesale Trade (100.0%), and Utilities (100.0%), whereas the industries that tend to have a higher number of women are Information (100.0%), Real Estate, Rental & Leasing (100.0%), and Finance & Insurance (92.2%).
| Industry | Male | Female |
| Agriculture, Fishing & Hunting | 25 (100.0%) | 0 (0.0%) |
| Mining, Quarrying, & Extraction | 0 (0.0%) | 0 (0.0%) |
| Construction | 103 (91.1%) | 10 (8.8%) |
| Manufacturing | 216 (74.0%) | 76 (26.0%) |
| Wholesale Trade | 38 (100.0%) | 0 (0.0%) |
| Retail Trade | 56 (41.5%) | 79 (58.5%) |
| Transportation & Warehousing | 10 (58.8%) | 7 (41.2%) |
| Utilities | 20 (100.0%) | 0 (0.0%) |
| Information | 0 (0.0%) | 6 (100.0%) |
| Finance & Insurance | 4 (7.8%) | 47 (92.2%) |
| Real Estate, Rental & Leasing | 0 (0.0%) | 4 (100.0%) |
| Professional & Scientific | 4 (13.3%) | 26 (86.7%) |
| Enterprise Management | 0 (0.0%) | 0 (0.0%) |
| Administrative & Support | 19 (52.8%) | 17 (47.2%) |
| Educational Services | 9 (13.9%) | 56 (86.2%) |
| Health Care & Social Assistance | 28 (12.4%) | 197 (87.6%) |
| Arts, Entertainment & Recreation | 7 (100.0%) | 0 (0.0%) |
| Accommodation & Food Services | 2 (100.0%) | 0 (0.0%) |
| Public Administration | 17 (38.6%) | 27 (61.4%) |
| Total | 571 (50.2%) | 566 (49.8%) |
Education in Arlington
School Enrollment in Arlington
The most common levels of schooling among the 620 students in Arlington are middle school (150 | 24.2%), elementary school (149 | 24.0%), and high school (103 | 16.6%).
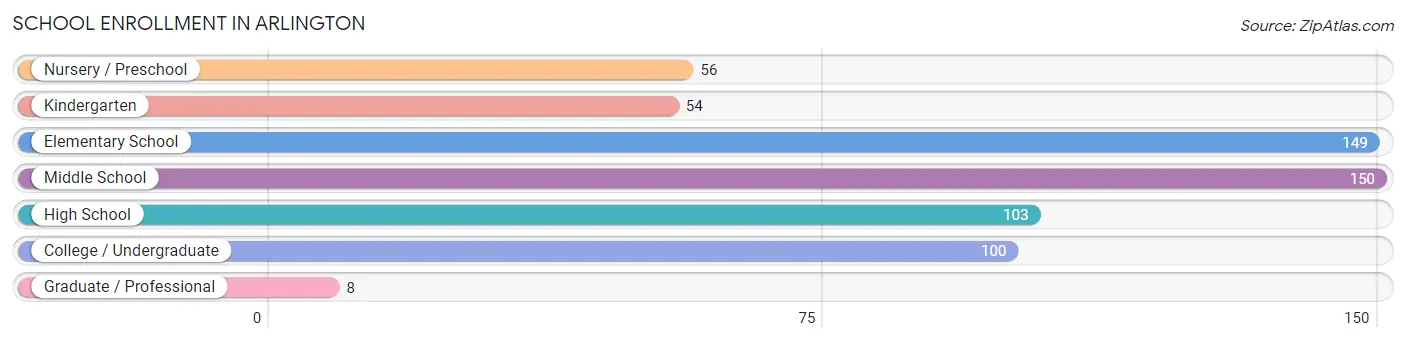
| School Level | # Students | % Students |
| Nursery / Preschool | 56 | 9.0% |
| Kindergarten | 54 | 8.7% |
| Elementary School | 149 | 24.0% |
| Middle School | 150 | 24.2% |
| High School | 103 | 16.6% |
| College / Undergraduate | 100 | 16.1% |
| Graduate / Professional | 8 | 1.3% |
| Total | 620 | 100.0% |
School Enrollment by Age by Funding Source in Arlington
Out of a total of 620 students who are enrolled in schools in Arlington, 99 (16.0%) attend a private institution, while the remaining 521 (84.0%) are enrolled in public schools. The age group of 25 to 34 year olds has the highest likelihood of being enrolled in private schools, with 39 (67.2% in the age bracket) enrolled. Conversely, the age group of 3 to 4 year olds has the lowest likelihood of being enrolled in a private school, with 14 (100.0% in the age bracket) attending a public institution.
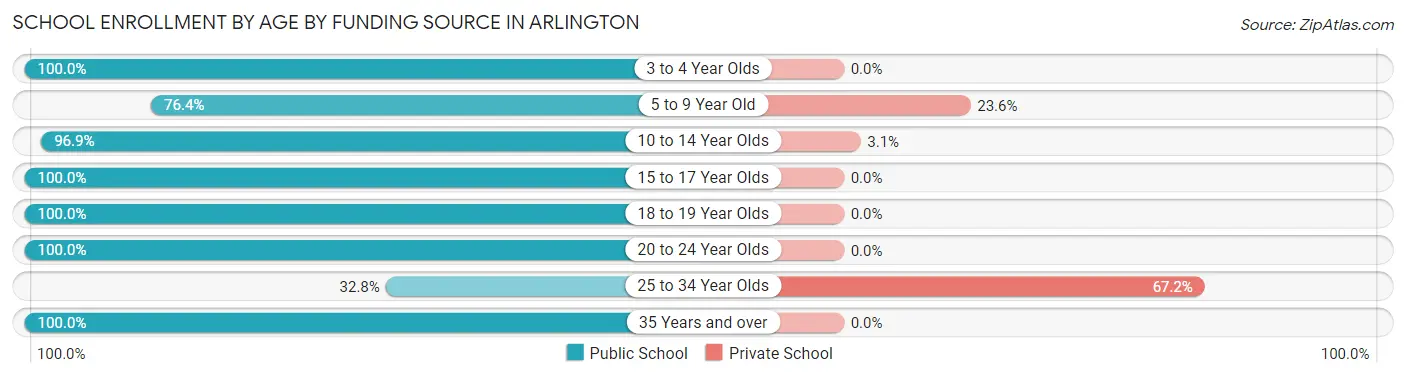
| Age Bracket | Public School | Private School |
| 3 to 4 Year Olds | 14 (100.0%) | 0 (0.0%) |
| 5 to 9 Year Old | 175 (76.4%) | 54 (23.6%) |
| 10 to 14 Year Olds | 187 (96.9%) | 6 (3.1%) |
| 15 to 17 Year Olds | 71 (100.0%) | 0 (0.0%) |
| 18 to 19 Year Olds | 27 (100.0%) | 0 (0.0%) |
| 20 to 24 Year Olds | 23 (100.0%) | 0 (0.0%) |
| 25 to 34 Year Olds | 19 (32.8%) | 39 (67.2%) |
| 35 Years and over | 5 (100.0%) | 0 (0.0%) |
| Total | 521 (84.0%) | 99 (16.0%) |
Educational Attainment by Field of Study in Arlington
Science & technology (99 | 33.2%), education (64 | 21.5%), arts & humanities (39 | 13.1%), business (27 | 9.1%), and bio, nature & agricultural (14 | 4.7%) are the most common fields of study among 298 individuals in Arlington who have obtained a bachelor's degree or higher.
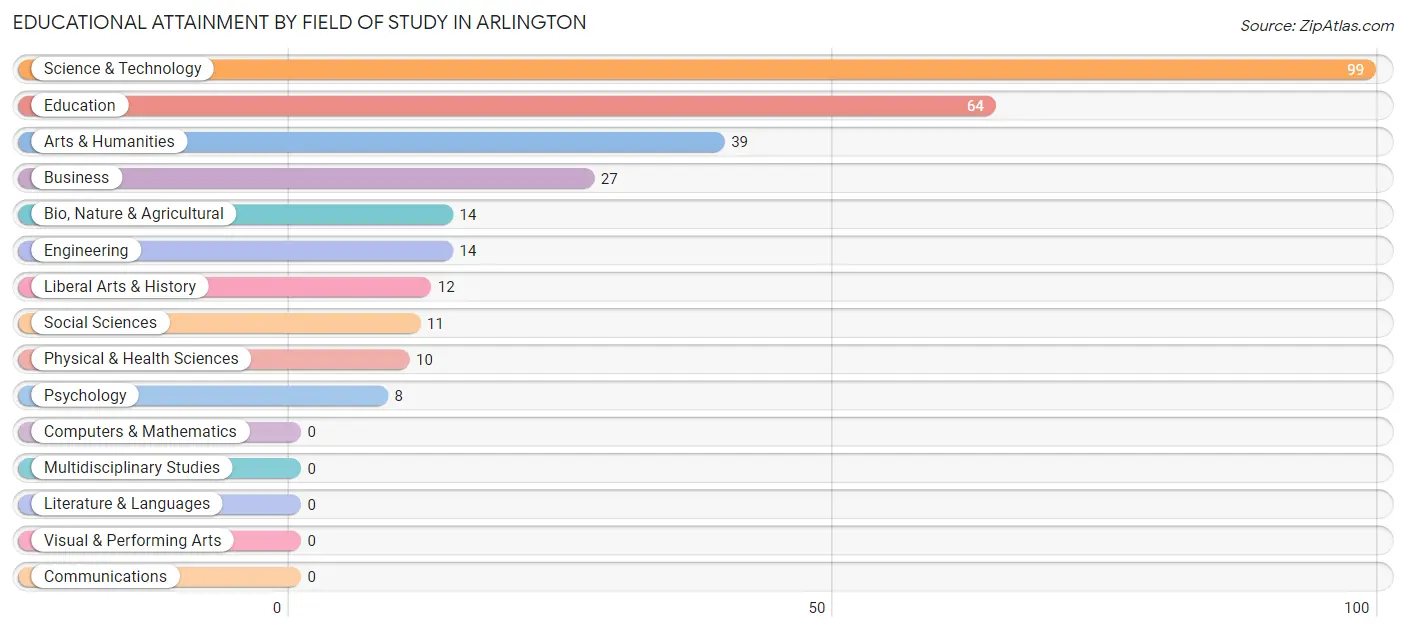
| Field of Study | # Graduates | % Graduates |
| Computers & Mathematics | 0 | 0.0% |
| Bio, Nature & Agricultural | 14 | 4.7% |
| Physical & Health Sciences | 10 | 3.4% |
| Psychology | 8 | 2.7% |
| Social Sciences | 11 | 3.7% |
| Engineering | 14 | 4.7% |
| Multidisciplinary Studies | 0 | 0.0% |
| Science & Technology | 99 | 33.2% |
| Business | 27 | 9.1% |
| Education | 64 | 21.5% |
| Literature & Languages | 0 | 0.0% |
| Liberal Arts & History | 12 | 4.0% |
| Visual & Performing Arts | 0 | 0.0% |
| Communications | 0 | 0.0% |
| Arts & Humanities | 39 | 13.1% |
| Total | 298 | 100.0% |
Transportation & Commute in Arlington
Vehicle Availability by Sex in Arlington
The most prevalent vehicle ownership categories in Arlington are males with 2 vehicles (295, accounting for 52.4%) and females with 2 vehicles (269, making up 52.5%).
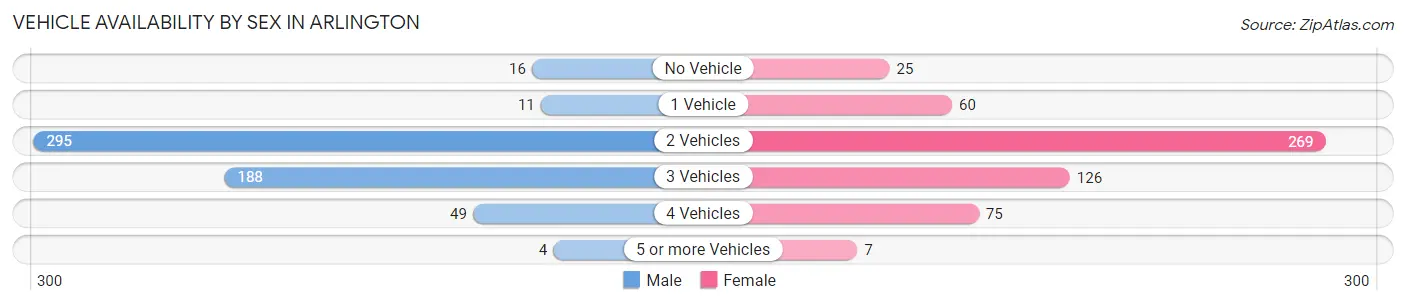
| Vehicles Available | Male | Female |
| No Vehicle | 16 (2.8%) | 25 (4.4%) |
| 1 Vehicle | 11 (1.9%) | 60 (10.7%) |
| 2 Vehicles | 295 (52.4%) | 269 (47.9%) |
| 3 Vehicles | 188 (33.4%) | 126 (22.4%) |
| 4 Vehicles | 49 (8.7%) | 75 (13.4%) |
| 5 or more Vehicles | 4 (0.7%) | 7 (1.3%) |
| Total | 563 (100.0%) | 562 (100.0%) |
Commute Time in Arlington
The most frequently occuring commute durations in Arlington are 5 to 9 minutes (222 commuters, 20.5%), 45 to 59 minutes (185 commuters, 17.1%), and 30 to 34 minutes (180 commuters, 16.7%).
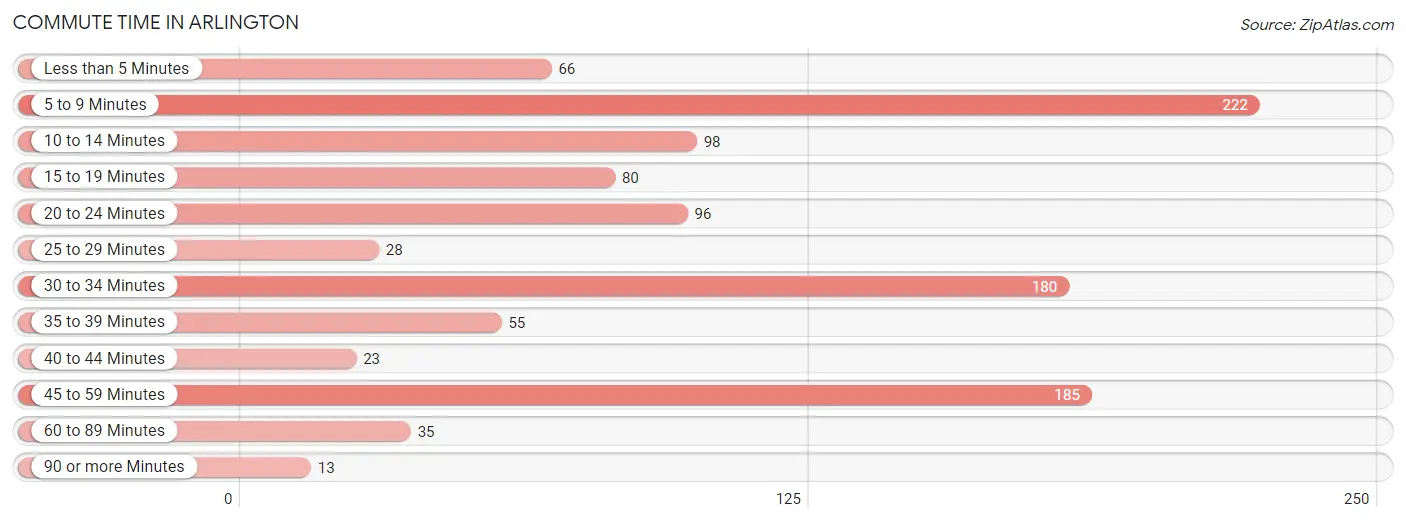
| Commute Time | # Commuters | % Commuters |
| Less than 5 Minutes | 66 | 6.1% |
| 5 to 9 Minutes | 222 | 20.5% |
| 10 to 14 Minutes | 98 | 9.1% |
| 15 to 19 Minutes | 80 | 7.4% |
| 20 to 24 Minutes | 96 | 8.9% |
| 25 to 29 Minutes | 28 | 2.6% |
| 30 to 34 Minutes | 180 | 16.7% |
| 35 to 39 Minutes | 55 | 5.1% |
| 40 to 44 Minutes | 23 | 2.1% |
| 45 to 59 Minutes | 185 | 17.1% |
| 60 to 89 Minutes | 35 | 3.2% |
| 90 or more Minutes | 13 | 1.2% |
Commute Time by Sex in Arlington
The most common commute times in Arlington are 5 to 9 minutes (121 commuters, 22.1%) for males and 30 to 34 minutes (127 commuters, 23.8%) for females.
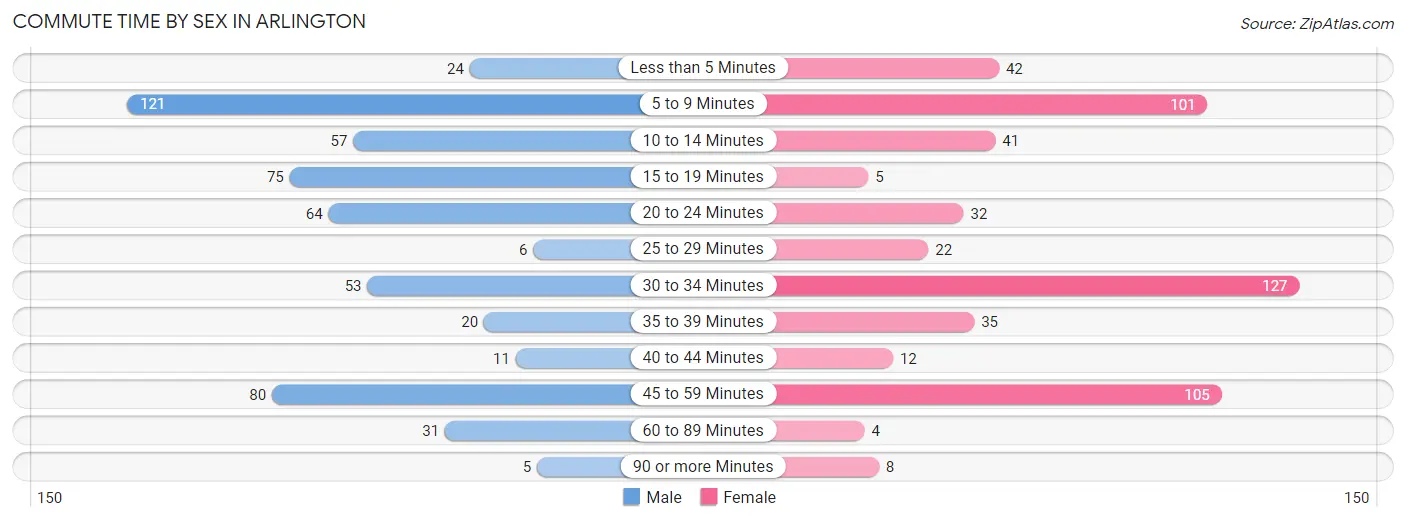
| Commute Time | Male | Female |
| Less than 5 Minutes | 24 (4.4%) | 42 (7.9%) |
| 5 to 9 Minutes | 121 (22.1%) | 101 (18.9%) |
| 10 to 14 Minutes | 57 (10.4%) | 41 (7.7%) |
| 15 to 19 Minutes | 75 (13.7%) | 5 (0.9%) |
| 20 to 24 Minutes | 64 (11.7%) | 32 (6.0%) |
| 25 to 29 Minutes | 6 (1.1%) | 22 (4.1%) |
| 30 to 34 Minutes | 53 (9.7%) | 127 (23.8%) |
| 35 to 39 Minutes | 20 (3.7%) | 35 (6.6%) |
| 40 to 44 Minutes | 11 (2.0%) | 12 (2.2%) |
| 45 to 59 Minutes | 80 (14.6%) | 105 (19.7%) |
| 60 to 89 Minutes | 31 (5.7%) | 4 (0.7%) |
| 90 or more Minutes | 5 (0.9%) | 8 (1.5%) |
Time of Departure to Work by Sex in Arlington
The most frequent times of departure to work in Arlington are 5:00 AM to 5:29 AM (97, 17.7%) for males and 7:30 AM to 7:59 AM (74, 13.9%) for females.
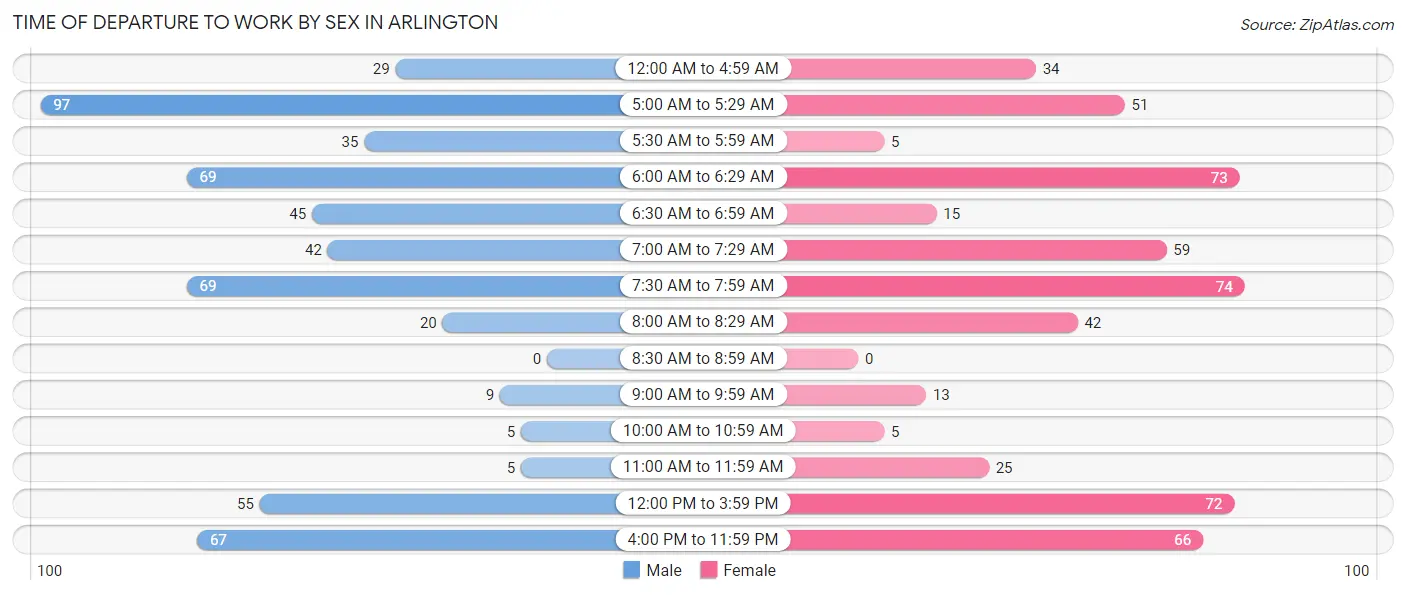
| Time of Departure | Male | Female |
| 12:00 AM to 4:59 AM | 29 (5.3%) | 34 (6.4%) |
| 5:00 AM to 5:29 AM | 97 (17.7%) | 51 (9.6%) |
| 5:30 AM to 5:59 AM | 35 (6.4%) | 5 (0.9%) |
| 6:00 AM to 6:29 AM | 69 (12.6%) | 73 (13.7%) |
| 6:30 AM to 6:59 AM | 45 (8.2%) | 15 (2.8%) |
| 7:00 AM to 7:29 AM | 42 (7.7%) | 59 (11.1%) |
| 7:30 AM to 7:59 AM | 69 (12.6%) | 74 (13.9%) |
| 8:00 AM to 8:29 AM | 20 (3.7%) | 42 (7.9%) |
| 8:30 AM to 8:59 AM | 0 (0.0%) | 0 (0.0%) |
| 9:00 AM to 9:59 AM | 9 (1.7%) | 13 (2.4%) |
| 10:00 AM to 10:59 AM | 5 (0.9%) | 5 (0.9%) |
| 11:00 AM to 11:59 AM | 5 (0.9%) | 25 (4.7%) |
| 12:00 PM to 3:59 PM | 55 (10.1%) | 72 (13.5%) |
| 4:00 PM to 11:59 PM | 67 (12.2%) | 66 (12.4%) |
| Total | 547 (100.0%) | 534 (100.0%) |
Housing Occupancy in Arlington
Occupancy by Ownership in Arlington
Of the total 888 dwellings in Arlington, owner-occupied units account for 628 (70.7%), while renter-occupied units make up 260 (29.3%).
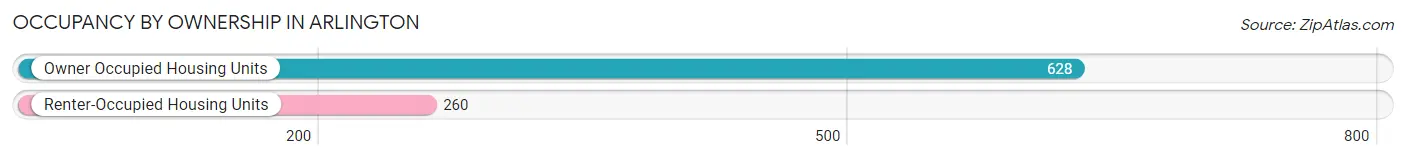
| Occupancy | # Housing Units | % Housing Units |
| Owner Occupied Housing Units | 628 | 70.7% |
| Renter-Occupied Housing Units | 260 | 29.3% |
| Total Occupied Housing Units | 888 | 100.0% |
Occupancy by Household Size in Arlington
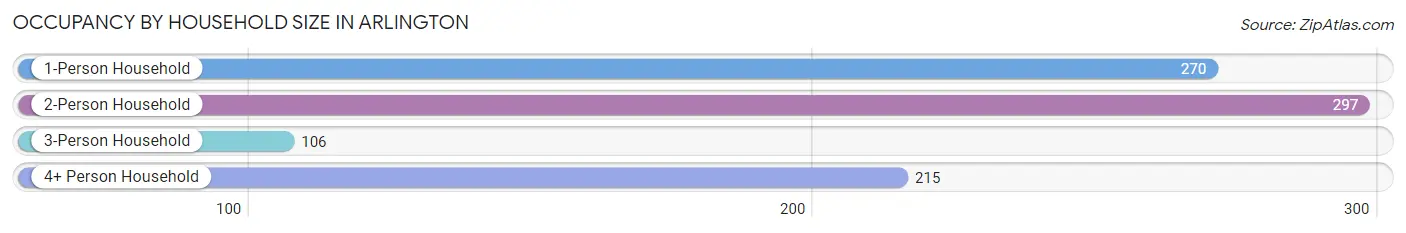
| Household Size | # Housing Units | % Housing Units |
| 1-Person Household | 270 | 30.4% |
| 2-Person Household | 297 | 33.5% |
| 3-Person Household | 106 | 11.9% |
| 4+ Person Household | 215 | 24.2% |
| Total Housing Units | 888 | 100.0% |
Occupancy by Ownership by Household Size in Arlington
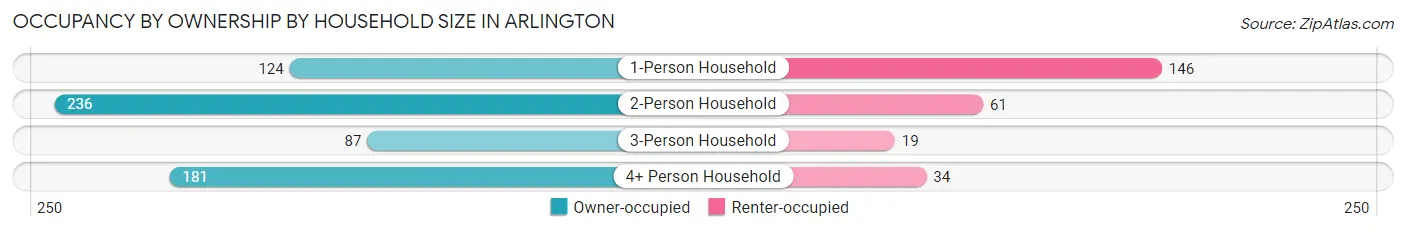
| Household Size | Owner-occupied | Renter-occupied |
| 1-Person Household | 124 (45.9%) | 146 (54.1%) |
| 2-Person Household | 236 (79.5%) | 61 (20.5%) |
| 3-Person Household | 87 (82.1%) | 19 (17.9%) |
| 4+ Person Household | 181 (84.2%) | 34 (15.8%) |
| Total Housing Units | 628 (70.7%) | 260 (29.3%) |
Occupancy by Educational Attainment in Arlington
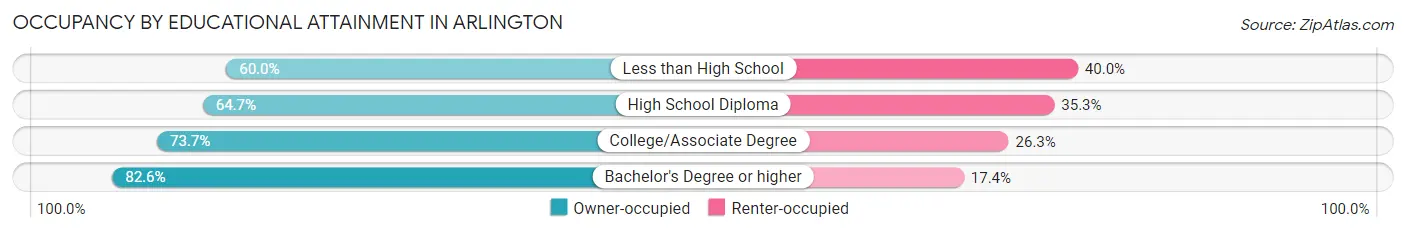
| Household Size | Owner-occupied | Renter-occupied |
| Less than High School | 45 (60.0%) | 30 (40.0%) |
| High School Diploma | 205 (64.7%) | 112 (35.3%) |
| College/Associate Degree | 264 (73.7%) | 94 (26.3%) |
| Bachelor's Degree or higher | 114 (82.6%) | 24 (17.4%) |
Occupancy by Age of Householder in Arlington
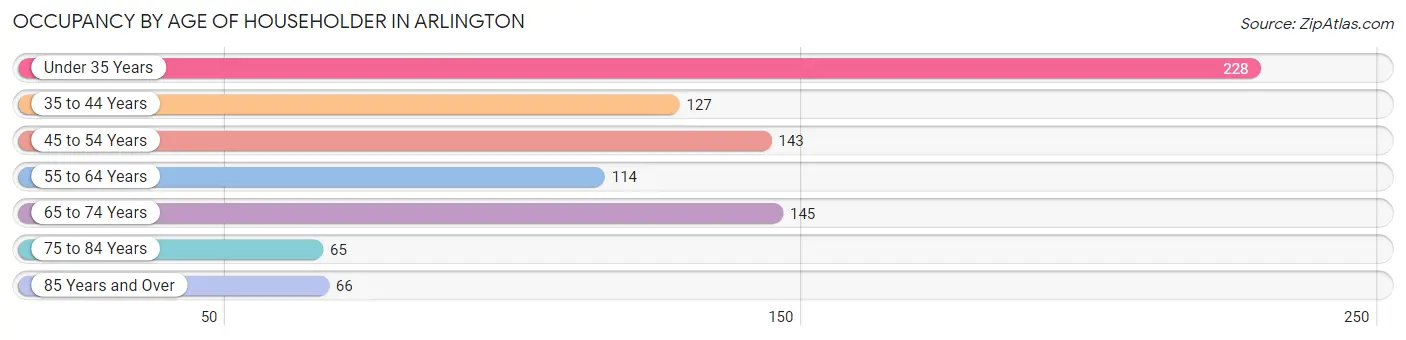
| Age Bracket | # Households | % Households |
| Under 35 Years | 228 | 25.7% |
| 35 to 44 Years | 127 | 14.3% |
| 45 to 54 Years | 143 | 16.1% |
| 55 to 64 Years | 114 | 12.8% |
| 65 to 74 Years | 145 | 16.3% |
| 75 to 84 Years | 65 | 7.3% |
| 85 Years and Over | 66 | 7.4% |
| Total | 888 | 100.0% |
Housing Finances in Arlington
Median Income by Occupancy in Arlington
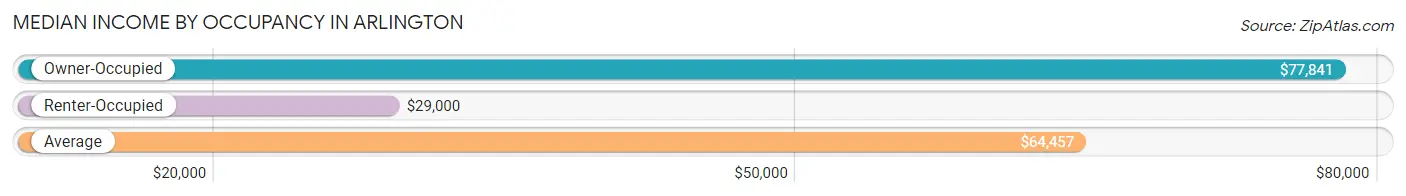
| Occupancy Type | # Households | Median Income |
| Owner-Occupied | 628 (70.7%) | $77,841 |
| Renter-Occupied | 260 (29.3%) | $29,000 |
| Average | 888 (100.0%) | $64,457 |
Occupancy by Householder Income Bracket in Arlington
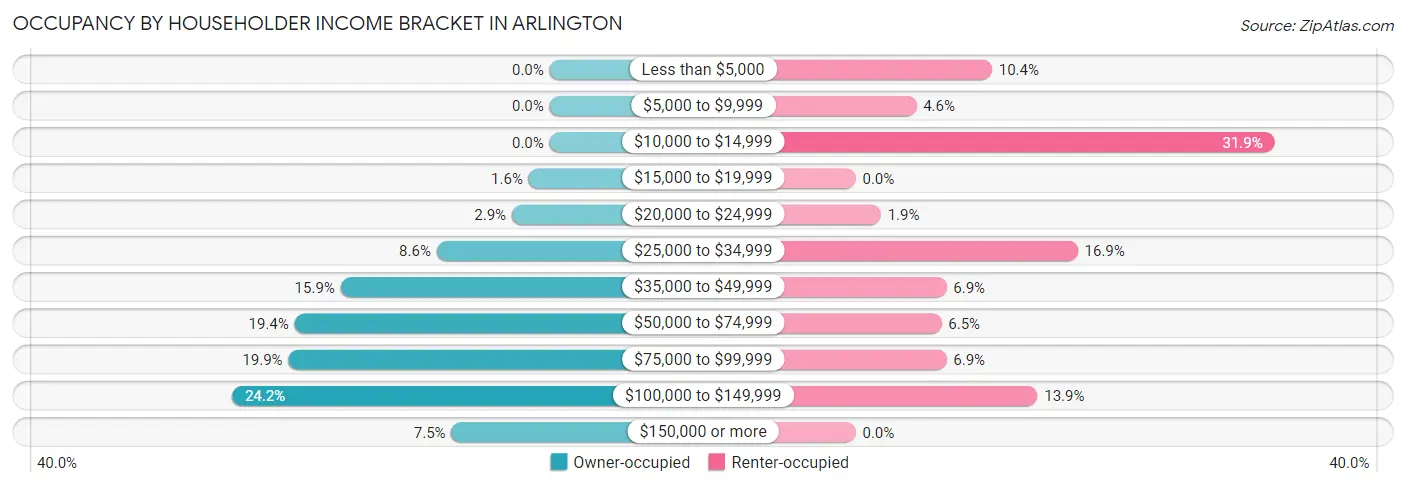
| Income Bracket | Owner-occupied | Renter-occupied |
| Less than $5,000 | 0 (0.0%) | 27 (10.4%) |
| $5,000 to $9,999 | 0 (0.0%) | 12 (4.6%) |
| $10,000 to $14,999 | 0 (0.0%) | 83 (31.9%) |
| $15,000 to $19,999 | 10 (1.6%) | 0 (0.0%) |
| $20,000 to $24,999 | 18 (2.9%) | 5 (1.9%) |
| $25,000 to $34,999 | 54 (8.6%) | 44 (16.9%) |
| $35,000 to $49,999 | 100 (15.9%) | 18 (6.9%) |
| $50,000 to $74,999 | 122 (19.4%) | 17 (6.5%) |
| $75,000 to $99,999 | 125 (19.9%) | 18 (6.9%) |
| $100,000 to $149,999 | 152 (24.2%) | 36 (13.9%) |
| $150,000 or more | 47 (7.5%) | 0 (0.0%) |
| Total | 628 (100.0%) | 260 (100.0%) |
Monthly Housing Cost Tiers in Arlington
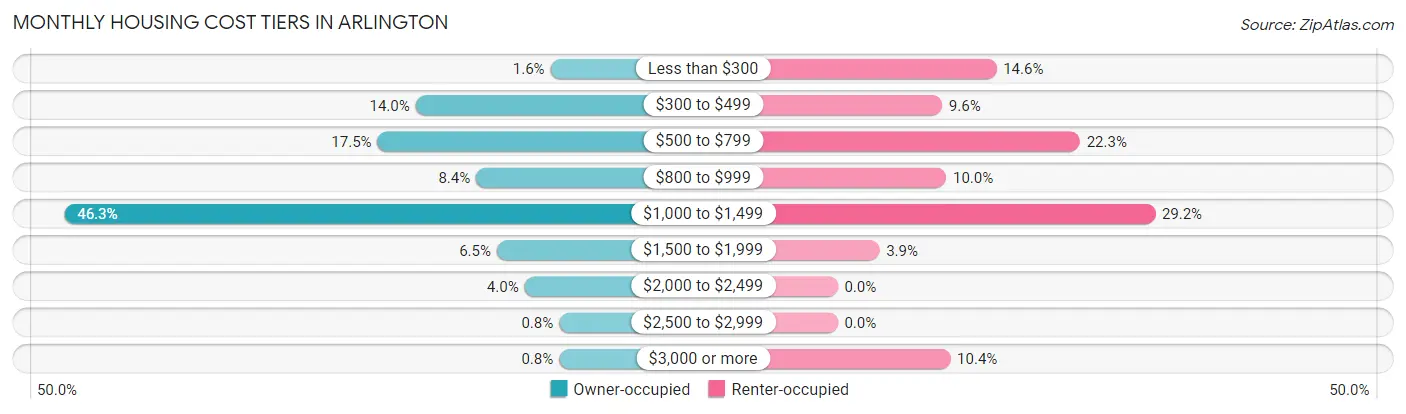
| Monthly Cost | Owner-occupied | Renter-occupied |
| Less than $300 | 10 (1.6%) | 38 (14.6%) |
| $300 to $499 | 88 (14.0%) | 25 (9.6%) |
| $500 to $799 | 110 (17.5%) | 58 (22.3%) |
| $800 to $999 | 53 (8.4%) | 26 (10.0%) |
| $1,000 to $1,499 | 291 (46.3%) | 76 (29.2%) |
| $1,500 to $1,999 | 41 (6.5%) | 10 (3.8%) |
| $2,000 to $2,499 | 25 (4.0%) | 0 (0.0%) |
| $2,500 to $2,999 | 5 (0.8%) | 0 (0.0%) |
| $3,000 or more | 5 (0.8%) | 27 (10.4%) |
| Total | 628 (100.0%) | 260 (100.0%) |
Physical Housing Characteristics in Arlington
Housing Structures in Arlington
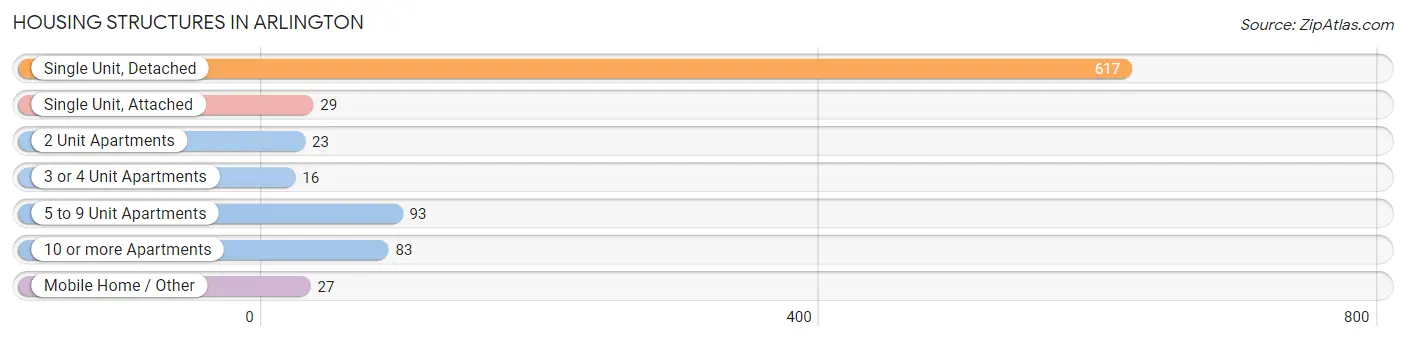
| Structure Type | # Housing Units | % Housing Units |
| Single Unit, Detached | 617 | 69.5% |
| Single Unit, Attached | 29 | 3.3% |
| 2 Unit Apartments | 23 | 2.6% |
| 3 or 4 Unit Apartments | 16 | 1.8% |
| 5 to 9 Unit Apartments | 93 | 10.5% |
| 10 or more Apartments | 83 | 9.3% |
| Mobile Home / Other | 27 | 3.0% |
| Total | 888 | 100.0% |
Housing Structures by Occupancy in Arlington
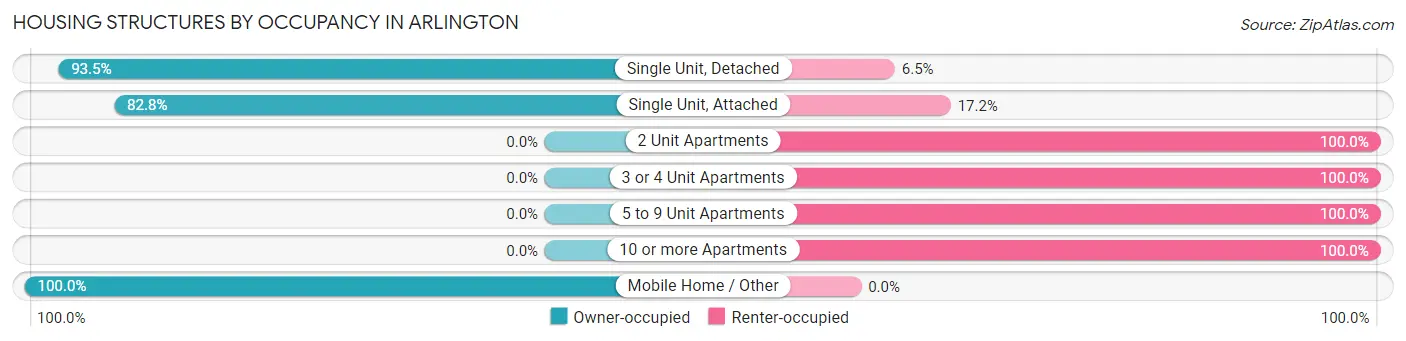
| Structure Type | Owner-occupied | Renter-occupied |
| Single Unit, Detached | 577 (93.5%) | 40 (6.5%) |
| Single Unit, Attached | 24 (82.8%) | 5 (17.2%) |
| 2 Unit Apartments | 0 (0.0%) | 23 (100.0%) |
| 3 or 4 Unit Apartments | 0 (0.0%) | 16 (100.0%) |
| 5 to 9 Unit Apartments | 0 (0.0%) | 93 (100.0%) |
| 10 or more Apartments | 0 (0.0%) | 83 (100.0%) |
| Mobile Home / Other | 27 (100.0%) | 0 (0.0%) |
| Total | 628 (70.7%) | 260 (29.3%) |
Housing Structures by Number of Rooms in Arlington
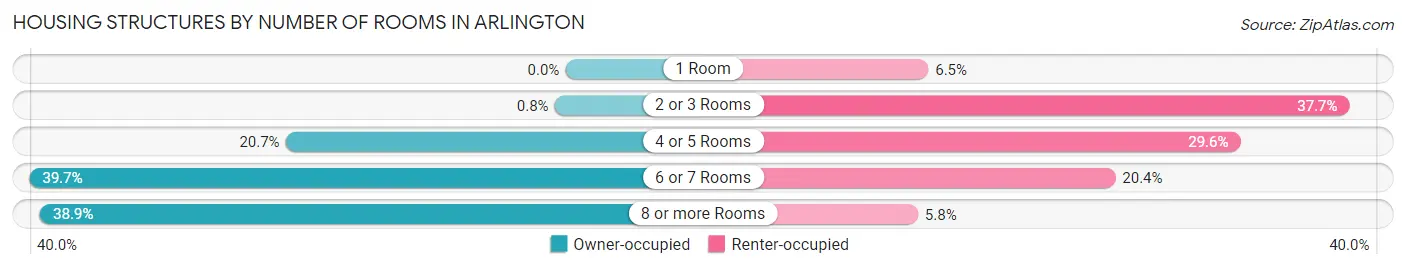
| Number of Rooms | Owner-occupied | Renter-occupied |
| 1 Room | 0 (0.0%) | 17 (6.5%) |
| 2 or 3 Rooms | 5 (0.8%) | 98 (37.7%) |
| 4 or 5 Rooms | 130 (20.7%) | 77 (29.6%) |
| 6 or 7 Rooms | 249 (39.7%) | 53 (20.4%) |
| 8 or more Rooms | 244 (38.9%) | 15 (5.8%) |
| Total | 628 (100.0%) | 260 (100.0%) |
Housing Structure by Heating Type in Arlington
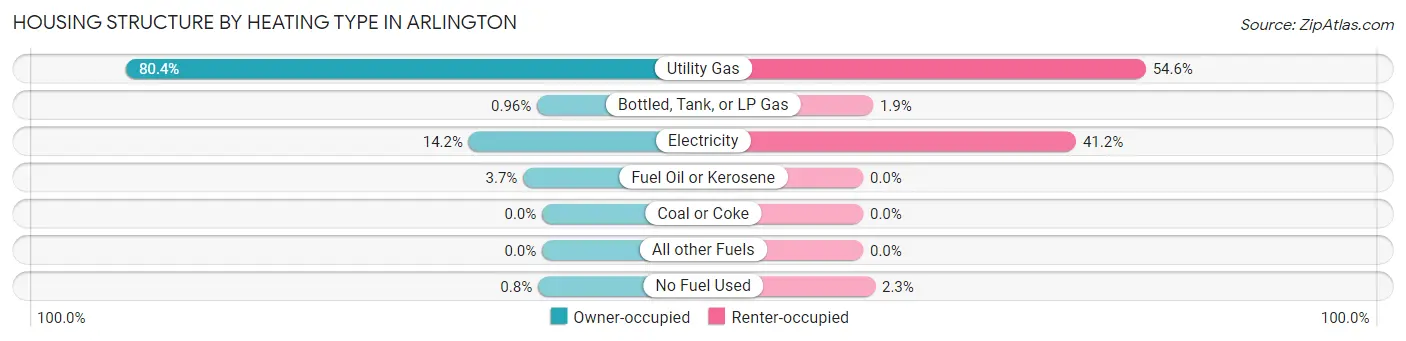
| Heating Type | Owner-occupied | Renter-occupied |
| Utility Gas | 505 (80.4%) | 142 (54.6%) |
| Bottled, Tank, or LP Gas | 6 (1.0%) | 5 (1.9%) |
| Electricity | 89 (14.2%) | 107 (41.1%) |
| Fuel Oil or Kerosene | 23 (3.7%) | 0 (0.0%) |
| Coal or Coke | 0 (0.0%) | 0 (0.0%) |
| All other Fuels | 0 (0.0%) | 0 (0.0%) |
| No Fuel Used | 5 (0.8%) | 6 (2.3%) |
| Total | 628 (100.0%) | 260 (100.0%) |
Household Vehicle Usage in Arlington
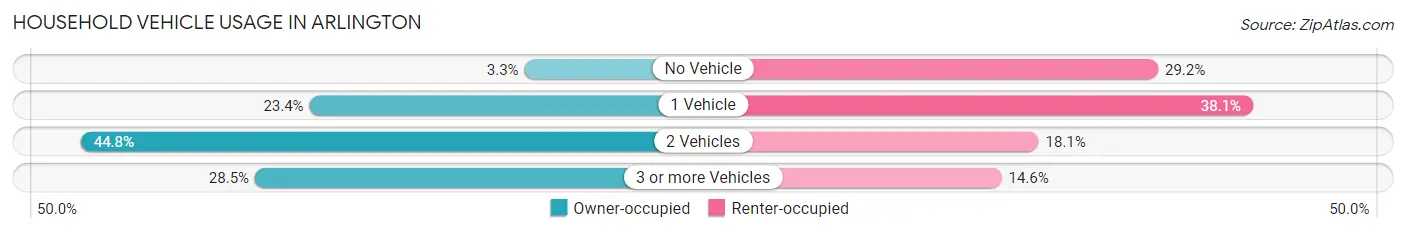
| Vehicles per Household | Owner-occupied | Renter-occupied |
| No Vehicle | 21 (3.3%) | 76 (29.2%) |
| 1 Vehicle | 147 (23.4%) | 99 (38.1%) |
| 2 Vehicles | 281 (44.8%) | 47 (18.1%) |
| 3 or more Vehicles | 179 (28.5%) | 38 (14.6%) |
| Total | 628 (100.0%) | 260 (100.0%) |
Real Estate & Mortgages in Arlington
Real Estate and Mortgage Overview in Arlington
| Characteristic | Without Mortgage | With Mortgage |
| Housing Units | 211 | 417 |
| Median Property Value | $152,800 | $184,500 |
| Median Household Income | $39,879 | $30 |
| Monthly Housing Costs | $516 | $5 |
| Real Estate Taxes | $1,712 | $0 |
Property Value by Mortgage Status in Arlington
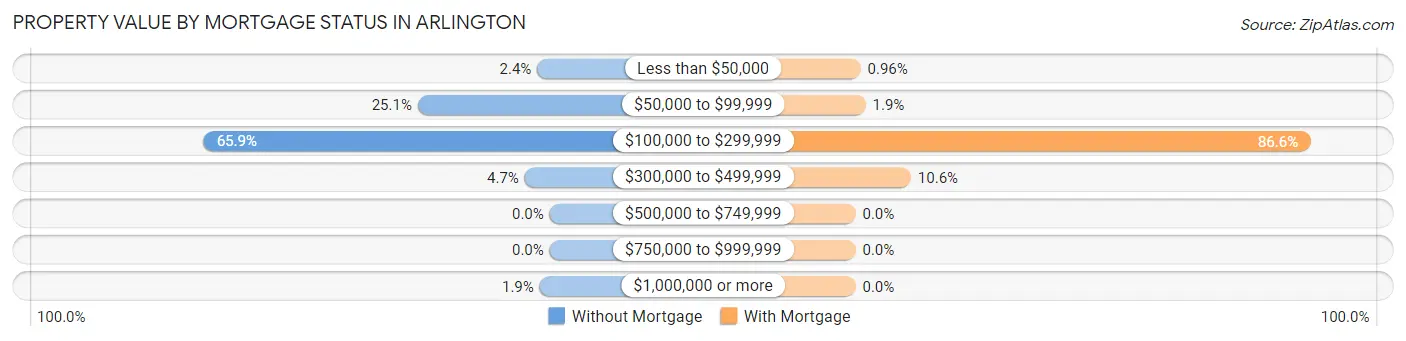
| Property Value | Without Mortgage | With Mortgage |
| Less than $50,000 | 5 (2.4%) | 4 (1.0%) |
| $50,000 to $99,999 | 53 (25.1%) | 8 (1.9%) |
| $100,000 to $299,999 | 139 (65.9%) | 361 (86.6%) |
| $300,000 to $499,999 | 10 (4.7%) | 44 (10.5%) |
| $500,000 to $749,999 | 0 (0.0%) | 0 (0.0%) |
| $750,000 to $999,999 | 0 (0.0%) | 0 (0.0%) |
| $1,000,000 or more | 4 (1.9%) | 0 (0.0%) |
| Total | 211 (100.0%) | 417 (100.0%) |
Household Income by Mortgage Status in Arlington
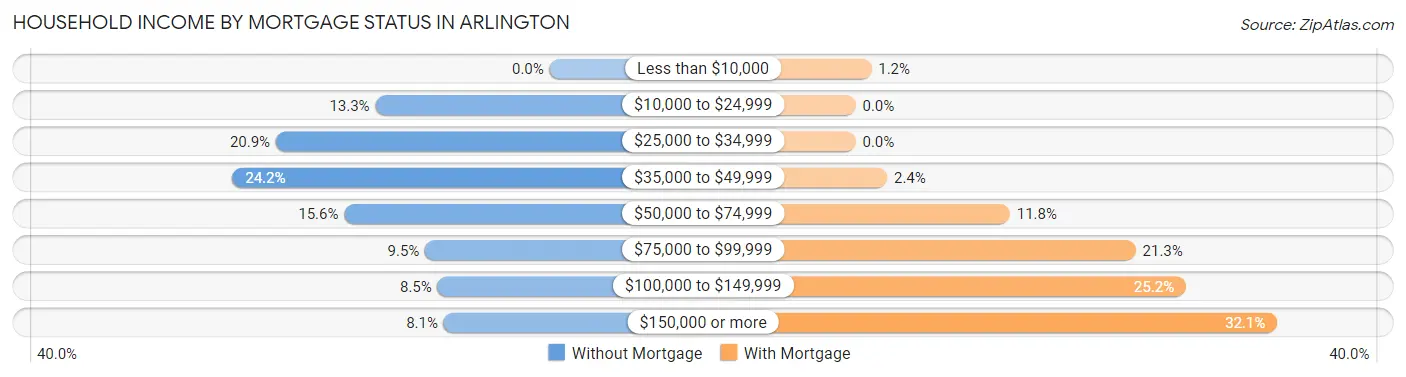
| Household Income | Without Mortgage | With Mortgage |
| Less than $10,000 | 0 (0.0%) | 5 (1.2%) |
| $10,000 to $24,999 | 28 (13.3%) | 0 (0.0%) |
| $25,000 to $34,999 | 44 (20.8%) | 0 (0.0%) |
| $35,000 to $49,999 | 51 (24.2%) | 10 (2.4%) |
| $50,000 to $74,999 | 33 (15.6%) | 49 (11.7%) |
| $75,000 to $99,999 | 20 (9.5%) | 89 (21.3%) |
| $100,000 to $149,999 | 18 (8.5%) | 105 (25.2%) |
| $150,000 or more | 17 (8.1%) | 134 (32.1%) |
| Total | 211 (100.0%) | 417 (100.0%) |
Property Value to Household Income Ratio in Arlington
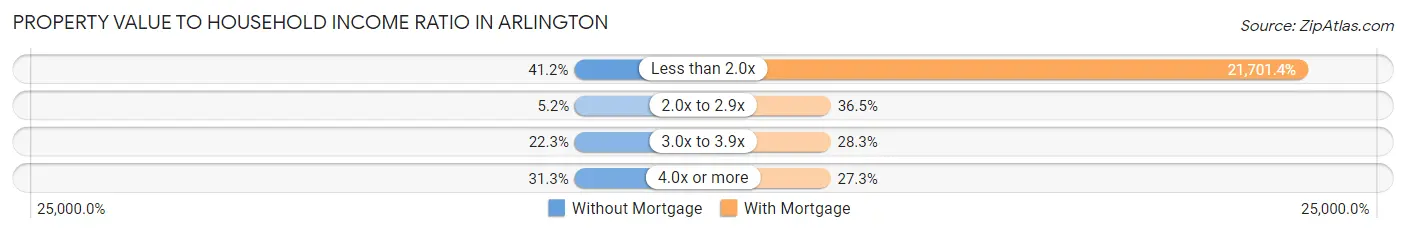
| Value-to-Income Ratio | Without Mortgage | With Mortgage |
| Less than 2.0x | 87 (41.2%) | 90,495 (21,701.4%) |
| 2.0x to 2.9x | 11 (5.2%) | 152 (36.4%) |
| 3.0x to 3.9x | 47 (22.3%) | 118 (28.3%) |
| 4.0x or more | 66 (31.3%) | 114 (27.3%) |
| Total | 211 (100.0%) | 417 (100.0%) |
Real Estate Taxes by Mortgage Status in Arlington
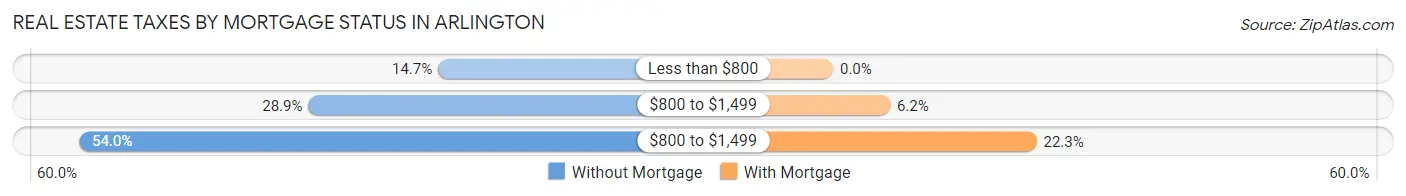
| Property Taxes | Without Mortgage | With Mortgage |
| Less than $800 | 31 (14.7%) | 0 (0.0%) |
| $800 to $1,499 | 61 (28.9%) | 26 (6.2%) |
| $800 to $1,499 | 114 (54.0%) | 93 (22.3%) |
| Total | 211 (100.0%) | 417 (100.0%) |
Health & Disability in Arlington
Health Insurance Coverage by Age in Arlington
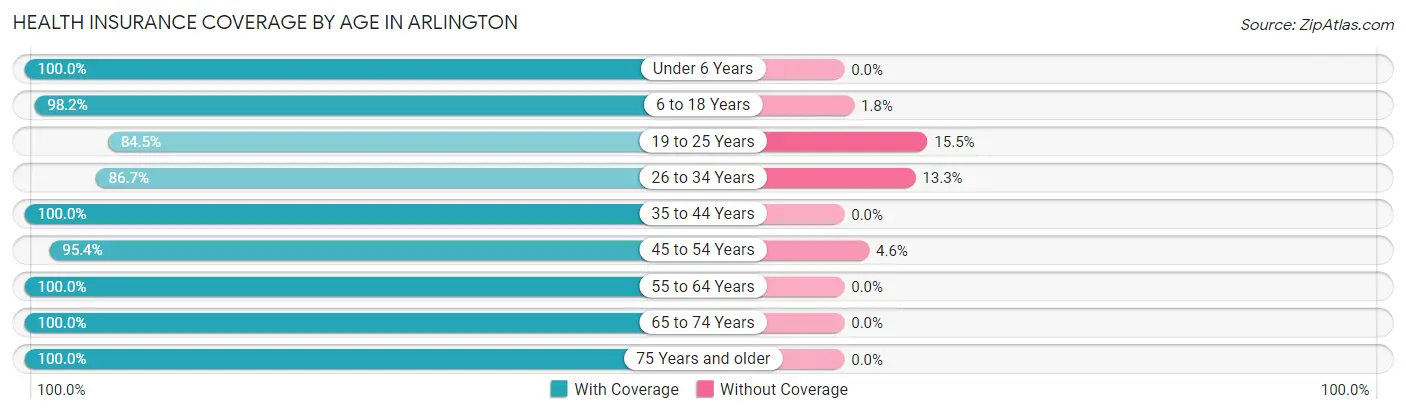
| Age Bracket | With Coverage | Without Coverage |
| Under 6 Years | 230 (100.0%) | 0 (0.0%) |
| 6 to 18 Years | 485 (98.2%) | 9 (1.8%) |
| 19 to 25 Years | 229 (84.5%) | 42 (15.5%) |
| 26 to 34 Years | 301 (86.7%) | 46 (13.3%) |
| 35 to 44 Years | 220 (100.0%) | 0 (0.0%) |
| 45 to 54 Years | 227 (95.4%) | 11 (4.6%) |
| 55 to 64 Years | 195 (100.0%) | 0 (0.0%) |
| 65 to 74 Years | 213 (100.0%) | 0 (0.0%) |
| 75 Years and older | 188 (100.0%) | 0 (0.0%) |
| Total | 2,288 (95.5%) | 108 (4.5%) |
Health Insurance Coverage by Citizenship Status in Arlington
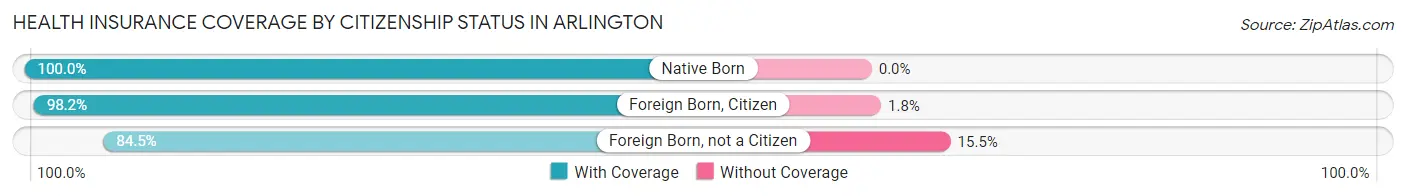
| Citizenship Status | With Coverage | Without Coverage |
| Native Born | 230 (100.0%) | 0 (0.0%) |
| Foreign Born, Citizen | 485 (98.2%) | 9 (1.8%) |
| Foreign Born, not a Citizen | 229 (84.5%) | 42 (15.5%) |
Health Insurance Coverage by Household Income in Arlington
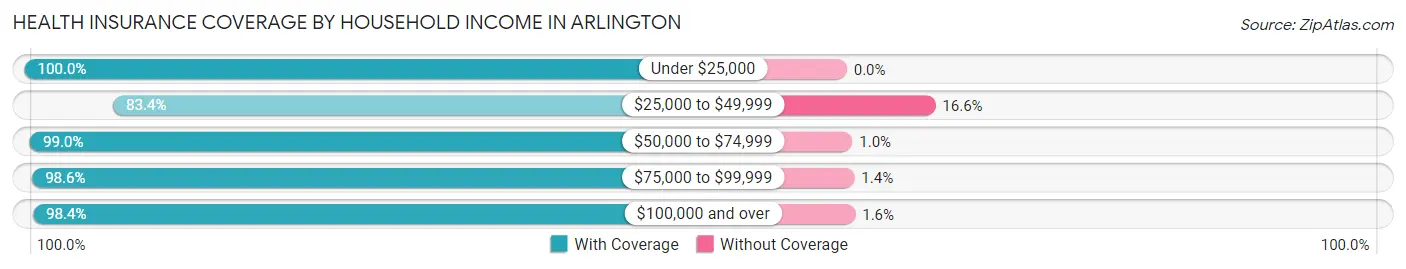
| Household Income | With Coverage | Without Coverage |
| Under $25,000 | 183 (100.0%) | 0 (0.0%) |
| $25,000 to $49,999 | 422 (83.4%) | 84 (16.6%) |
| $50,000 to $74,999 | 381 (99.0%) | 4 (1.0%) |
| $75,000 to $99,999 | 484 (98.6%) | 7 (1.4%) |
| $100,000 and over | 803 (98.4%) | 13 (1.6%) |
Public vs Private Health Insurance Coverage by Age in Arlington
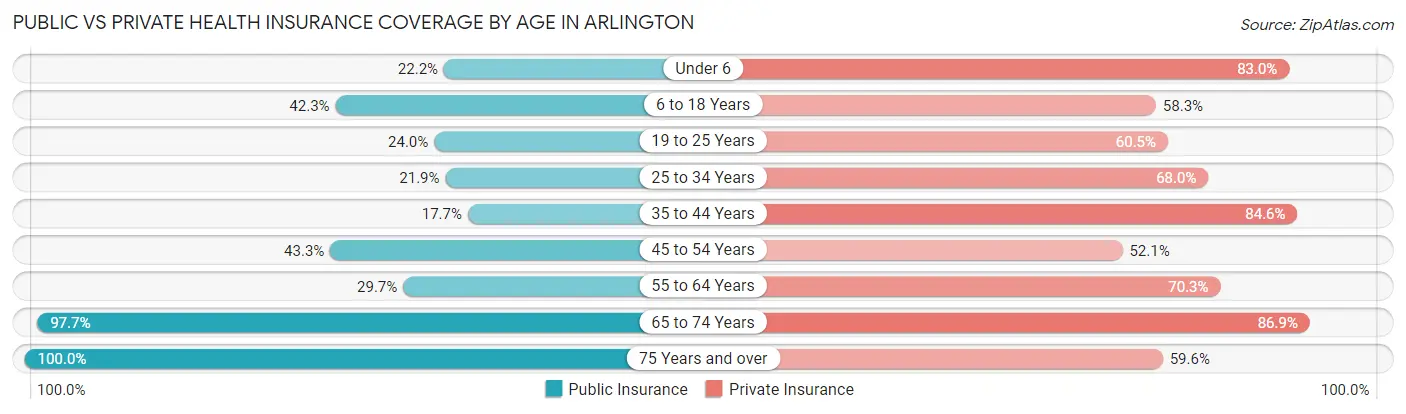
| Age Bracket | Public Insurance | Private Insurance |
| Under 6 | 51 (22.2%) | 191 (83.0%) |
| 6 to 18 Years | 209 (42.3%) | 288 (58.3%) |
| 19 to 25 Years | 65 (24.0%) | 164 (60.5%) |
| 25 to 34 Years | 76 (21.9%) | 236 (68.0%) |
| 35 to 44 Years | 39 (17.7%) | 186 (84.6%) |
| 45 to 54 Years | 103 (43.3%) | 124 (52.1%) |
| 55 to 64 Years | 58 (29.7%) | 137 (70.3%) |
| 65 to 74 Years | 208 (97.7%) | 185 (86.9%) |
| 75 Years and over | 188 (100.0%) | 112 (59.6%) |
| Total | 997 (41.6%) | 1,623 (67.7%) |
Disability Status by Sex by Age in Arlington
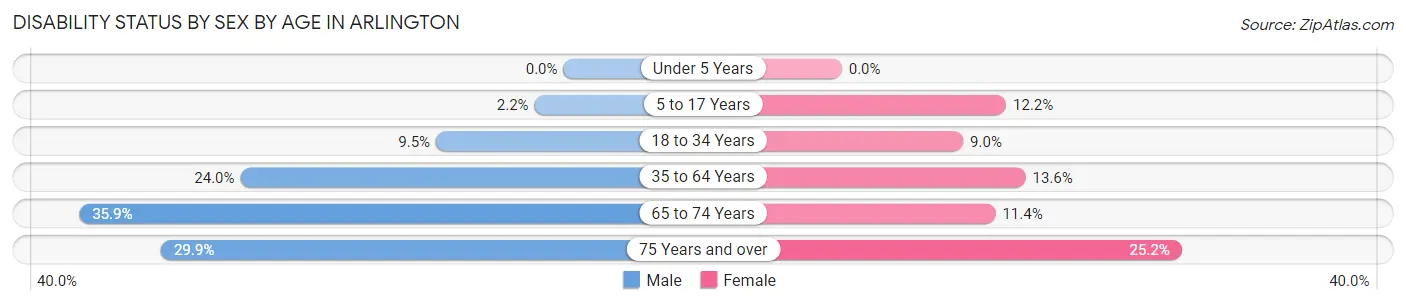
| Age Bracket | Male | Female |
| Under 5 Years | 0 (0.0%) | 0 (0.0%) |
| 5 to 17 Years | 5 (2.1%) | 35 (12.2%) |
| 18 to 34 Years | 28 (9.5%) | 31 (9.0%) |
| 35 to 64 Years | 88 (24.0%) | 39 (13.6%) |
| 65 to 74 Years | 23 (35.9%) | 17 (11.4%) |
| 75 Years and over | 23 (29.9%) | 28 (25.2%) |
Disability Class by Sex by Age in Arlington
Disability Class: Hearing Difficulty
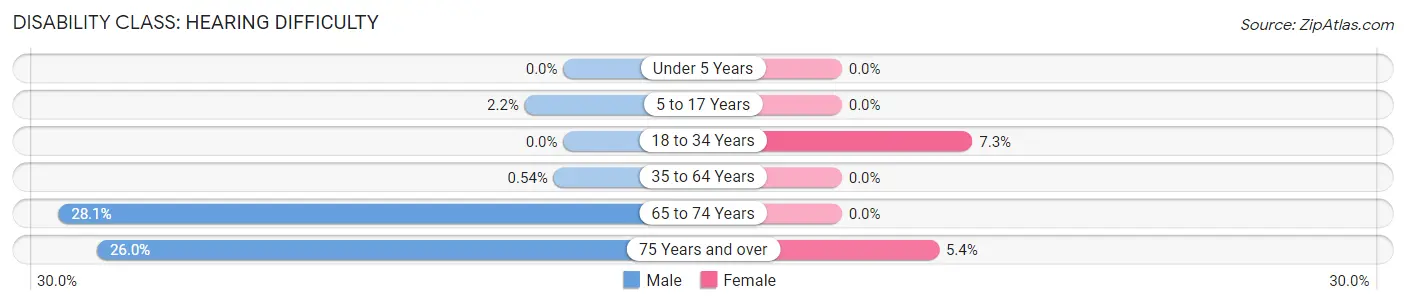
| Age Bracket | Male | Female |
| Under 5 Years | 0 (0.0%) | 0 (0.0%) |
| 5 to 17 Years | 5 (2.1%) | 0 (0.0%) |
| 18 to 34 Years | 0 (0.0%) | 25 (7.3%) |
| 35 to 64 Years | 2 (0.5%) | 0 (0.0%) |
| 65 to 74 Years | 18 (28.1%) | 0 (0.0%) |
| 75 Years and over | 20 (26.0%) | 6 (5.4%) |
Disability Class: Vision Difficulty
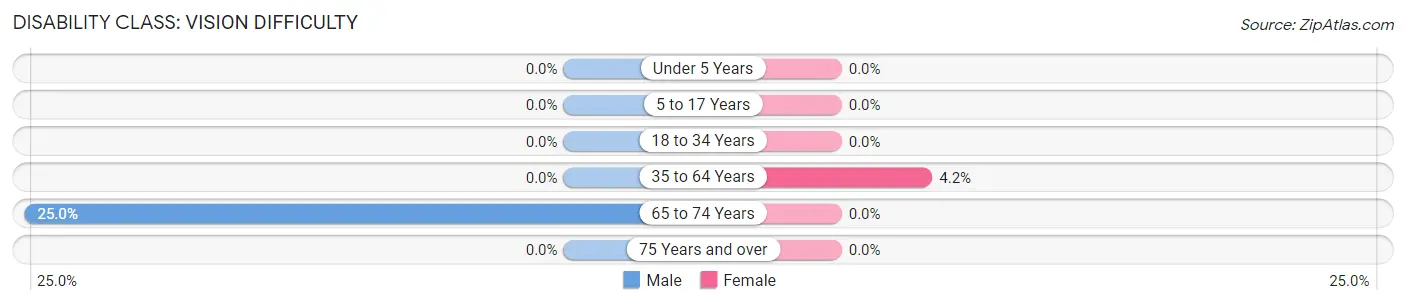
| Age Bracket | Male | Female |
| Under 5 Years | 0 (0.0%) | 0 (0.0%) |
| 5 to 17 Years | 0 (0.0%) | 0 (0.0%) |
| 18 to 34 Years | 0 (0.0%) | 0 (0.0%) |
| 35 to 64 Years | 0 (0.0%) | 12 (4.2%) |
| 65 to 74 Years | 16 (25.0%) | 0 (0.0%) |
| 75 Years and over | 0 (0.0%) | 0 (0.0%) |
Disability Class: Cognitive Difficulty
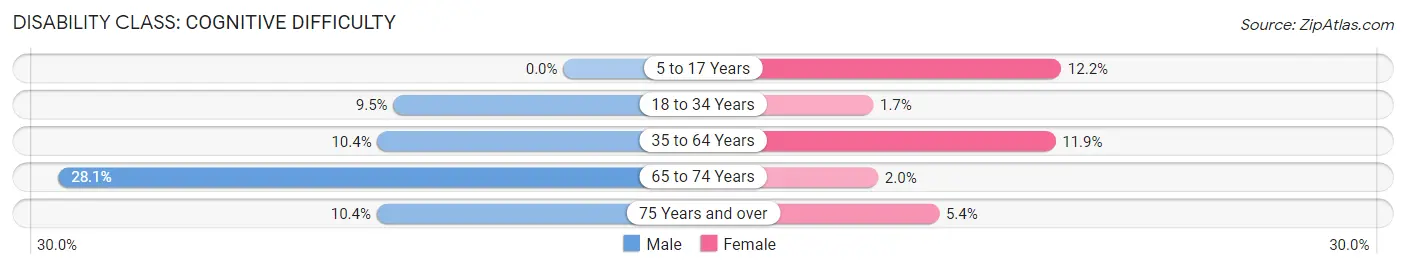
| Age Bracket | Male | Female |
| 5 to 17 Years | 0 (0.0%) | 35 (12.2%) |
| 18 to 34 Years | 28 (9.5%) | 6 (1.7%) |
| 35 to 64 Years | 38 (10.3%) | 34 (11.9%) |
| 65 to 74 Years | 18 (28.1%) | 3 (2.0%) |
| 75 Years and over | 8 (10.4%) | 6 (5.4%) |
Disability Class: Ambulatory Difficulty
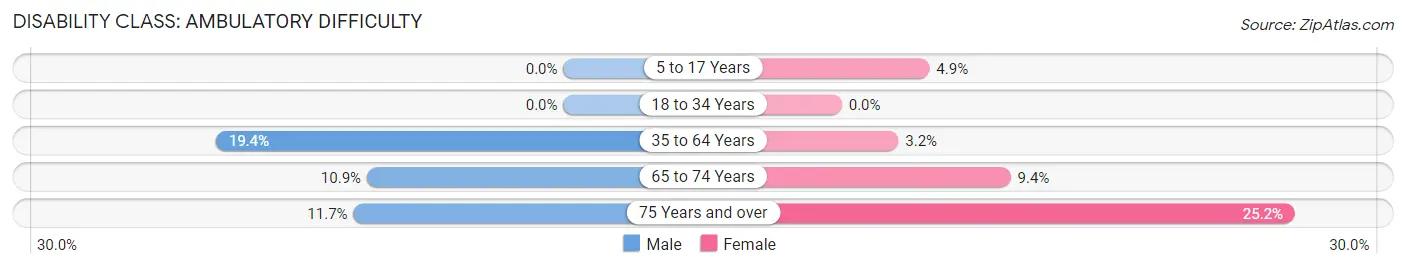
| Age Bracket | Male | Female |
| 5 to 17 Years | 0 (0.0%) | 14 (4.9%) |
| 18 to 34 Years | 0 (0.0%) | 0 (0.0%) |
| 35 to 64 Years | 71 (19.4%) | 9 (3.2%) |
| 65 to 74 Years | 7 (10.9%) | 14 (9.4%) |
| 75 Years and over | 9 (11.7%) | 28 (25.2%) |
Disability Class: Self-Care Difficulty
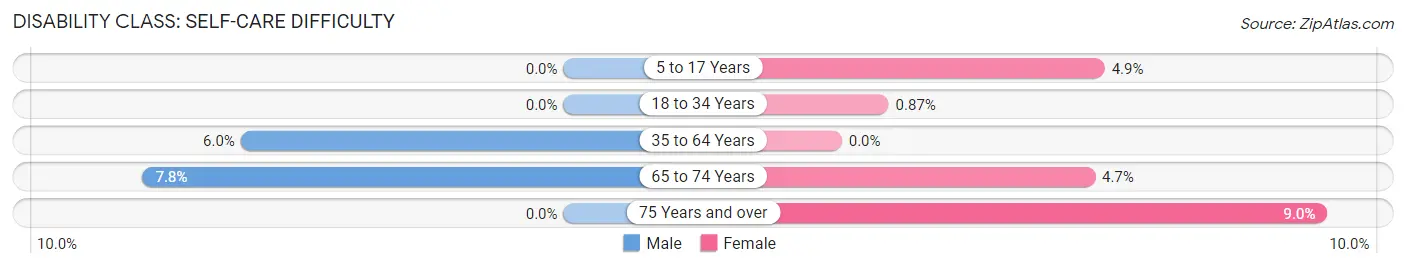
| Age Bracket | Male | Female |
| 5 to 17 Years | 0 (0.0%) | 14 (4.9%) |
| 18 to 34 Years | 0 (0.0%) | 3 (0.9%) |
| 35 to 64 Years | 22 (6.0%) | 0 (0.0%) |
| 65 to 74 Years | 5 (7.8%) | 7 (4.7%) |
| 75 Years and over | 0 (0.0%) | 10 (9.0%) |
Technology Access in Arlington
Computing Device Access in Arlington
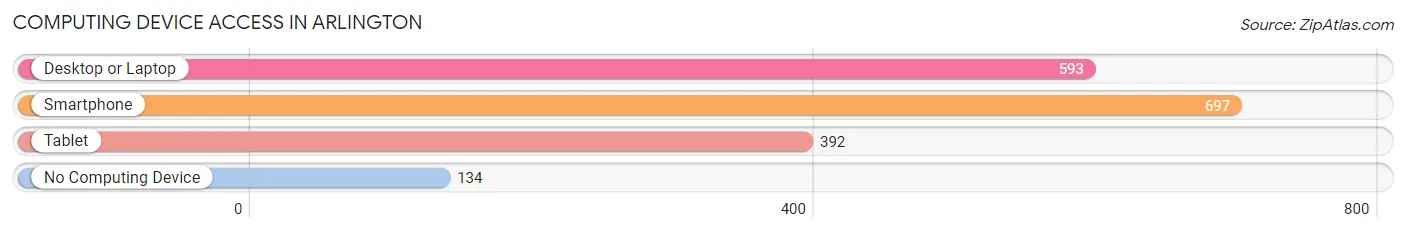
| Device Type | # Households | % Households |
| Desktop or Laptop | 593 | 66.8% |
| Smartphone | 697 | 78.5% |
| Tablet | 392 | 44.1% |
| No Computing Device | 134 | 15.1% |
| Total | 888 | 100.0% |
Internet Access in Arlington
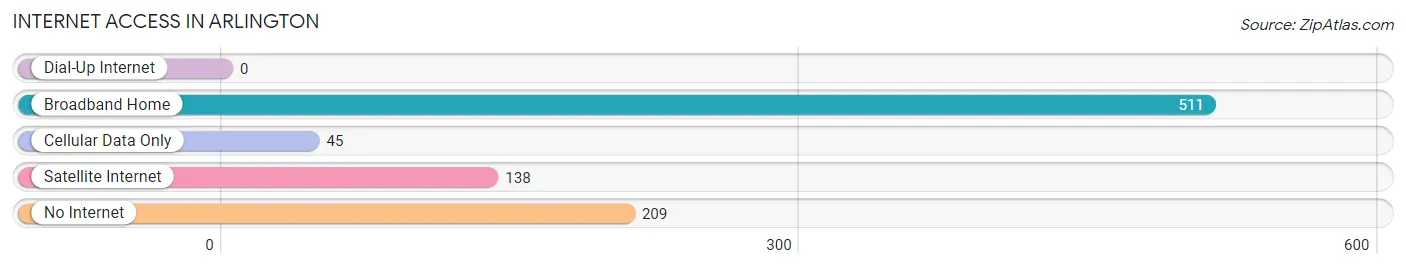
| Internet Type | # Households | % Households |
| Dial-Up Internet | 0 | 0.0% |
| Broadband Home | 511 | 57.6% |
| Cellular Data Only | 45 | 5.1% |
| Satellite Internet | 138 | 15.5% |
| No Internet | 209 | 23.5% |
| Total | 888 | 100.0% |
Arlington Summary
Arlington is a city located in Sibley County, Minnesota, United States. The population was 2,053 at the 2010 census. It is the county seat of Sibley County.
History
Arlington was founded in 1856 by settlers from New York and New England. The city was named after the town of Arlington, Massachusetts. The first settlers were attracted to the area by the abundance of timber and the fertile soil. The first post office was established in 1857.
In 1858, the first school was built and the first church was organized. The first newspaper, the Arlington Gazette, was established in 1859.
In 1867, the first railroad was built through the city, connecting it to St. Paul and Minneapolis. This allowed for the growth of the city and the development of the local economy.
In 1872 the first bank was established and the first telephone line was installed
In 1876 the first fire department was organized and the first fire station was built
In 1883 the first hospital was established
In 1885 the first library was established
In 1887 the first electric lights were installed
In 1889 the first waterworks were built
In 1891 the first sewer system was installed
In 1895 the first public park was established
In 1897 the first movie theater was opened
In 1900 the first automobile was registered in the city
In 1902 the first public library was established
In 1904 the first high school was built
In 1906 the first bank building was constructed
In 1908 the first telephone exchange was established
In 1910 the first electric streetcar line was built
In 1912 the first airport was established
In 1914 the first public swimming pool was built
In 1916 the first public golf course was established
In 1918 the first public library building was constructed
In 1920 the first radio station was established
In 1922 the first movie theater was built
In 1924 the first hospital building was constructed
In 1926 the first airport building was built
In 1928 the first public swimming pool was built
In 1930 the first public golf course was built
In 1932 the first public library building was constructed
In 1934 the first radio station was established
In 1936 the first movie theater was built
In 1938 the first hospital building was constructed
In 1940 the first airport building was built
In 1942 the first public swimming pool was built
In 1944 the first public golf course was established
In 1946 the first public library building was constructed
In 1948 the first radio station was established
In 1950 the first movie theater was built
In 1952 the first hospital building was constructed
In 1954 the first airport building was built
In 1956 the first public swimming pool was built
In 1958 the first public golf course was established
In 1960 the first public library building was constructed
Geography
Arlington is located at the intersection of U.S. Route 212 and Minnesota State Highway 5. It is situated on the banks of the Cedar River. The city is located in the rolling hills of the Minnesota River Valley.
The city has a total area of 2 2 square miles all of it land
Economy
The economy of Arlington is largely based on agriculture and manufacturing. The city is home to several large agricultural businesses, including a dairy farm, a hog farm, and a grain elevator.
The city is also home to several manufacturing companies, including a plastics manufacturer, a metal fabricator, and a machine shop.
Demographics
As of the 2010 census, there were 2,053 people, 845 households, and 545 families residing in the city. The population density was 930.9 people per square mile. There were 902 housing units at an average density of 409.5 per square mile.
The racial makeup of the city was 97.2% White, 0.2% African American, 0.2% Native American, 0.4% Asian, 0.2% from other races, and 1.9% from two or more races. Hispanic or Latino of any race were 1.2% of the population.
There were 845 households, out of which 30.2% had children under the age of 18 living with them, 51.2% were married couples living together, 9.2% had a female householder with no husband present, and 35.2% were non-families. 30.2% of all households were made up of individuals, and 15.2% had someone living alone who was 65 years of age or older. The average household size was 2.41 and the average family size was 3.00.
In the city, the population was spread out, with 25.2% under the age of 18, 7.2% from 18 to 24, 25.2% from 25 to 44, 22.2% from 45 to 64, and 20.2% who were 65 years of age or older. The median age was 40 years. For every 100 females, there were 92.2 males. For every 100 females age 18 and over, there were 88.2 males.
The median income for a household in the city was $41,250, and the median income for a family was $50,000. Males had a median income of $35,000 versus $25,000 for females. The per capita income for the city was $20,845. About 4.2% of families and 6.2% of the population were below the poverty line, including 8.2% of those under age 18 and 6.2% of those age 65 or over.
Common Questions
What is Per Capita Income in Arlington?
Per Capita income in Arlington is $27,321.
What is the Median Family Income in Arlington?
Median Family Income in Arlington is $80,625.
What is the Median Household income in Arlington?
Median Household Income in Arlington is $64,457.
What is Income or Wage Gap in Arlington?
Income or Wage Gap in Arlington is 29.9%.
Women in Arlington earn 70.1 cents for every dollar earned by a man.
What is Inequality or Gini Index in Arlington?
Inequality or Gini Index in Arlington is 0.38.
What is the Total Population of Arlington?
Total Population of Arlington is 2,428.
What is the Total Male Population of Arlington?
Total Male Population of Arlington is 1,090.
What is the Total Female Population of Arlington?
Total Female Population of Arlington is 1,338.
What is the Ratio of Males per 100 Females in Arlington?
There are 81.46 Males per 100 Females in Arlington.
What is the Ratio of Females per 100 Males in Arlington?
There are 122.75 Females per 100 Males in Arlington.
What is the Median Population Age in Arlington?
Median Population Age in Arlington is 32.6 Years.
What is the Average Family Size in Arlington
Average Family Size in Arlington is 3.5 People.
What is the Average Household Size in Arlington
Average Household Size in Arlington is 2.7 People.
How Large is the Labor Force in Arlington?
There are 1,168 People in the Labor Forcein in Arlington.
What is the Percentage of People in the Labor Force in Arlington?
66.3% of People are in the Labor Force in Arlington.
What is the Unemployment Rate in Arlington?
Unemployment Rate in Arlington is 2.7%.