Holland, MN Map & Demographics
Holland Map
Holland Overview
$27,366
PER CAPITA INCOME
$78,000
AVG FAMILY INCOME
$74,167
AVG HOUSEHOLD INCOME
77.5%
WAGE / INCOME GAP [ % ]
22.5¢/ $1
WAGE / INCOME GAP [ $ ]
0.32
INEQUALITY / GINI INDEX
277
TOTAL POPULATION
114
MALE POPULATION
163
FEMALE POPULATION
69.94
MALES / 100 FEMALES
142.98
FEMALES / 100 MALES
34.1
MEDIAN AGE
3.5
AVG FAMILY SIZE
2.7
AVG HOUSEHOLD SIZE
148
LABOR FORCE [ PEOPLE ]
75.1%
PERCENT IN LABOR FORCE
Holland Zip Codes
Holland Area Codes
Income in Holland
Income Overview in Holland
Per Capita Income in Holland is $27,366, while median incomes of families and households are $78,000 and $74,167 respectively.
| Characteristic | Number | Measure |
| Per Capita Income | 277 | $27,366 |
| Median Family Income | 62 | $78,000 |
| Mean Family Income | 62 | $75,785 |
| Median Household Income | 102 | $74,167 |
| Mean Household Income | 102 | $71,393 |
| Income Deficit | 62 | $0 |
| Wage / Income Gap (%) | 277 | 77.52% |
| Wage / Income Gap ($) | 277 | 22.48¢ per $1 |
| Gini / Inequality Index | 277 | 0.32 |
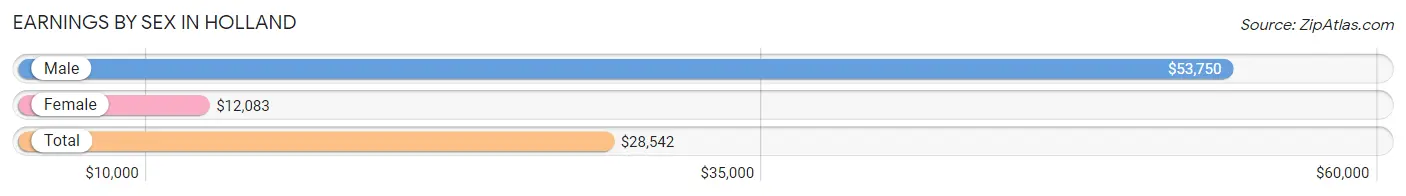
Earnings by Sex in Holland
Average Earnings in Holland are $28,542, $53,750 for men and $12,083 for women, a difference of 77.5%.
| Sex | Number | Average Earnings |
| Male | 60 (40.0%) | $53,750 |
| Female | 90 (60.0%) | $12,083 |
| Total | 150 (100.0%) | $28,542 |
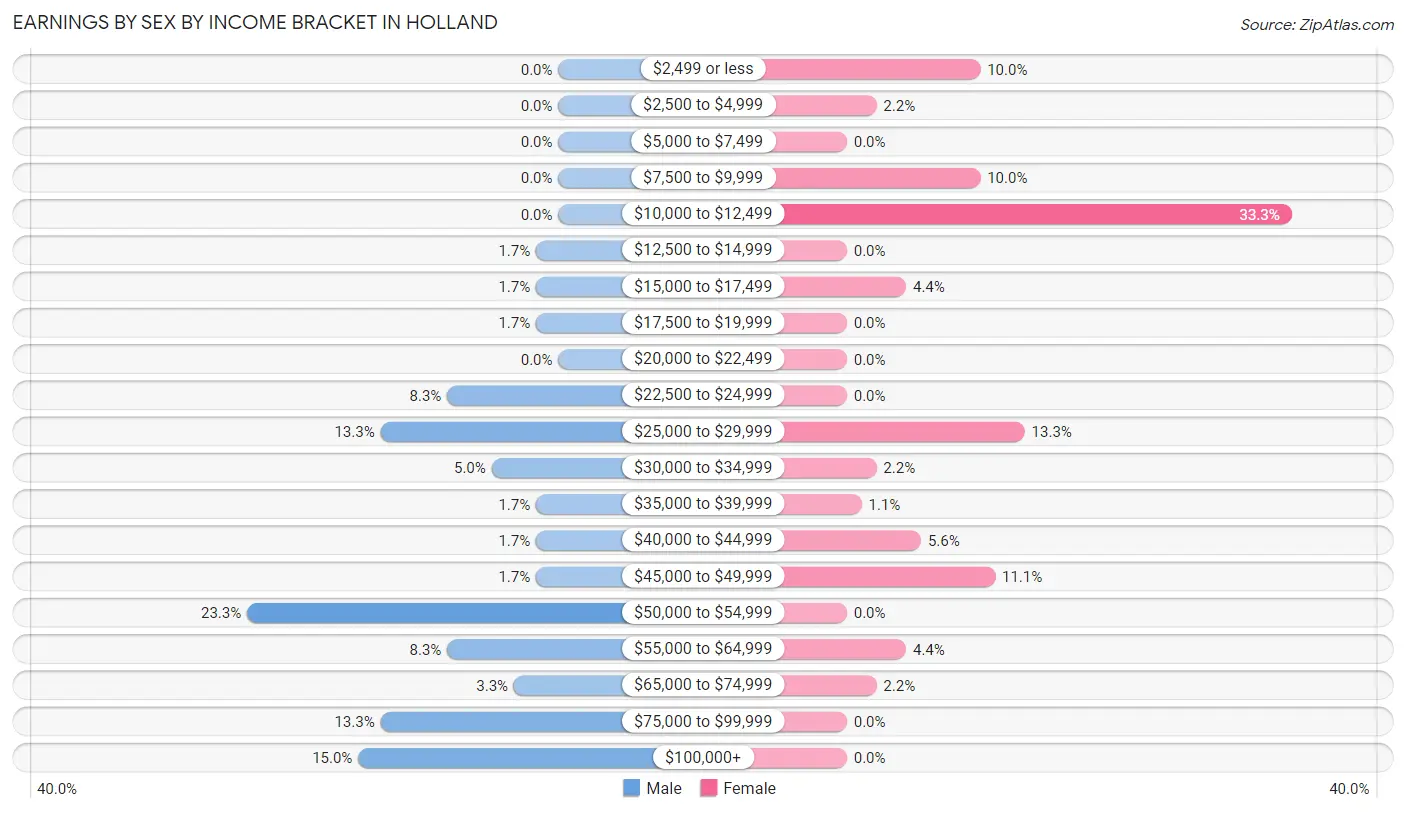
Earnings by Sex by Income Bracket in Holland
The most common earnings brackets in Holland are $50,000 to $54,999 for men (14 | 23.3%) and $10,000 to $12,499 for women (30 | 33.3%).
| Income | Male | Female |
| $2,499 or less | 0 (0.0%) | 9 (10.0%) |
| $2,500 to $4,999 | 0 (0.0%) | 2 (2.2%) |
| $5,000 to $7,499 | 0 (0.0%) | 0 (0.0%) |
| $7,500 to $9,999 | 0 (0.0%) | 9 (10.0%) |
| $10,000 to $12,499 | 0 (0.0%) | 30 (33.3%) |
| $12,500 to $14,999 | 1 (1.7%) | 0 (0.0%) |
| $15,000 to $17,499 | 1 (1.7%) | 4 (4.4%) |
| $17,500 to $19,999 | 1 (1.7%) | 0 (0.0%) |
| $20,000 to $22,499 | 0 (0.0%) | 0 (0.0%) |
| $22,500 to $24,999 | 5 (8.3%) | 0 (0.0%) |
| $25,000 to $29,999 | 8 (13.3%) | 12 (13.3%) |
| $30,000 to $34,999 | 3 (5.0%) | 2 (2.2%) |
| $35,000 to $39,999 | 1 (1.7%) | 1 (1.1%) |
| $40,000 to $44,999 | 1 (1.7%) | 5 (5.6%) |
| $45,000 to $49,999 | 1 (1.7%) | 10 (11.1%) |
| $50,000 to $54,999 | 14 (23.3%) | 0 (0.0%) |
| $55,000 to $64,999 | 5 (8.3%) | 4 (4.4%) |
| $65,000 to $74,999 | 2 (3.3%) | 2 (2.2%) |
| $75,000 to $99,999 | 8 (13.3%) | 0 (0.0%) |
| $100,000+ | 9 (15.0%) | 0 (0.0%) |
| Total | 60 (100.0%) | 90 (100.0%) |
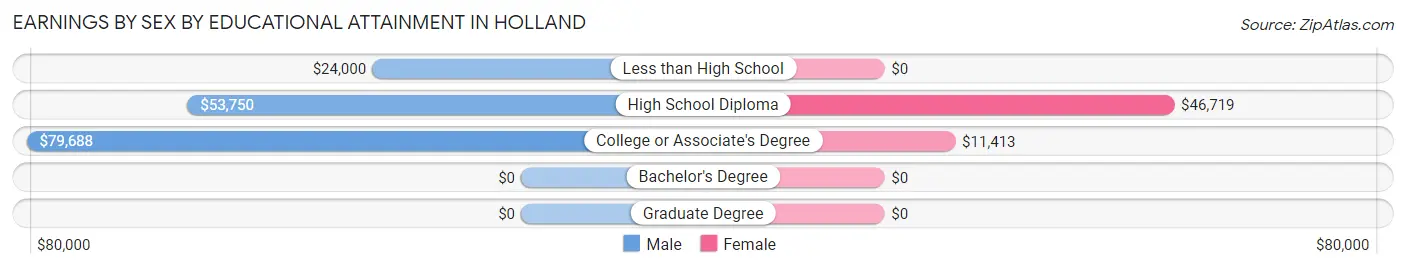
Earnings by Sex by Educational Attainment in Holland
| Educational Attainment | Male Income | Female Income |
| Less than High School | $24,000 | $0 |
| High School Diploma | $53,750 | $46,719 |
| College or Associate's Degree | $79,688 | $11,413 |
| Bachelor's Degree | - | - |
| Graduate Degree | - | - |
| Total | $53,750 | $0 |
Family Income in Holland
Family Income Brackets in Holland
According to the Holland family income data, there are 19 families falling into the $75,000 to $99,999 income range, which is the most common income bracket and makes up 30.6% of all families.
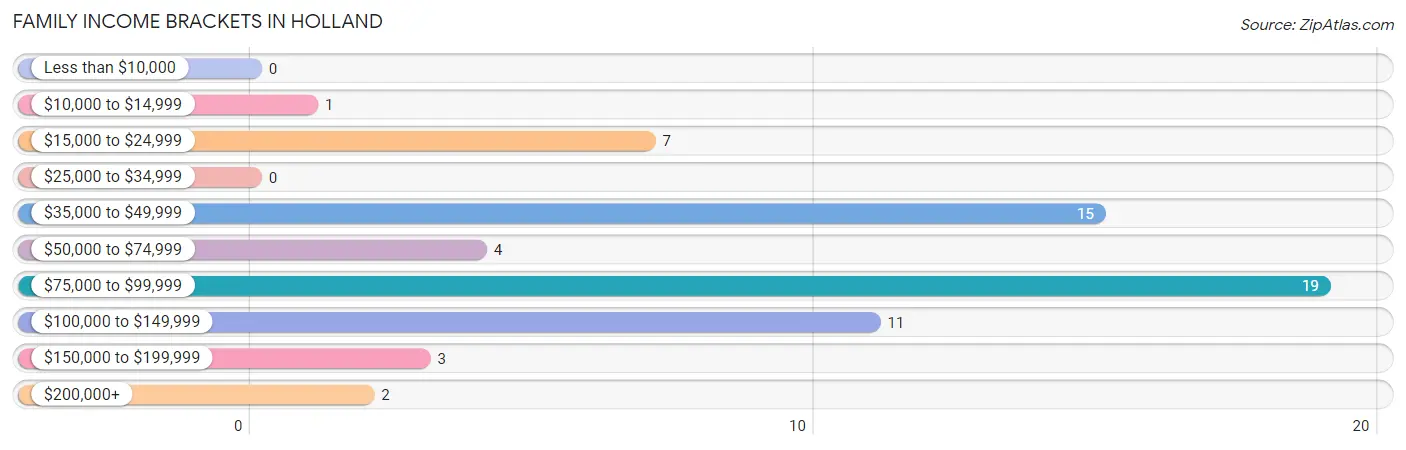
| Income Bracket | # Families | % Families |
| Less than $10,000 | 0 | 0.0% |
| $10,000 to $14,999 | 1 | 1.6% |
| $15,000 to $24,999 | 7 | 11.3% |
| $25,000 to $34,999 | 0 | 0.0% |
| $35,000 to $49,999 | 15 | 24.2% |
| $50,000 to $74,999 | 4 | 6.5% |
| $75,000 to $99,999 | 19 | 30.6% |
| $100,000 to $149,999 | 11 | 17.7% |
| $150,000 to $199,999 | 3 | 4.8% |
| $200,000+ | 2 | 3.2% |
Family Income by Famaliy Size in Holland
4-person families (23 | 37.1%) account for the highest median family income in Holland with $85,972 per family, while 2-person families (26 | 41.9%) have the highest median income of $39,000 per family member.
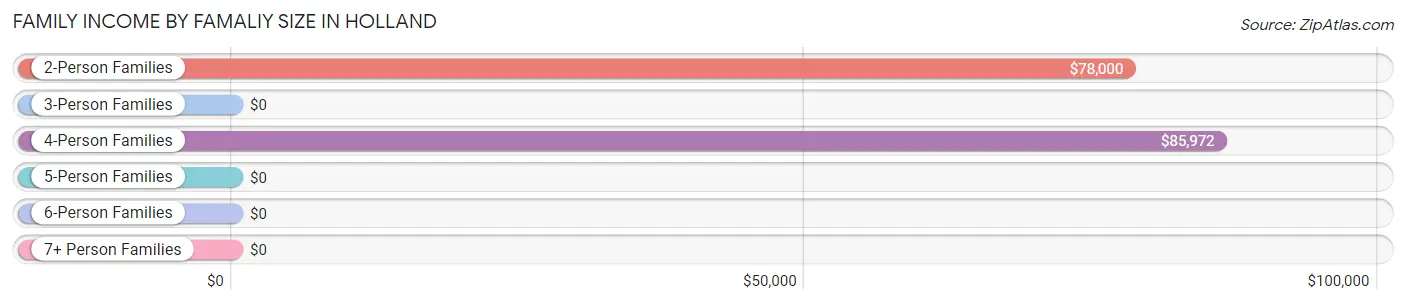
| Income Bracket | # Families | Median Income |
| 2-Person Families | 26 (41.9%) | $78,000 |
| 3-Person Families | 6 (9.7%) | $0 |
| 4-Person Families | 23 (37.1%) | $85,972 |
| 5-Person Families | 7 (11.3%) | $0 |
| 6-Person Families | 0 (0.0%) | $0 |
| 7+ Person Families | 0 (0.0%) | $0 |
| Total | 62 (100.0%) | $78,000 |
Family Income by Number of Earners in Holland
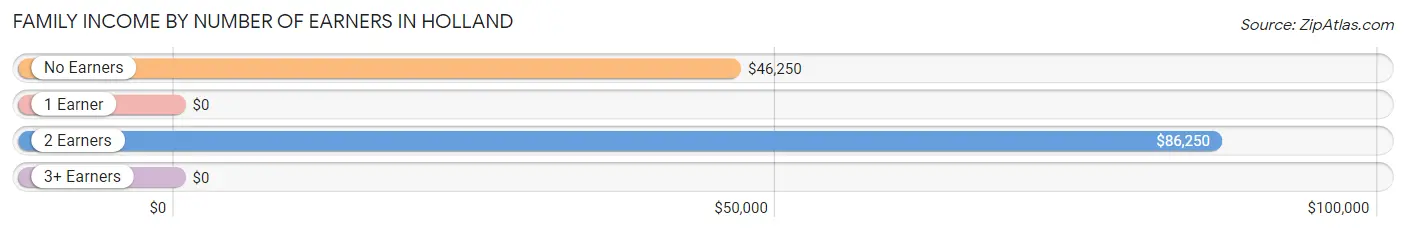
| Number of Earners | # Families | Median Income |
| No Earners | 4 (6.5%) | $46,250 |
| 1 Earner | 24 (38.7%) | $0 |
| 2 Earners | 25 (40.3%) | $86,250 |
| 3+ Earners | 9 (14.5%) | $0 |
| Total | 62 (100.0%) | $78,000 |
Household Income in Holland
Household Income Brackets in Holland
With 29 households falling in the category, the $75,000 to $99,999 income range is the most frequent in Holland, accounting for 28.4% of all households.
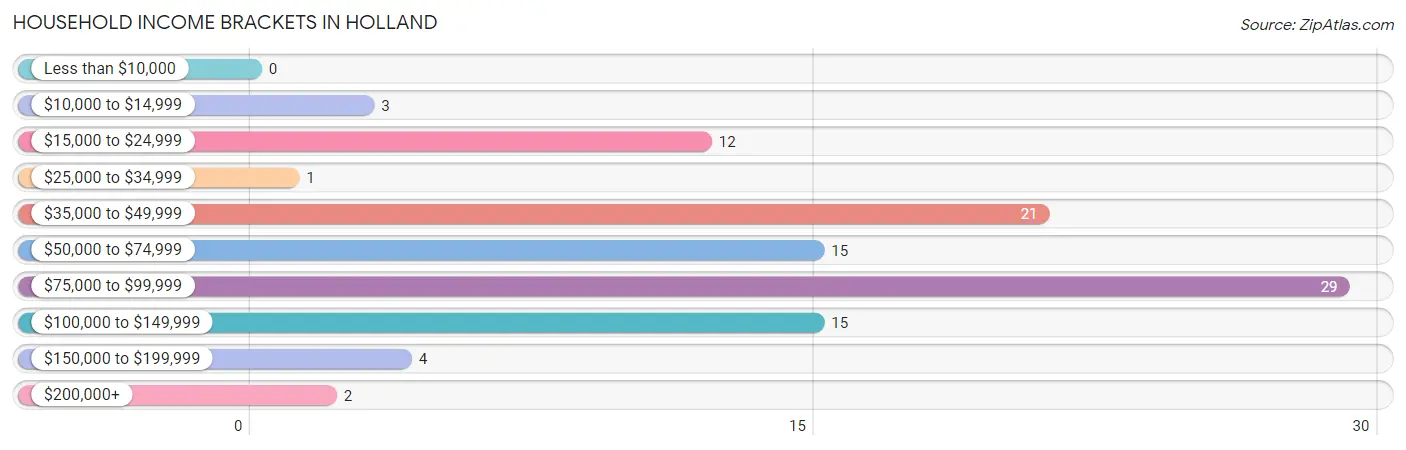
| Income Bracket | # Households | % Households |
| Less than $10,000 | 0 | 0.0% |
| $10,000 to $14,999 | 3 | 2.9% |
| $15,000 to $24,999 | 12 | 11.8% |
| $25,000 to $34,999 | 1 | 1.0% |
| $35,000 to $49,999 | 21 | 20.6% |
| $50,000 to $74,999 | 15 | 14.7% |
| $75,000 to $99,999 | 29 | 28.4% |
| $100,000 to $149,999 | 15 | 14.7% |
| $150,000 to $199,999 | 4 | 3.9% |
| $200,000+ | 2 | 2.0% |
Household Income by Householder Age in Holland
The median household income in Holland is $74,167, with the highest median household income of $78,750 found in the 25 to 44 years age bracket for the primary householder. A total of 32 households (31.4%) fall into this category. Meanwhile, the 15 to 24 years age bracket for the primary householder has the lowest median household income of $0, with 8 households (7.8%) in this group.
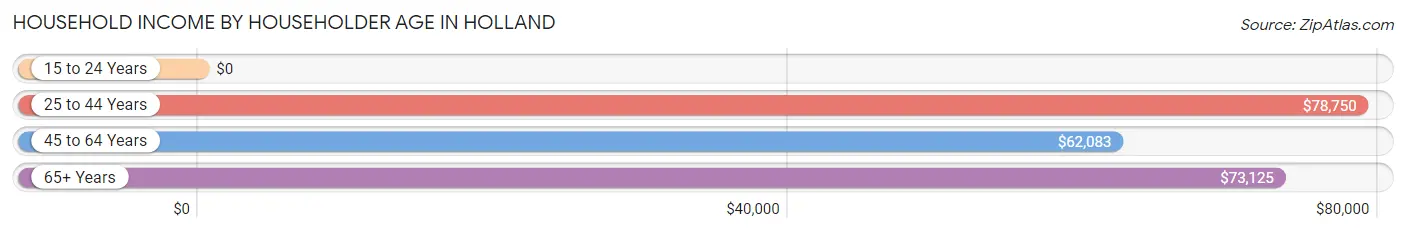
| Income Bracket | # Households | Median Income |
| 15 to 24 Years | 8 (7.8%) | $0 |
| 25 to 44 Years | 32 (31.4%) | $78,750 |
| 45 to 64 Years | 37 (36.3%) | $62,083 |
| 65+ Years | 25 (24.5%) | $73,125 |
| Total | 102 (100.0%) | $74,167 |
Poverty in Holland
Income Below Poverty by Sex and Age in Holland
With 14.0% poverty level for males and 21.5% for females among the residents of Holland, under 5 year old males and 18 to 24 year old females are the most vulnerable to poverty, with 15 males (62.5%) and 13 females (81.2%) in their respective age groups living below the poverty level.
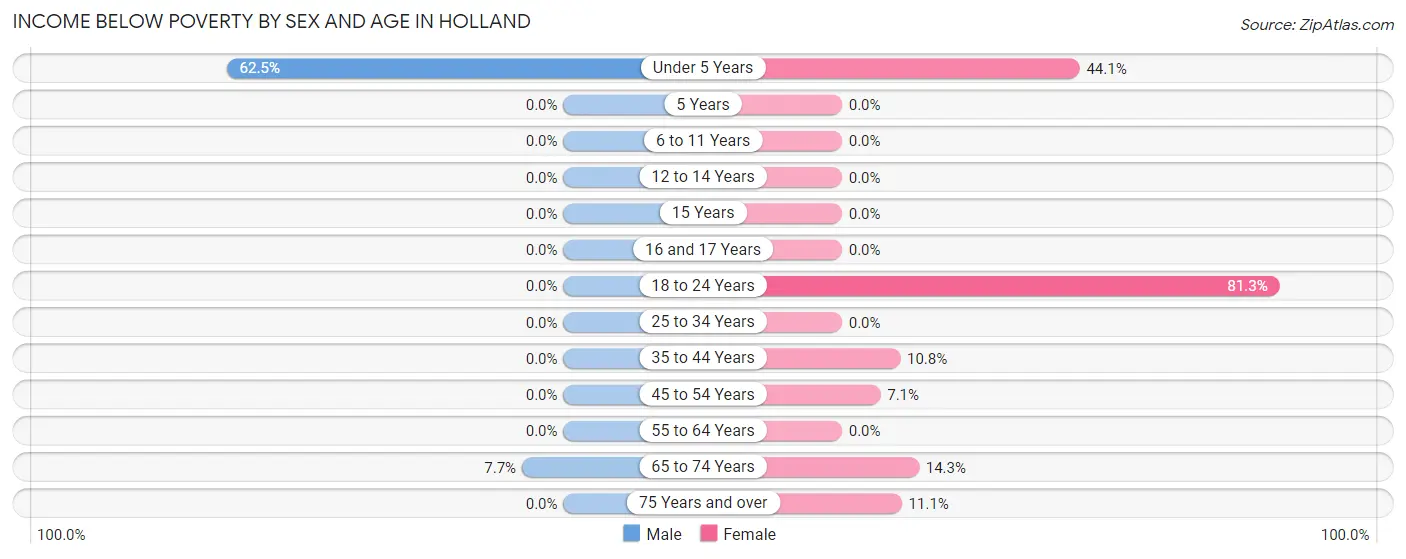
| Age Bracket | Male | Female |
| Under 5 Years | 15 (62.5%) | 15 (44.1%) |
| 5 Years | 0 (0.0%) | 0 (0.0%) |
| 6 to 11 Years | 0 (0.0%) | 0 (0.0%) |
| 12 to 14 Years | 0 (0.0%) | 0 (0.0%) |
| 15 Years | 0 (0.0%) | 0 (0.0%) |
| 16 and 17 Years | 0 (0.0%) | 0 (0.0%) |
| 18 to 24 Years | 0 (0.0%) | 13 (81.2%) |
| 25 to 34 Years | 0 (0.0%) | 0 (0.0%) |
| 35 to 44 Years | 0 (0.0%) | 4 (10.8%) |
| 45 to 54 Years | 0 (0.0%) | 1 (7.1%) |
| 55 to 64 Years | 0 (0.0%) | 0 (0.0%) |
| 65 to 74 Years | 1 (7.7%) | 1 (14.3%) |
| 75 Years and over | 0 (0.0%) | 1 (11.1%) |
| Total | 16 (14.0%) | 35 (21.5%) |
Income Above Poverty by Sex and Age in Holland
According to the poverty statistics in Holland, males aged 6 to 11 years and females aged 6 to 11 years are the age groups that are most secure financially, with 100.0% of males and 100.0% of females in these age groups living above the poverty line.
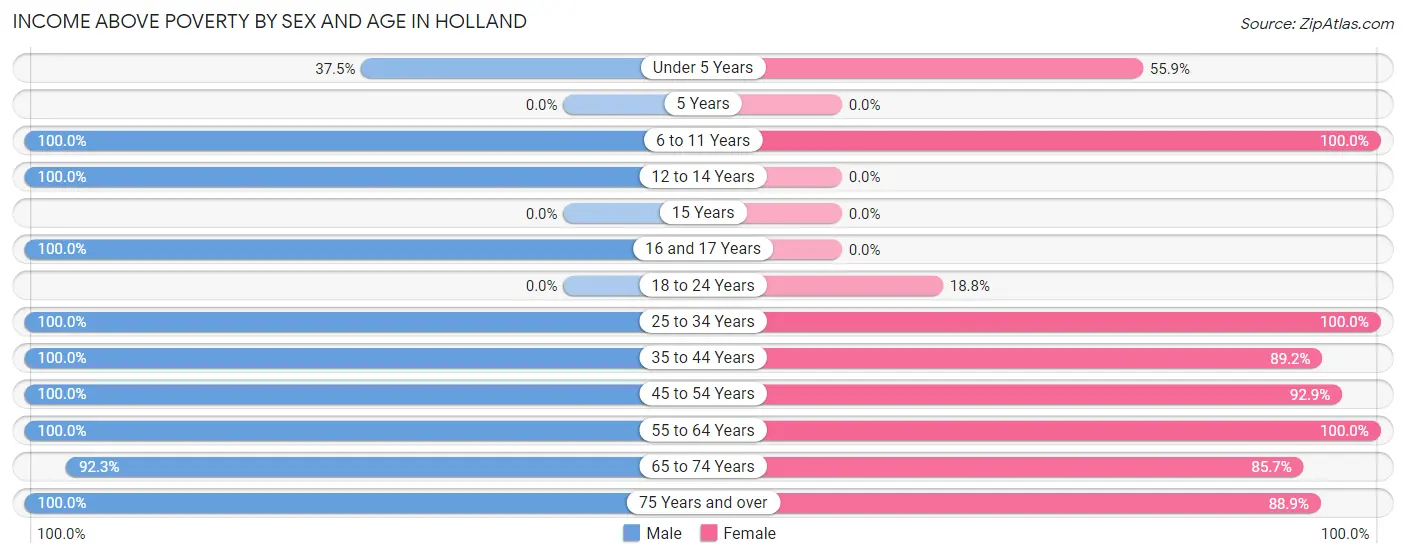
| Age Bracket | Male | Female |
| Under 5 Years | 9 (37.5%) | 19 (55.9%) |
| 5 Years | 0 (0.0%) | 0 (0.0%) |
| 6 to 11 Years | 4 (100.0%) | 9 (100.0%) |
| 12 to 14 Years | 9 (100.0%) | 0 (0.0%) |
| 15 Years | 0 (0.0%) | 0 (0.0%) |
| 16 and 17 Years | 8 (100.0%) | 0 (0.0%) |
| 18 to 24 Years | 0 (0.0%) | 3 (18.8%) |
| 25 to 34 Years | 14 (100.0%) | 28 (100.0%) |
| 35 to 44 Years | 8 (100.0%) | 33 (89.2%) |
| 45 to 54 Years | 12 (100.0%) | 13 (92.9%) |
| 55 to 64 Years | 20 (100.0%) | 9 (100.0%) |
| 65 to 74 Years | 12 (92.3%) | 6 (85.7%) |
| 75 Years and over | 2 (100.0%) | 8 (88.9%) |
| Total | 98 (86.0%) | 128 (78.5%) |
Income Below Poverty Among Married-Couple Families in Holland
The poverty statistics for married-couple families in Holland show that 2.2% or 1 of the total 46 families live below the poverty line. Families with no children have the highest poverty rate of 5.9%, comprising of 1 families. On the other hand, families with 1 or 2 children have the lowest poverty rate of 0.0%, which includes 0 families.
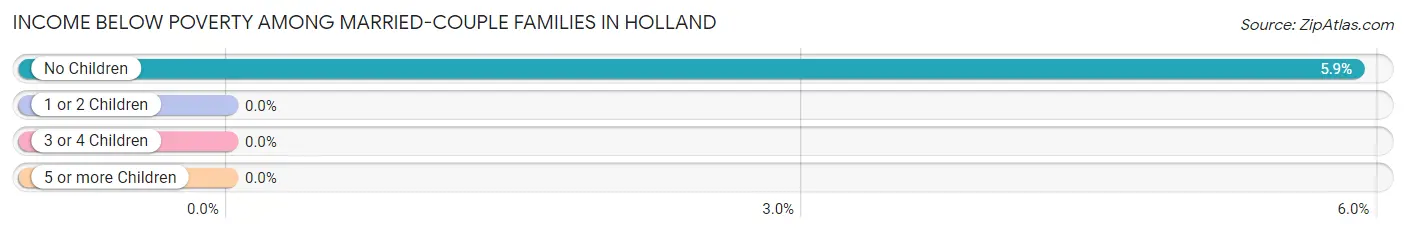
| Children | Above Poverty | Below Poverty |
| No Children | 16 (94.1%) | 1 (5.9%) |
| 1 or 2 Children | 29 (100.0%) | 0 (0.0%) |
| 3 or 4 Children | 0 (0.0%) | 0 (0.0%) |
| 5 or more Children | 0 (0.0%) | 0 (0.0%) |
| Total | 45 (97.8%) | 1 (2.2%) |
Income Below Poverty Among Single-Parent Households in Holland
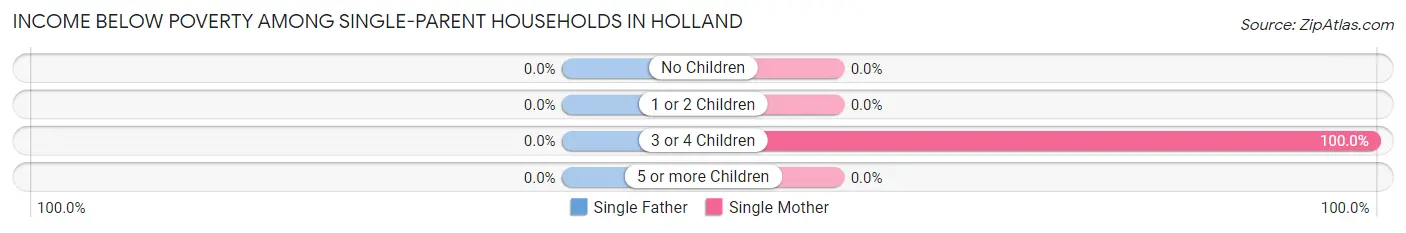
| Children | Single Father | Single Mother |
| No Children | 0 (0.0%) | 0 (0.0%) |
| 1 or 2 Children | 0 (0.0%) | 0 (0.0%) |
| 3 or 4 Children | 0 (0.0%) | 7 (100.0%) |
| 5 or more Children | 0 (0.0%) | 0 (0.0%) |
| Total | 0 (0.0%) | 7 (58.3%) |
Income Below Poverty Among Married-Couple vs Single-Parent Households in Holland
The poverty data for Holland shows that 1 of the married-couple family households (2.2%) and 7 of the single-parent households (43.8%) are living below the poverty level. Within the married-couple family households, those with no children have the highest poverty rate, with 1 households (5.9%) falling below the poverty line. Among the single-parent households, those with 3 or 4 children have the highest poverty rate, with 7 household (100.0%) living below poverty.
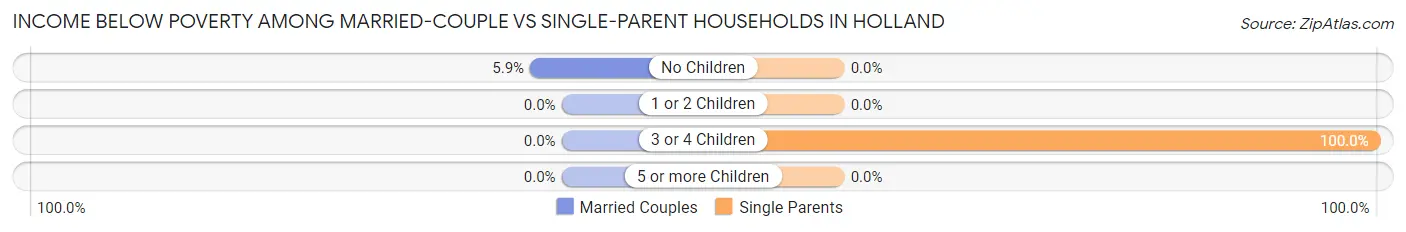
| Children | Married-Couple Families | Single-Parent Households |
| No Children | 1 (5.9%) | 0 (0.0%) |
| 1 or 2 Children | 0 (0.0%) | 0 (0.0%) |
| 3 or 4 Children | 0 (0.0%) | 7 (100.0%) |
| 5 or more Children | 0 (0.0%) | 0 (0.0%) |
| Total | 1 (2.2%) | 7 (43.8%) |
Race in Holland
The most populous races in Holland are White / Caucasian (230 | 83.0%), Hispanic or Latino (85 | 30.7%), and Two or more Races (34 | 12.3%).
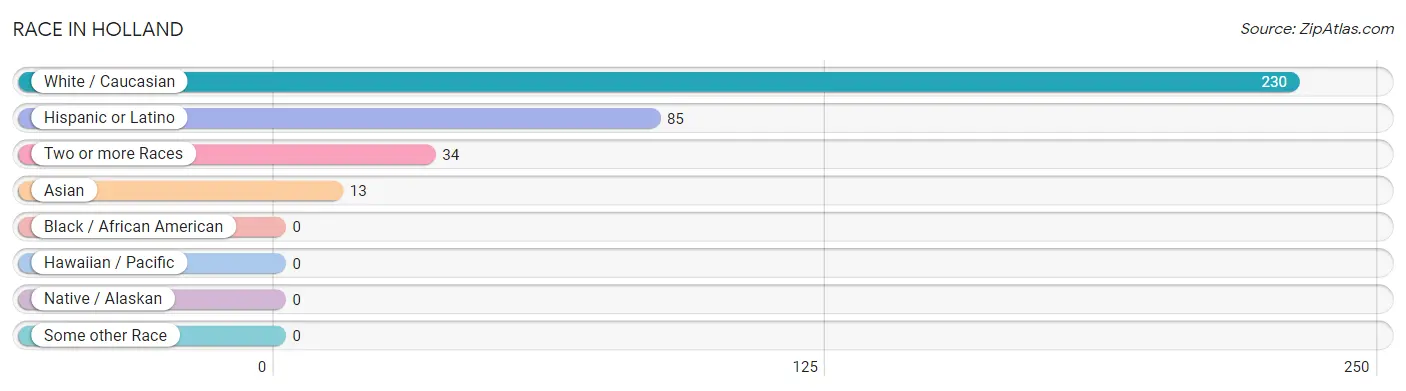
| Race | # Population | % Population |
| Asian | 13 | 4.7% |
| Black / African American | 0 | 0.0% |
| Hawaiian / Pacific | 0 | 0.0% |
| Hispanic or Latino | 85 | 30.7% |
| Native / Alaskan | 0 | 0.0% |
| White / Caucasian | 230 | 83.0% |
| Two or more Races | 34 | 12.3% |
| Some other Race | 0 | 0.0% |
| Total | 277 | 100.0% |
Ancestry in Holland
The most populous ancestries reported in Holland are German (84 | 30.3%), Dutch (70 | 25.3%), Central American (54 | 19.5%), Guatemalan (37 | 13.4%), and Mexican (31 | 11.2%), together accounting for 99.6% of all Holland residents.
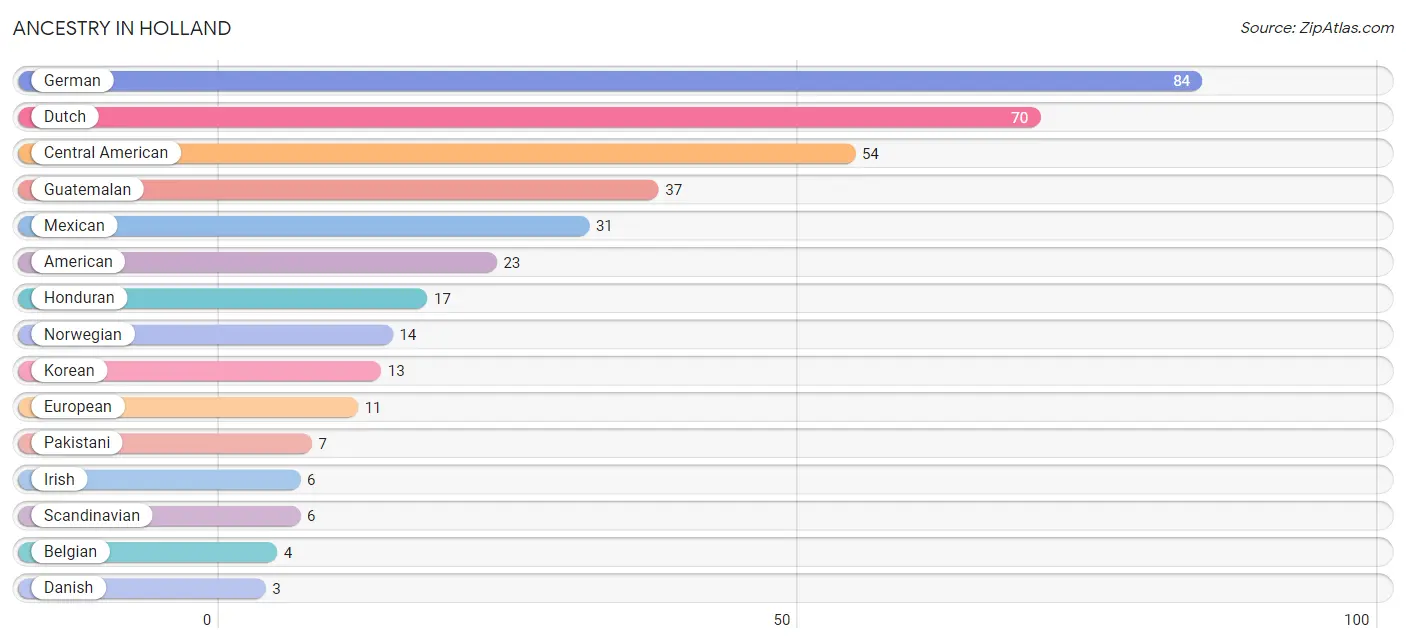
| Ancestry | # Population | % Population |
| American | 23 | 8.3% |
| Belgian | 4 | 1.4% |
| Central American | 54 | 19.5% |
| Cherokee | 1 | 0.4% |
| Danish | 3 | 1.1% |
| Dutch | 70 | 25.3% |
| English | 2 | 0.7% |
| European | 11 | 4.0% |
| French | 3 | 1.1% |
| German | 84 | 30.3% |
| Guatemalan | 37 | 13.4% |
| Honduran | 17 | 6.1% |
| Irish | 6 | 2.2% |
| Korean | 13 | 4.7% |
| Mexican | 31 | 11.2% |
| Norwegian | 14 | 5.1% |
| Pakistani | 7 | 2.5% |
| Scandinavian | 6 | 2.2% |
| Swedish | 1 | 0.4% | View All 19 Rows |
Immigrants in Holland
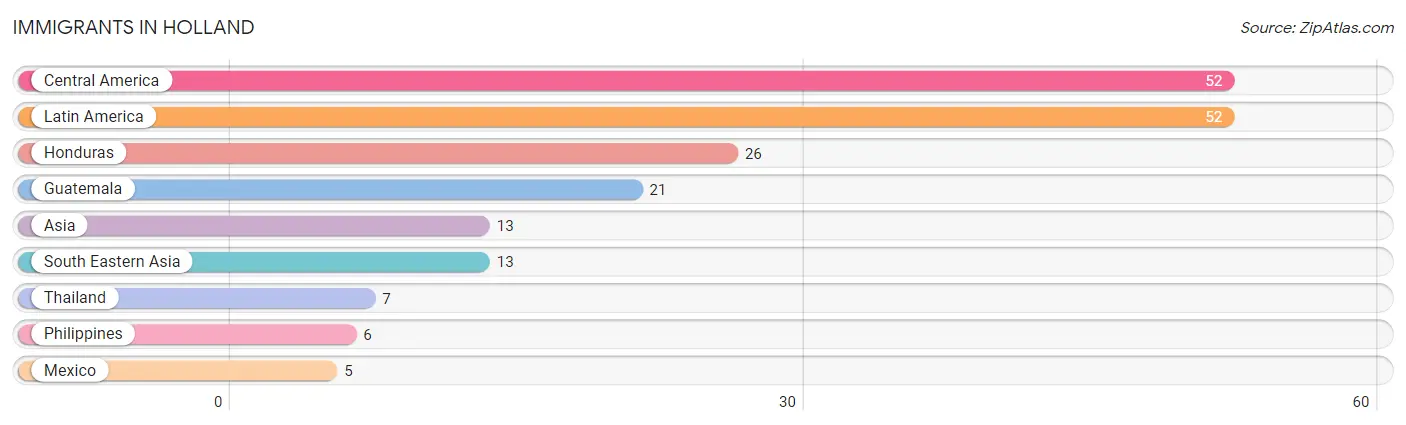
The most numerous immigrant groups reported in Holland came from Central America (52 | 18.8%), Latin America (52 | 18.8%), Honduras (26 | 9.4%), Guatemala (21 | 7.6%), and Asia (13 | 4.7%), together accounting for 59.2% of all Holland residents.
| Immigration Origin | # Population | % Population |
| Asia | 13 | 4.7% |
| Central America | 52 | 18.8% |
| Guatemala | 21 | 7.6% |
| Honduras | 26 | 9.4% |
| Latin America | 52 | 18.8% |
| Mexico | 5 | 1.8% |
| Philippines | 6 | 2.2% |
| South Eastern Asia | 13 | 4.7% |
| Thailand | 7 | 2.5% | View All 9 Rows |
Sex and Age in Holland
Sex and Age in Holland
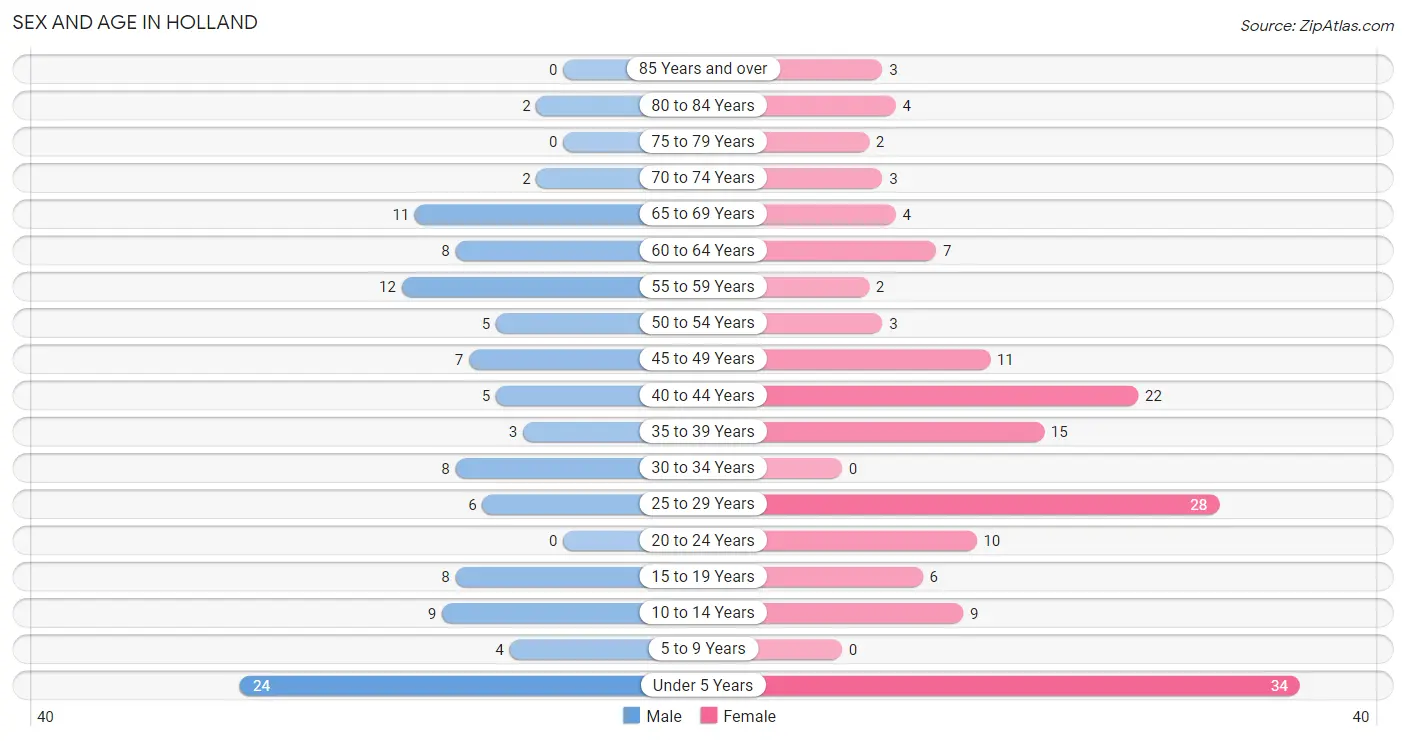
The most populous age groups in Holland are Under 5 Years (24 | 21.0%) for men and Under 5 Years (34 | 20.9%) for women.
| Age Bracket | Male | Female |
| Under 5 Years | 24 (21.0%) | 34 (20.9%) |
| 5 to 9 Years | 4 (3.5%) | 0 (0.0%) |
| 10 to 14 Years | 9 (7.9%) | 9 (5.5%) |
| 15 to 19 Years | 8 (7.0%) | 6 (3.7%) |
| 20 to 24 Years | 0 (0.0%) | 10 (6.1%) |
| 25 to 29 Years | 6 (5.3%) | 28 (17.2%) |
| 30 to 34 Years | 8 (7.0%) | 0 (0.0%) |
| 35 to 39 Years | 3 (2.6%) | 15 (9.2%) |
| 40 to 44 Years | 5 (4.4%) | 22 (13.5%) |
| 45 to 49 Years | 7 (6.1%) | 11 (6.8%) |
| 50 to 54 Years | 5 (4.4%) | 3 (1.8%) |
| 55 to 59 Years | 12 (10.5%) | 2 (1.2%) |
| 60 to 64 Years | 8 (7.0%) | 7 (4.3%) |
| 65 to 69 Years | 11 (9.7%) | 4 (2.5%) |
| 70 to 74 Years | 2 (1.8%) | 3 (1.8%) |
| 75 to 79 Years | 0 (0.0%) | 2 (1.2%) |
| 80 to 84 Years | 2 (1.8%) | 4 (2.5%) |
| 85 Years and over | 0 (0.0%) | 3 (1.8%) |
| Total | 114 (100.0%) | 163 (100.0%) |
Families and Households in Holland
Median Family Size in Holland
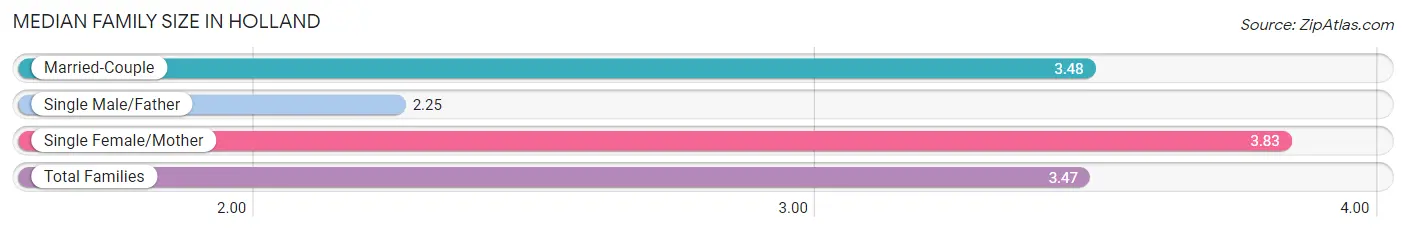
The median family size in Holland is 3.47 persons per family, with single female/mother families (12 | 19.4%) accounting for the largest median family size of 3.83 persons per family. On the other hand, single male/father families (4 | 6.5%) represent the smallest median family size with 2.25 persons per family.
| Family Type | # Families | Family Size |
| Married-Couple | 46 (74.2%) | 3.48 |
| Single Male/Father | 4 (6.5%) | 2.25 |
| Single Female/Mother | 12 (19.4%) | 3.83 |
| Total Families | 62 (100.0%) | 3.47 |
Median Household Size in Holland
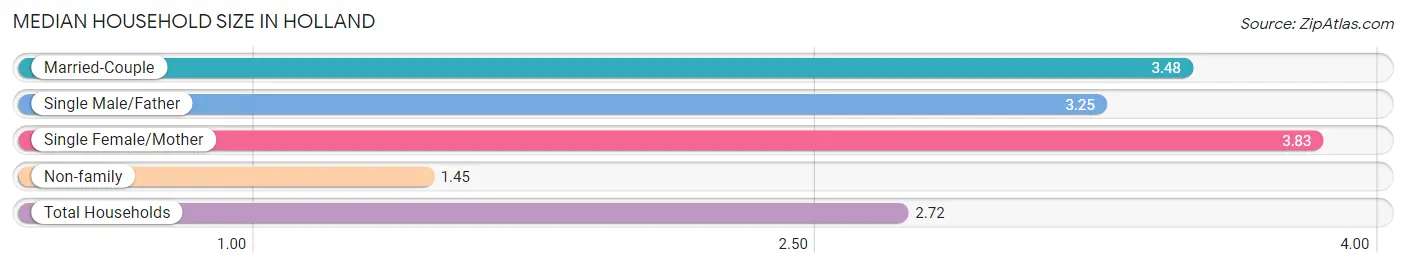
The median household size in Holland is 2.72 persons per household, with single female/mother households (12 | 11.8%) accounting for the largest median household size of 3.83 persons per household. non-family households (40 | 39.2%) represent the smallest median household size with 1.45 persons per household.
| Household Type | # Households | Household Size |
| Married-Couple | 46 (45.1%) | 3.48 |
| Single Male/Father | 4 (3.9%) | 3.25 |
| Single Female/Mother | 12 (11.8%) | 3.83 |
| Non-family | 40 (39.2%) | 1.45 |
| Total Households | 102 (100.0%) | 2.72 |
Household Size by Marriage Status in Holland
Out of a total of 102 households in Holland, 62 (60.8%) are family households, while 40 (39.2%) are nonfamily households. The most numerous type of family households are 4-person households, comprising 23, and the most common type of nonfamily households are 1-person households, comprising 34.
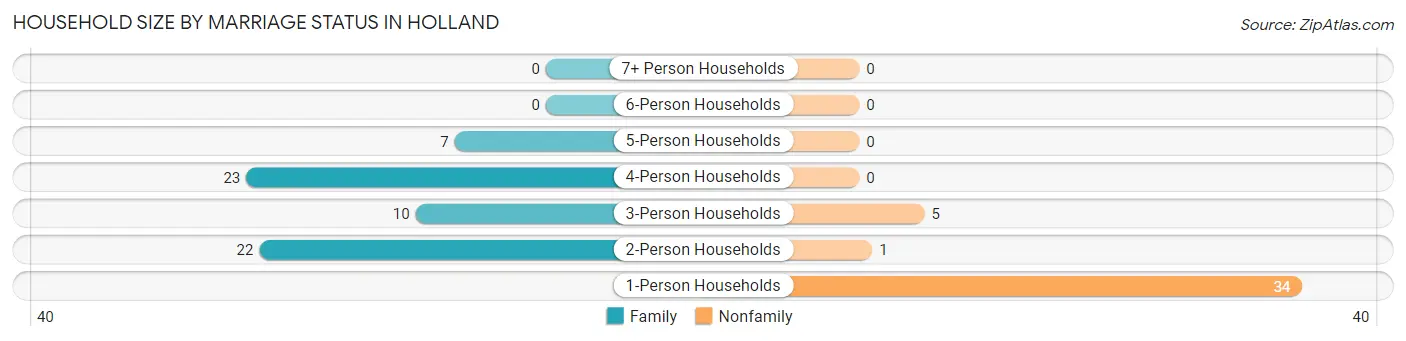
| Household Size | Family Households | Nonfamily Households |
| 1-Person Households | - | 34 (33.3%) |
| 2-Person Households | 22 (21.6%) | 1 (1.0%) |
| 3-Person Households | 10 (9.8%) | 5 (4.9%) |
| 4-Person Households | 23 (22.6%) | 0 (0.0%) |
| 5-Person Households | 7 (6.9%) | 0 (0.0%) |
| 6-Person Households | 0 (0.0%) | 0 (0.0%) |
| 7+ Person Households | 0 (0.0%) | 0 (0.0%) |
| Total | 62 (60.8%) | 40 (39.2%) |
Female Fertility in Holland
Fertility by Age in Holland
Average fertility rate in Holland is 344.0 births per 1,000 women. Women in the age bracket of 20 to 34 years have the highest fertility rate with 842.0 births per 1,000 women. Women in the age bracket of 20 to 34 years acount for 100.0% of all women with births.
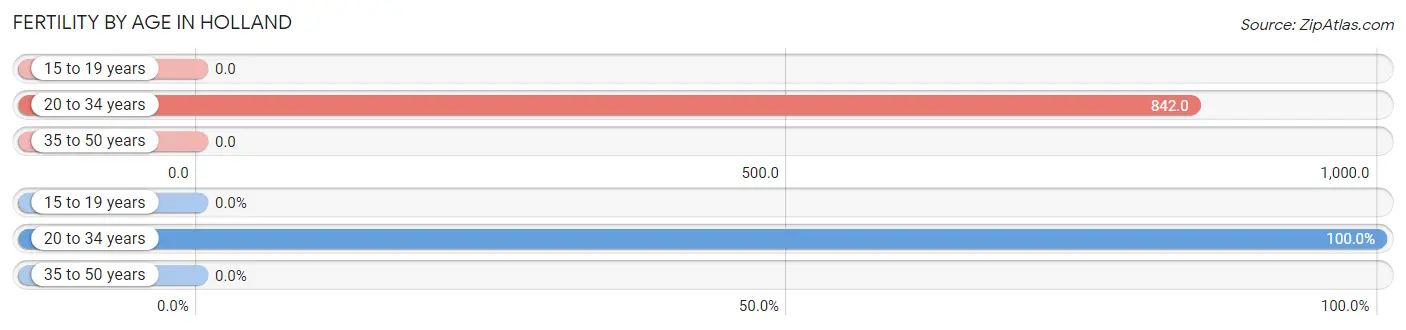
| Age Bracket | Women with Births | Births / 1,000 Women |
| 15 to 19 years | 0 (0.0%) | 0.0 |
| 20 to 34 years | 32 (100.0%) | 842.0 |
| 35 to 50 years | 0 (0.0%) | 0.0 |
| Total | 32 (100.0%) | 344.0 |
Fertility by Age by Marriage Status in Holland
78.1% of women with births (32) in Holland are married. The highest percentage of unmarried women with births falls into 20 to 34 years age bracket with 21.9% of them unmarried at the time of birth, while the lowest percentage of unmarried women with births belong to 20 to 34 years age bracket with 21.9% of them unmarried.
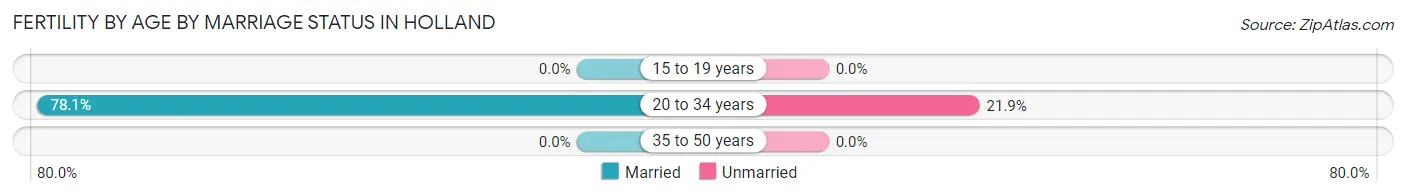
| Age Bracket | Married | Unmarried |
| 15 to 19 years | 0 (0.0%) | 0 (0.0%) |
| 20 to 34 years | 25 (78.1%) | 7 (21.9%) |
| 35 to 50 years | 0 (0.0%) | 0 (0.0%) |
| Total | 25 (78.1%) | 7 (21.9%) |
Fertility by Education in Holland
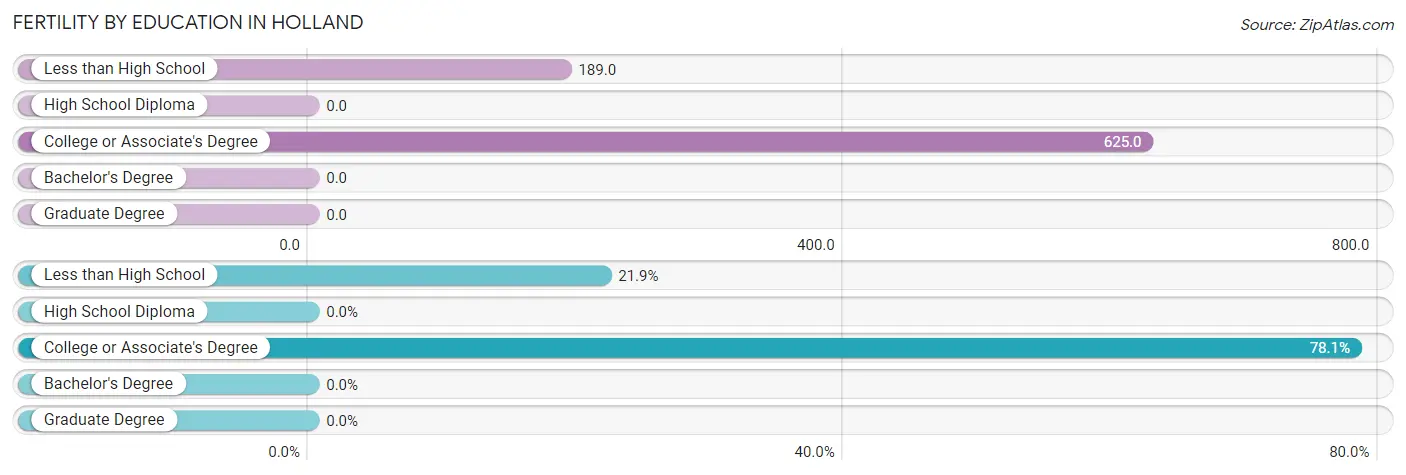
| Educational Attainment | Women with Births | Births / 1,000 Women |
| Less than High School | 7 (21.9%) | 189.0 |
| High School Diploma | 0 (0.0%) | 0.0 |
| College or Associate's Degree | 25 (78.1%) | 625.0 |
| Bachelor's Degree | 0 (0.0%) | 0.0 |
| Graduate Degree | 0 (0.0%) | 0.0 |
| Total | 32 (100.0%) | 344.0 |
Fertility by Education by Marriage Status in Holland
21.9% of women with births in Holland are unmarried. Women with the educational attainment of college or associate's degree are most likely to be married with 100.0% of them married at childbirth, while women with the educational attainment of less than high school are least likely to be married with 100.0% of them unmarried at childbirth.
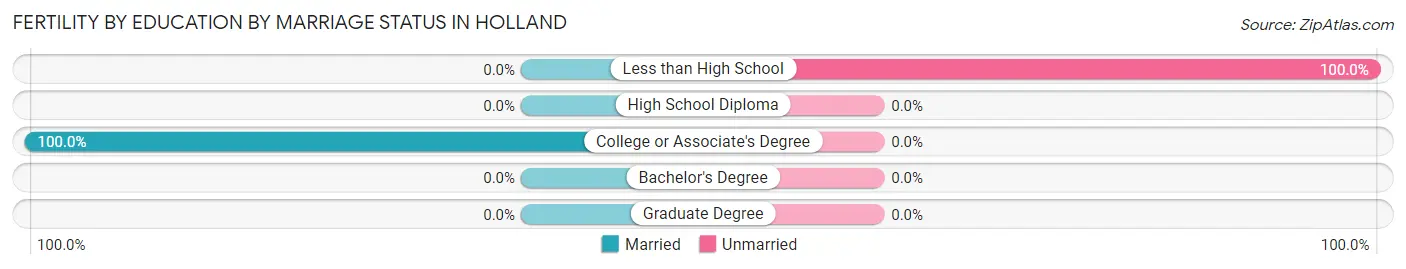
| Educational Attainment | Married | Unmarried |
| Less than High School | 0 (0.0%) | 7 (100.0%) |
| High School Diploma | 0 (0.0%) | 0 (0.0%) |
| College or Associate's Degree | 25 (100.0%) | 0 (0.0%) |
| Bachelor's Degree | 0 (0.0%) | 0 (0.0%) |
| Graduate Degree | 0 (0.0%) | 0 (0.0%) |
| Total | 25 (78.1%) | 7 (21.9%) |
Employment Characteristics in Holland
Employment by Class of Employer in Holland
Among the 125 employed individuals in Holland, private company employees (92 | 73.6%), not-for-profit organizations (17 | 13.6%), and self-employed (not incorporated) (12 | 9.6%) make up the most common classes of employment.
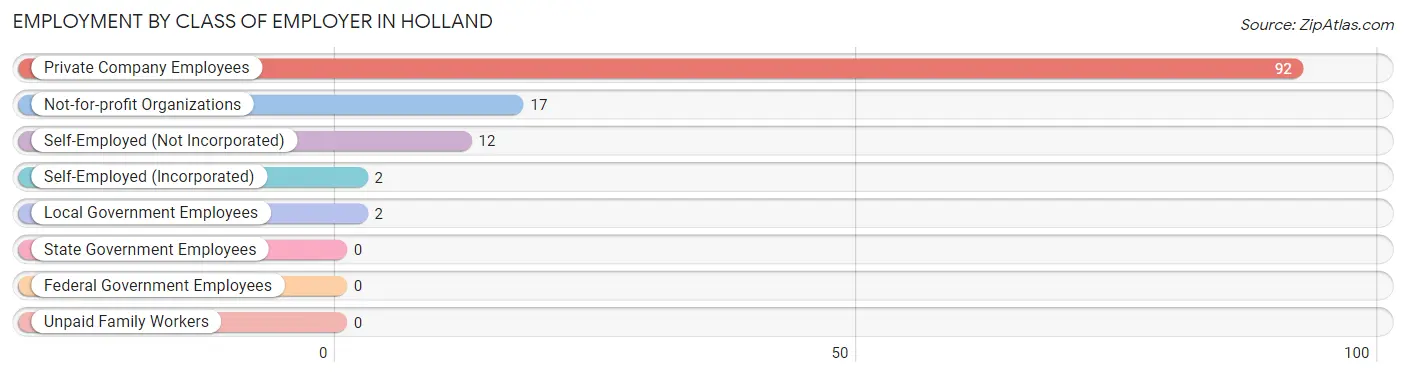
| Employer Class | # Employees | % Employees |
| Private Company Employees | 92 | 73.6% |
| Self-Employed (Incorporated) | 2 | 1.6% |
| Self-Employed (Not Incorporated) | 12 | 9.6% |
| Not-for-profit Organizations | 17 | 13.6% |
| Local Government Employees | 2 | 1.6% |
| State Government Employees | 0 | 0.0% |
| Federal Government Employees | 0 | 0.0% |
| Unpaid Family Workers | 0 | 0.0% |
| Total | 125 | 100.0% |
Employment Status by Age in Holland
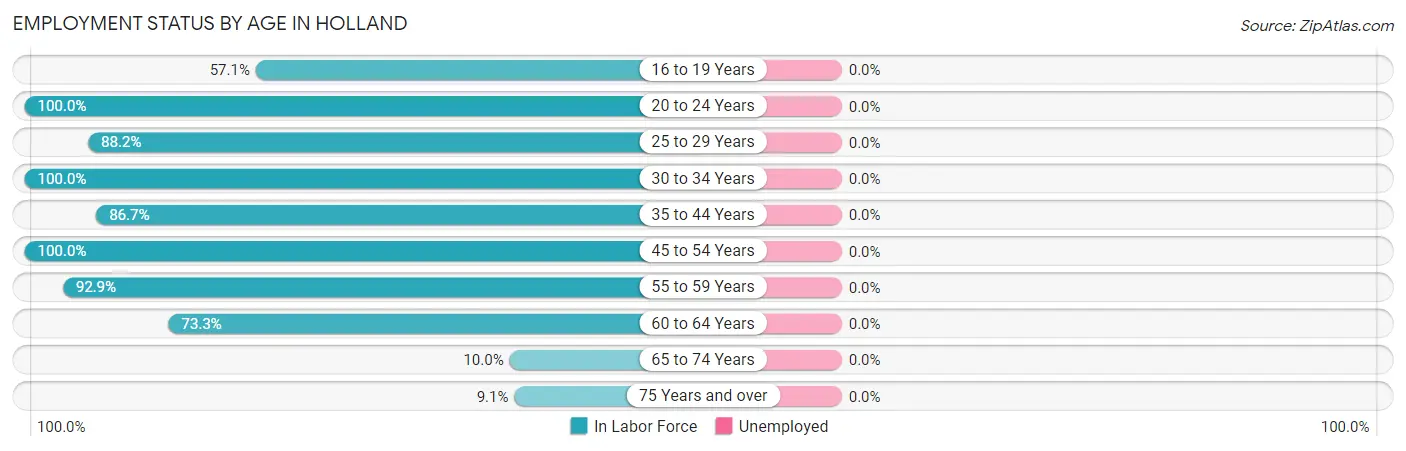
| Age Bracket | In Labor Force | Unemployed |
| 16 to 19 Years | 8 (57.1%) | 0 (0.0%) |
| 20 to 24 Years | 10 (100.0%) | 0 (0.0%) |
| 25 to 29 Years | 30 (88.2%) | 0 (0.0%) |
| 30 to 34 Years | 8 (100.0%) | 0 (0.0%) |
| 35 to 44 Years | 39 (86.7%) | 0 (0.0%) |
| 45 to 54 Years | 26 (100.0%) | 0 (0.0%) |
| 55 to 59 Years | 13 (92.9%) | 0 (0.0%) |
| 60 to 64 Years | 11 (73.3%) | 0 (0.0%) |
| 65 to 74 Years | 2 (10.0%) | 0 (0.0%) |
| 75 Years and over | 1 (9.1%) | 0 (0.0%) |
| Total | 148 (75.1%) | 0 (0.0%) |
Employment Status by Educational Attainment in Holland
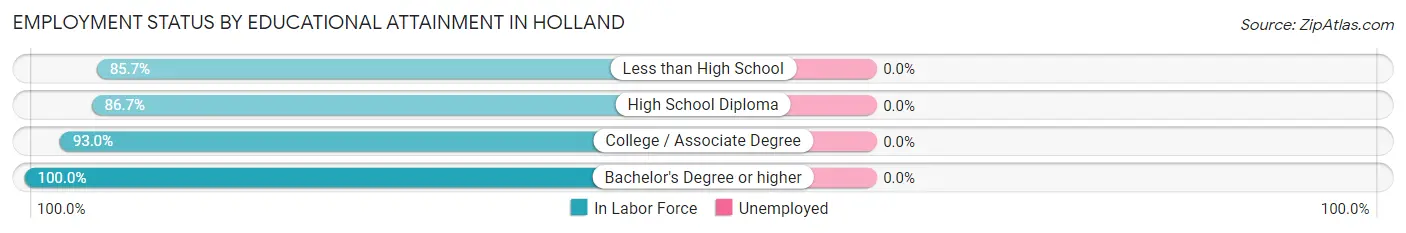
| Educational Attainment | In Labor Force | Unemployed |
| Less than High School | 30 (85.7%) | 0 (0.0%) |
| High School Diploma | 39 (86.7%) | 0 (0.0%) |
| College / Associate Degree | 53 (93.0%) | 0 (0.0%) |
| Bachelor's Degree or higher | 5 (100.0%) | 0 (0.0%) |
| Total | 127 (89.4%) | 0 (0.0%) |
Employment Occupations by Sex in Holland
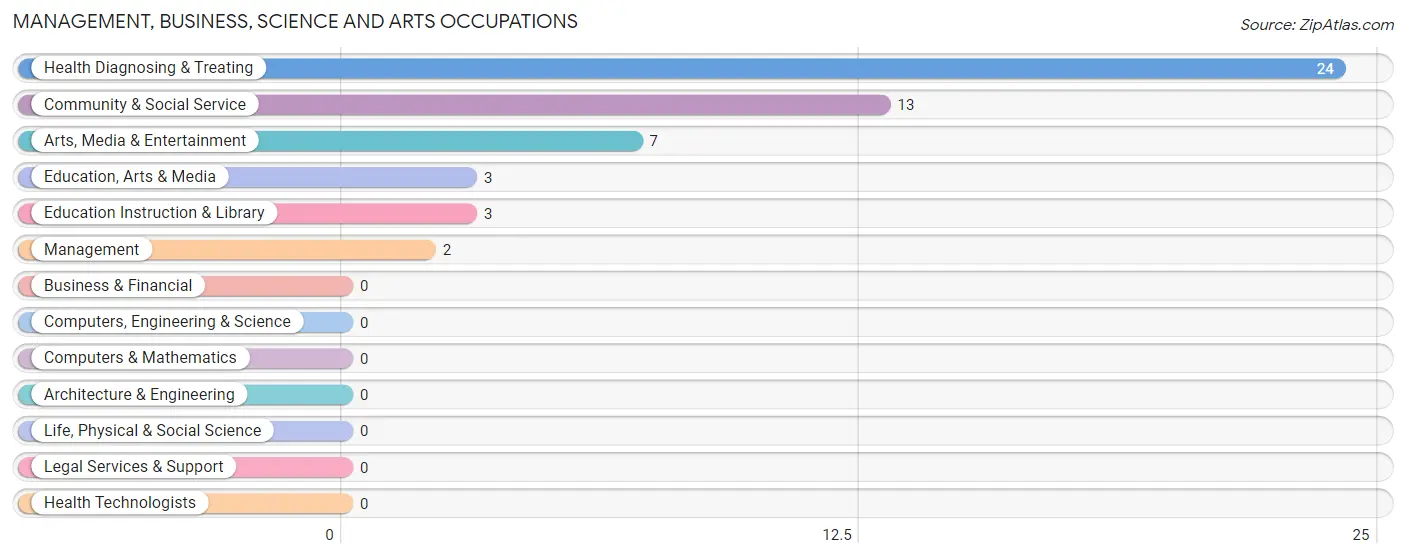
Management, Business, Science and Arts Occupations
The most common Management, Business, Science and Arts occupations in Holland are Health Diagnosing & Treating (24 | 16.2%), Community & Social Service (13 | 8.8%), Arts, Media & Entertainment (7 | 4.7%), Education, Arts & Media (3 | 2.0%), and Education Instruction & Library (3 | 2.0%).
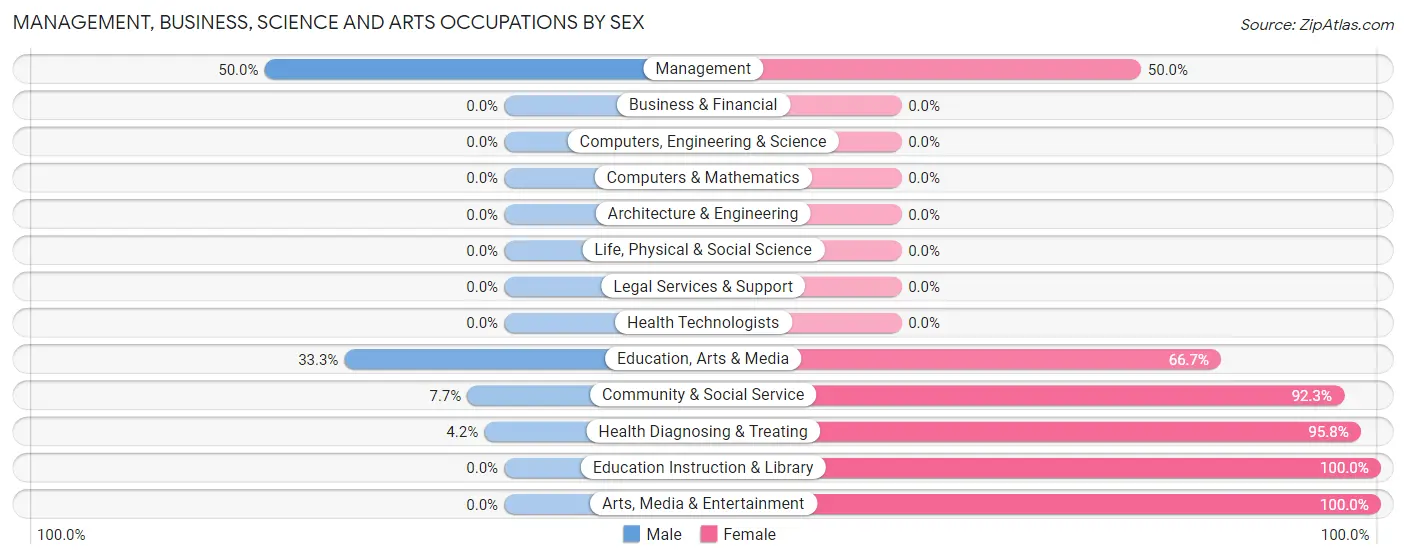
Management, Business, Science and Arts Occupations by Sex
Within the Management, Business, Science and Arts occupations in Holland, the most male-oriented occupations are Management (50.0%), Education, Arts & Media (33.3%), and Community & Social Service (7.7%), while the most female-oriented occupations are Education Instruction & Library (100.0%), Arts, Media & Entertainment (100.0%), and Health Diagnosing & Treating (95.8%).
| Occupation | Male | Female |
| Management | 1 (50.0%) | 1 (50.0%) |
| Business & Financial | 0 (0.0%) | 0 (0.0%) |
| Computers, Engineering & Science | 0 (0.0%) | 0 (0.0%) |
| Computers & Mathematics | 0 (0.0%) | 0 (0.0%) |
| Architecture & Engineering | 0 (0.0%) | 0 (0.0%) |
| Life, Physical & Social Science | 0 (0.0%) | 0 (0.0%) |
| Community & Social Service | 1 (7.7%) | 12 (92.3%) |
| Education, Arts & Media | 1 (33.3%) | 2 (66.7%) |
| Legal Services & Support | 0 (0.0%) | 0 (0.0%) |
| Education Instruction & Library | 0 (0.0%) | 3 (100.0%) |
| Arts, Media & Entertainment | 0 (0.0%) | 7 (100.0%) |
| Health Diagnosing & Treating | 1 (4.2%) | 23 (95.8%) |
| Health Technologists | 0 (0.0%) | 0 (0.0%) |
| Total (Category) | 3 (7.7%) | 36 (92.3%) |
| Total (Overall) | 60 (40.5%) | 88 (59.5%) |
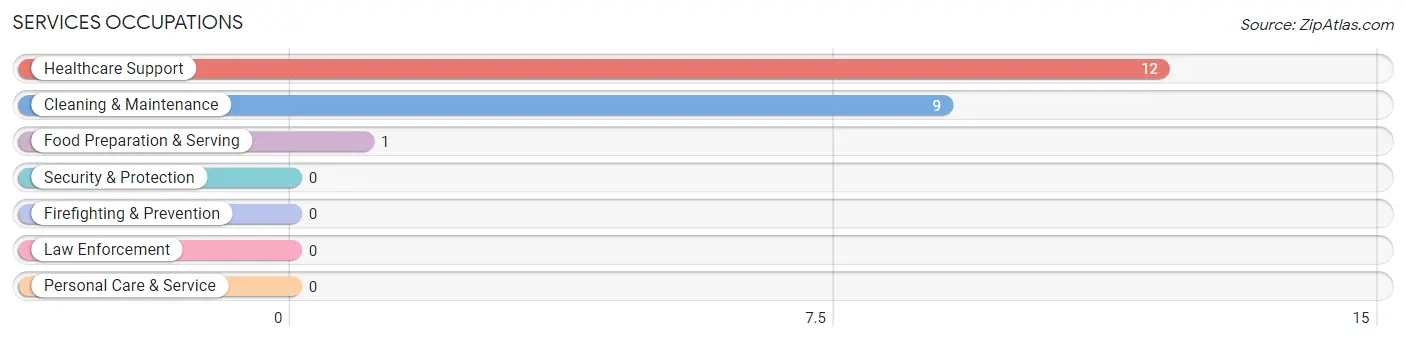
Services Occupations
The most common Services occupations in Holland are Healthcare Support (12 | 8.1%), Cleaning & Maintenance (9 | 6.1%), and Food Preparation & Serving (1 | 0.7%).
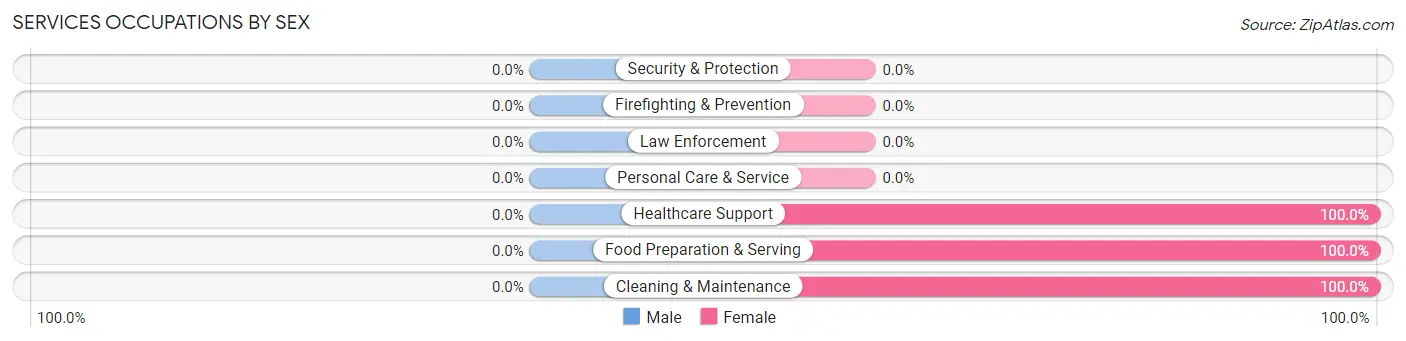
Services Occupations by Sex
| Occupation | Male | Female |
| Healthcare Support | 0 (0.0%) | 12 (100.0%) |
| Security & Protection | 0 (0.0%) | 0 (0.0%) |
| Firefighting & Prevention | 0 (0.0%) | 0 (0.0%) |
| Law Enforcement | 0 (0.0%) | 0 (0.0%) |
| Food Preparation & Serving | 0 (0.0%) | 1 (100.0%) |
| Cleaning & Maintenance | 0 (0.0%) | 9 (100.0%) |
| Personal Care & Service | 0 (0.0%) | 0 (0.0%) |
| Total (Category) | 0 (0.0%) | 22 (100.0%) |
| Total (Overall) | 60 (40.5%) | 88 (59.5%) |
Sales and Office Occupations
The most common Sales and Office occupations in Holland are Sales & Related (5 | 3.4%), and Office & Administration (4 | 2.7%).
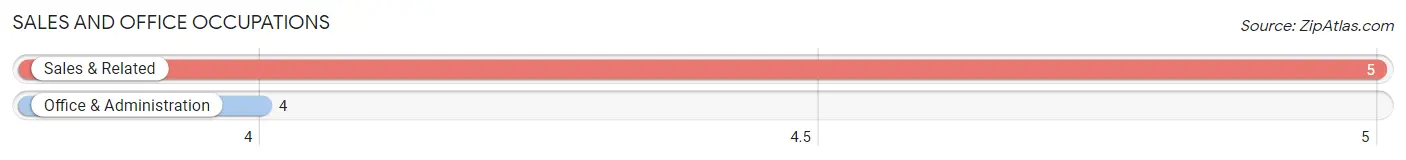
Sales and Office Occupations by Sex

| Occupation | Male | Female |
| Sales & Related | 4 (80.0%) | 1 (20.0%) |
| Office & Administration | 0 (0.0%) | 4 (100.0%) |
| Total (Category) | 4 (44.4%) | 5 (55.6%) |
| Total (Overall) | 60 (40.5%) | 88 (59.5%) |
Natural Resources, Construction and Maintenance Occupations
The most common Natural Resources, Construction and Maintenance occupations in Holland are Farming, Fishing & Forestry (27 | 18.2%), Construction & Extraction (13 | 8.8%), and Installation, Maintenance & Repair (9 | 6.1%).
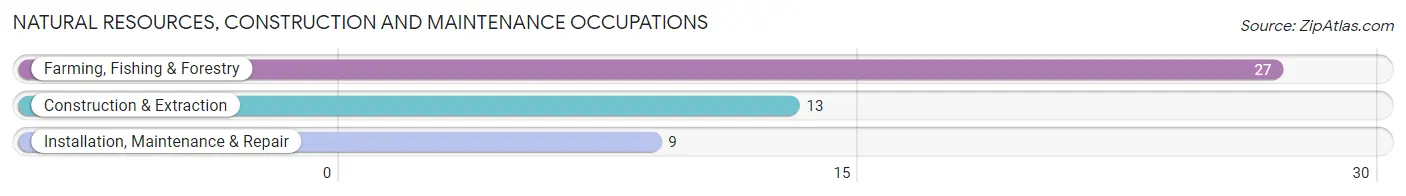
Natural Resources, Construction and Maintenance Occupations by Sex

| Occupation | Male | Female |
| Farming, Fishing & Forestry | 14 (51.8%) | 13 (48.1%) |
| Construction & Extraction | 13 (100.0%) | 0 (0.0%) |
| Installation, Maintenance & Repair | 9 (100.0%) | 0 (0.0%) |
| Total (Category) | 36 (73.5%) | 13 (26.5%) |
| Total (Overall) | 60 (40.5%) | 88 (59.5%) |
Production, Transportation and Moving Occupations
The most common Production, Transportation and Moving occupations in Holland are Production (18 | 12.2%), Transportation (7 | 4.7%), and Material Moving (4 | 2.7%).
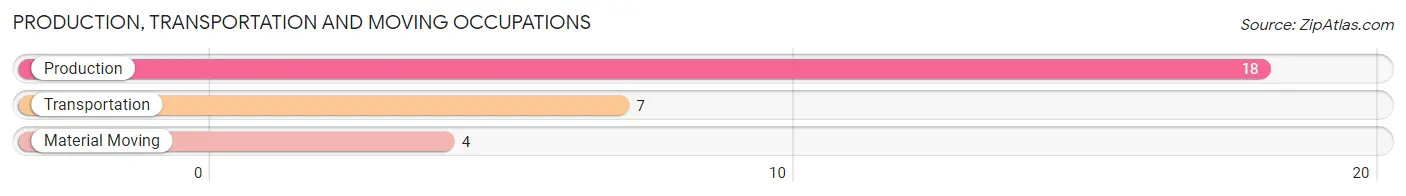
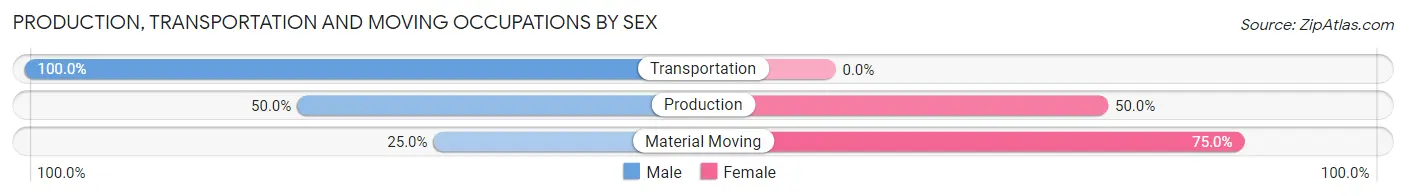
Production, Transportation and Moving Occupations by Sex
| Occupation | Male | Female |
| Production | 9 (50.0%) | 9 (50.0%) |
| Transportation | 7 (100.0%) | 0 (0.0%) |
| Material Moving | 1 (25.0%) | 3 (75.0%) |
| Total (Category) | 17 (58.6%) | 12 (41.4%) |
| Total (Overall) | 60 (40.5%) | 88 (59.5%) |
Employment Industries by Sex in Holland
Employment Industries in Holland
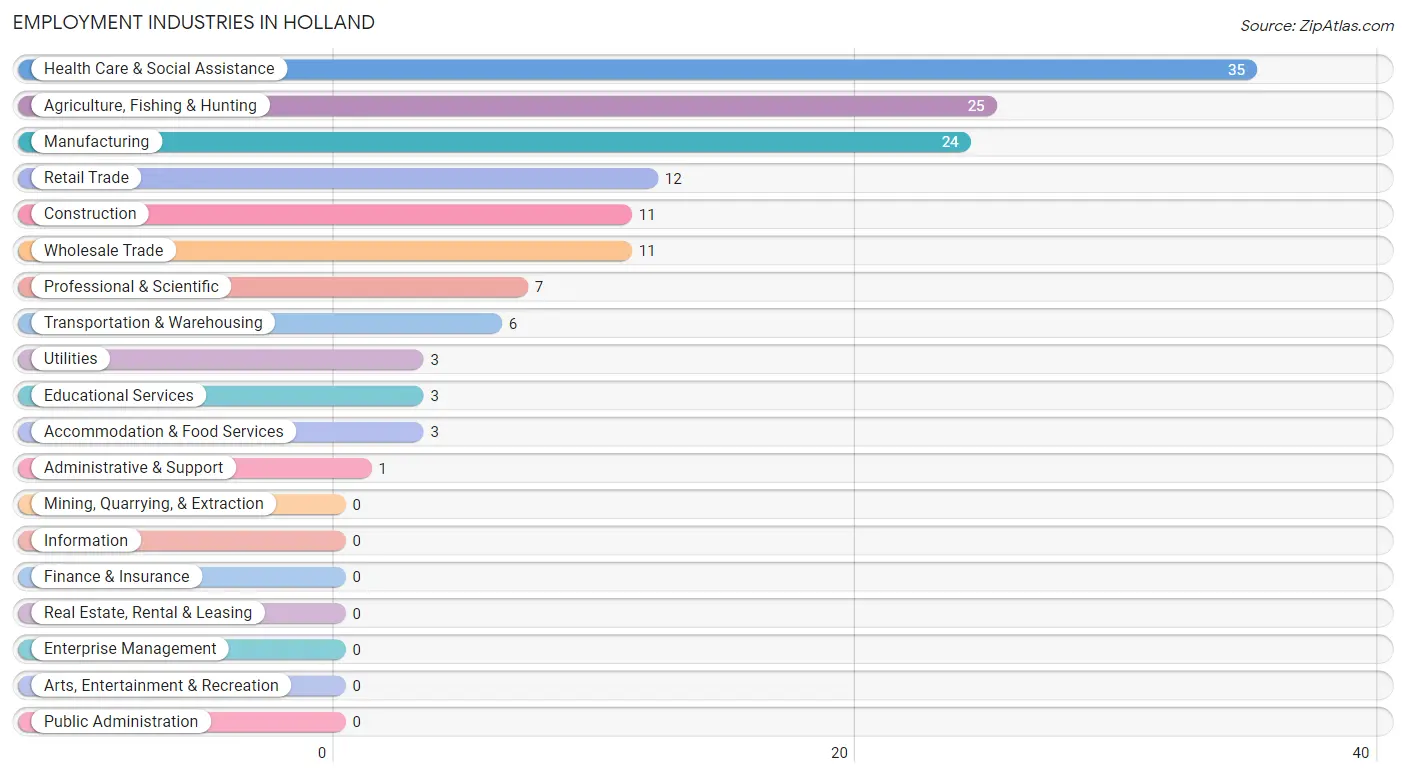
The major employment industries in Holland include Health Care & Social Assistance (35 | 23.6%), Agriculture, Fishing & Hunting (25 | 16.9%), Manufacturing (24 | 16.2%), Retail Trade (12 | 8.1%), and Construction (11 | 7.4%).
Employment Industries by Sex in Holland
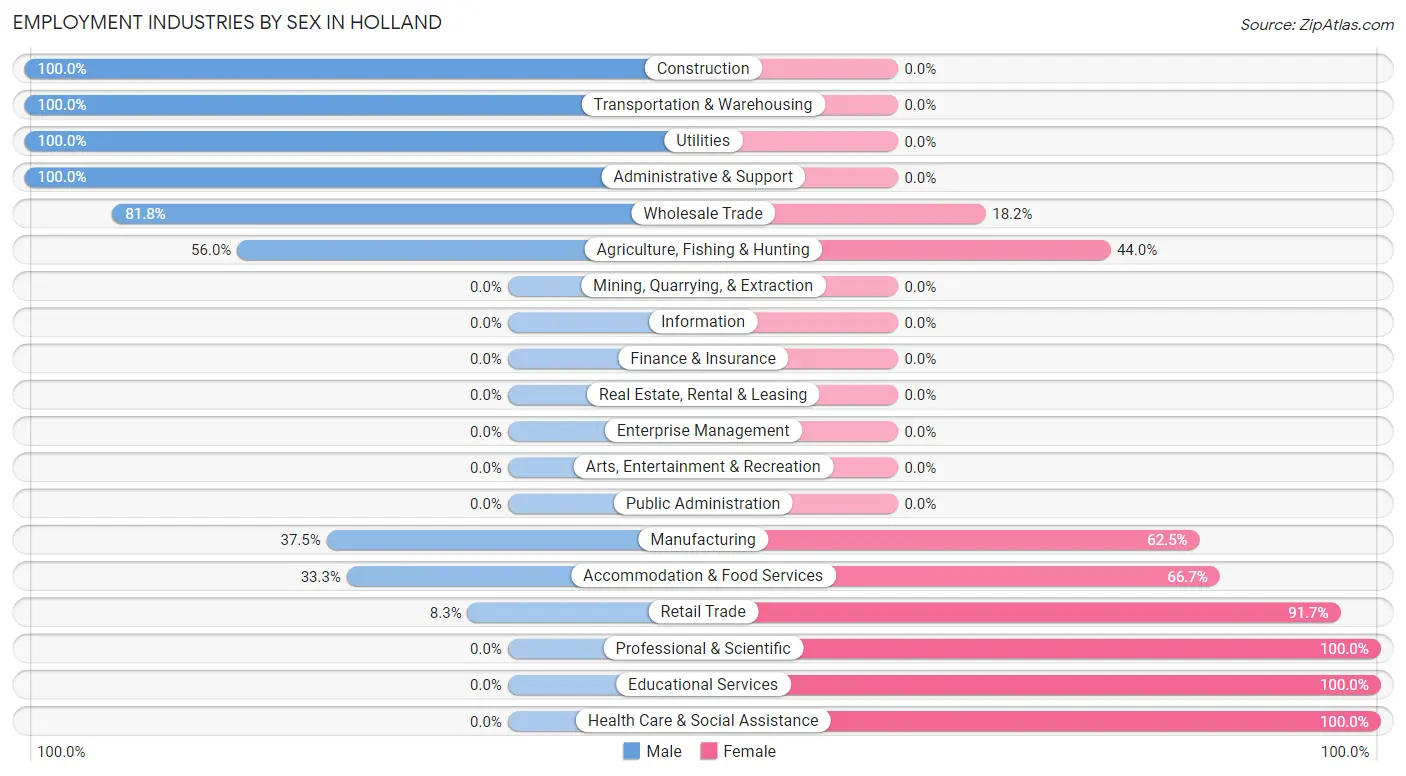
The Holland industries that see more men than women are Construction (100.0%), Transportation & Warehousing (100.0%), and Utilities (100.0%), whereas the industries that tend to have a higher number of women are Professional & Scientific (100.0%), Educational Services (100.0%), and Health Care & Social Assistance (100.0%).
| Industry | Male | Female |
| Agriculture, Fishing & Hunting | 14 (56.0%) | 11 (44.0%) |
| Mining, Quarrying, & Extraction | 0 (0.0%) | 0 (0.0%) |
| Construction | 11 (100.0%) | 0 (0.0%) |
| Manufacturing | 9 (37.5%) | 15 (62.5%) |
| Wholesale Trade | 9 (81.8%) | 2 (18.2%) |
| Retail Trade | 1 (8.3%) | 11 (91.7%) |
| Transportation & Warehousing | 6 (100.0%) | 0 (0.0%) |
| Utilities | 3 (100.0%) | 0 (0.0%) |
| Information | 0 (0.0%) | 0 (0.0%) |
| Finance & Insurance | 0 (0.0%) | 0 (0.0%) |
| Real Estate, Rental & Leasing | 0 (0.0%) | 0 (0.0%) |
| Professional & Scientific | 0 (0.0%) | 7 (100.0%) |
| Enterprise Management | 0 (0.0%) | 0 (0.0%) |
| Administrative & Support | 1 (100.0%) | 0 (0.0%) |
| Educational Services | 0 (0.0%) | 3 (100.0%) |
| Health Care & Social Assistance | 0 (0.0%) | 35 (100.0%) |
| Arts, Entertainment & Recreation | 0 (0.0%) | 0 (0.0%) |
| Accommodation & Food Services | 1 (33.3%) | 2 (66.7%) |
| Public Administration | 0 (0.0%) | 0 (0.0%) |
| Total | 60 (40.5%) | 88 (59.5%) |
Education in Holland
School Enrollment in Holland
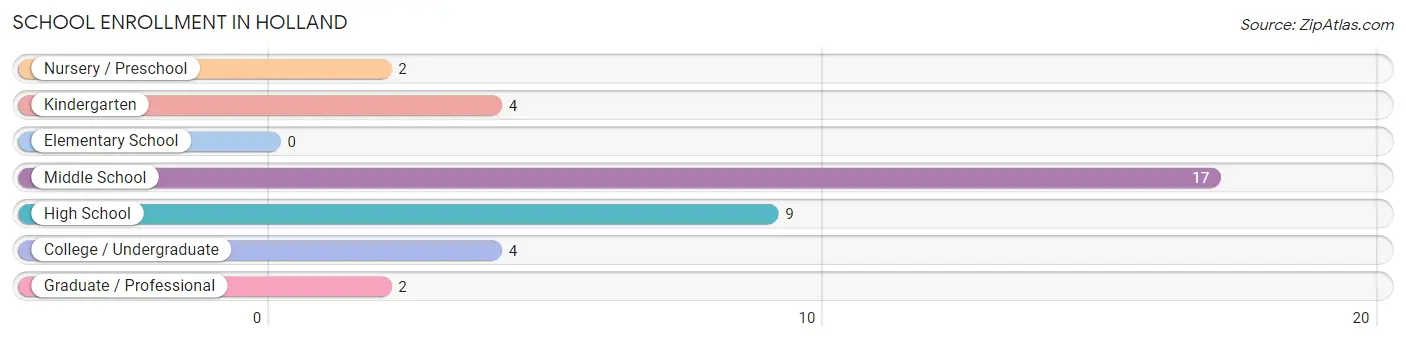
The most common levels of schooling among the 38 students in Holland are middle school (17 | 44.7%), high school (9 | 23.7%), and kindergarten (4 | 10.5%).
| School Level | # Students | % Students |
| Nursery / Preschool | 2 | 5.3% |
| Kindergarten | 4 | 10.5% |
| Elementary School | 0 | 0.0% |
| Middle School | 17 | 44.7% |
| High School | 9 | 23.7% |
| College / Undergraduate | 4 | 10.5% |
| Graduate / Professional | 2 | 5.3% |
| Total | 38 | 100.0% |
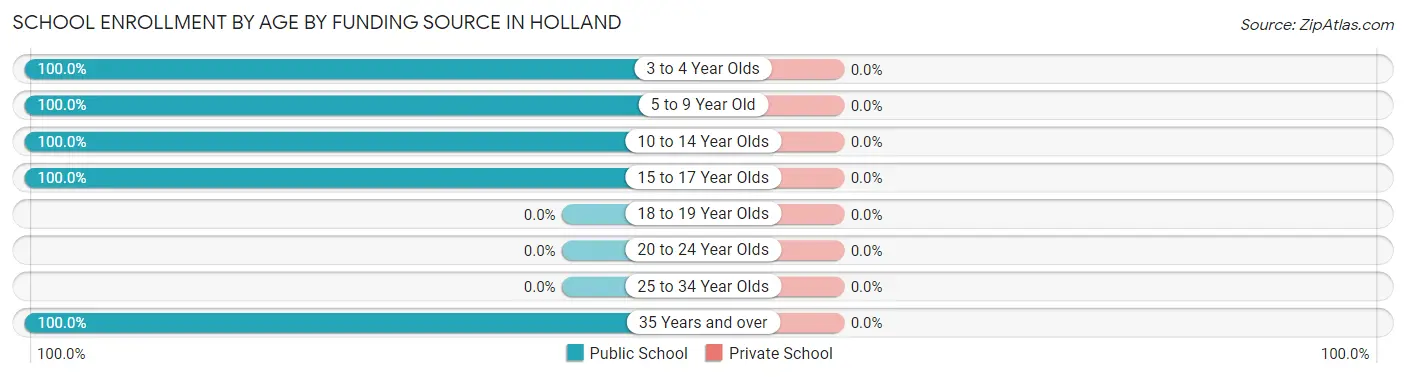
School Enrollment by Age by Funding Source in Holland
| Age Bracket | Public School | Private School |
| 3 to 4 Year Olds | 2 (100.0%) | 0 (0.0%) |
| 5 to 9 Year Old | 4 (100.0%) | 0 (0.0%) |
| 10 to 14 Year Olds | 18 (100.0%) | 0 (0.0%) |
| 15 to 17 Year Olds | 8 (100.0%) | 0 (0.0%) |
| 18 to 19 Year Olds | 0 (0.0%) | 0 (0.0%) |
| 20 to 24 Year Olds | 0 (0.0%) | 0 (0.0%) |
| 25 to 34 Year Olds | 0 (0.0%) | 0 (0.0%) |
| 35 Years and over | 6 (100.0%) | 0 (0.0%) |
| Total | 38 (100.0%) | 0 (0.0%) |
Educational Attainment by Field of Study in Holland
Education (4 | 30.8%), visual & performing arts (3 | 23.1%), bio, nature & agricultural (1 | 7.7%), psychology (1 | 7.7%), and social sciences (1 | 7.7%) are the most common fields of study among 13 individuals in Holland who have obtained a bachelor's degree or higher.
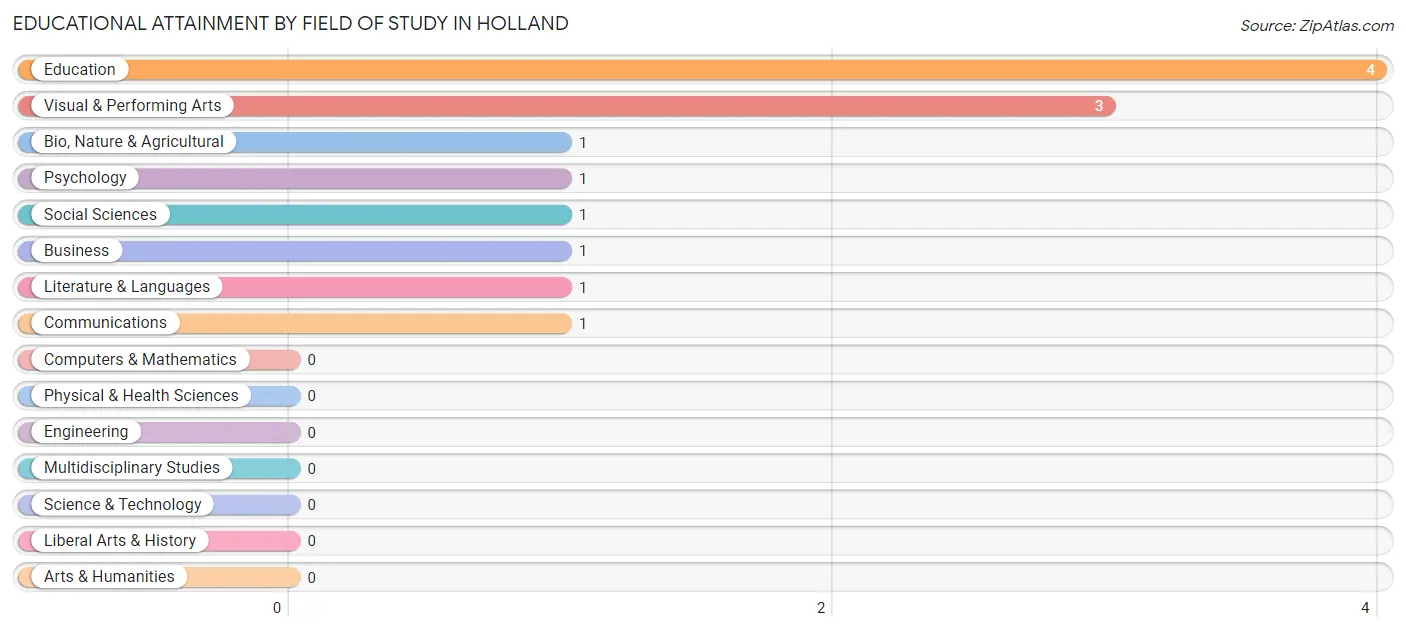
| Field of Study | # Graduates | % Graduates |
| Computers & Mathematics | 0 | 0.0% |
| Bio, Nature & Agricultural | 1 | 7.7% |
| Physical & Health Sciences | 0 | 0.0% |
| Psychology | 1 | 7.7% |
| Social Sciences | 1 | 7.7% |
| Engineering | 0 | 0.0% |
| Multidisciplinary Studies | 0 | 0.0% |
| Science & Technology | 0 | 0.0% |
| Business | 1 | 7.7% |
| Education | 4 | 30.8% |
| Literature & Languages | 1 | 7.7% |
| Liberal Arts & History | 0 | 0.0% |
| Visual & Performing Arts | 3 | 23.1% |
| Communications | 1 | 7.7% |
| Arts & Humanities | 0 | 0.0% |
| Total | 13 | 100.0% |
Transportation & Commute in Holland
Vehicle Availability by Sex in Holland
The most prevalent vehicle ownership categories in Holland are males with 2 vehicles (24, accounting for 40.0%) and females with 2 vehicles (20, making up 36.9%).
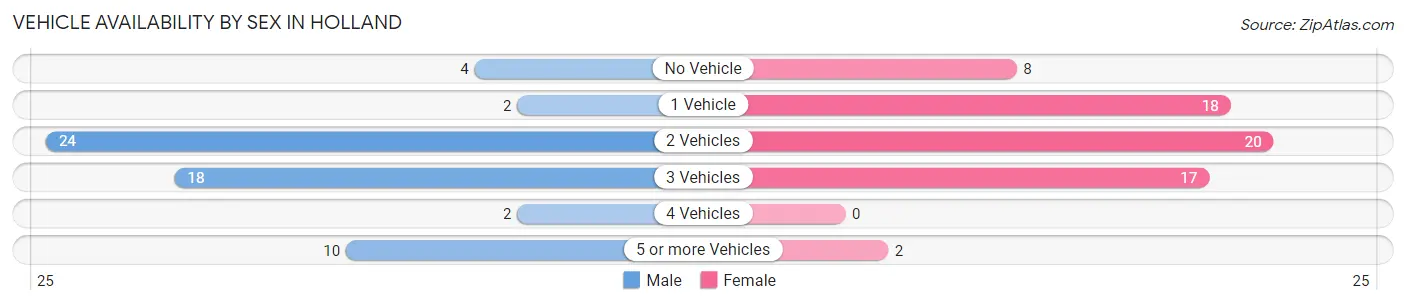
| Vehicles Available | Male | Female |
| No Vehicle | 4 (6.7%) | 8 (12.3%) |
| 1 Vehicle | 2 (3.3%) | 18 (27.7%) |
| 2 Vehicles | 24 (40.0%) | 20 (30.8%) |
| 3 Vehicles | 18 (30.0%) | 17 (26.2%) |
| 4 Vehicles | 2 (3.3%) | 0 (0.0%) |
| 5 or more Vehicles | 10 (16.7%) | 2 (3.1%) |
| Total | 60 (100.0%) | 65 (100.0%) |
Commute Time in Holland
The most frequently occuring commute durations in Holland are 15 to 19 minutes (41 commuters, 36.0%), 20 to 24 minutes (23 commuters, 20.2%), and 10 to 14 minutes (15 commuters, 13.2%).
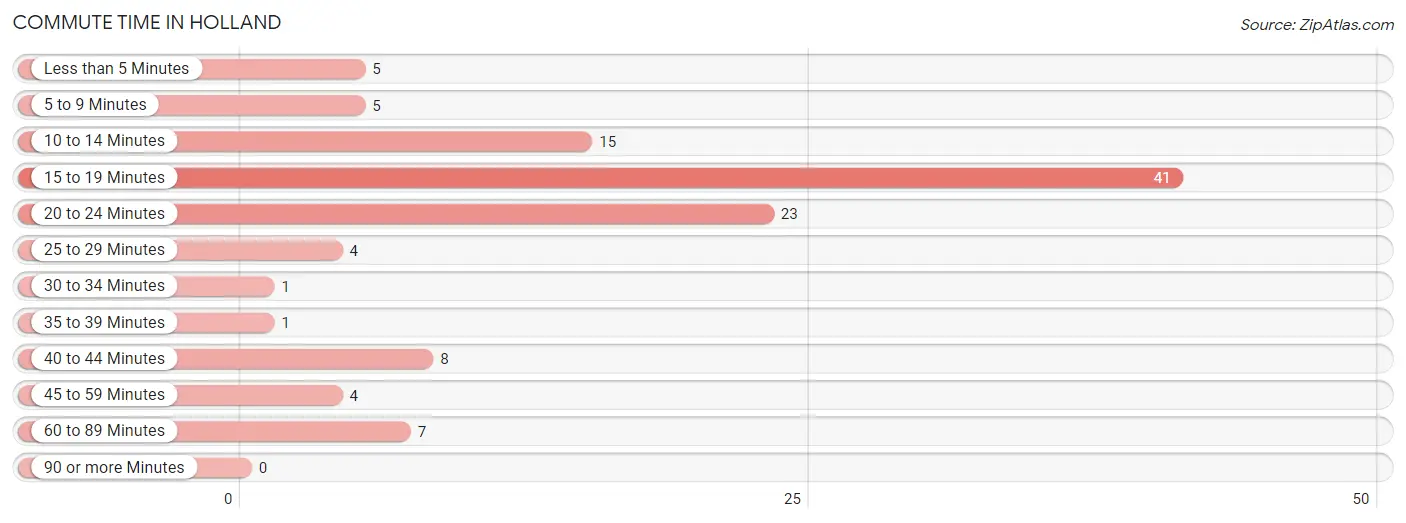
| Commute Time | # Commuters | % Commuters |
| Less than 5 Minutes | 5 | 4.4% |
| 5 to 9 Minutes | 5 | 4.4% |
| 10 to 14 Minutes | 15 | 13.2% |
| 15 to 19 Minutes | 41 | 36.0% |
| 20 to 24 Minutes | 23 | 20.2% |
| 25 to 29 Minutes | 4 | 3.5% |
| 30 to 34 Minutes | 1 | 0.9% |
| 35 to 39 Minutes | 1 | 0.9% |
| 40 to 44 Minutes | 8 | 7.0% |
| 45 to 59 Minutes | 4 | 3.5% |
| 60 to 89 Minutes | 7 | 6.1% |
| 90 or more Minutes | 0 | 0.0% |
Commute Time by Sex in Holland
The most common commute times in Holland are 15 to 19 minutes (22 commuters, 37.9%) for males and 20 to 24 minutes (23 commuters, 41.1%) for females.
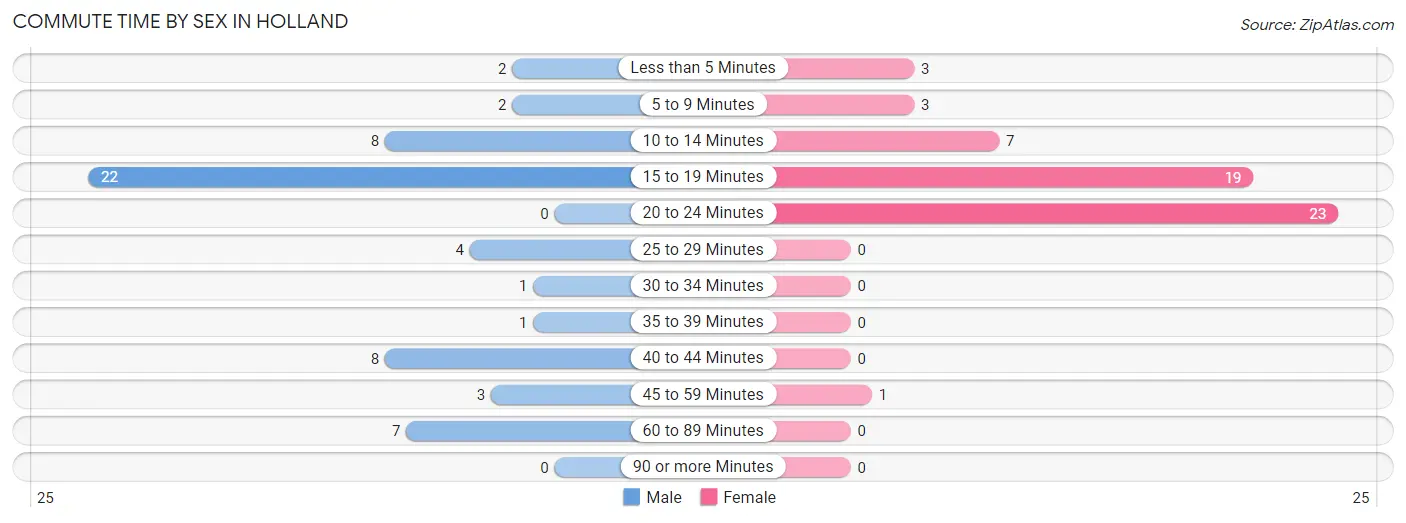
| Commute Time | Male | Female |
| Less than 5 Minutes | 2 (3.5%) | 3 (5.4%) |
| 5 to 9 Minutes | 2 (3.5%) | 3 (5.4%) |
| 10 to 14 Minutes | 8 (13.8%) | 7 (12.5%) |
| 15 to 19 Minutes | 22 (37.9%) | 19 (33.9%) |
| 20 to 24 Minutes | 0 (0.0%) | 23 (41.1%) |
| 25 to 29 Minutes | 4 (6.9%) | 0 (0.0%) |
| 30 to 34 Minutes | 1 (1.7%) | 0 (0.0%) |
| 35 to 39 Minutes | 1 (1.7%) | 0 (0.0%) |
| 40 to 44 Minutes | 8 (13.8%) | 0 (0.0%) |
| 45 to 59 Minutes | 3 (5.2%) | 1 (1.8%) |
| 60 to 89 Minutes | 7 (12.1%) | 0 (0.0%) |
| 90 or more Minutes | 0 (0.0%) | 0 (0.0%) |
Time of Departure to Work by Sex in Holland
The most frequent times of departure to work in Holland are 6:00 AM to 6:29 AM (12, 20.7%) for males and 7:00 AM to 7:29 AM (14, 25.0%) for females.
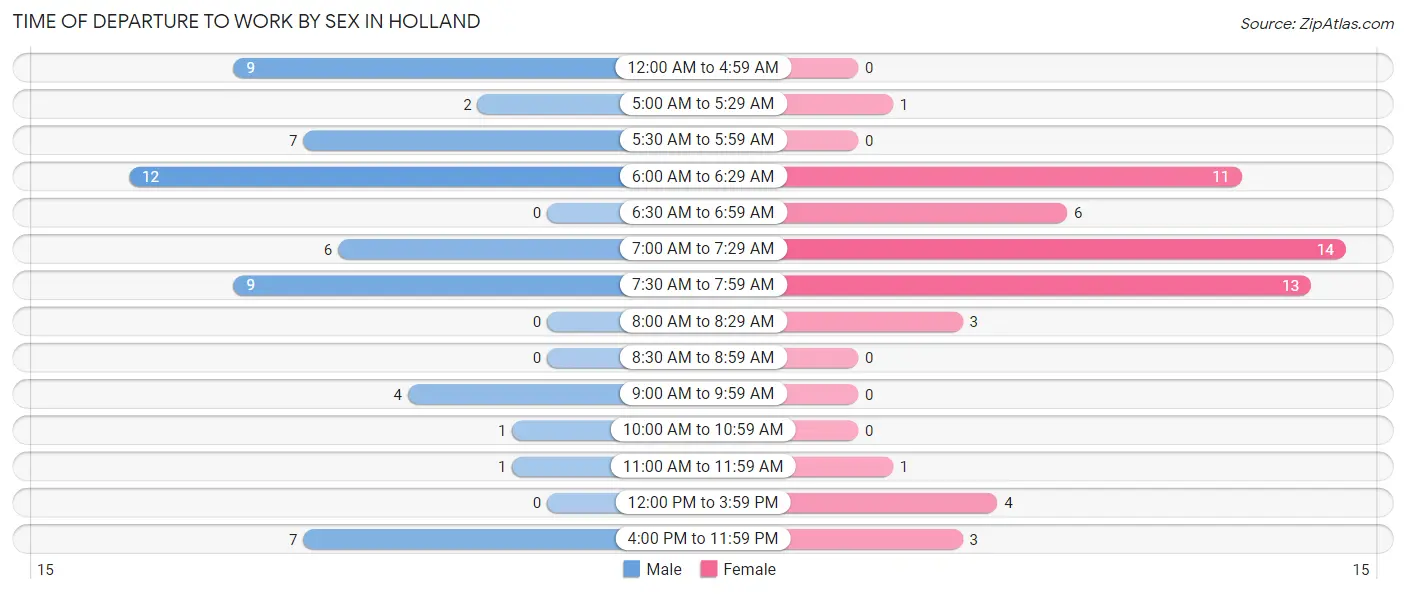
| Time of Departure | Male | Female |
| 12:00 AM to 4:59 AM | 9 (15.5%) | 0 (0.0%) |
| 5:00 AM to 5:29 AM | 2 (3.5%) | 1 (1.8%) |
| 5:30 AM to 5:59 AM | 7 (12.1%) | 0 (0.0%) |
| 6:00 AM to 6:29 AM | 12 (20.7%) | 11 (19.6%) |
| 6:30 AM to 6:59 AM | 0 (0.0%) | 6 (10.7%) |
| 7:00 AM to 7:29 AM | 6 (10.3%) | 14 (25.0%) |
| 7:30 AM to 7:59 AM | 9 (15.5%) | 13 (23.2%) |
| 8:00 AM to 8:29 AM | 0 (0.0%) | 3 (5.4%) |
| 8:30 AM to 8:59 AM | 0 (0.0%) | 0 (0.0%) |
| 9:00 AM to 9:59 AM | 4 (6.9%) | 0 (0.0%) |
| 10:00 AM to 10:59 AM | 1 (1.7%) | 0 (0.0%) |
| 11:00 AM to 11:59 AM | 1 (1.7%) | 1 (1.8%) |
| 12:00 PM to 3:59 PM | 0 (0.0%) | 4 (7.1%) |
| 4:00 PM to 11:59 PM | 7 (12.1%) | 3 (5.4%) |
| Total | 58 (100.0%) | 56 (100.0%) |
Housing Occupancy in Holland
Occupancy by Ownership in Holland
Of the total 102 dwellings in Holland, owner-occupied units account for 82 (80.4%), while renter-occupied units make up 20 (19.6%).
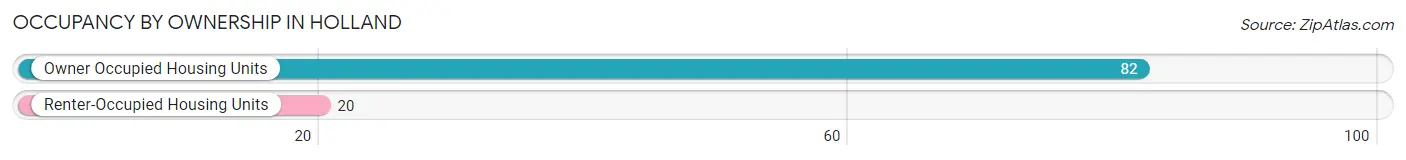
| Occupancy | # Housing Units | % Housing Units |
| Owner Occupied Housing Units | 82 | 80.4% |
| Renter-Occupied Housing Units | 20 | 19.6% |
| Total Occupied Housing Units | 102 | 100.0% |
Occupancy by Household Size in Holland
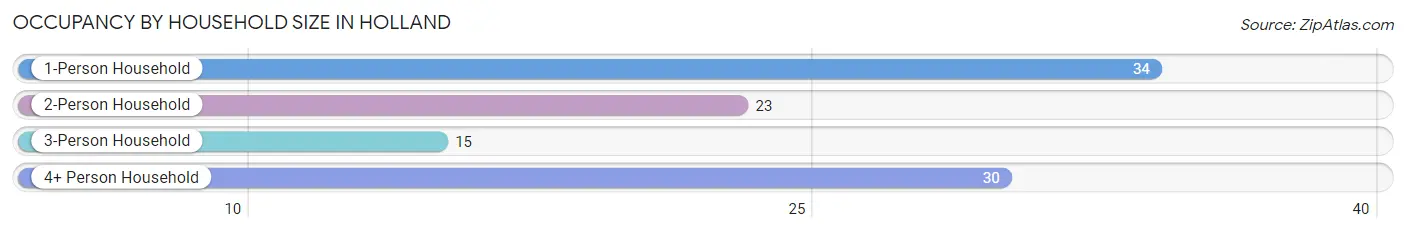
| Household Size | # Housing Units | % Housing Units |
| 1-Person Household | 34 | 33.3% |
| 2-Person Household | 23 | 22.6% |
| 3-Person Household | 15 | 14.7% |
| 4+ Person Household | 30 | 29.4% |
| Total Housing Units | 102 | 100.0% |
Occupancy by Ownership by Household Size in Holland
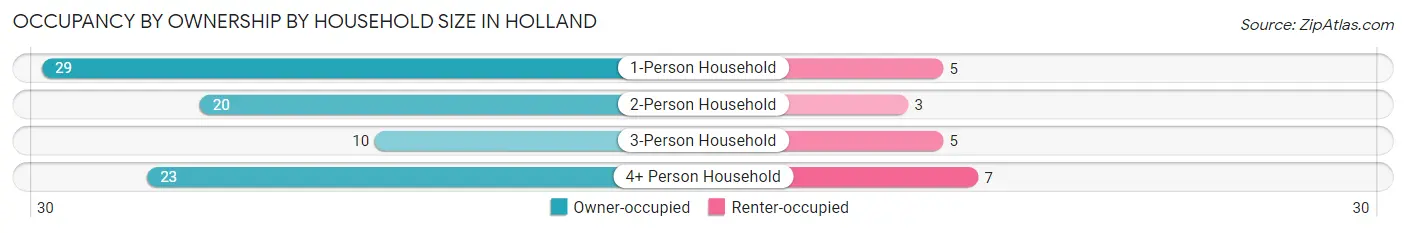
| Household Size | Owner-occupied | Renter-occupied |
| 1-Person Household | 29 (85.3%) | 5 (14.7%) |
| 2-Person Household | 20 (87.0%) | 3 (13.0%) |
| 3-Person Household | 10 (66.7%) | 5 (33.3%) |
| 4+ Person Household | 23 (76.7%) | 7 (23.3%) |
| Total Housing Units | 82 (80.4%) | 20 (19.6%) |
Occupancy by Educational Attainment in Holland
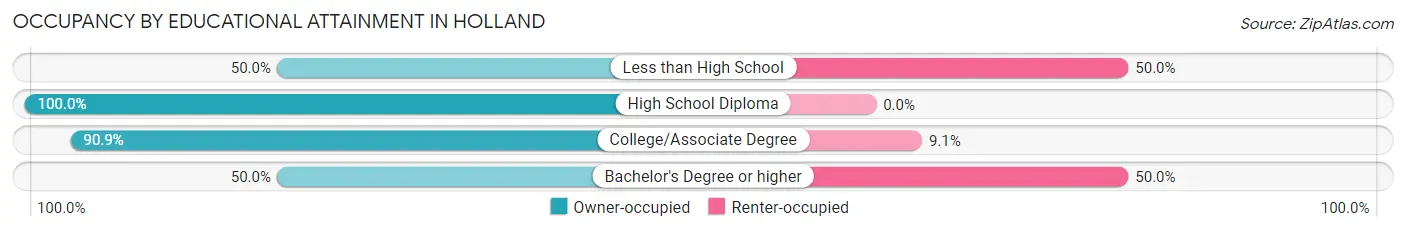
| Household Size | Owner-occupied | Renter-occupied |
| Less than High School | 12 (50.0%) | 12 (50.0%) |
| High School Diploma | 35 (100.0%) | 0 (0.0%) |
| College/Associate Degree | 30 (90.9%) | 3 (9.1%) |
| Bachelor's Degree or higher | 5 (50.0%) | 5 (50.0%) |
Occupancy by Age of Householder in Holland
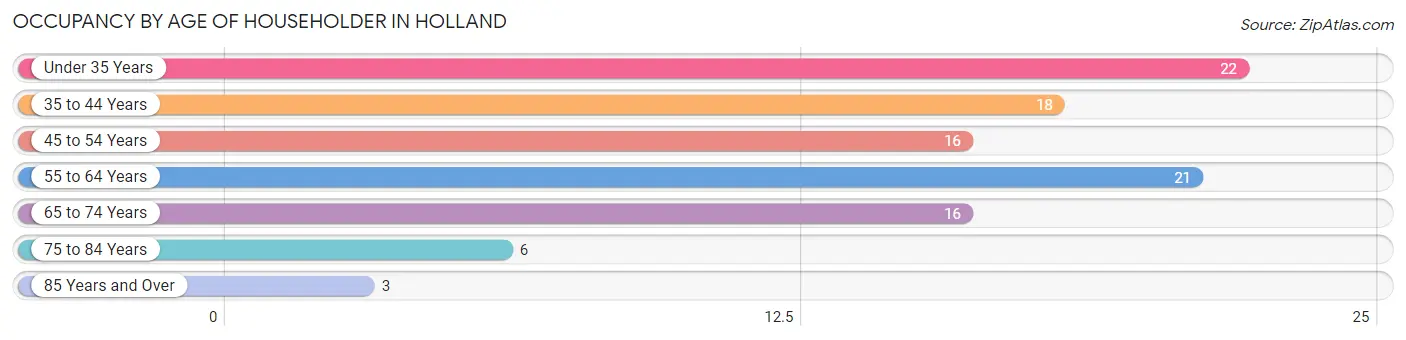
| Age Bracket | # Households | % Households |
| Under 35 Years | 22 | 21.6% |
| 35 to 44 Years | 18 | 17.6% |
| 45 to 54 Years | 16 | 15.7% |
| 55 to 64 Years | 21 | 20.6% |
| 65 to 74 Years | 16 | 15.7% |
| 75 to 84 Years | 6 | 5.9% |
| 85 Years and Over | 3 | 2.9% |
| Total | 102 | 100.0% |
Housing Finances in Holland
Median Income by Occupancy in Holland
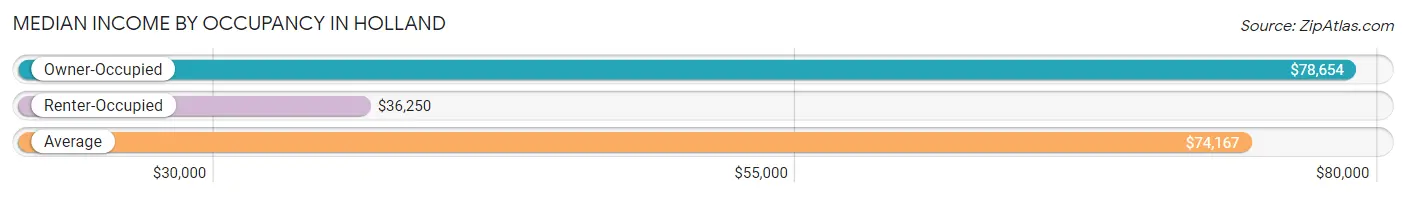
| Occupancy Type | # Households | Median Income |
| Owner-Occupied | 82 (80.4%) | $78,654 |
| Renter-Occupied | 20 (19.6%) | $36,250 |
| Average | 102 (100.0%) | $74,167 |
Occupancy by Householder Income Bracket in Holland
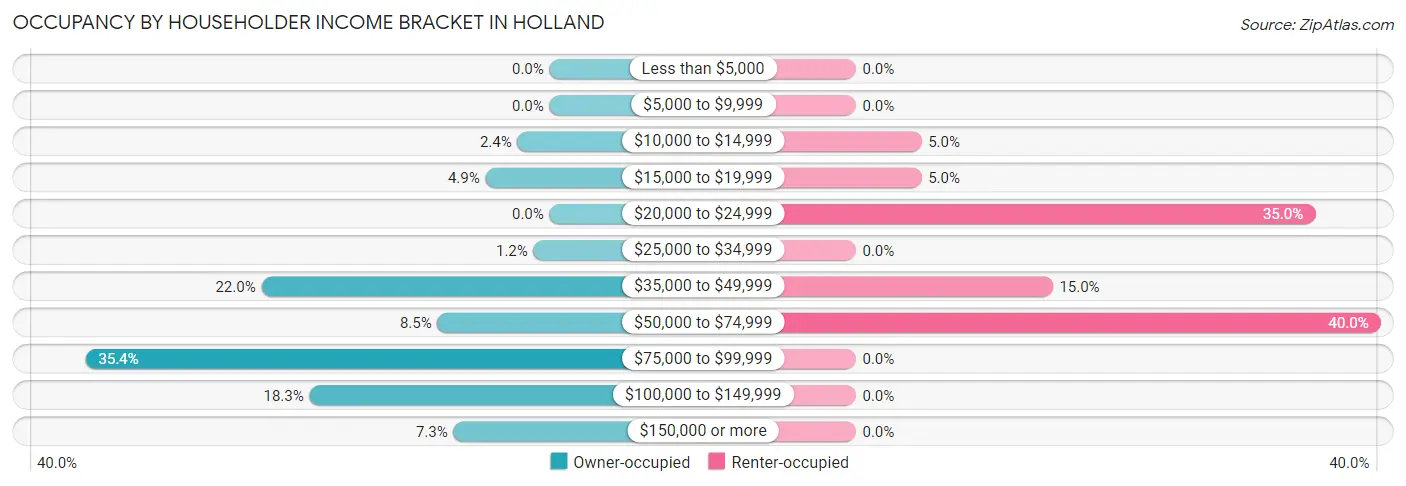
| Income Bracket | Owner-occupied | Renter-occupied |
| Less than $5,000 | 0 (0.0%) | 0 (0.0%) |
| $5,000 to $9,999 | 0 (0.0%) | 0 (0.0%) |
| $10,000 to $14,999 | 2 (2.4%) | 1 (5.0%) |
| $15,000 to $19,999 | 4 (4.9%) | 1 (5.0%) |
| $20,000 to $24,999 | 0 (0.0%) | 7 (35.0%) |
| $25,000 to $34,999 | 1 (1.2%) | 0 (0.0%) |
| $35,000 to $49,999 | 18 (22.0%) | 3 (15.0%) |
| $50,000 to $74,999 | 7 (8.5%) | 8 (40.0%) |
| $75,000 to $99,999 | 29 (35.4%) | 0 (0.0%) |
| $100,000 to $149,999 | 15 (18.3%) | 0 (0.0%) |
| $150,000 or more | 6 (7.3%) | 0 (0.0%) |
| Total | 82 (100.0%) | 20 (100.0%) |
Monthly Housing Cost Tiers in Holland
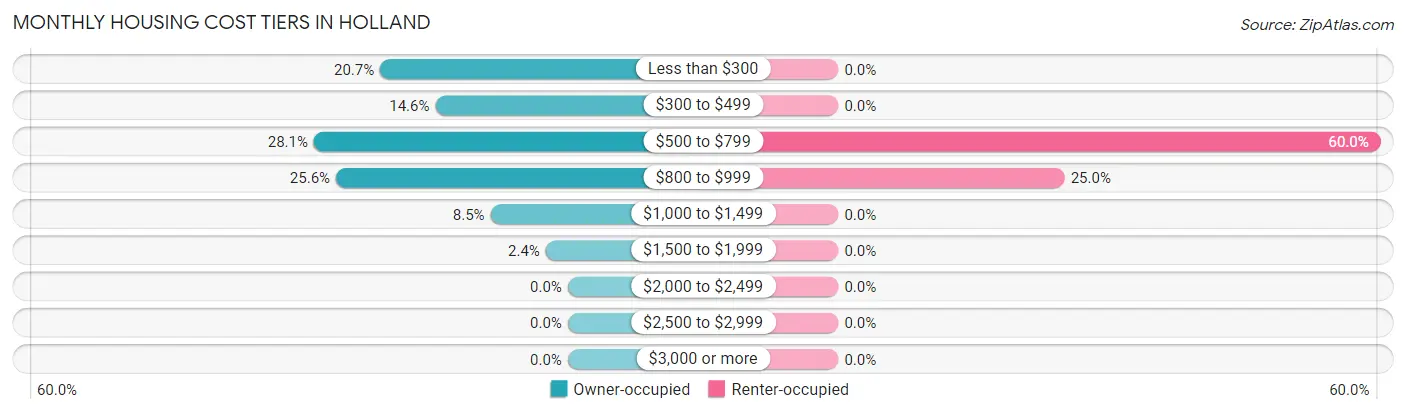
| Monthly Cost | Owner-occupied | Renter-occupied |
| Less than $300 | 17 (20.7%) | 0 (0.0%) |
| $300 to $499 | 12 (14.6%) | 0 (0.0%) |
| $500 to $799 | 23 (28.1%) | 12 (60.0%) |
| $800 to $999 | 21 (25.6%) | 5 (25.0%) |
| $1,000 to $1,499 | 7 (8.5%) | 0 (0.0%) |
| $1,500 to $1,999 | 2 (2.4%) | 0 (0.0%) |
| $2,000 to $2,499 | 0 (0.0%) | 0 (0.0%) |
| $2,500 to $2,999 | 0 (0.0%) | 0 (0.0%) |
| $3,000 or more | 0 (0.0%) | 0 (0.0%) |
| Total | 82 (100.0%) | 20 (100.0%) |
Physical Housing Characteristics in Holland
Housing Structures in Holland
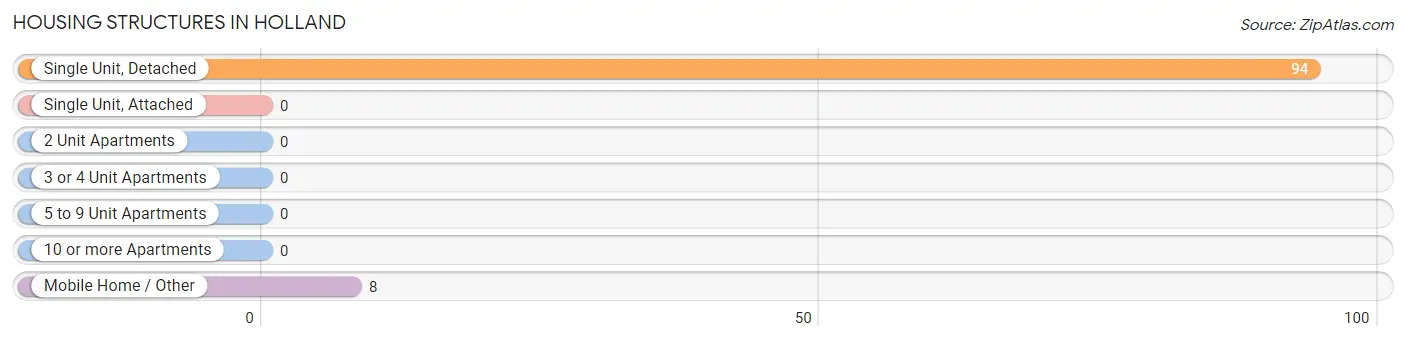
| Structure Type | # Housing Units | % Housing Units |
| Single Unit, Detached | 94 | 92.2% |
| Single Unit, Attached | 0 | 0.0% |
| 2 Unit Apartments | 0 | 0.0% |
| 3 or 4 Unit Apartments | 0 | 0.0% |
| 5 to 9 Unit Apartments | 0 | 0.0% |
| 10 or more Apartments | 0 | 0.0% |
| Mobile Home / Other | 8 | 7.8% |
| Total | 102 | 100.0% |
Housing Structures by Occupancy in Holland
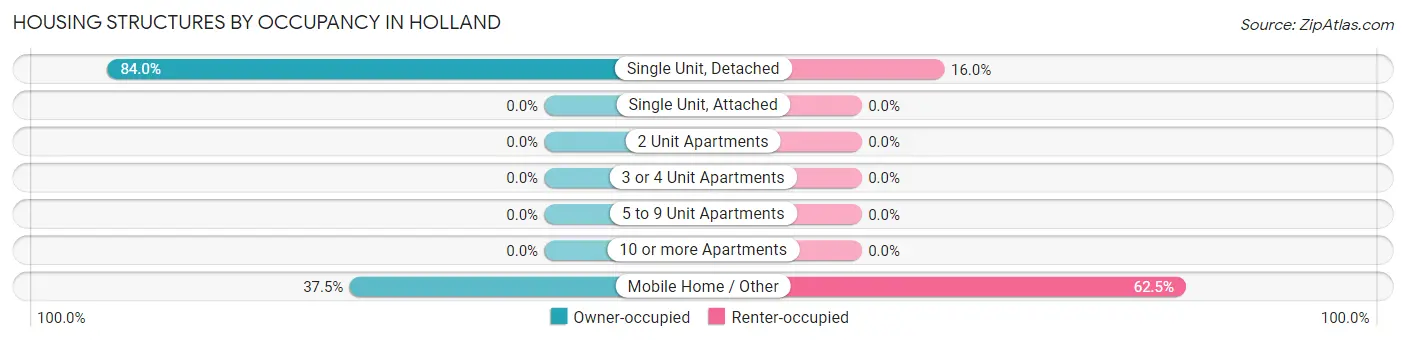
| Structure Type | Owner-occupied | Renter-occupied |
| Single Unit, Detached | 79 (84.0%) | 15 (16.0%) |
| Single Unit, Attached | 0 (0.0%) | 0 (0.0%) |
| 2 Unit Apartments | 0 (0.0%) | 0 (0.0%) |
| 3 or 4 Unit Apartments | 0 (0.0%) | 0 (0.0%) |
| 5 to 9 Unit Apartments | 0 (0.0%) | 0 (0.0%) |
| 10 or more Apartments | 0 (0.0%) | 0 (0.0%) |
| Mobile Home / Other | 3 (37.5%) | 5 (62.5%) |
| Total | 82 (80.4%) | 20 (19.6%) |
Housing Structures by Number of Rooms in Holland
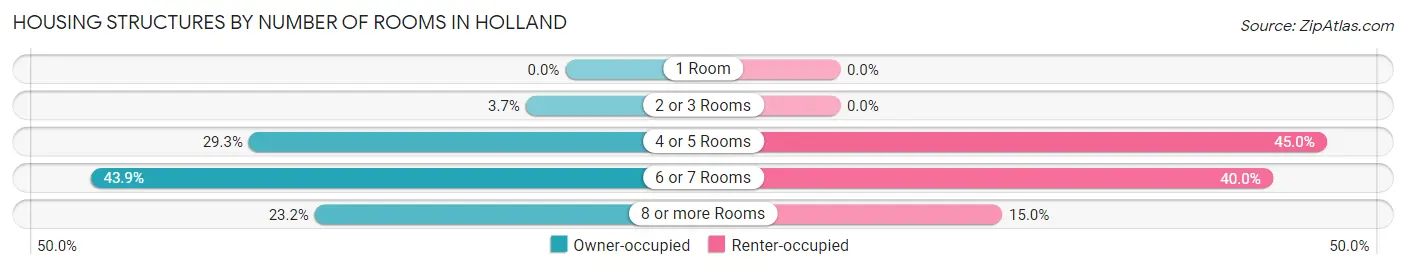
| Number of Rooms | Owner-occupied | Renter-occupied |
| 1 Room | 0 (0.0%) | 0 (0.0%) |
| 2 or 3 Rooms | 3 (3.7%) | 0 (0.0%) |
| 4 or 5 Rooms | 24 (29.3%) | 9 (45.0%) |
| 6 or 7 Rooms | 36 (43.9%) | 8 (40.0%) |
| 8 or more Rooms | 19 (23.2%) | 3 (15.0%) |
| Total | 82 (100.0%) | 20 (100.0%) |
Housing Structure by Heating Type in Holland
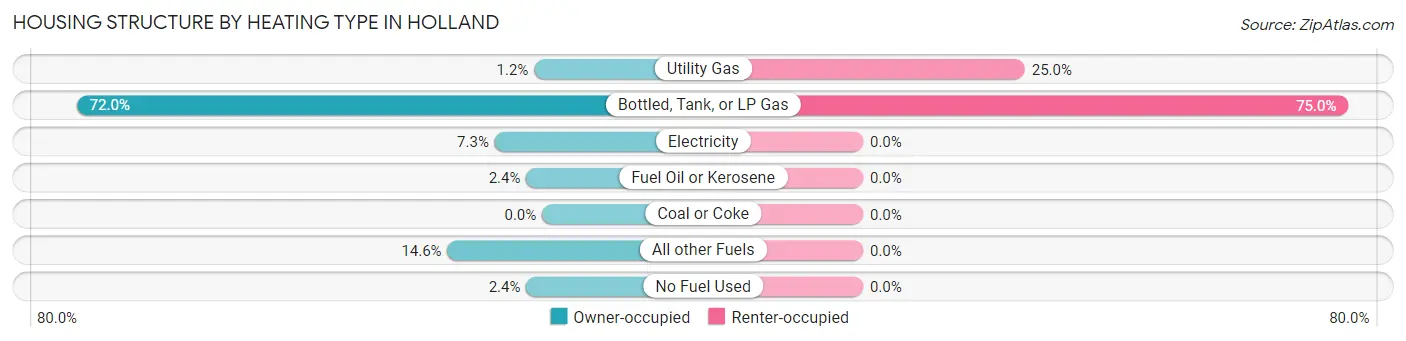
| Heating Type | Owner-occupied | Renter-occupied |
| Utility Gas | 1 (1.2%) | 5 (25.0%) |
| Bottled, Tank, or LP Gas | 59 (72.0%) | 15 (75.0%) |
| Electricity | 6 (7.3%) | 0 (0.0%) |
| Fuel Oil or Kerosene | 2 (2.4%) | 0 (0.0%) |
| Coal or Coke | 0 (0.0%) | 0 (0.0%) |
| All other Fuels | 12 (14.6%) | 0 (0.0%) |
| No Fuel Used | 2 (2.4%) | 0 (0.0%) |
| Total | 82 (100.0%) | 20 (100.0%) |
Household Vehicle Usage in Holland
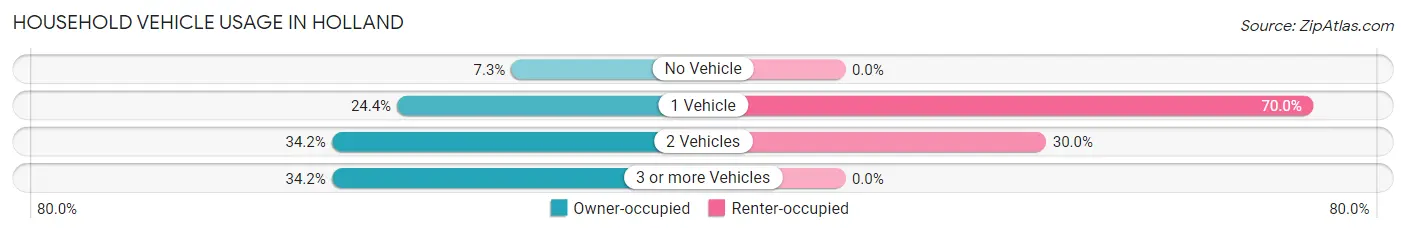
| Vehicles per Household | Owner-occupied | Renter-occupied |
| No Vehicle | 6 (7.3%) | 0 (0.0%) |
| 1 Vehicle | 20 (24.4%) | 14 (70.0%) |
| 2 Vehicles | 28 (34.2%) | 6 (30.0%) |
| 3 or more Vehicles | 28 (34.2%) | 0 (0.0%) |
| Total | 82 (100.0%) | 20 (100.0%) |
Real Estate & Mortgages in Holland
Real Estate and Mortgage Overview in Holland
| Characteristic | Without Mortgage | With Mortgage |
| Housing Units | 43 | 39 |
| Median Property Value | $65,000 | $51,700 |
| Median Household Income | $78,906 | $2 |
| Monthly Housing Costs | $338 | $0 |
| Real Estate Taxes | $531 | $0 |
Property Value by Mortgage Status in Holland
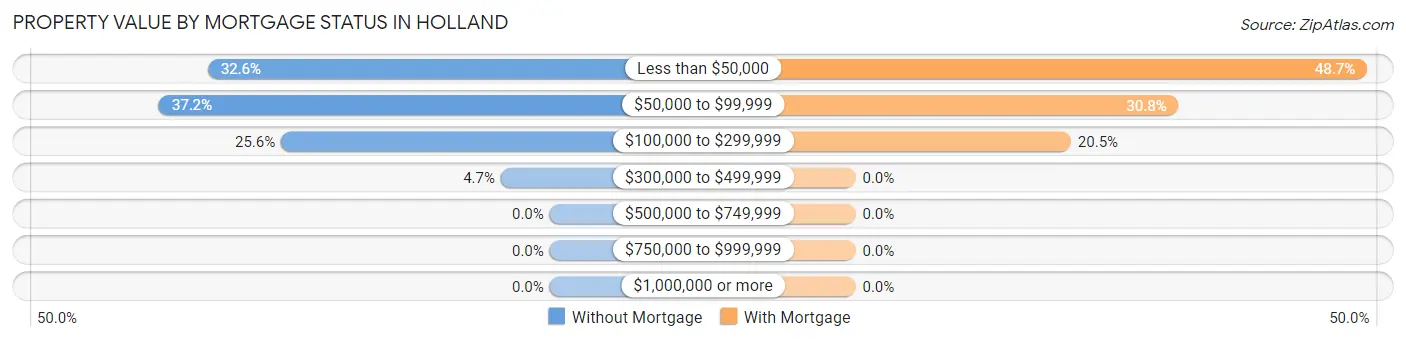
| Property Value | Without Mortgage | With Mortgage |
| Less than $50,000 | 14 (32.6%) | 19 (48.7%) |
| $50,000 to $99,999 | 16 (37.2%) | 12 (30.8%) |
| $100,000 to $299,999 | 11 (25.6%) | 8 (20.5%) |
| $300,000 to $499,999 | 2 (4.6%) | 0 (0.0%) |
| $500,000 to $749,999 | 0 (0.0%) | 0 (0.0%) |
| $750,000 to $999,999 | 0 (0.0%) | 0 (0.0%) |
| $1,000,000 or more | 0 (0.0%) | 0 (0.0%) |
| Total | 43 (100.0%) | 39 (100.0%) |
Household Income by Mortgage Status in Holland
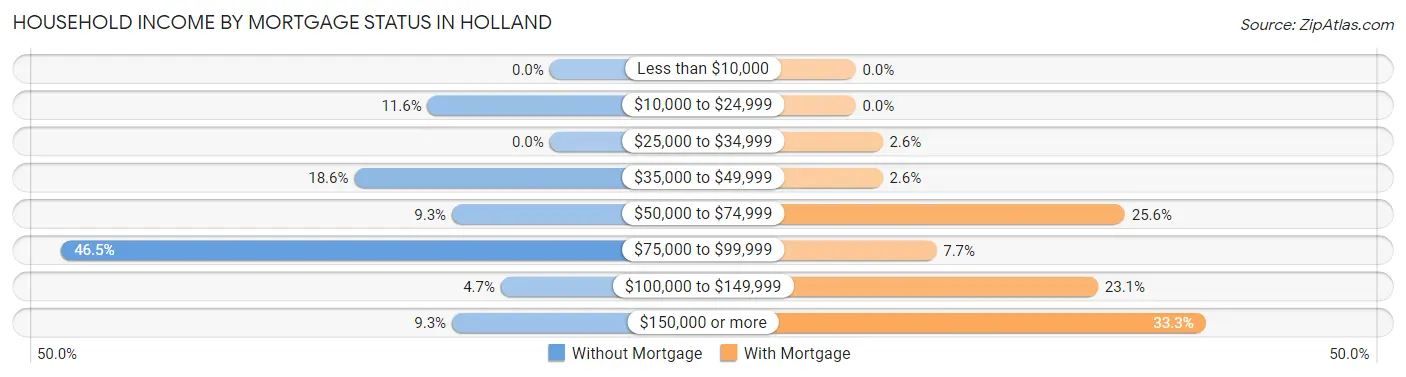
| Household Income | Without Mortgage | With Mortgage |
| Less than $10,000 | 0 (0.0%) | 0 (0.0%) |
| $10,000 to $24,999 | 5 (11.6%) | 0 (0.0%) |
| $25,000 to $34,999 | 0 (0.0%) | 1 (2.6%) |
| $35,000 to $49,999 | 8 (18.6%) | 1 (2.6%) |
| $50,000 to $74,999 | 4 (9.3%) | 10 (25.6%) |
| $75,000 to $99,999 | 20 (46.5%) | 3 (7.7%) |
| $100,000 to $149,999 | 2 (4.6%) | 9 (23.1%) |
| $150,000 or more | 4 (9.3%) | 13 (33.3%) |
| Total | 43 (100.0%) | 39 (100.0%) |
Property Value to Household Income Ratio in Holland
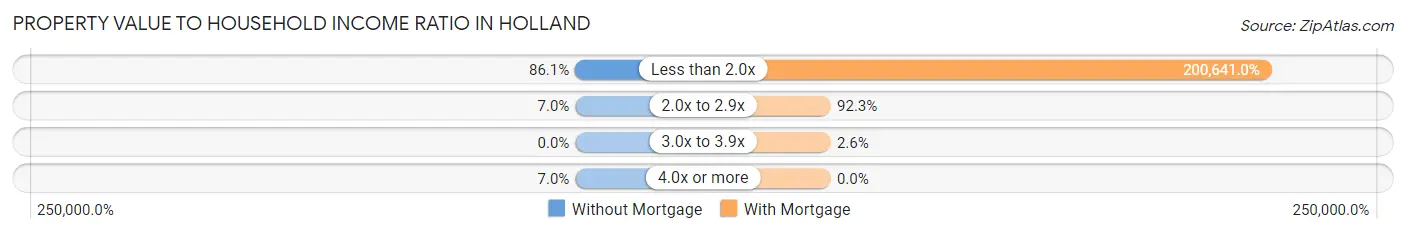
| Value-to-Income Ratio | Without Mortgage | With Mortgage |
| Less than 2.0x | 37 (86.1%) | 78,250 (200,641.0%) |
| 2.0x to 2.9x | 3 (7.0%) | 36 (92.3%) |
| 3.0x to 3.9x | 0 (0.0%) | 1 (2.6%) |
| 4.0x or more | 3 (7.0%) | 0 (0.0%) |
| Total | 43 (100.0%) | 39 (100.0%) |
Real Estate Taxes by Mortgage Status in Holland
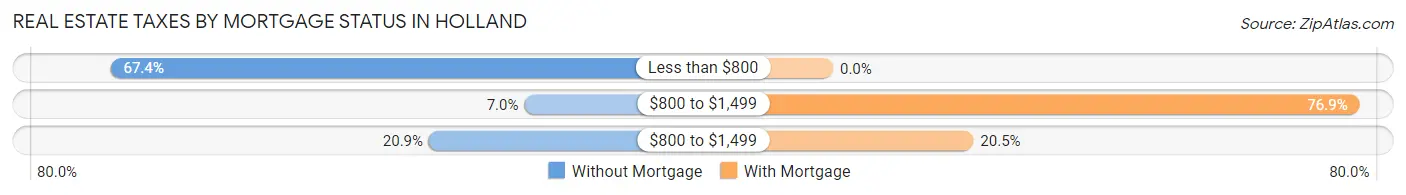
| Property Taxes | Without Mortgage | With Mortgage |
| Less than $800 | 29 (67.4%) | 0 (0.0%) |
| $800 to $1,499 | 3 (7.0%) | 30 (76.9%) |
| $800 to $1,499 | 9 (20.9%) | 8 (20.5%) |
| Total | 43 (100.0%) | 39 (100.0%) |
Health & Disability in Holland
Health Insurance Coverage by Age in Holland
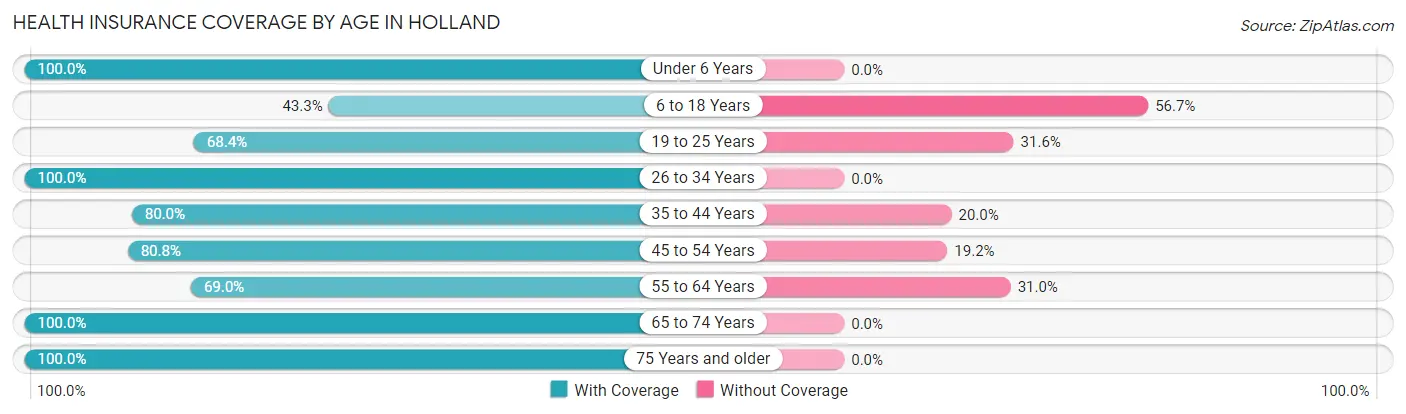
| Age Bracket | With Coverage | Without Coverage |
| Under 6 Years | 58 (100.0%) | 0 (0.0%) |
| 6 to 18 Years | 13 (43.3%) | 17 (56.7%) |
| 19 to 25 Years | 13 (68.4%) | 6 (31.6%) |
| 26 to 34 Years | 39 (100.0%) | 0 (0.0%) |
| 35 to 44 Years | 36 (80.0%) | 9 (20.0%) |
| 45 to 54 Years | 21 (80.8%) | 5 (19.2%) |
| 55 to 64 Years | 20 (69.0%) | 9 (31.0%) |
| 65 to 74 Years | 20 (100.0%) | 0 (0.0%) |
| 75 Years and older | 11 (100.0%) | 0 (0.0%) |
| Total | 231 (83.4%) | 46 (16.6%) |
Health Insurance Coverage by Citizenship Status in Holland
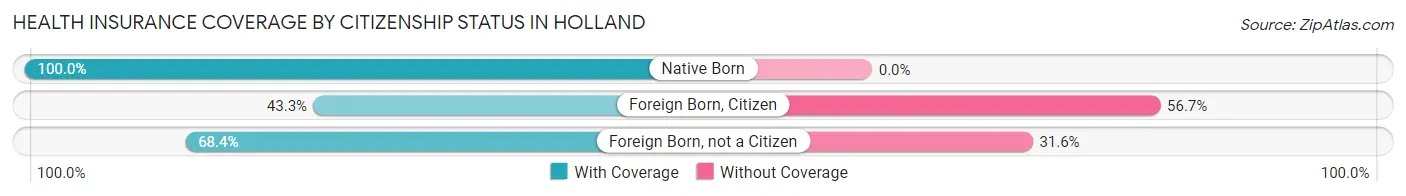
| Citizenship Status | With Coverage | Without Coverage |
| Native Born | 58 (100.0%) | 0 (0.0%) |
| Foreign Born, Citizen | 13 (43.3%) | 17 (56.7%) |
| Foreign Born, not a Citizen | 13 (68.4%) | 6 (31.6%) |
Health Insurance Coverage by Household Income in Holland
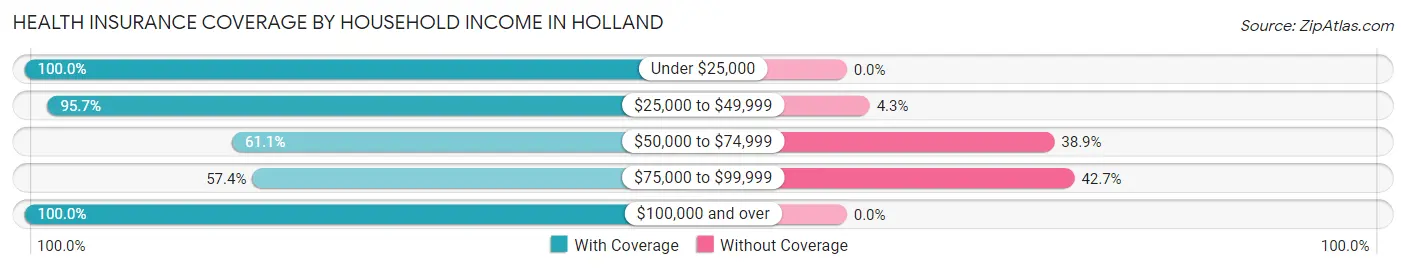
| Household Income | With Coverage | Without Coverage |
| Under $25,000 | 46 (100.0%) | 0 (0.0%) |
| $25,000 to $49,999 | 67 (95.7%) | 3 (4.3%) |
| $50,000 to $74,999 | 22 (61.1%) | 14 (38.9%) |
| $75,000 to $99,999 | 39 (57.4%) | 29 (42.6%) |
| $100,000 and over | 57 (100.0%) | 0 (0.0%) |
Public vs Private Health Insurance Coverage by Age in Holland
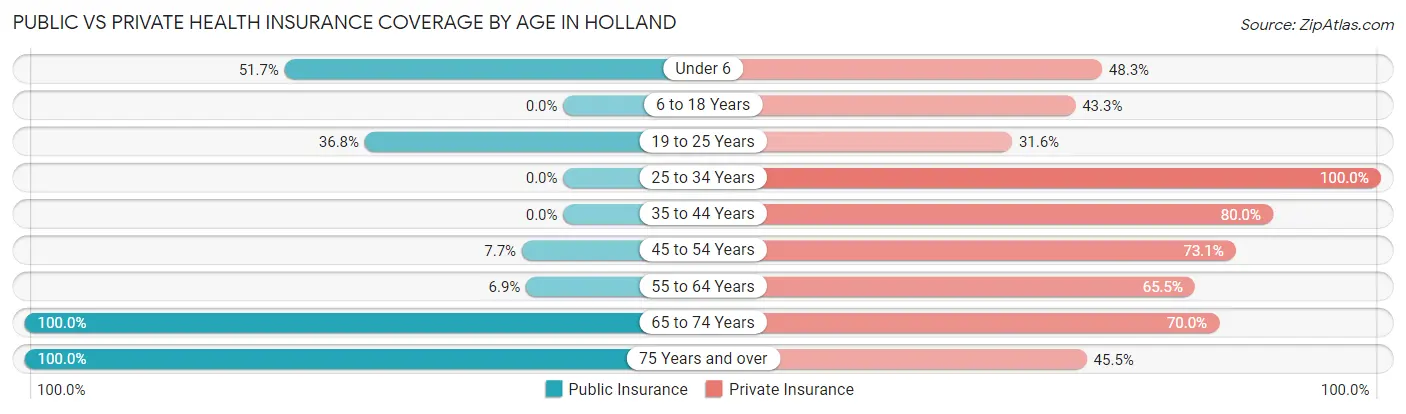
| Age Bracket | Public Insurance | Private Insurance |
| Under 6 | 30 (51.7%) | 28 (48.3%) |
| 6 to 18 Years | 0 (0.0%) | 13 (43.3%) |
| 19 to 25 Years | 7 (36.8%) | 6 (31.6%) |
| 25 to 34 Years | 0 (0.0%) | 39 (100.0%) |
| 35 to 44 Years | 0 (0.0%) | 36 (80.0%) |
| 45 to 54 Years | 2 (7.7%) | 19 (73.1%) |
| 55 to 64 Years | 2 (6.9%) | 19 (65.5%) |
| 65 to 74 Years | 20 (100.0%) | 14 (70.0%) |
| 75 Years and over | 11 (100.0%) | 5 (45.5%) |
| Total | 72 (26.0%) | 179 (64.6%) |
Disability Status by Sex by Age in Holland
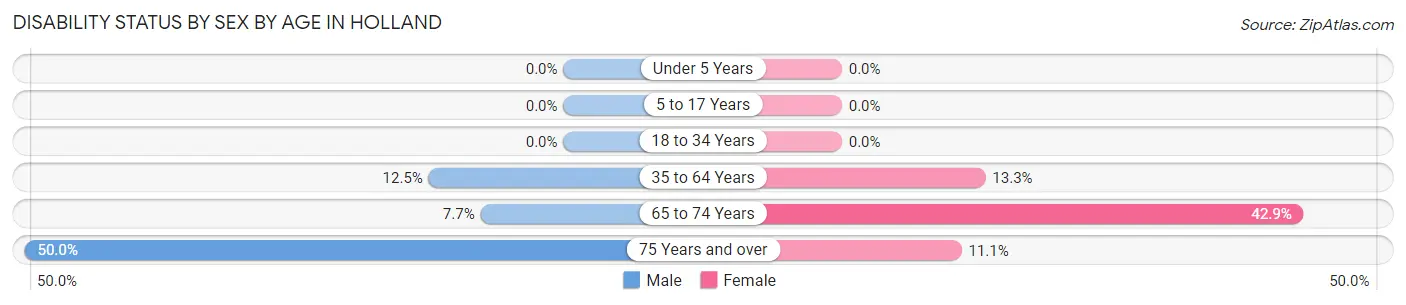
| Age Bracket | Male | Female |
| Under 5 Years | 0 (0.0%) | 0 (0.0%) |
| 5 to 17 Years | 0 (0.0%) | 0 (0.0%) |
| 18 to 34 Years | 0 (0.0%) | 0 (0.0%) |
| 35 to 64 Years | 5 (12.5%) | 8 (13.3%) |
| 65 to 74 Years | 1 (7.7%) | 3 (42.9%) |
| 75 Years and over | 1 (50.0%) | 1 (11.1%) |
Disability Class by Sex by Age in Holland
Disability Class: Hearing Difficulty
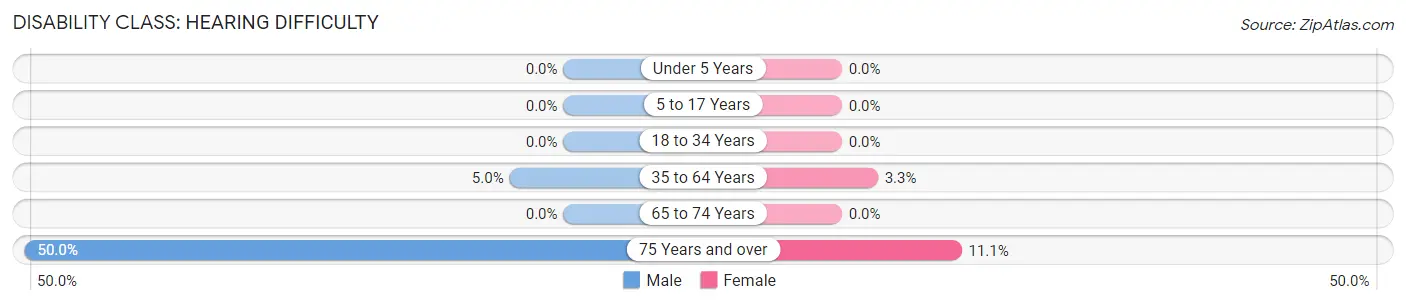
| Age Bracket | Male | Female |
| Under 5 Years | 0 (0.0%) | 0 (0.0%) |
| 5 to 17 Years | 0 (0.0%) | 0 (0.0%) |
| 18 to 34 Years | 0 (0.0%) | 0 (0.0%) |
| 35 to 64 Years | 2 (5.0%) | 2 (3.3%) |
| 65 to 74 Years | 0 (0.0%) | 0 (0.0%) |
| 75 Years and over | 1 (50.0%) | 1 (11.1%) |
Disability Class: Vision Difficulty
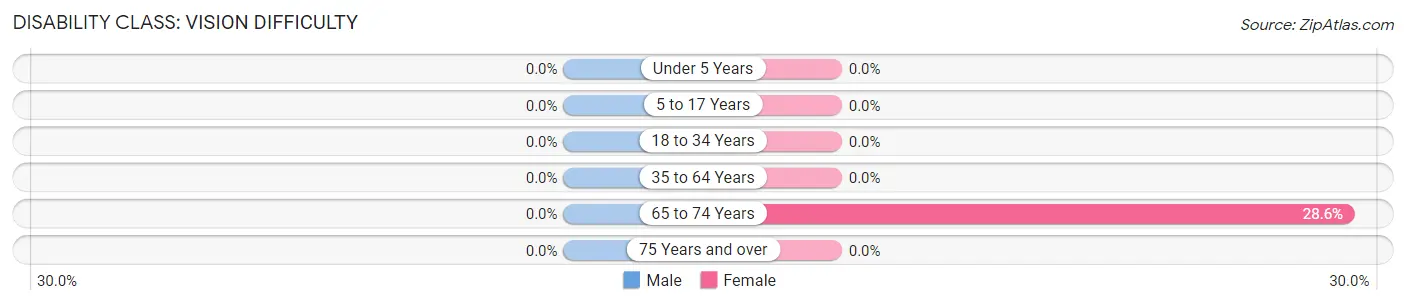
| Age Bracket | Male | Female |
| Under 5 Years | 0 (0.0%) | 0 (0.0%) |
| 5 to 17 Years | 0 (0.0%) | 0 (0.0%) |
| 18 to 34 Years | 0 (0.0%) | 0 (0.0%) |
| 35 to 64 Years | 0 (0.0%) | 0 (0.0%) |
| 65 to 74 Years | 0 (0.0%) | 2 (28.6%) |
| 75 Years and over | 0 (0.0%) | 0 (0.0%) |
Disability Class: Cognitive Difficulty
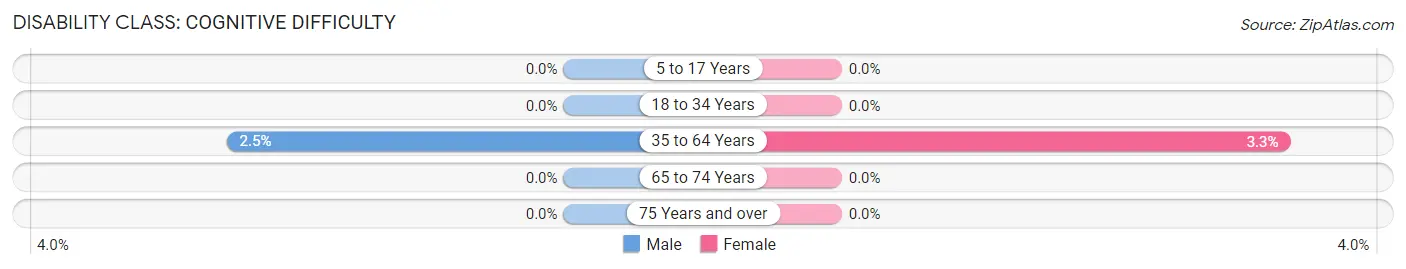
| Age Bracket | Male | Female |
| 5 to 17 Years | 0 (0.0%) | 0 (0.0%) |
| 18 to 34 Years | 0 (0.0%) | 0 (0.0%) |
| 35 to 64 Years | 1 (2.5%) | 2 (3.3%) |
| 65 to 74 Years | 0 (0.0%) | 0 (0.0%) |
| 75 Years and over | 0 (0.0%) | 0 (0.0%) |
Disability Class: Ambulatory Difficulty

| Age Bracket | Male | Female |
| 5 to 17 Years | 0 (0.0%) | 0 (0.0%) |
| 18 to 34 Years | 0 (0.0%) | 0 (0.0%) |
| 35 to 64 Years | 2 (5.0%) | 1 (1.7%) |
| 65 to 74 Years | 1 (7.7%) | 1 (14.3%) |
| 75 Years and over | 0 (0.0%) | 1 (11.1%) |
Disability Class: Self-Care Difficulty
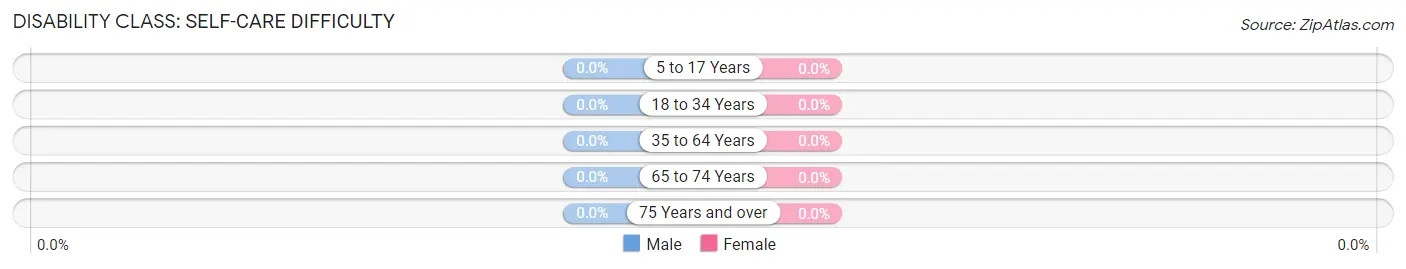
| Age Bracket | Male | Female |
| 5 to 17 Years | 0 (0.0%) | 0 (0.0%) |
| 18 to 34 Years | 0 (0.0%) | 0 (0.0%) |
| 35 to 64 Years | 0 (0.0%) | 0 (0.0%) |
| 65 to 74 Years | 0 (0.0%) | 0 (0.0%) |
| 75 Years and over | 0 (0.0%) | 0 (0.0%) |
Technology Access in Holland
Computing Device Access in Holland
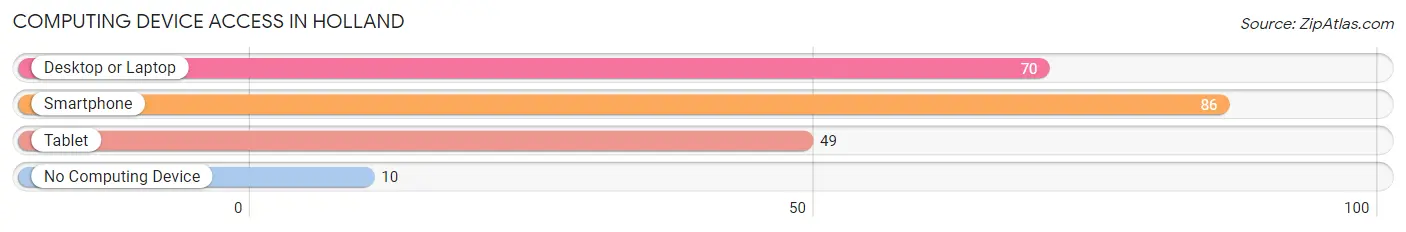
| Device Type | # Households | % Households |
| Desktop or Laptop | 70 | 68.6% |
| Smartphone | 86 | 84.3% |
| Tablet | 49 | 48.0% |
| No Computing Device | 10 | 9.8% |
| Total | 102 | 100.0% |
Internet Access in Holland
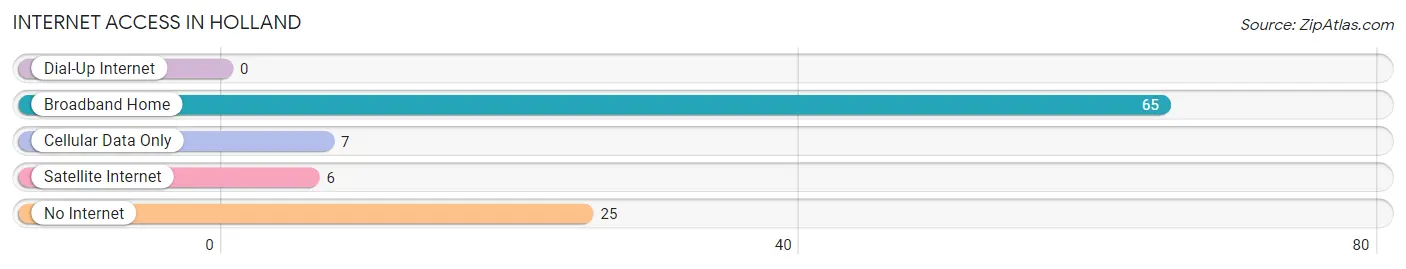
| Internet Type | # Households | % Households |
| Dial-Up Internet | 0 | 0.0% |
| Broadband Home | 65 | 63.7% |
| Cellular Data Only | 7 | 6.9% |
| Satellite Internet | 6 | 5.9% |
| No Internet | 25 | 24.5% |
| Total | 102 | 100.0% |
Holland Summary
Holland, Minnesota is a small city located in the southeastern corner of the state, near the border with Wisconsin. It is part of the Twin Cities metropolitan area and is home to a population of just over 1,000 people. The city is known for its rural charm and its proximity to the St. Croix River.
Geography
Holland is located in Washington County, Minnesota, in the southeastern corner of the state. It is situated on the banks of the St. Croix River, which forms the border between Minnesota and Wisconsin. The city is surrounded by rolling hills and farmland, and is located about 25 miles northeast of the Twin Cities.
The city has a total area of 0.9 square miles, all of which is land. The terrain is mostly flat, with some rolling hills in the surrounding area. The climate is humid continental, with cold winters and warm summers.
History
Holland was founded in 1854 by Dutch settlers who had come to the area from the Netherlands. The city was named after the Dutch province of Holland, and the settlers brought with them their Dutch culture and traditions. The city was incorporated in 1858, and the first mayor was elected in 1859.
In the late 19th century, the city was a major center for the lumber industry, and the St. Croix River was used to transport logs to the Twin Cities. The city also had a thriving agricultural industry, and was home to several dairy farms.
Economy
Today, the economy of Holland is largely based on agriculture and tourism. The city is home to several dairy farms, as well as a number of small businesses. The city is also a popular destination for tourists, who come to enjoy the rural charm and the nearby St. Croix River.
Demographics
As of the 2010 census, the population of Holland was 1,072. The racial makeup of the city was 97.2% White, 0.7% African American, 0.3% Native American, 0.2% Asian, 0.1% Pacific Islander, 0.7% from other races, and 0.9% from two or more races. Hispanic or Latino of any race were 1.7% of the population.
The median household income in Holland was $50,938, and the median family income was $60,000. The per capita income was $25,938. About 8.2% of families and 10.2% of the population were below the poverty line, including 14.3% of those under age 18 and 6.2% of those age 65 or over.
Conclusion
Holland, Minnesota is a small city located in the southeastern corner of the state, near the border with Wisconsin. It is part of the Twin Cities metropolitan area and is home to a population of just over 1,000 people. The city is known for its rural charm and its proximity to the St. Croix River. The economy of Holland is largely based on agriculture and tourism, and the city is a popular destination for tourists who come to enjoy the rural charm and the nearby St. Croix River. The population of Holland is mostly White, with a small percentage of African American, Native American, Asian, and Pacific Islander residents. The median household income in Holland is $50,938, and the median family income is $60,000.
Common Questions
What is Per Capita Income in Holland?
Per Capita income in Holland is $27,366.
What is the Median Family Income in Holland?
Median Family Income in Holland is $78,000.
What is the Median Household income in Holland?
Median Household Income in Holland is $74,167.
What is Income or Wage Gap in Holland?
Income or Wage Gap in Holland is 77.5%.
Women in Holland earn 22.5 cents for every dollar earned by a man.
What is Inequality or Gini Index in Holland?
Inequality or Gini Index in Holland is 0.32.
What is the Total Population of Holland?
Total Population of Holland is 277.
What is the Total Male Population of Holland?
Total Male Population of Holland is 114.
What is the Total Female Population of Holland?
Total Female Population of Holland is 163.
What is the Ratio of Males per 100 Females in Holland?
There are 69.94 Males per 100 Females in Holland.
What is the Ratio of Females per 100 Males in Holland?
There are 142.98 Females per 100 Males in Holland.
What is the Median Population Age in Holland?
Median Population Age in Holland is 34.1 Years.
What is the Average Family Size in Holland
Average Family Size in Holland is 3.5 People.
What is the Average Household Size in Holland
Average Household Size in Holland is 2.7 People.
How Large is the Labor Force in Holland?
There are 148 People in the Labor Forcein in Holland.
What is the Percentage of People in the Labor Force in Holland?
75.1% of People are in the Labor Force in Holland.