Crookston, MN Map & Demographics
Crookston Map
Crookston Overview
$31,017
PER CAPITA INCOME
$76,392
AVG FAMILY INCOME
$52,557
AVG HOUSEHOLD INCOME
42.3%
WAGE / INCOME GAP [ % ]
57.7¢/ $1
WAGE / INCOME GAP [ $ ]
0.42
INEQUALITY / GINI INDEX
7,472
TOTAL POPULATION
3,682
MALE POPULATION
3,790
FEMALE POPULATION
97.15
MALES / 100 FEMALES
102.93
FEMALES / 100 MALES
39.4
MEDIAN AGE
2.8
AVG FAMILY SIZE
2.0
AVG HOUSEHOLD SIZE
3,825
LABOR FORCE [ PEOPLE ]
61.0%
PERCENT IN LABOR FORCE
3.5%
UNEMPLOYMENT RATE
Crookston Zip Codes
Crookston Area Codes
Income in Crookston
Income Overview in Crookston
Per Capita Income in Crookston is $31,017, while median incomes of families and households are $76,392 and $52,557 respectively.
| Characteristic | Number | Measure |
| Per Capita Income | 7,472 | $31,017 |
| Median Family Income | 1,771 | $76,392 |
| Mean Family Income | 1,771 | $89,249 |
| Median Household Income | 3,321 | $52,557 |
| Mean Household Income | 3,321 | $66,284 |
| Income Deficit | 1,771 | $0 |
| Wage / Income Gap (%) | 7,472 | 42.27% |
| Wage / Income Gap ($) | 7,472 | 57.73¢ per $1 |
| Gini / Inequality Index | 7,472 | 0.42 |
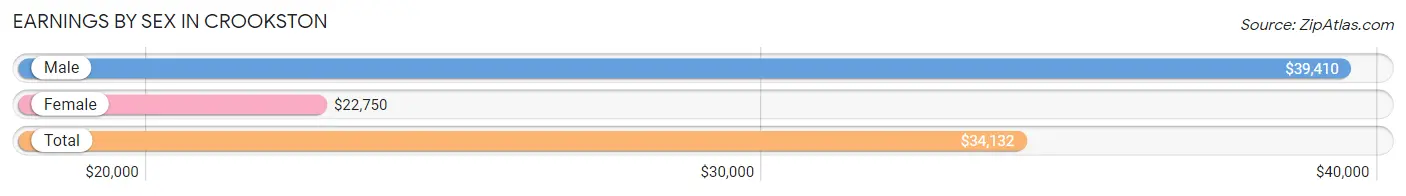
Earnings by Sex in Crookston
Average Earnings in Crookston are $34,132, $39,410 for men and $22,750 for women, a difference of 42.3%.
| Sex | Number | Average Earnings |
| Male | 2,378 (56.1%) | $39,410 |
| Female | 1,864 (43.9%) | $22,750 |
| Total | 4,242 (100.0%) | $34,132 |
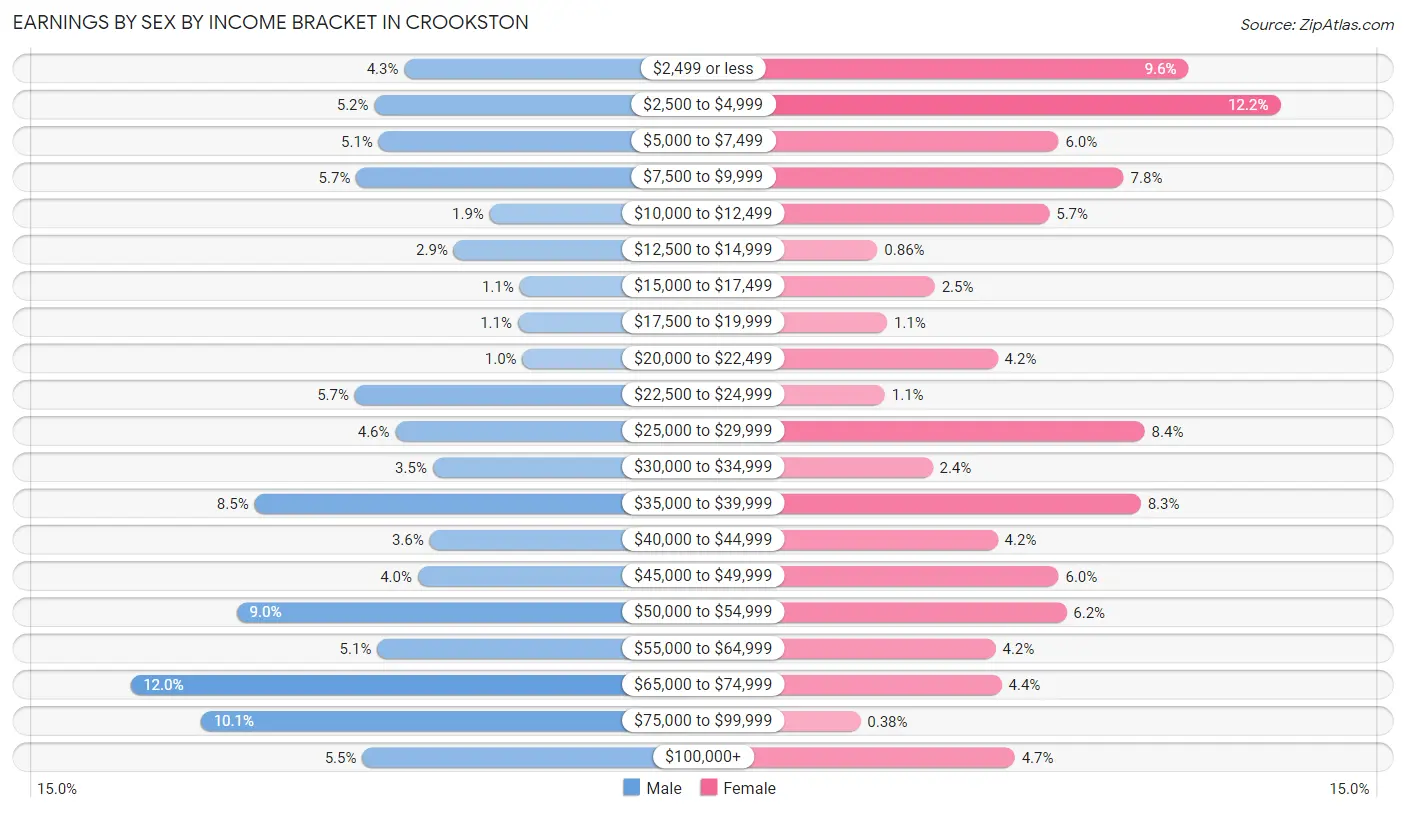
Earnings by Sex by Income Bracket in Crookston
The most common earnings brackets in Crookston are $65,000 to $74,999 for men (286 | 12.0%) and $2,500 to $4,999 for women (227 | 12.2%).
| Income | Male | Female |
| $2,499 or less | 103 (4.3%) | 179 (9.6%) |
| $2,500 to $4,999 | 123 (5.2%) | 227 (12.2%) |
| $5,000 to $7,499 | 120 (5.1%) | 111 (5.9%) |
| $7,500 to $9,999 | 135 (5.7%) | 145 (7.8%) |
| $10,000 to $12,499 | 46 (1.9%) | 106 (5.7%) |
| $12,500 to $14,999 | 70 (2.9%) | 16 (0.9%) |
| $15,000 to $17,499 | 26 (1.1%) | 46 (2.5%) |
| $17,500 to $19,999 | 27 (1.1%) | 21 (1.1%) |
| $20,000 to $22,499 | 24 (1.0%) | 79 (4.2%) |
| $22,500 to $24,999 | 136 (5.7%) | 20 (1.1%) |
| $25,000 to $29,999 | 109 (4.6%) | 156 (8.4%) |
| $30,000 to $34,999 | 84 (3.5%) | 45 (2.4%) |
| $35,000 to $39,999 | 203 (8.5%) | 154 (8.3%) |
| $40,000 to $44,999 | 86 (3.6%) | 79 (4.2%) |
| $45,000 to $49,999 | 94 (4.0%) | 111 (5.9%) |
| $50,000 to $54,999 | 215 (9.0%) | 115 (6.2%) |
| $55,000 to $64,999 | 121 (5.1%) | 78 (4.2%) |
| $65,000 to $74,999 | 286 (12.0%) | 81 (4.3%) |
| $75,000 to $99,999 | 239 (10.1%) | 7 (0.4%) |
| $100,000+ | 131 (5.5%) | 88 (4.7%) |
| Total | 2,378 (100.0%) | 1,864 (100.0%) |
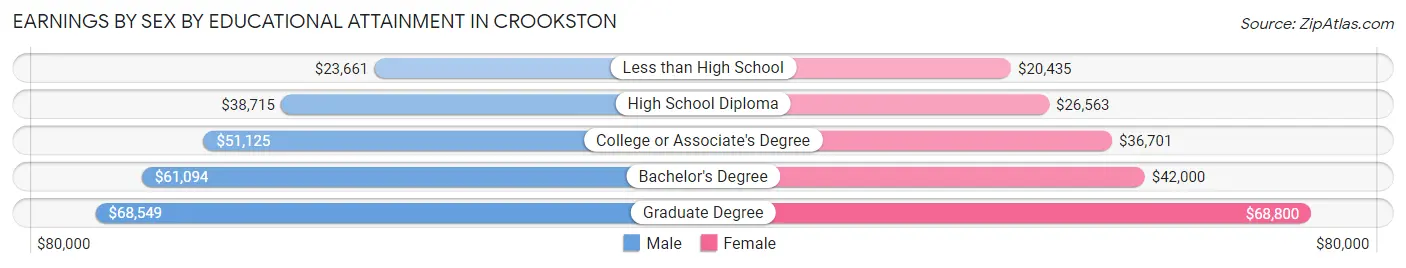
Earnings by Sex by Educational Attainment in Crookston
Average earnings in Crookston are $51,522 for men and $29,409 for women, a difference of 42.9%. Men with an educational attainment of graduate degree enjoy the highest average annual earnings of $68,549, while those with less than high school education earn the least with $23,661. Women with an educational attainment of graduate degree earn the most with the average annual earnings of $68,800, while those with less than high school education have the smallest earnings of $20,435.
| Educational Attainment | Male Income | Female Income |
| Less than High School | $23,661 | $20,435 |
| High School Diploma | $38,715 | $26,563 |
| College or Associate's Degree | $51,125 | $36,701 |
| Bachelor's Degree | $61,094 | $42,000 |
| Graduate Degree | $68,549 | $68,800 |
| Total | $51,522 | $29,409 |
Family Income in Crookston
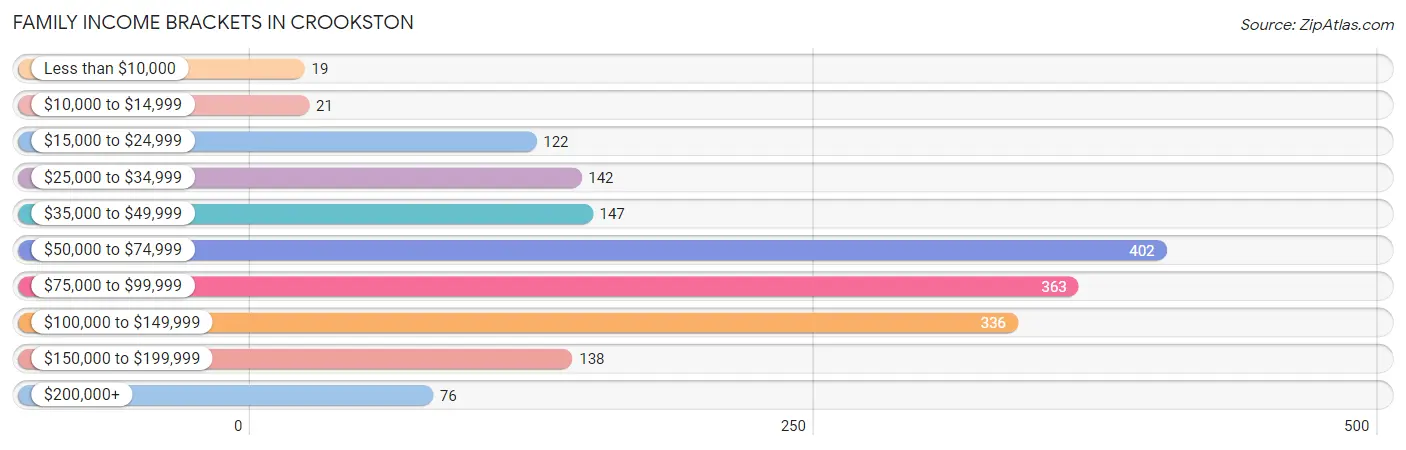
Family Income Brackets in Crookston
According to the Crookston family income data, there are 402 families falling into the $50,000 to $74,999 income range, which is the most common income bracket and makes up 22.7% of all families. Conversely, the less than $10,000 income bracket is the least frequent group with only 19 families (1.1%) belonging to this category.
| Income Bracket | # Families | % Families |
| Less than $10,000 | 19 | 1.1% |
| $10,000 to $14,999 | 21 | 1.2% |
| $15,000 to $24,999 | 122 | 6.9% |
| $25,000 to $34,999 | 142 | 8.0% |
| $35,000 to $49,999 | 147 | 8.3% |
| $50,000 to $74,999 | 402 | 22.7% |
| $75,000 to $99,999 | 363 | 20.5% |
| $100,000 to $149,999 | 336 | 19.0% |
| $150,000 to $199,999 | 138 | 7.8% |
| $200,000+ | 76 | 4.3% |
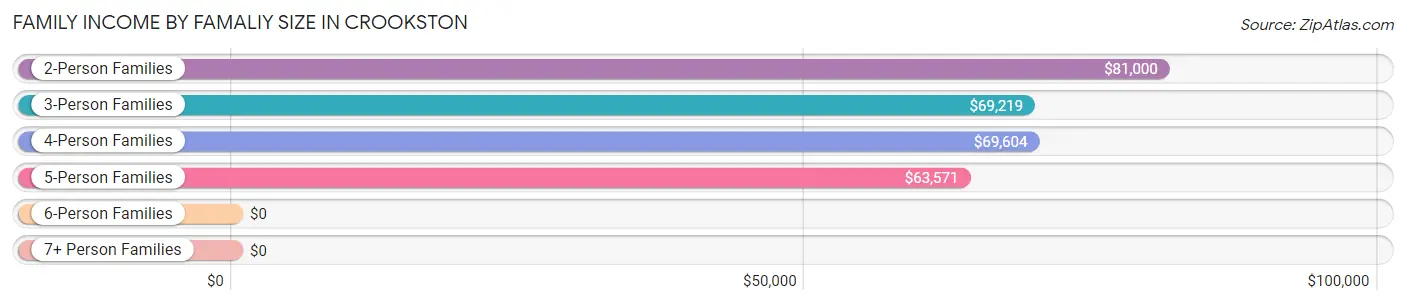
Family Income by Famaliy Size in Crookston
2-person families (942 | 53.2%) account for the highest median family income in Crookston with $81,000 per family, while 2-person families (942 | 53.2%) have the highest median income of $40,500 per family member.
| Income Bracket | # Families | Median Income |
| 2-Person Families | 942 (53.2%) | $81,000 |
| 3-Person Families | 395 (22.3%) | $69,219 |
| 4-Person Families | 219 (12.4%) | $69,604 |
| 5-Person Families | 182 (10.3%) | $63,571 |
| 6-Person Families | 33 (1.9%) | $0 |
| 7+ Person Families | 0 (0.0%) | $0 |
| Total | 1,771 (100.0%) | $76,392 |
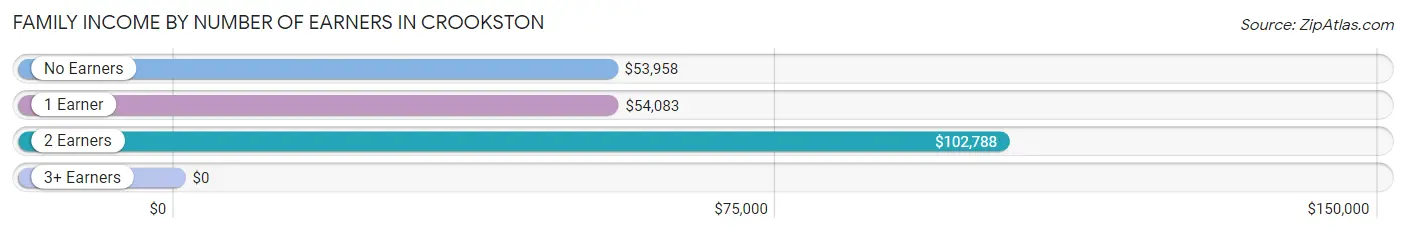
Family Income by Number of Earners in Crookston
| Number of Earners | # Families | Median Income |
| No Earners | 241 (13.6%) | $53,958 |
| 1 Earner | 657 (37.1%) | $54,083 |
| 2 Earners | 732 (41.3%) | $102,788 |
| 3+ Earners | 141 (8.0%) | $0 |
| Total | 1,771 (100.0%) | $76,392 |
Household Income in Crookston
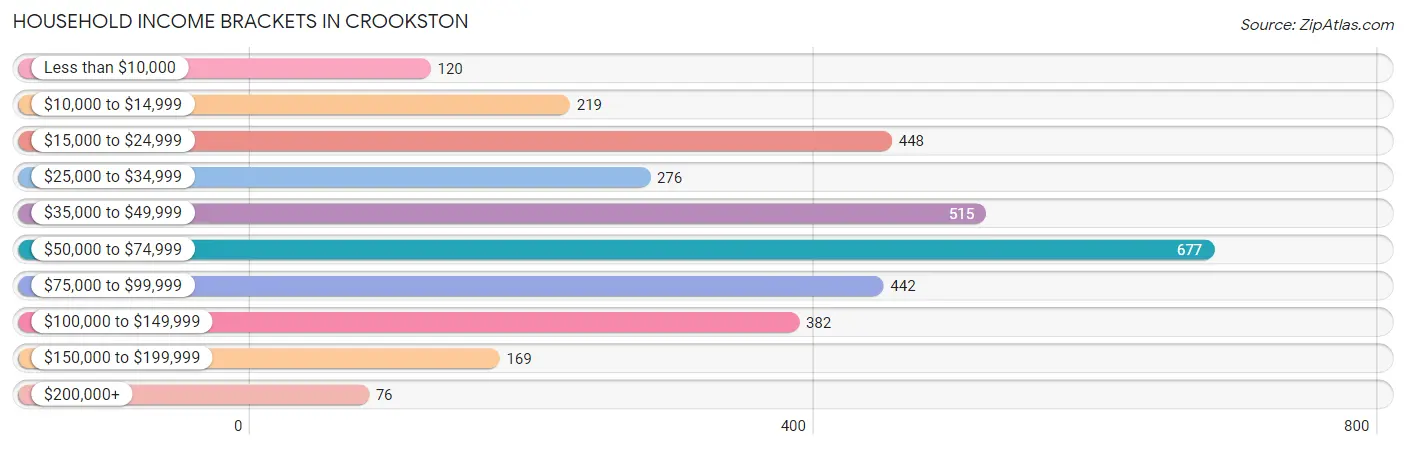
Household Income Brackets in Crookston
With 677 households falling in the category, the $50,000 to $74,999 income range is the most frequent in Crookston, accounting for 20.4% of all households. In contrast, only 76 households (2.3%) fall into the $200,000+ income bracket, making it the least populous group.
| Income Bracket | # Households | % Households |
| Less than $10,000 | 120 | 3.6% |
| $10,000 to $14,999 | 219 | 6.6% |
| $15,000 to $24,999 | 448 | 13.5% |
| $25,000 to $34,999 | 276 | 8.3% |
| $35,000 to $49,999 | 515 | 15.5% |
| $50,000 to $74,999 | 677 | 20.4% |
| $75,000 to $99,999 | 442 | 13.3% |
| $100,000 to $149,999 | 382 | 11.5% |
| $150,000 to $199,999 | 169 | 5.1% |
| $200,000+ | 76 | 2.3% |
Household Income by Householder Age in Crookston
The median household income in Crookston is $52,557, with the highest median household income of $67,935 found in the 45 to 64 years age bracket for the primary householder. A total of 980 households (29.5%) fall into this category. Meanwhile, the 15 to 24 years age bracket for the primary householder has the lowest median household income of $33,824, with 66 households (2.0%) in this group.
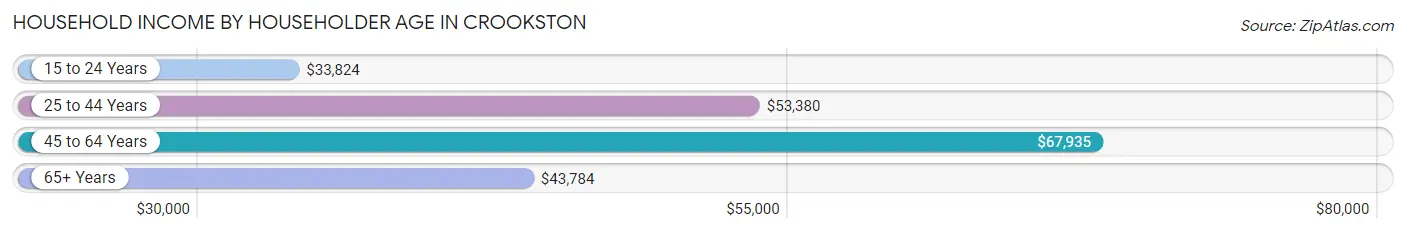
| Income Bracket | # Households | Median Income |
| 15 to 24 Years | 66 (2.0%) | $33,824 |
| 25 to 44 Years | 1,305 (39.3%) | $53,380 |
| 45 to 64 Years | 980 (29.5%) | $67,935 |
| 65+ Years | 970 (29.2%) | $43,784 |
| Total | 3,321 (100.0%) | $52,557 |
Poverty in Crookston
Income Below Poverty by Sex and Age in Crookston
With 8.9% poverty level for males and 21.5% for females among the residents of Crookston, 12 to 14 year old males and 35 to 44 year old females are the most vulnerable to poverty, with 47 males (58.8%) and 222 females (45.6%) in their respective age groups living below the poverty level.
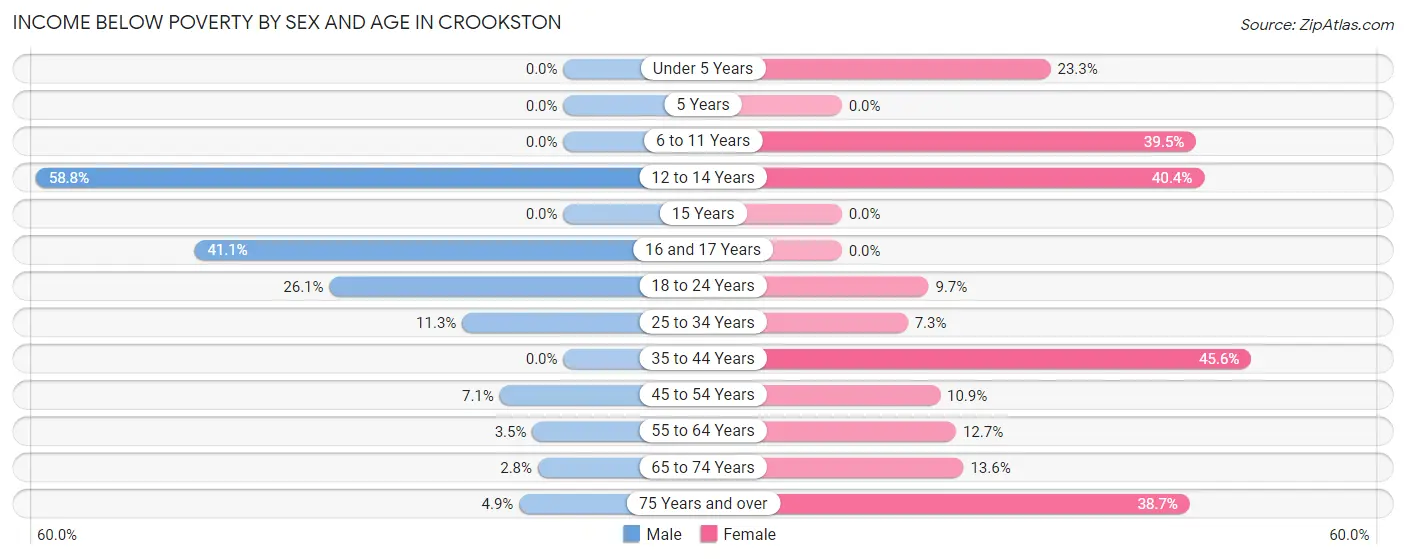
| Age Bracket | Male | Female |
| Under 5 Years | 0 (0.0%) | 53 (23.3%) |
| 5 Years | 0 (0.0%) | 0 (0.0%) |
| 6 to 11 Years | 0 (0.0%) | 73 (39.5%) |
| 12 to 14 Years | 47 (58.8%) | 46 (40.4%) |
| 15 Years | 0 (0.0%) | 0 (0.0%) |
| 16 and 17 Years | 99 (41.1%) | 0 (0.0%) |
| 18 to 24 Years | 37 (26.1%) | 14 (9.7%) |
| 25 to 34 Years | 62 (11.3%) | 39 (7.3%) |
| 35 to 44 Years | 0 (0.0%) | 222 (45.6%) |
| 45 to 54 Years | 23 (7.1%) | 43 (10.9%) |
| 55 to 64 Years | 15 (3.5%) | 59 (12.7%) |
| 65 to 74 Years | 12 (2.8%) | 63 (13.6%) |
| 75 Years and over | 9 (4.9%) | 141 (38.7%) |
| Total | 304 (8.9%) | 753 (21.5%) |
Income Above Poverty by Sex and Age in Crookston
According to the poverty statistics in Crookston, males aged under 5 years and females aged 5 years are the age groups that are most secure financially, with 100.0% of males and 100.0% of females in these age groups living above the poverty line.
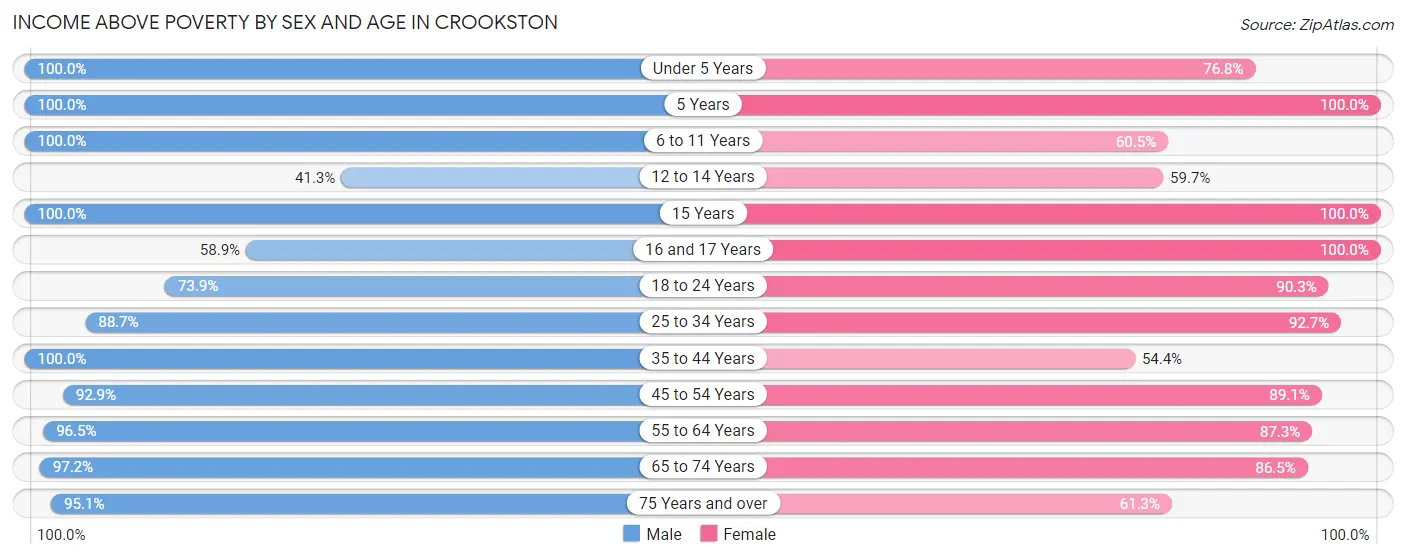
| Age Bracket | Male | Female |
| Under 5 Years | 251 (100.0%) | 175 (76.7%) |
| 5 Years | 12 (100.0%) | 39 (100.0%) |
| 6 to 11 Years | 181 (100.0%) | 112 (60.5%) |
| 12 to 14 Years | 33 (41.2%) | 68 (59.7%) |
| 15 Years | 50 (100.0%) | 35 (100.0%) |
| 16 and 17 Years | 142 (58.9%) | 53 (100.0%) |
| 18 to 24 Years | 105 (73.9%) | 131 (90.3%) |
| 25 to 34 Years | 488 (88.7%) | 492 (92.7%) |
| 35 to 44 Years | 532 (100.0%) | 265 (54.4%) |
| 45 to 54 Years | 301 (92.9%) | 350 (89.1%) |
| 55 to 64 Years | 418 (96.5%) | 405 (87.3%) |
| 65 to 74 Years | 410 (97.2%) | 402 (86.5%) |
| 75 Years and over | 174 (95.1%) | 223 (61.3%) |
| Total | 3,097 (91.1%) | 2,750 (78.5%) |
Income Below Poverty Among Married-Couple Families in Crookston
The poverty statistics for married-couple families in Crookston show that 0.5% or 7 of the total 1,290 families live below the poverty line. Families with no children have the highest poverty rate of 0.9%, comprising of 7 families. On the other hand, families with 1 or 2 children have the lowest poverty rate of 0.0%, which includes 0 families.
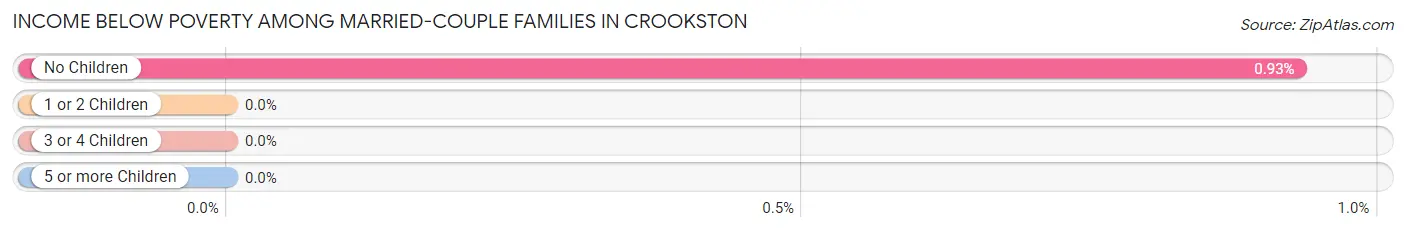
| Children | Above Poverty | Below Poverty |
| No Children | 743 (99.1%) | 7 (0.9%) |
| 1 or 2 Children | 469 (100.0%) | 0 (0.0%) |
| 3 or 4 Children | 71 (100.0%) | 0 (0.0%) |
| 5 or more Children | 0 (0.0%) | 0 (0.0%) |
| Total | 1,283 (99.5%) | 7 (0.5%) |
Income Below Poverty Among Single-Parent Households in Crookston
According to the poverty data in Crookston, 20.2% or 42 single-father households and 33.7% or 92 single-mother households are living below the poverty line. Among single-father households, those with 3 or 4 children have the highest poverty rate, with 42 households (66.7%) experiencing poverty. Likewise, among single-mother households, those with 1 or 2 children have the highest poverty rate, with 85 households (44.5%) falling below the poverty line.
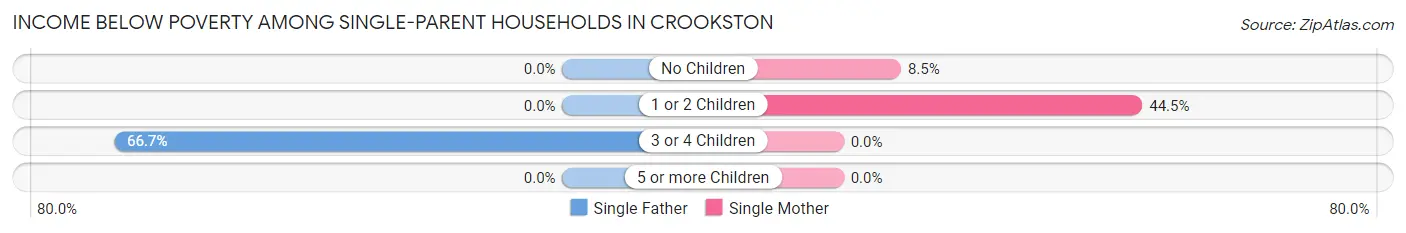
| Children | Single Father | Single Mother |
| No Children | 0 (0.0%) | 7 (8.5%) |
| 1 or 2 Children | 0 (0.0%) | 85 (44.5%) |
| 3 or 4 Children | 42 (66.7%) | 0 (0.0%) |
| 5 or more Children | 0 (0.0%) | 0 (0.0%) |
| Total | 42 (20.2%) | 92 (33.7%) |
Income Below Poverty Among Married-Couple vs Single-Parent Households in Crookston
The poverty data for Crookston shows that 7 of the married-couple family households (0.5%) and 134 of the single-parent households (27.9%) are living below the poverty level. Within the married-couple family households, those with no children have the highest poverty rate, with 7 households (0.9%) falling below the poverty line. Among the single-parent households, those with 3 or 4 children have the highest poverty rate, with 42 household (66.7%) living below poverty.
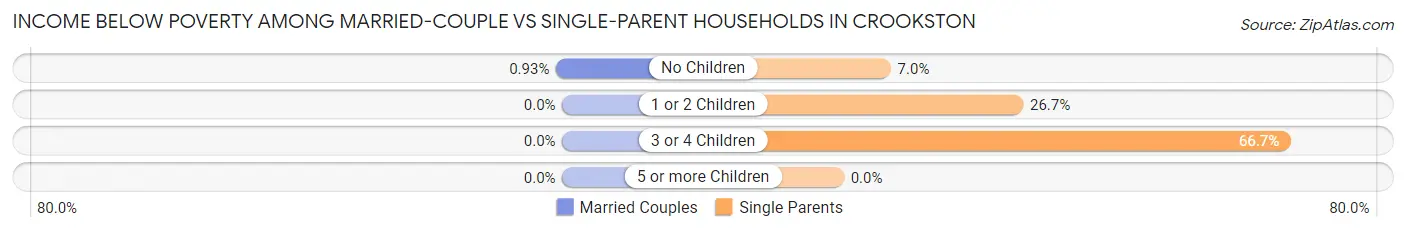
| Children | Married-Couple Families | Single-Parent Households |
| No Children | 7 (0.9%) | 7 (7.0%) |
| 1 or 2 Children | 0 (0.0%) | 85 (26.7%) |
| 3 or 4 Children | 0 (0.0%) | 42 (66.7%) |
| 5 or more Children | 0 (0.0%) | 0 (0.0%) |
| Total | 7 (0.5%) | 134 (27.9%) |
Race in Crookston
The most populous races in Crookston are White / Caucasian (6,368 | 85.2%), Hispanic or Latino (829 | 11.1%), and Two or more Races (522 | 7.0%).
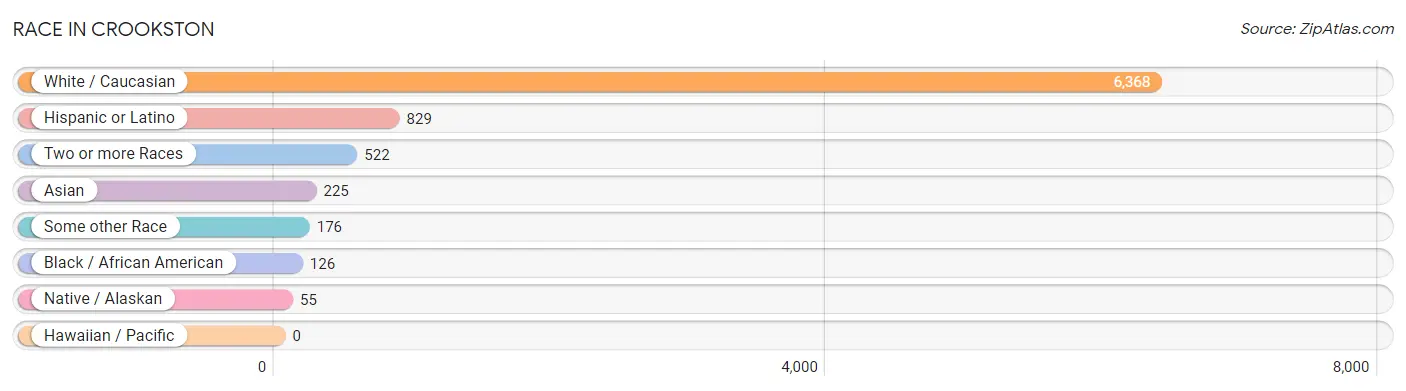
| Race | # Population | % Population |
| Asian | 225 | 3.0% |
| Black / African American | 126 | 1.7% |
| Hawaiian / Pacific | 0 | 0.0% |
| Hispanic or Latino | 829 | 11.1% |
| Native / Alaskan | 55 | 0.7% |
| White / Caucasian | 6,368 | 85.2% |
| Two or more Races | 522 | 7.0% |
| Some other Race | 176 | 2.4% |
| Total | 7,472 | 100.0% |
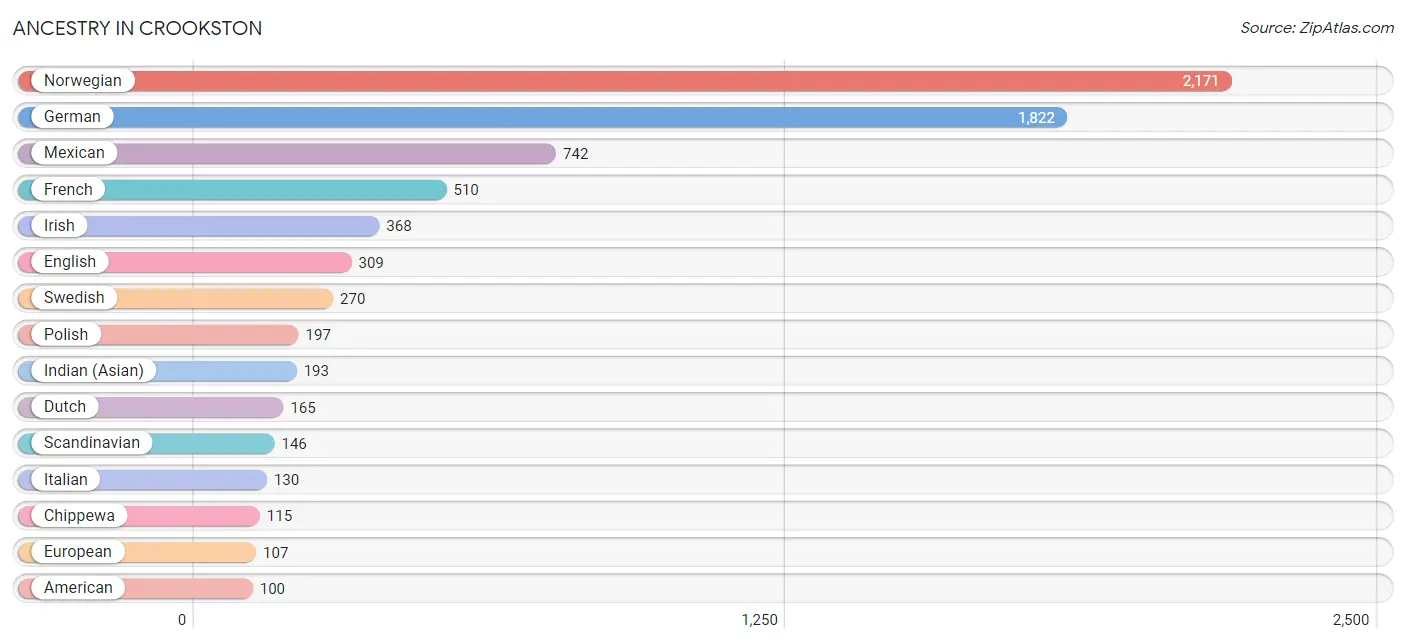
Ancestry in Crookston
The most populous ancestries reported in Crookston are Norwegian (2,171 | 29.1%), German (1,822 | 24.4%), Mexican (742 | 9.9%), French (510 | 6.8%), and Irish (368 | 4.9%), together accounting for 75.1% of all Crookston residents.
| Ancestry | # Population | % Population |
| African | 88 | 1.2% |
| American | 100 | 1.3% |
| Arab | 74 | 1.0% |
| Australian | 39 | 0.5% |
| Burmese | 23 | 0.3% |
| Chippewa | 115 | 1.5% |
| Colombian | 27 | 0.4% |
| Cuban | 41 | 0.5% |
| Czech | 69 | 0.9% |
| Czechoslovakian | 8 | 0.1% |
| Danish | 46 | 0.6% |
| Dutch | 165 | 2.2% |
| Eastern European | 14 | 0.2% |
| English | 309 | 4.1% |
| European | 107 | 1.4% |
| Finnish | 76 | 1.0% |
| French | 510 | 6.8% |
| French Canadian | 100 | 1.3% |
| German | 1,822 | 24.4% |
| Hungarian | 18 | 0.2% |
| Icelander | 13 | 0.2% |
| Indian (Asian) | 193 | 2.6% |
| Irish | 368 | 4.9% |
| Italian | 130 | 1.7% |
| Lebanese | 74 | 1.0% |
| Mexican | 742 | 9.9% |
| Navajo | 23 | 0.3% |
| Norwegian | 2,171 | 29.1% |
| Polish | 197 | 2.6% |
| Puerto Rican | 19 | 0.3% |
| Scandinavian | 146 | 1.9% |
| Scotch-Irish | 9 | 0.1% |
| Scottish | 11 | 0.2% |
| Sioux | 11 | 0.2% |
| South American | 27 | 0.4% |
| Subsaharan African | 88 | 1.2% |
| Swedish | 270 | 3.6% |
| Swiss | 85 | 1.1% |
| Thai | 21 | 0.3% |
| Turkish | 98 | 1.3% |
| Welsh | 16 | 0.2% | View All 41 Rows |
Immigrants in Crookston
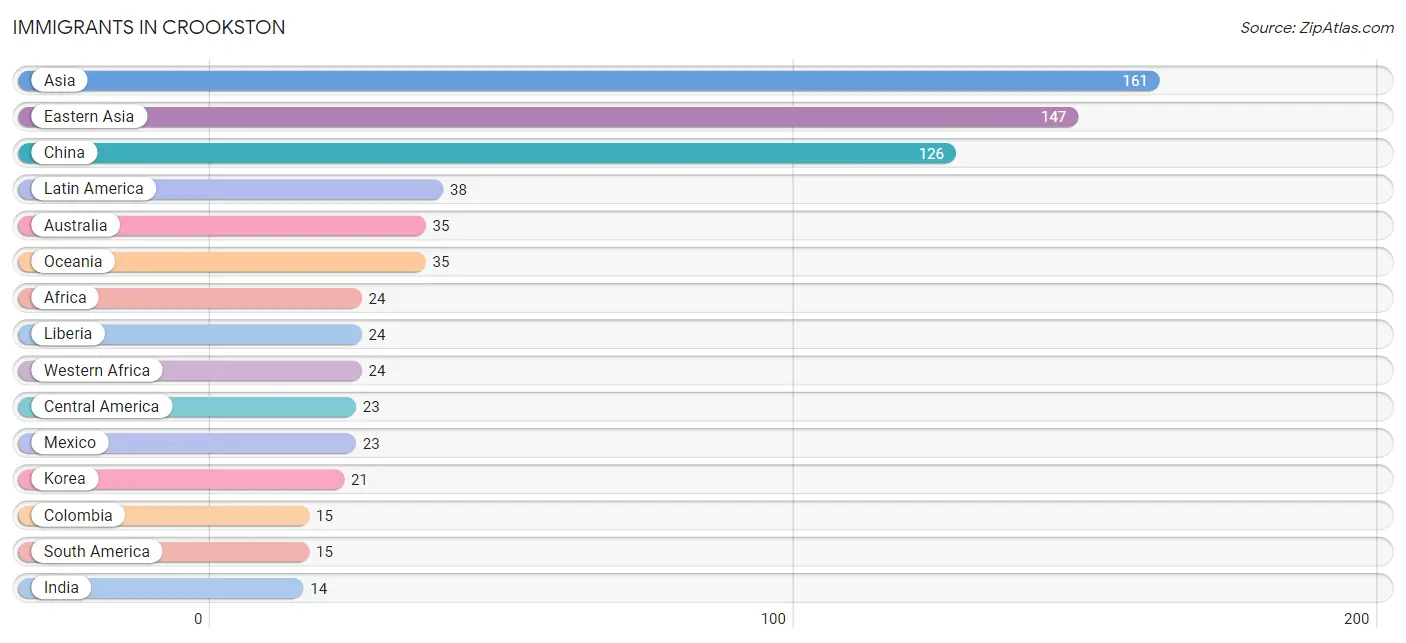
The most numerous immigrant groups reported in Crookston came from Asia (161 | 2.1%), Eastern Asia (147 | 2.0%), China (126 | 1.7%), Latin America (38 | 0.5%), and Australia (35 | 0.5%), together accounting for 6.8% of all Crookston residents.
| Immigration Origin | # Population | % Population |
| Africa | 24 | 0.3% |
| Asia | 161 | 2.1% |
| Australia | 35 | 0.5% |
| Canada | 12 | 0.2% |
| Central America | 23 | 0.3% |
| China | 126 | 1.7% |
| Colombia | 15 | 0.2% |
| Eastern Asia | 147 | 2.0% |
| India | 14 | 0.2% |
| Korea | 21 | 0.3% |
| Latin America | 38 | 0.5% |
| Liberia | 24 | 0.3% |
| Mexico | 23 | 0.3% |
| Oceania | 35 | 0.5% |
| South America | 15 | 0.2% |
| South Central Asia | 14 | 0.2% |
| Western Africa | 24 | 0.3% | View All 17 Rows |
Sex and Age in Crookston
Sex and Age in Crookston
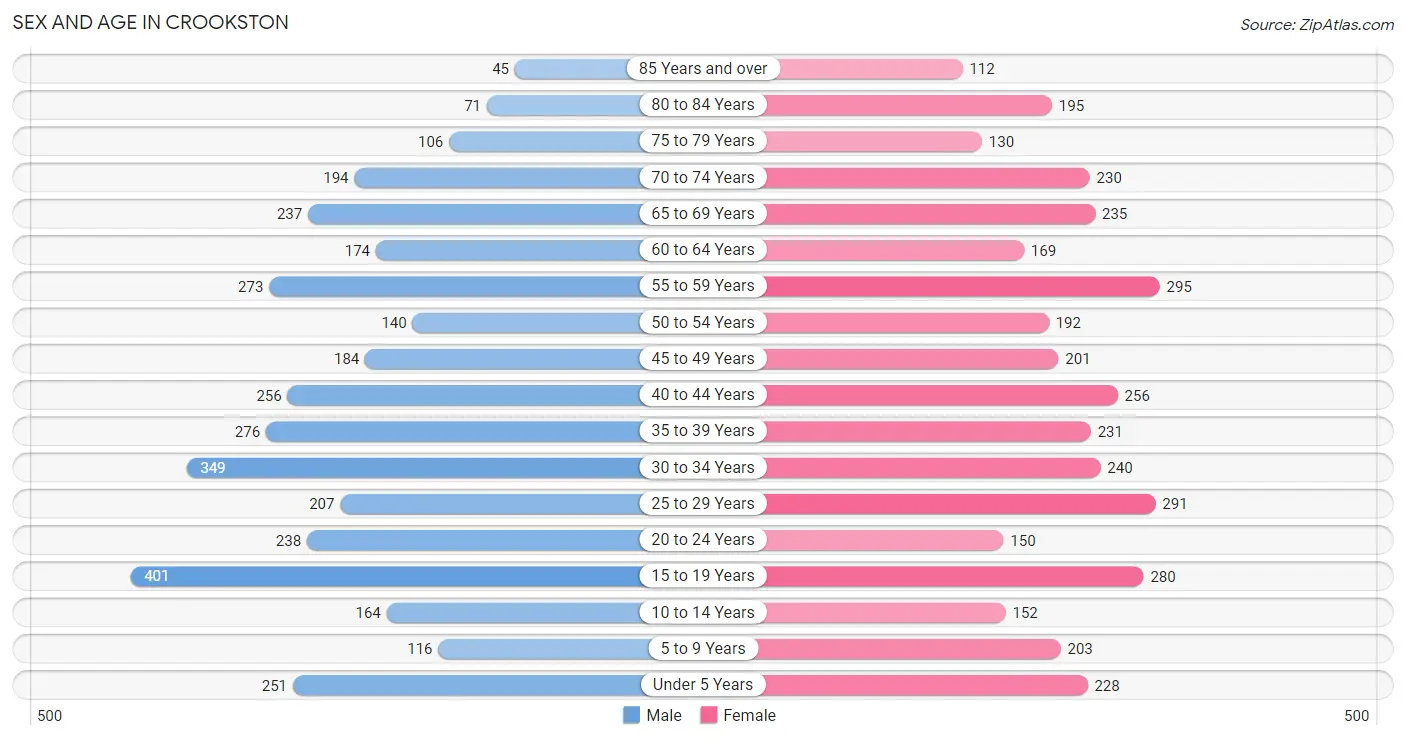
The most populous age groups in Crookston are 15 to 19 Years (401 | 10.9%) for men and 55 to 59 Years (295 | 7.8%) for women.
| Age Bracket | Male | Female |
| Under 5 Years | 251 (6.8%) | 228 (6.0%) |
| 5 to 9 Years | 116 (3.2%) | 203 (5.4%) |
| 10 to 14 Years | 164 (4.4%) | 152 (4.0%) |
| 15 to 19 Years | 401 (10.9%) | 280 (7.4%) |
| 20 to 24 Years | 238 (6.5%) | 150 (4.0%) |
| 25 to 29 Years | 207 (5.6%) | 291 (7.7%) |
| 30 to 34 Years | 349 (9.5%) | 240 (6.3%) |
| 35 to 39 Years | 276 (7.5%) | 231 (6.1%) |
| 40 to 44 Years | 256 (7.0%) | 256 (6.8%) |
| 45 to 49 Years | 184 (5.0%) | 201 (5.3%) |
| 50 to 54 Years | 140 (3.8%) | 192 (5.1%) |
| 55 to 59 Years | 273 (7.4%) | 295 (7.8%) |
| 60 to 64 Years | 174 (4.7%) | 169 (4.5%) |
| 65 to 69 Years | 237 (6.4%) | 235 (6.2%) |
| 70 to 74 Years | 194 (5.3%) | 230 (6.1%) |
| 75 to 79 Years | 106 (2.9%) | 130 (3.4%) |
| 80 to 84 Years | 71 (1.9%) | 195 (5.1%) |
| 85 Years and over | 45 (1.2%) | 112 (3.0%) |
| Total | 3,682 (100.0%) | 3,790 (100.0%) |
Families and Households in Crookston
Median Family Size in Crookston
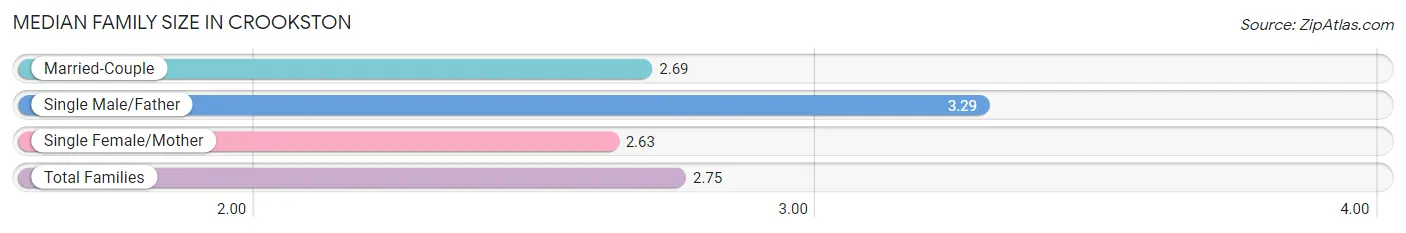
The median family size in Crookston is 2.75 persons per family, with single male/father families (208 | 11.7%) accounting for the largest median family size of 3.29 persons per family. On the other hand, single female/mother families (273 | 15.4%) represent the smallest median family size with 2.63 persons per family.
| Family Type | # Families | Family Size |
| Married-Couple | 1,290 (72.8%) | 2.69 |
| Single Male/Father | 208 (11.7%) | 3.29 |
| Single Female/Mother | 273 (15.4%) | 2.63 |
| Total Families | 1,771 (100.0%) | 2.75 |
Median Household Size in Crookston
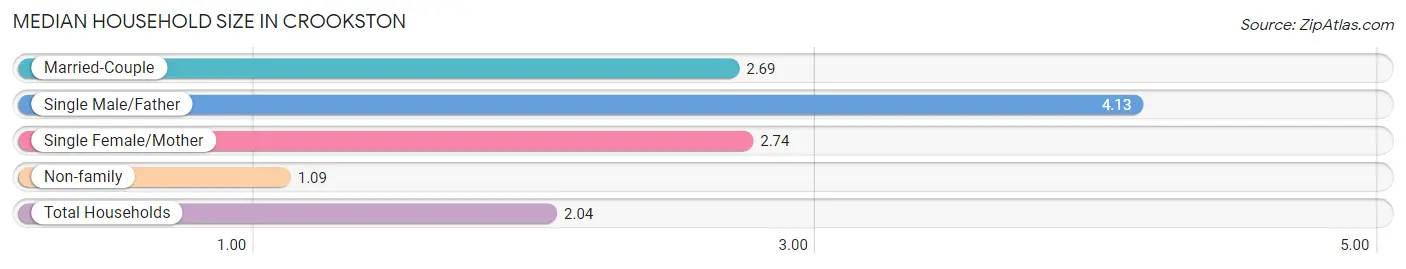
The median household size in Crookston is 2.04 persons per household, with single male/father households (208 | 6.3%) accounting for the largest median household size of 4.13 persons per household. non-family households (1,550 | 46.7%) represent the smallest median household size with 1.09 persons per household.
| Household Type | # Households | Household Size |
| Married-Couple | 1,290 (38.8%) | 2.69 |
| Single Male/Father | 208 (6.3%) | 4.13 |
| Single Female/Mother | 273 (8.2%) | 2.74 |
| Non-family | 1,550 (46.7%) | 1.09 |
| Total Households | 3,321 (100.0%) | 2.04 |
Household Size by Marriage Status in Crookston
Out of a total of 3,321 households in Crookston, 1,771 (53.3%) are family households, while 1,550 (46.7%) are nonfamily households. The most numerous type of family households are 2-person households, comprising 833, and the most common type of nonfamily households are 1-person households, comprising 1,416.
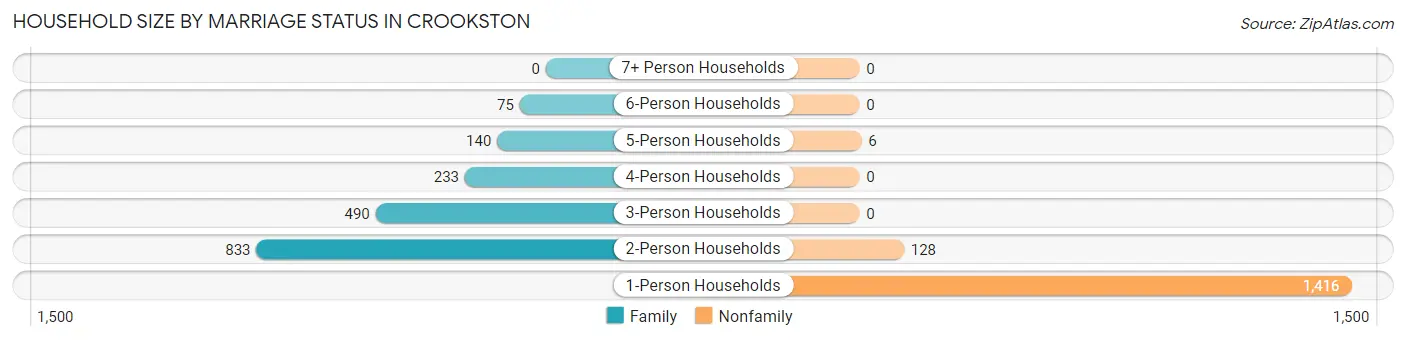
| Household Size | Family Households | Nonfamily Households |
| 1-Person Households | - | 1,416 (42.6%) |
| 2-Person Households | 833 (25.1%) | 128 (3.8%) |
| 3-Person Households | 490 (14.7%) | 0 (0.0%) |
| 4-Person Households | 233 (7.0%) | 0 (0.0%) |
| 5-Person Households | 140 (4.2%) | 6 (0.2%) |
| 6-Person Households | 75 (2.3%) | 0 (0.0%) |
| 7+ Person Households | 0 (0.0%) | 0 (0.0%) |
| Total | 1,771 (53.3%) | 1,550 (46.7%) |
Female Fertility in Crookston
Fertility by Age in Crookston
Average fertility rate in Crookston is 51.0 births per 1,000 women. Women in the age bracket of 20 to 34 years have the highest fertility rate with 125.0 births per 1,000 women. Women in the age bracket of 20 to 34 years acount for 100.0% of all women with births.
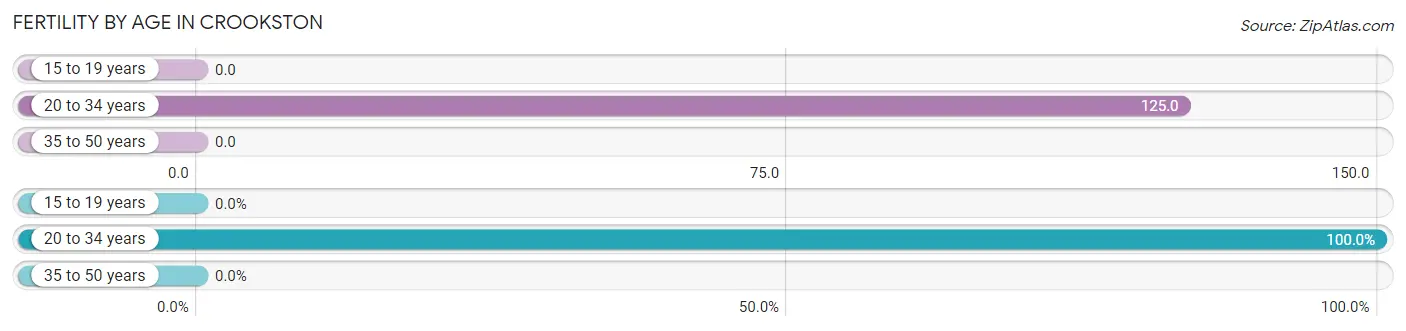
| Age Bracket | Women with Births | Births / 1,000 Women |
| 15 to 19 years | 0 (0.0%) | 0.0 |
| 20 to 34 years | 85 (100.0%) | 125.0 |
| 35 to 50 years | 0 (0.0%) | 0.0 |
| Total | 85 (100.0%) | 51.0 |
Fertility by Age by Marriage Status in Crookston
45.9% of women with births (85) in Crookston are married. The highest percentage of unmarried women with births falls into 20 to 34 years age bracket with 54.1% of them unmarried at the time of birth, while the lowest percentage of unmarried women with births belong to 20 to 34 years age bracket with 54.1% of them unmarried.
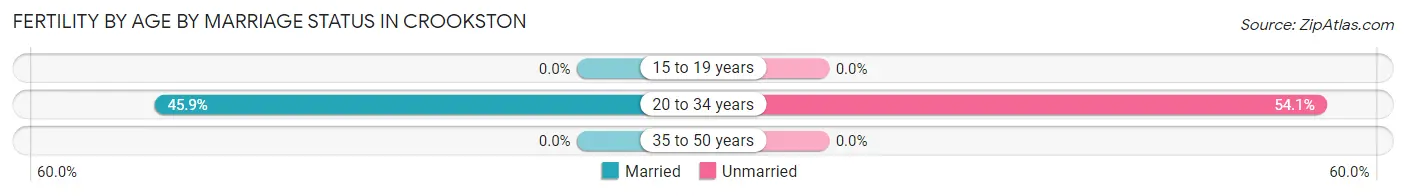
| Age Bracket | Married | Unmarried |
| 15 to 19 years | 0 (0.0%) | 0 (0.0%) |
| 20 to 34 years | 39 (45.9%) | 46 (54.1%) |
| 35 to 50 years | 0 (0.0%) | 0 (0.0%) |
| Total | 39 (45.9%) | 46 (54.1%) |
Fertility by Education in Crookston
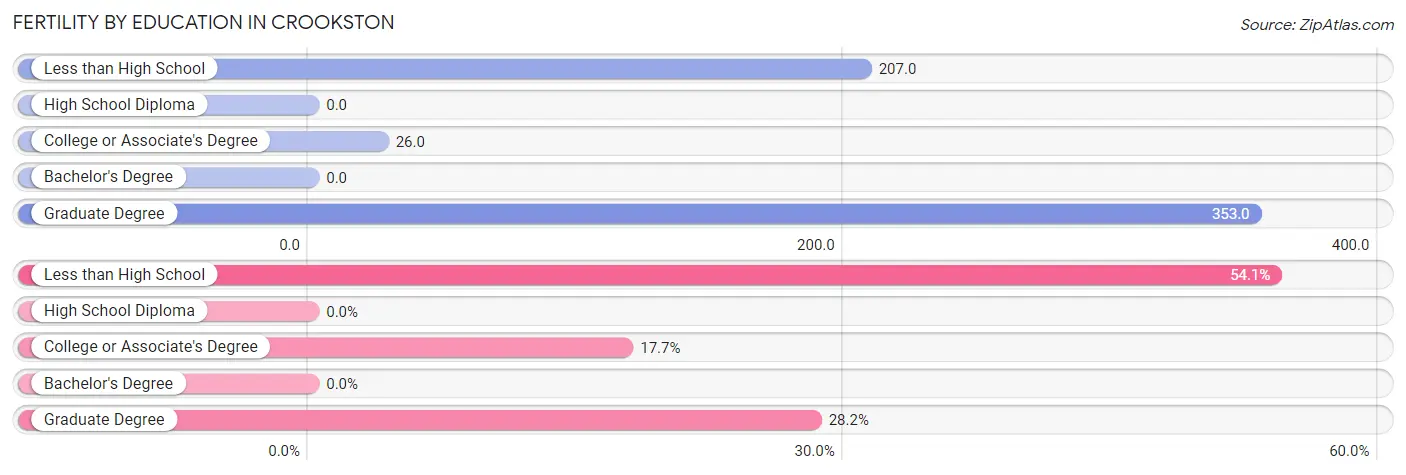
| Educational Attainment | Women with Births | Births / 1,000 Women |
| Less than High School | 46 (54.1%) | 207.0 |
| High School Diploma | 0 (0.0%) | 0.0 |
| College or Associate's Degree | 15 (17.6%) | 26.0 |
| Bachelor's Degree | 0 (0.0%) | 0.0 |
| Graduate Degree | 24 (28.2%) | 353.0 |
| Total | 85 (100.0%) | 51.0 |
Fertility by Education by Marriage Status in Crookston
54.1% of women with births in Crookston are unmarried. Women with the educational attainment of college or associate's degree are most likely to be married with 100.0% of them married at childbirth, while women with the educational attainment of less than high school are least likely to be married with 100.0% of them unmarried at childbirth.
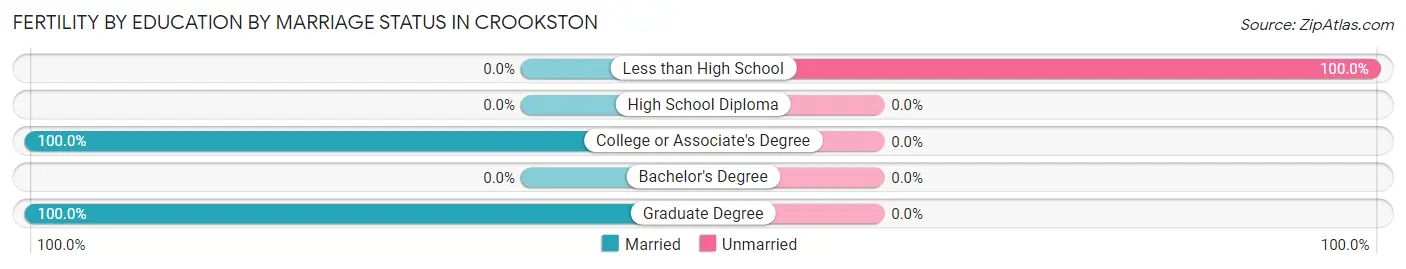
| Educational Attainment | Married | Unmarried |
| Less than High School | 0 (0.0%) | 46 (100.0%) |
| High School Diploma | 0 (0.0%) | 0 (0.0%) |
| College or Associate's Degree | 15 (100.0%) | 0 (0.0%) |
| Bachelor's Degree | 0 (0.0%) | 0 (0.0%) |
| Graduate Degree | 24 (100.0%) | 0 (0.0%) |
| Total | 39 (45.9%) | 46 (54.1%) |
Employment Characteristics in Crookston
Employment by Class of Employer in Crookston
Among the 3,519 employed individuals in Crookston, private company employees (1,971 | 56.0%), not-for-profit organizations (597 | 17.0%), and state government employees (309 | 8.8%) make up the most common classes of employment.
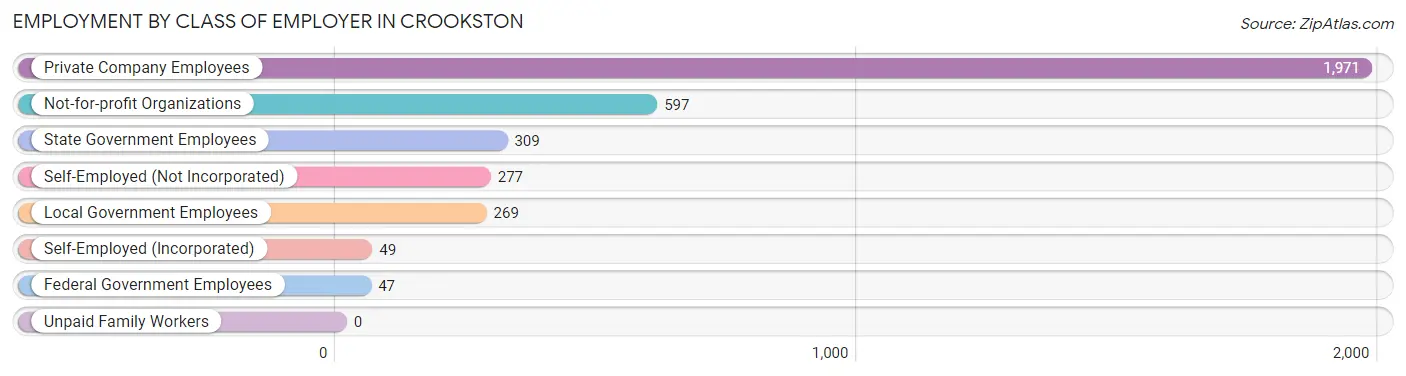
| Employer Class | # Employees | % Employees |
| Private Company Employees | 1,971 | 56.0% |
| Self-Employed (Incorporated) | 49 | 1.4% |
| Self-Employed (Not Incorporated) | 277 | 7.9% |
| Not-for-profit Organizations | 597 | 17.0% |
| Local Government Employees | 269 | 7.6% |
| State Government Employees | 309 | 8.8% |
| Federal Government Employees | 47 | 1.3% |
| Unpaid Family Workers | 0 | 0.0% |
| Total | 3,519 | 100.0% |
Employment Status by Age in Crookston
According to the labor force statistics for Crookston, out of the total population over 16 years of age (6,271), 61.0% or 3,825 individuals are in the labor force, with 3.5% or 134 of them unemployed. The age group with the highest labor force participation rate is 20 to 24 years, with 90.7% or 352 individuals in the labor force. Within the labor force, the 30 to 34 years age range has the highest percentage of unemployed individuals, with 13.4% or 62 of them being unemployed.
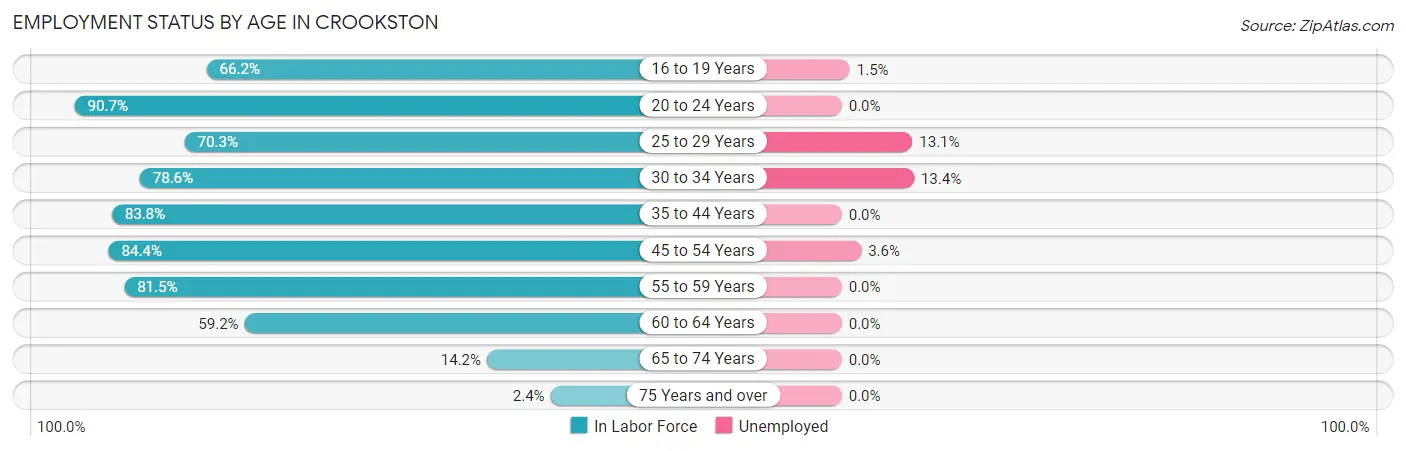
| Age Bracket | In Labor Force | Unemployed |
| 16 to 19 Years | 393 (66.2%) | 6 (1.5%) |
| 20 to 24 Years | 352 (90.7%) | 0 (0.0%) |
| 25 to 29 Years | 350 (70.3%) | 46 (13.1%) |
| 30 to 34 Years | 463 (78.6%) | 62 (13.4%) |
| 35 to 44 Years | 854 (83.8%) | 0 (0.0%) |
| 45 to 54 Years | 605 (84.4%) | 22 (3.6%) |
| 55 to 59 Years | 463 (81.5%) | 0 (0.0%) |
| 60 to 64 Years | 203 (59.2%) | 0 (0.0%) |
| 65 to 74 Years | 127 (14.2%) | 0 (0.0%) |
| 75 Years and over | 16 (2.4%) | 0 (0.0%) |
| Total | 3,825 (61.0%) | 134 (3.5%) |
Employment Status by Educational Attainment in Crookston
According to labor force statistics for Crookston, 78.7% of individuals (2,939) out of the total population between 25 and 64 years of age (3,734) are in the labor force, with 4.4% or 129 of them being unemployed. The group with the highest labor force participation rate are those with the educational attainment of bachelor's degree or higher, with 89.6% or 1,015 individuals in the labor force. Within the labor force, individuals with less than high school education have the highest percentage of unemployment, with 50.6% or 88 of them being unemployed.
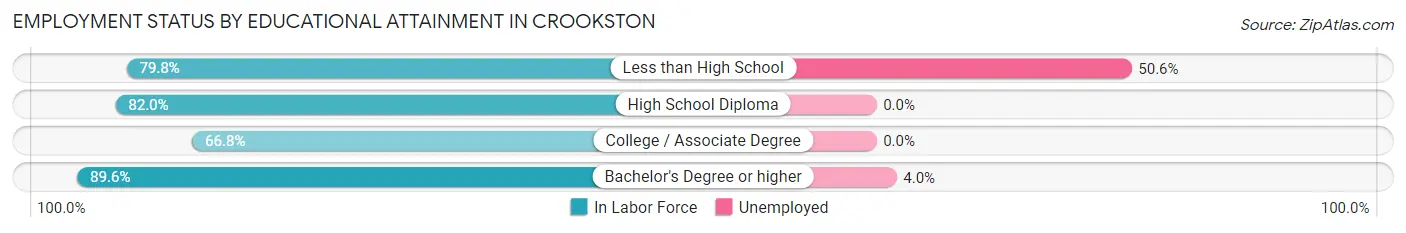
| Educational Attainment | In Labor Force | Unemployed |
| Less than High School | 174 (79.8%) | 110 (50.6%) |
| High School Diploma | 844 (82.0%) | 0 (0.0%) |
| College / Associate Degree | 904 (66.8%) | 0 (0.0%) |
| Bachelor's Degree or higher | 1,015 (89.6%) | 45 (4.0%) |
| Total | 2,939 (78.7%) | 164 (4.4%) |
Employment Occupations by Sex in Crookston
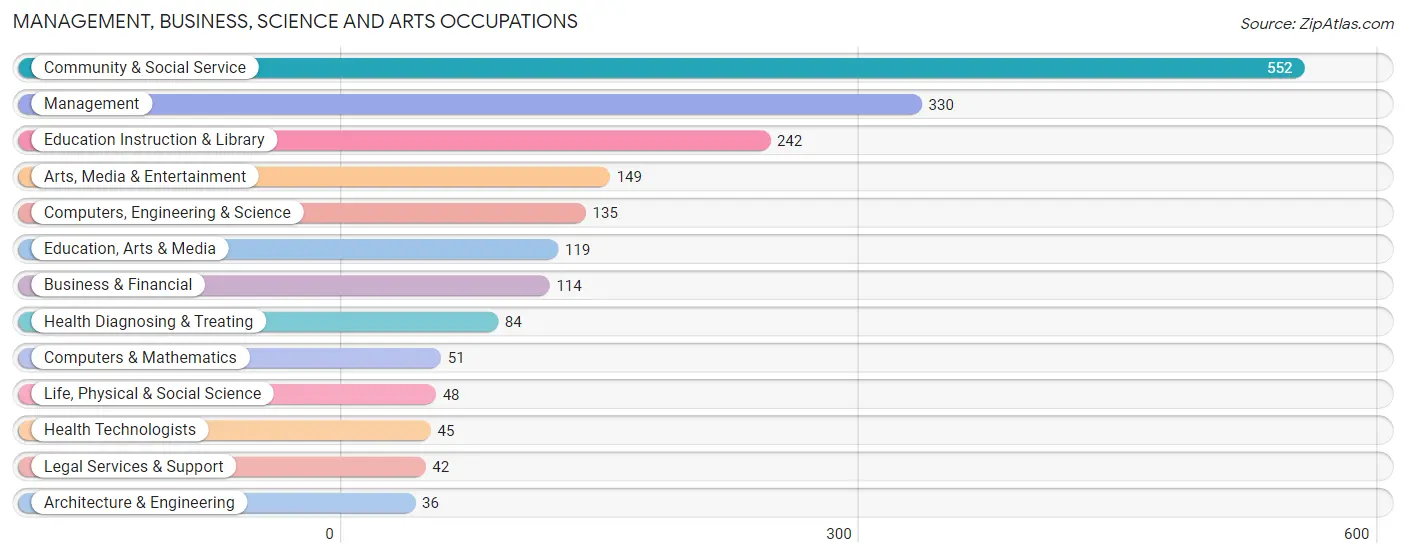
Management, Business, Science and Arts Occupations
The most common Management, Business, Science and Arts occupations in Crookston are Community & Social Service (552 | 15.0%), Management (330 | 9.0%), Education Instruction & Library (242 | 6.6%), Arts, Media & Entertainment (149 | 4.1%), and Computers, Engineering & Science (135 | 3.7%).
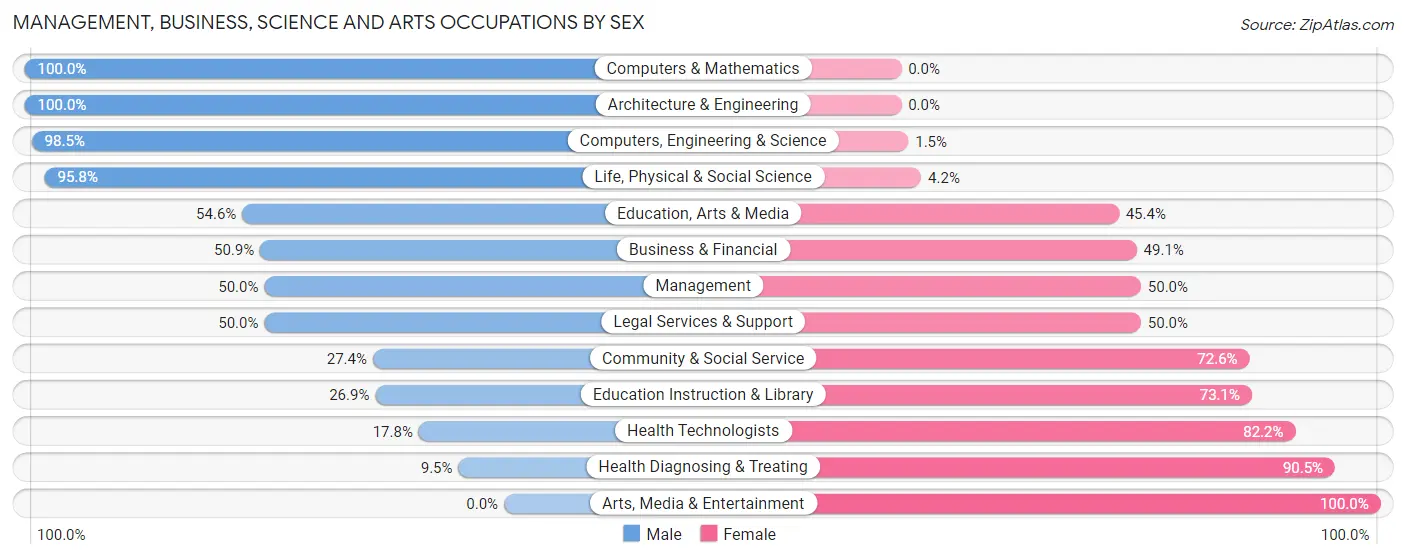
Management, Business, Science and Arts Occupations by Sex
Within the Management, Business, Science and Arts occupations in Crookston, the most male-oriented occupations are Computers & Mathematics (100.0%), Architecture & Engineering (100.0%), and Computers, Engineering & Science (98.5%), while the most female-oriented occupations are Arts, Media & Entertainment (100.0%), Health Diagnosing & Treating (90.5%), and Health Technologists (82.2%).
| Occupation | Male | Female |
| Management | 165 (50.0%) | 165 (50.0%) |
| Business & Financial | 58 (50.9%) | 56 (49.1%) |
| Computers, Engineering & Science | 133 (98.5%) | 2 (1.5%) |
| Computers & Mathematics | 51 (100.0%) | 0 (0.0%) |
| Architecture & Engineering | 36 (100.0%) | 0 (0.0%) |
| Life, Physical & Social Science | 46 (95.8%) | 2 (4.2%) |
| Community & Social Service | 151 (27.4%) | 401 (72.6%) |
| Education, Arts & Media | 65 (54.6%) | 54 (45.4%) |
| Legal Services & Support | 21 (50.0%) | 21 (50.0%) |
| Education Instruction & Library | 65 (26.9%) | 177 (73.1%) |
| Arts, Media & Entertainment | 0 (0.0%) | 149 (100.0%) |
| Health Diagnosing & Treating | 8 (9.5%) | 76 (90.5%) |
| Health Technologists | 8 (17.8%) | 37 (82.2%) |
| Total (Category) | 515 (42.4%) | 700 (57.6%) |
| Total (Overall) | 2,027 (55.1%) | 1,651 (44.9%) |
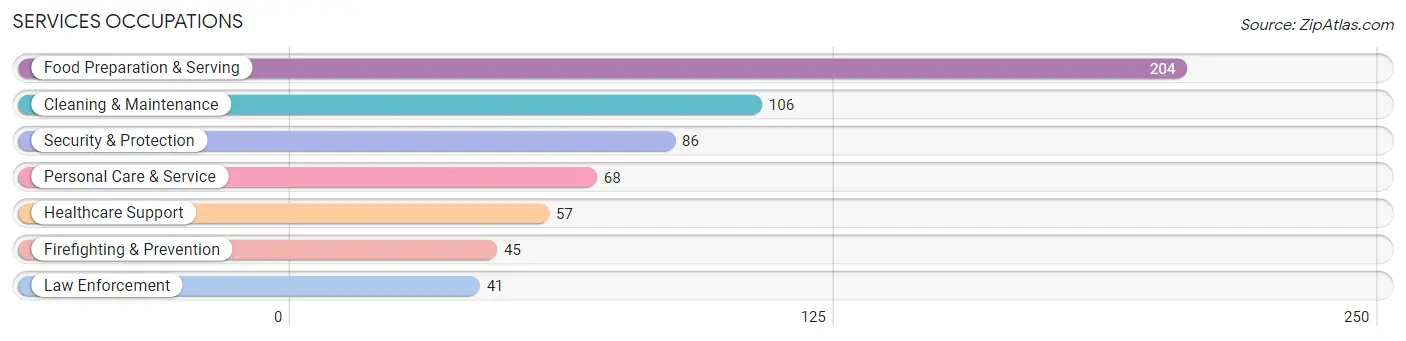
Services Occupations
The most common Services occupations in Crookston are Food Preparation & Serving (204 | 5.6%), Cleaning & Maintenance (106 | 2.9%), Security & Protection (86 | 2.3%), Personal Care & Service (68 | 1.8%), and Healthcare Support (57 | 1.5%).
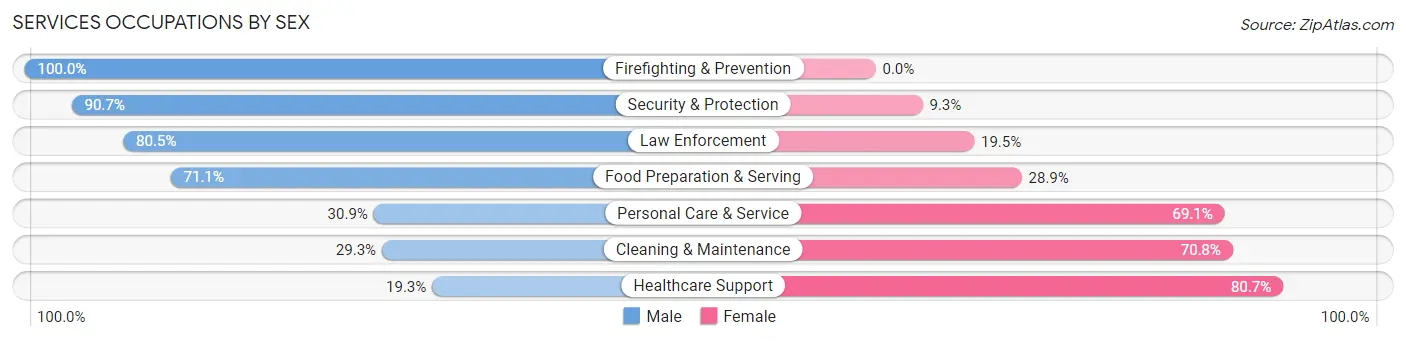
Services Occupations by Sex
Within the Services occupations in Crookston, the most male-oriented occupations are Firefighting & Prevention (100.0%), Security & Protection (90.7%), and Law Enforcement (80.5%), while the most female-oriented occupations are Healthcare Support (80.7%), Cleaning & Maintenance (70.8%), and Personal Care & Service (69.1%).
| Occupation | Male | Female |
| Healthcare Support | 11 (19.3%) | 46 (80.7%) |
| Security & Protection | 78 (90.7%) | 8 (9.3%) |
| Firefighting & Prevention | 45 (100.0%) | 0 (0.0%) |
| Law Enforcement | 33 (80.5%) | 8 (19.5%) |
| Food Preparation & Serving | 145 (71.1%) | 59 (28.9%) |
| Cleaning & Maintenance | 31 (29.2%) | 75 (70.8%) |
| Personal Care & Service | 21 (30.9%) | 47 (69.1%) |
| Total (Category) | 286 (54.9%) | 235 (45.1%) |
| Total (Overall) | 2,027 (55.1%) | 1,651 (44.9%) |
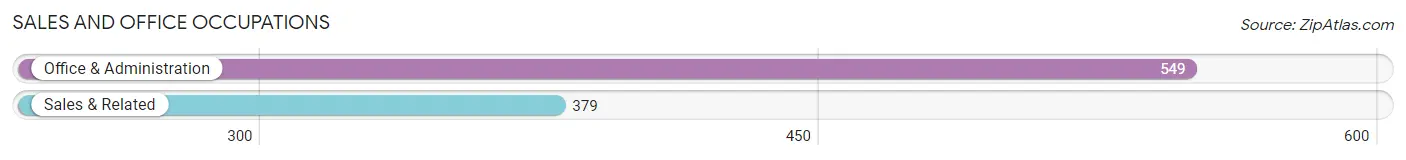
Sales and Office Occupations
The most common Sales and Office occupations in Crookston are Office & Administration (549 | 14.9%), and Sales & Related (379 | 10.3%).
Sales and Office Occupations by Sex
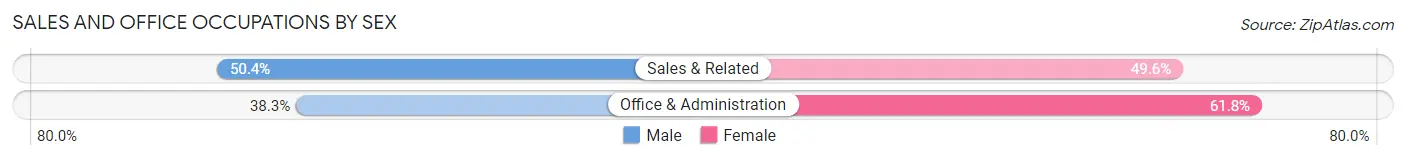
| Occupation | Male | Female |
| Sales & Related | 191 (50.4%) | 188 (49.6%) |
| Office & Administration | 210 (38.3%) | 339 (61.8%) |
| Total (Category) | 401 (43.2%) | 527 (56.8%) |
| Total (Overall) | 2,027 (55.1%) | 1,651 (44.9%) |
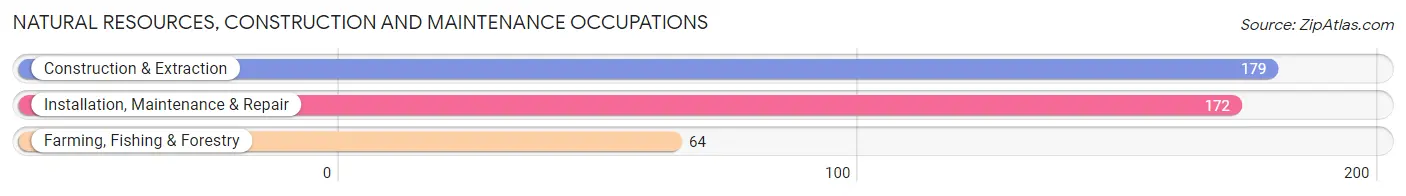
Natural Resources, Construction and Maintenance Occupations
The most common Natural Resources, Construction and Maintenance occupations in Crookston are Construction & Extraction (179 | 4.9%), Installation, Maintenance & Repair (172 | 4.7%), and Farming, Fishing & Forestry (64 | 1.7%).
Natural Resources, Construction and Maintenance Occupations by Sex
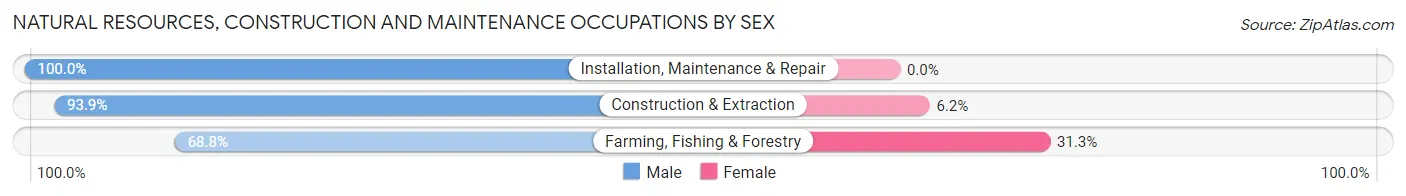
| Occupation | Male | Female |
| Farming, Fishing & Forestry | 44 (68.8%) | 20 (31.2%) |
| Construction & Extraction | 168 (93.9%) | 11 (6.1%) |
| Installation, Maintenance & Repair | 172 (100.0%) | 0 (0.0%) |
| Total (Category) | 384 (92.5%) | 31 (7.5%) |
| Total (Overall) | 2,027 (55.1%) | 1,651 (44.9%) |
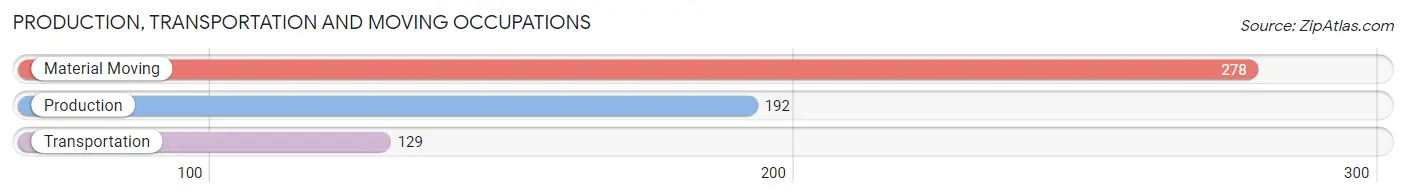
Production, Transportation and Moving Occupations
The most common Production, Transportation and Moving occupations in Crookston are Material Moving (278 | 7.6%), Production (192 | 5.2%), and Transportation (129 | 3.5%).
Production, Transportation and Moving Occupations by Sex
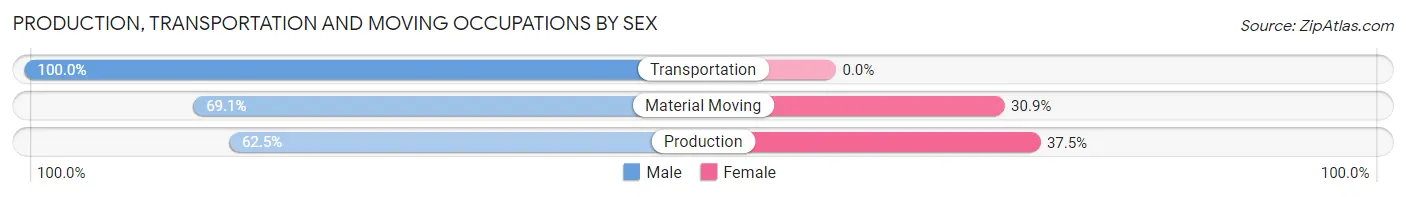
| Occupation | Male | Female |
| Production | 120 (62.5%) | 72 (37.5%) |
| Transportation | 129 (100.0%) | 0 (0.0%) |
| Material Moving | 192 (69.1%) | 86 (30.9%) |
| Total (Category) | 441 (73.6%) | 158 (26.4%) |
| Total (Overall) | 2,027 (55.1%) | 1,651 (44.9%) |
Employment Industries by Sex in Crookston
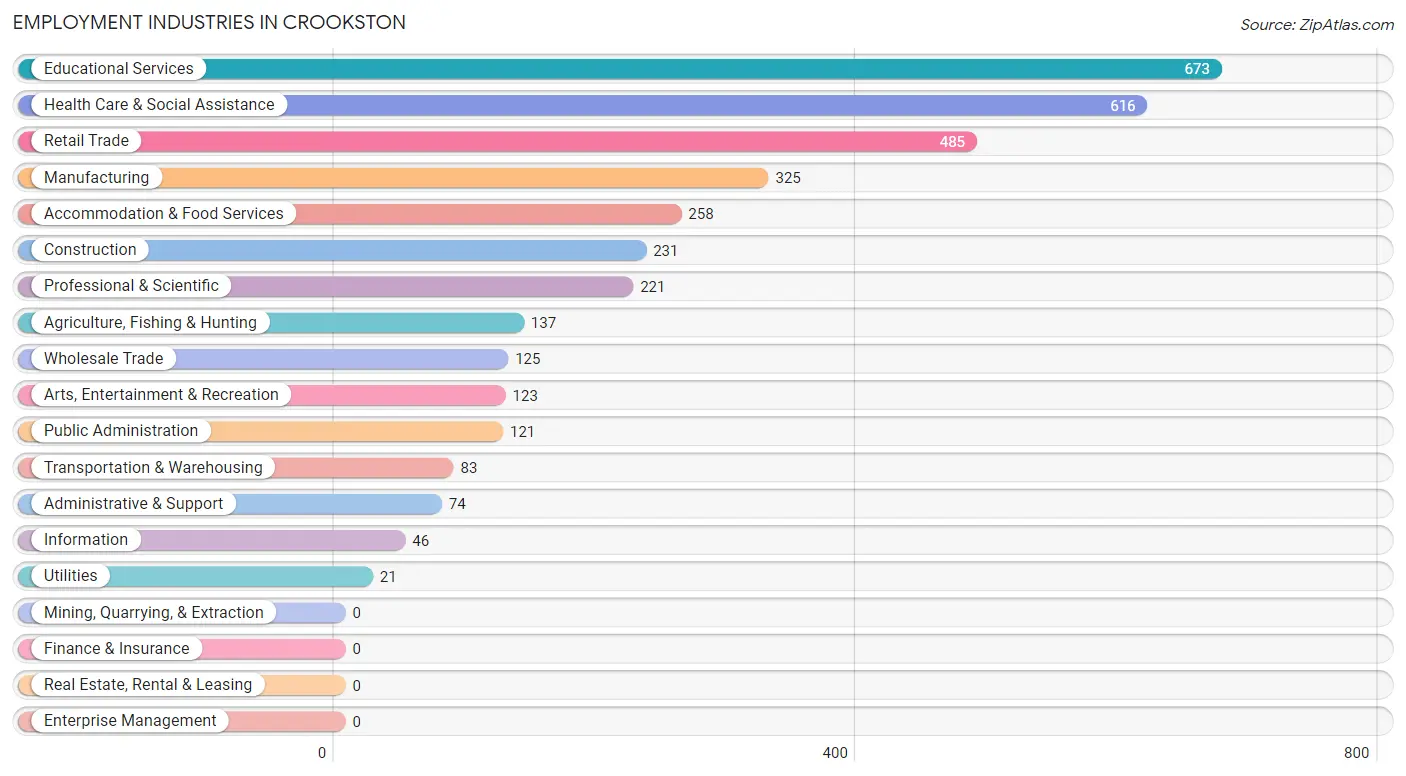
Employment Industries in Crookston
The major employment industries in Crookston include Educational Services (673 | 18.3%), Health Care & Social Assistance (616 | 16.8%), Retail Trade (485 | 13.2%), Manufacturing (325 | 8.8%), and Accommodation & Food Services (258 | 7.0%).
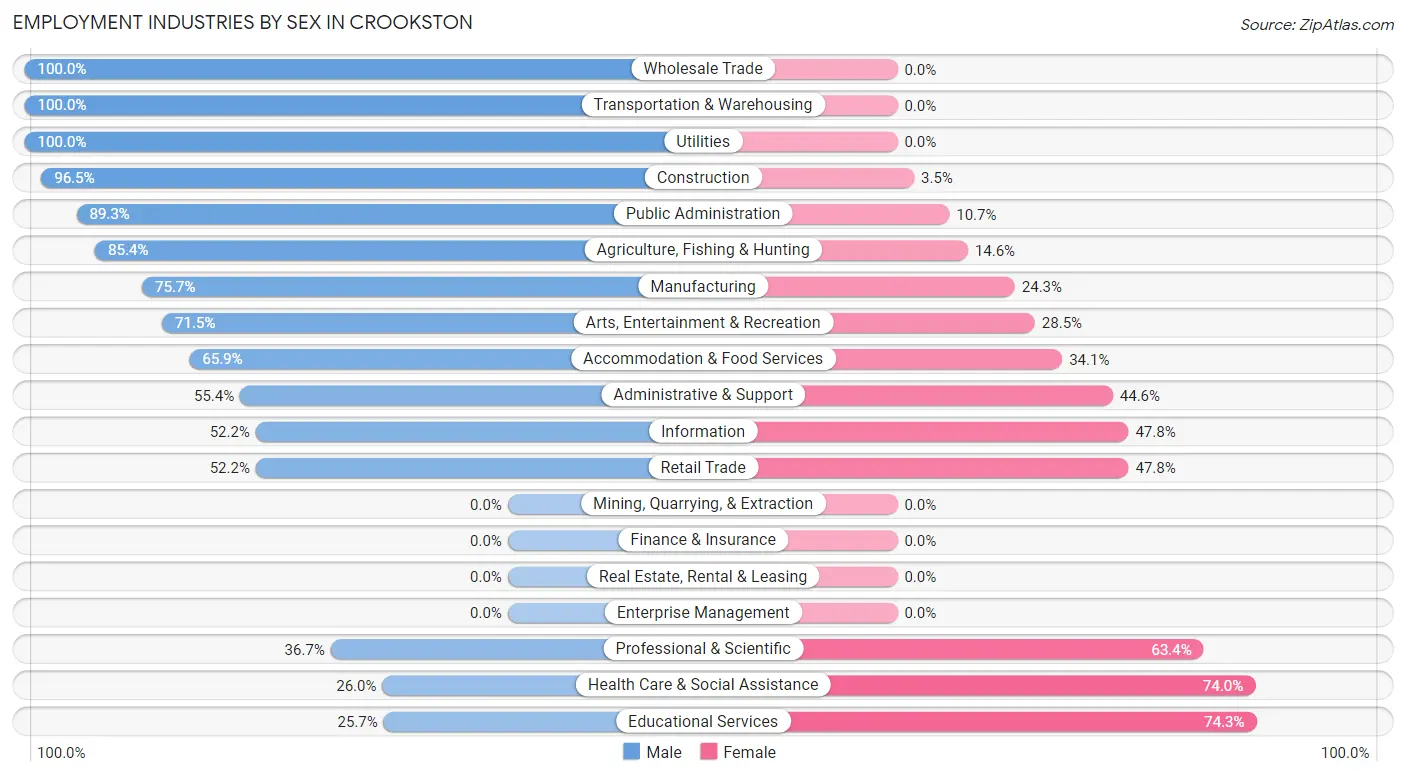
Employment Industries by Sex in Crookston
The Crookston industries that see more men than women are Wholesale Trade (100.0%), Transportation & Warehousing (100.0%), and Utilities (100.0%), whereas the industries that tend to have a higher number of women are Educational Services (74.3%), Health Care & Social Assistance (74.0%), and Professional & Scientific (63.3%).
| Industry | Male | Female |
| Agriculture, Fishing & Hunting | 117 (85.4%) | 20 (14.6%) |
| Mining, Quarrying, & Extraction | 0 (0.0%) | 0 (0.0%) |
| Construction | 223 (96.5%) | 8 (3.5%) |
| Manufacturing | 246 (75.7%) | 79 (24.3%) |
| Wholesale Trade | 125 (100.0%) | 0 (0.0%) |
| Retail Trade | 253 (52.2%) | 232 (47.8%) |
| Transportation & Warehousing | 83 (100.0%) | 0 (0.0%) |
| Utilities | 21 (100.0%) | 0 (0.0%) |
| Information | 24 (52.2%) | 22 (47.8%) |
| Finance & Insurance | 0 (0.0%) | 0 (0.0%) |
| Real Estate, Rental & Leasing | 0 (0.0%) | 0 (0.0%) |
| Professional & Scientific | 81 (36.6%) | 140 (63.3%) |
| Enterprise Management | 0 (0.0%) | 0 (0.0%) |
| Administrative & Support | 41 (55.4%) | 33 (44.6%) |
| Educational Services | 173 (25.7%) | 500 (74.3%) |
| Health Care & Social Assistance | 160 (26.0%) | 456 (74.0%) |
| Arts, Entertainment & Recreation | 88 (71.5%) | 35 (28.5%) |
| Accommodation & Food Services | 170 (65.9%) | 88 (34.1%) |
| Public Administration | 108 (89.3%) | 13 (10.7%) |
| Total | 2,027 (55.1%) | 1,651 (44.9%) |
Education in Crookston
School Enrollment in Crookston
The most common levels of schooling among the 1,665 students in Crookston are high school (586 | 35.2%), college / undergraduate (500 | 30.0%), and elementary school (241 | 14.5%).
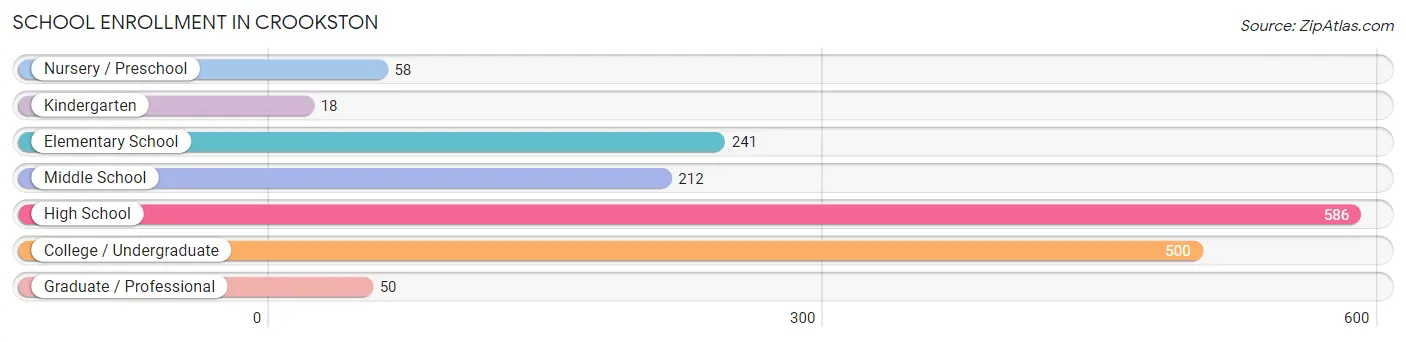
| School Level | # Students | % Students |
| Nursery / Preschool | 58 | 3.5% |
| Kindergarten | 18 | 1.1% |
| Elementary School | 241 | 14.5% |
| Middle School | 212 | 12.7% |
| High School | 586 | 35.2% |
| College / Undergraduate | 500 | 30.0% |
| Graduate / Professional | 50 | 3.0% |
| Total | 1,665 | 100.0% |
School Enrollment by Age by Funding Source in Crookston
Out of a total of 1,665 students who are enrolled in schools in Crookston, 170 (10.2%) attend a private institution, while the remaining 1,495 (89.8%) are enrolled in public schools. The age group of 3 to 4 year olds has the highest likelihood of being enrolled in private schools, with 18 (48.6% in the age bracket) enrolled. Conversely, the age group of 20 to 24 year olds has the lowest likelihood of being enrolled in a private school, with 311 (100.0% in the age bracket) attending a public institution.
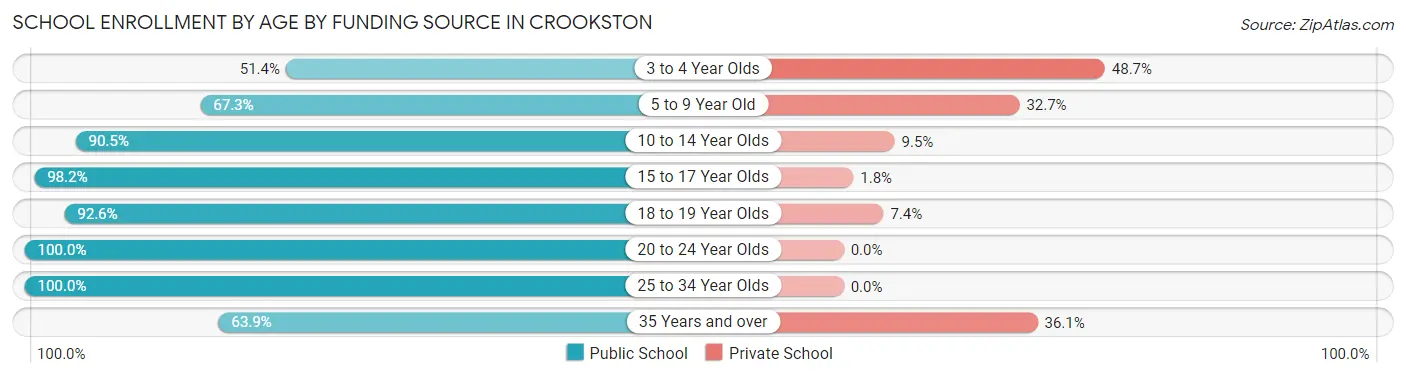
| Age Bracket | Public School | Private School |
| 3 to 4 Year Olds | 19 (51.3%) | 18 (48.6%) |
| 5 to 9 Year Old | 152 (67.3%) | 74 (32.7%) |
| 10 to 14 Year Olds | 286 (90.5%) | 30 (9.5%) |
| 15 to 17 Year Olds | 381 (98.2%) | 7 (1.8%) |
| 18 to 19 Year Olds | 175 (92.6%) | 14 (7.4%) |
| 20 to 24 Year Olds | 311 (100.0%) | 0 (0.0%) |
| 25 to 34 Year Olds | 126 (100.0%) | 0 (0.0%) |
| 35 Years and over | 46 (63.9%) | 26 (36.1%) |
| Total | 1,495 (89.8%) | 170 (10.2%) |
Educational Attainment by Field of Study in Crookston
Education (413 | 25.9%), visual & performing arts (168 | 10.5%), arts & humanities (152 | 9.5%), science & technology (143 | 9.0%), and bio, nature & agricultural (142 | 8.9%) are the most common fields of study among 1,596 individuals in Crookston who have obtained a bachelor's degree or higher.
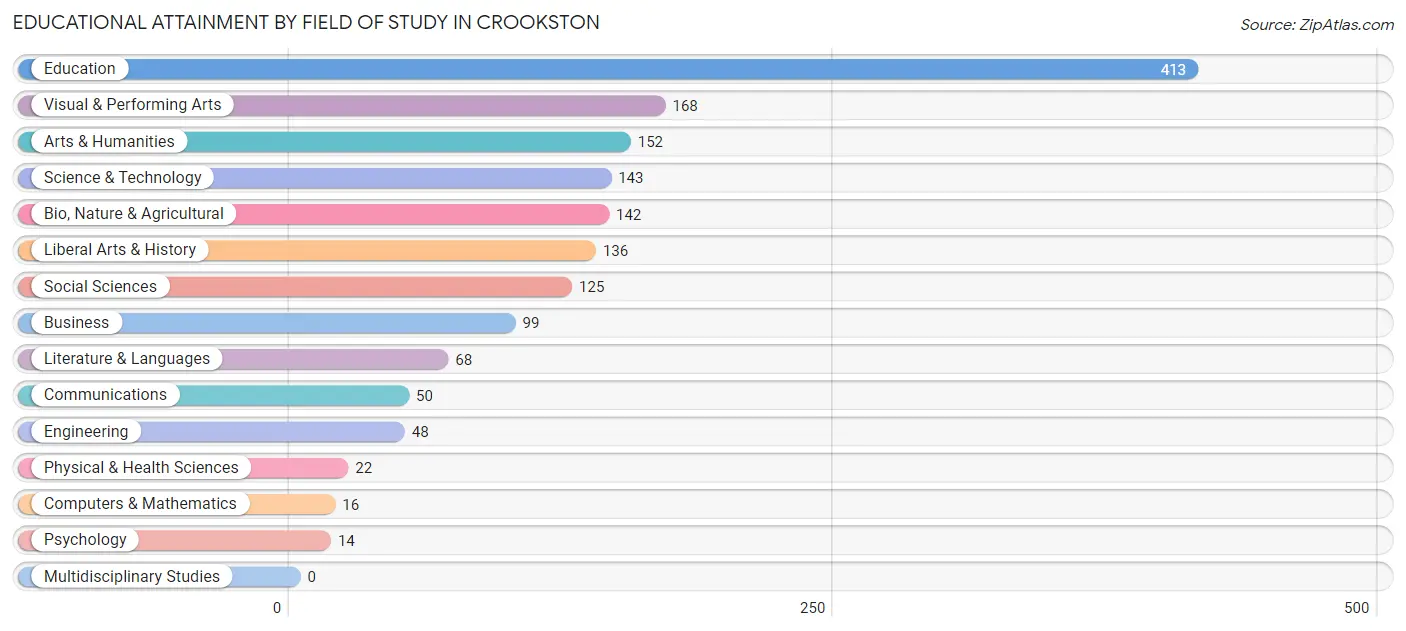
| Field of Study | # Graduates | % Graduates |
| Computers & Mathematics | 16 | 1.0% |
| Bio, Nature & Agricultural | 142 | 8.9% |
| Physical & Health Sciences | 22 | 1.4% |
| Psychology | 14 | 0.9% |
| Social Sciences | 125 | 7.8% |
| Engineering | 48 | 3.0% |
| Multidisciplinary Studies | 0 | 0.0% |
| Science & Technology | 143 | 9.0% |
| Business | 99 | 6.2% |
| Education | 413 | 25.9% |
| Literature & Languages | 68 | 4.3% |
| Liberal Arts & History | 136 | 8.5% |
| Visual & Performing Arts | 168 | 10.5% |
| Communications | 50 | 3.1% |
| Arts & Humanities | 152 | 9.5% |
| Total | 1,596 | 100.0% |
Transportation & Commute in Crookston
Vehicle Availability by Sex in Crookston
The most prevalent vehicle ownership categories in Crookston are males with 2 vehicles (927, accounting for 52.0%) and females with 2 vehicles (488, making up 69.1%).
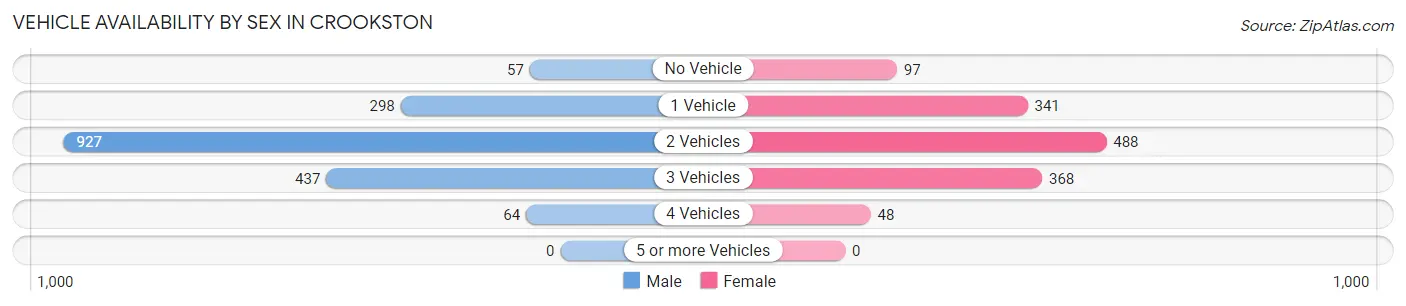
| Vehicles Available | Male | Female |
| No Vehicle | 57 (3.2%) | 97 (7.2%) |
| 1 Vehicle | 298 (16.7%) | 341 (25.4%) |
| 2 Vehicles | 927 (52.0%) | 488 (36.4%) |
| 3 Vehicles | 437 (24.5%) | 368 (27.4%) |
| 4 Vehicles | 64 (3.6%) | 48 (3.6%) |
| 5 or more Vehicles | 0 (0.0%) | 0 (0.0%) |
| Total | 1,783 (100.0%) | 1,342 (100.0%) |
Commute Time in Crookston
The most frequently occuring commute durations in Crookston are 5 to 9 minutes (1,139 commuters, 34.0%), 10 to 14 minutes (807 commuters, 24.1%), and less than 5 minutes (356 commuters, 10.6%).
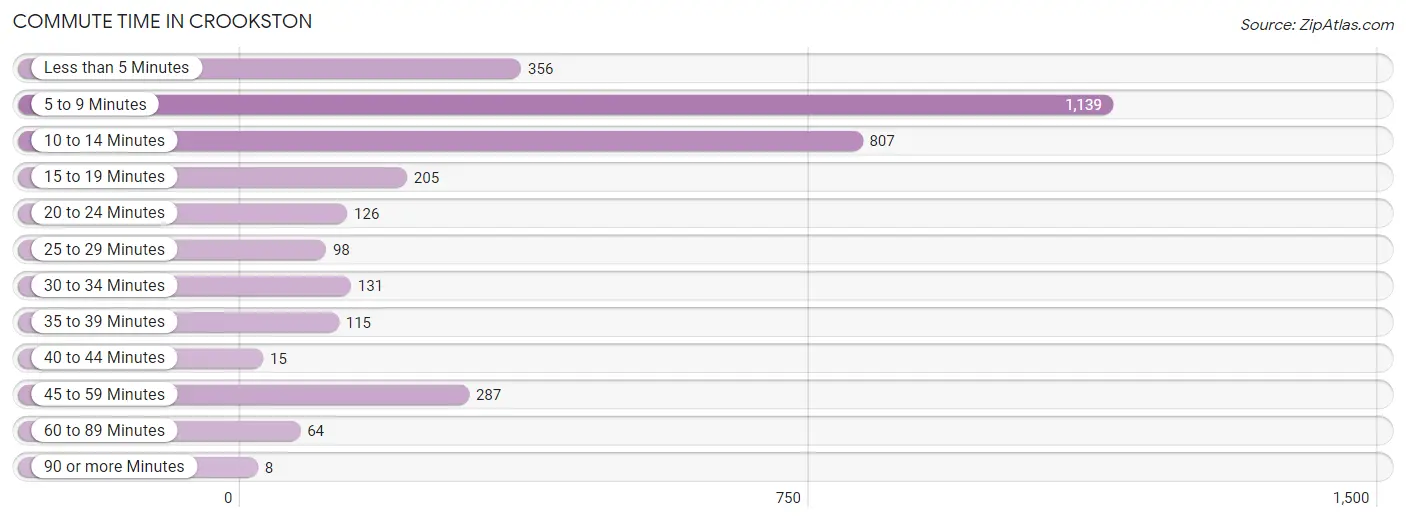
| Commute Time | # Commuters | % Commuters |
| Less than 5 Minutes | 356 | 10.6% |
| 5 to 9 Minutes | 1,139 | 34.0% |
| 10 to 14 Minutes | 807 | 24.1% |
| 15 to 19 Minutes | 205 | 6.1% |
| 20 to 24 Minutes | 126 | 3.8% |
| 25 to 29 Minutes | 98 | 2.9% |
| 30 to 34 Minutes | 131 | 3.9% |
| 35 to 39 Minutes | 115 | 3.4% |
| 40 to 44 Minutes | 15 | 0.4% |
| 45 to 59 Minutes | 287 | 8.6% |
| 60 to 89 Minutes | 64 | 1.9% |
| 90 or more Minutes | 8 | 0.2% |
Commute Time by Sex in Crookston
The most common commute times in Crookston are 10 to 14 minutes (509 commuters, 27.2%) for males and 5 to 9 minutes (646 commuters, 43.7%) for females.
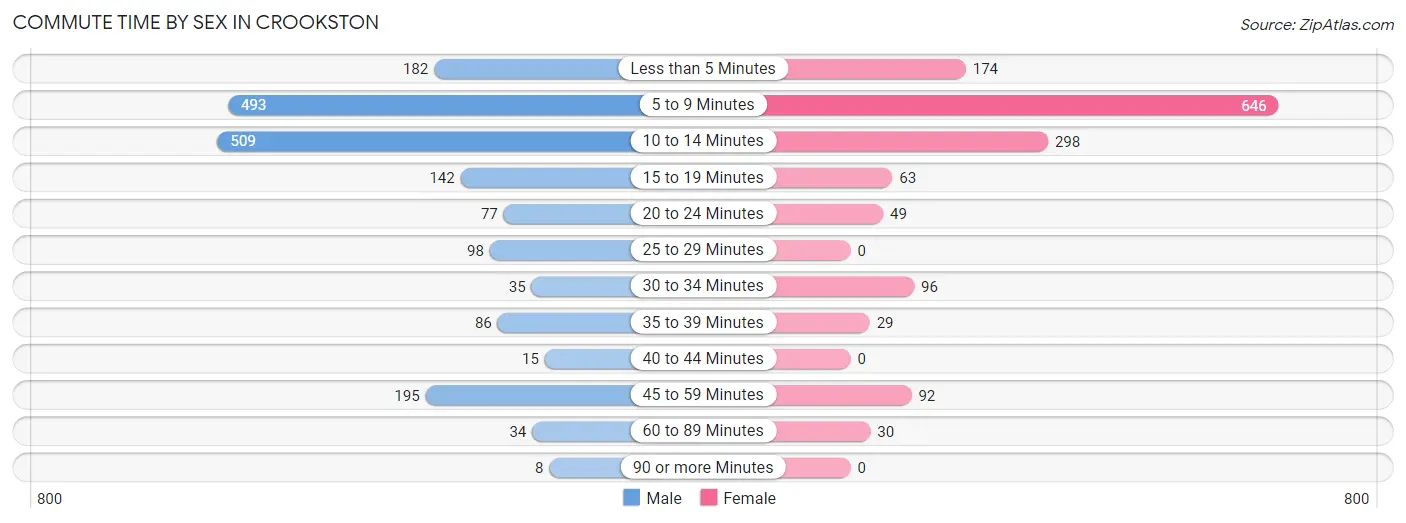
| Commute Time | Male | Female |
| Less than 5 Minutes | 182 (9.7%) | 174 (11.8%) |
| 5 to 9 Minutes | 493 (26.3%) | 646 (43.7%) |
| 10 to 14 Minutes | 509 (27.2%) | 298 (20.2%) |
| 15 to 19 Minutes | 142 (7.6%) | 63 (4.3%) |
| 20 to 24 Minutes | 77 (4.1%) | 49 (3.3%) |
| 25 to 29 Minutes | 98 (5.2%) | 0 (0.0%) |
| 30 to 34 Minutes | 35 (1.9%) | 96 (6.5%) |
| 35 to 39 Minutes | 86 (4.6%) | 29 (2.0%) |
| 40 to 44 Minutes | 15 (0.8%) | 0 (0.0%) |
| 45 to 59 Minutes | 195 (10.4%) | 92 (6.2%) |
| 60 to 89 Minutes | 34 (1.8%) | 30 (2.0%) |
| 90 or more Minutes | 8 (0.4%) | 0 (0.0%) |
Time of Departure to Work by Sex in Crookston
The most frequent times of departure to work in Crookston are 7:30 AM to 7:59 AM (306, 16.3%) for males and 7:30 AM to 7:59 AM (306, 20.7%) for females.
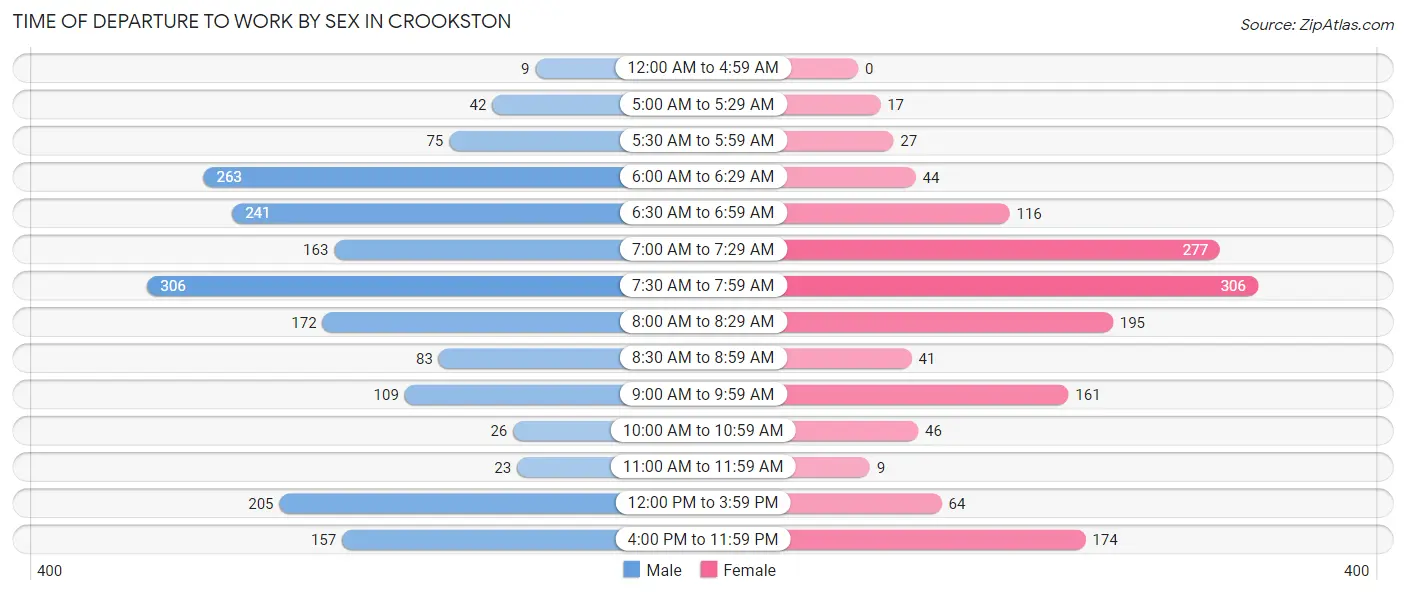
| Time of Departure | Male | Female |
| 12:00 AM to 4:59 AM | 9 (0.5%) | 0 (0.0%) |
| 5:00 AM to 5:29 AM | 42 (2.2%) | 17 (1.1%) |
| 5:30 AM to 5:59 AM | 75 (4.0%) | 27 (1.8%) |
| 6:00 AM to 6:29 AM | 263 (14.0%) | 44 (3.0%) |
| 6:30 AM to 6:59 AM | 241 (12.9%) | 116 (7.9%) |
| 7:00 AM to 7:29 AM | 163 (8.7%) | 277 (18.8%) |
| 7:30 AM to 7:59 AM | 306 (16.3%) | 306 (20.7%) |
| 8:00 AM to 8:29 AM | 172 (9.2%) | 195 (13.2%) |
| 8:30 AM to 8:59 AM | 83 (4.4%) | 41 (2.8%) |
| 9:00 AM to 9:59 AM | 109 (5.8%) | 161 (10.9%) |
| 10:00 AM to 10:59 AM | 26 (1.4%) | 46 (3.1%) |
| 11:00 AM to 11:59 AM | 23 (1.2%) | 9 (0.6%) |
| 12:00 PM to 3:59 PM | 205 (10.9%) | 64 (4.3%) |
| 4:00 PM to 11:59 PM | 157 (8.4%) | 174 (11.8%) |
| Total | 1,874 (100.0%) | 1,477 (100.0%) |
Housing Occupancy in Crookston
Occupancy by Ownership in Crookston
Of the total 3,321 dwellings in Crookston, owner-occupied units account for 1,849 (55.7%), while renter-occupied units make up 1,472 (44.3%).
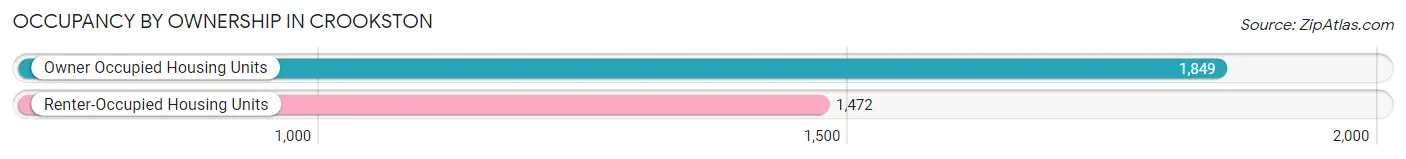
| Occupancy | # Housing Units | % Housing Units |
| Owner Occupied Housing Units | 1,849 | 55.7% |
| Renter-Occupied Housing Units | 1,472 | 44.3% |
| Total Occupied Housing Units | 3,321 | 100.0% |
Occupancy by Household Size in Crookston
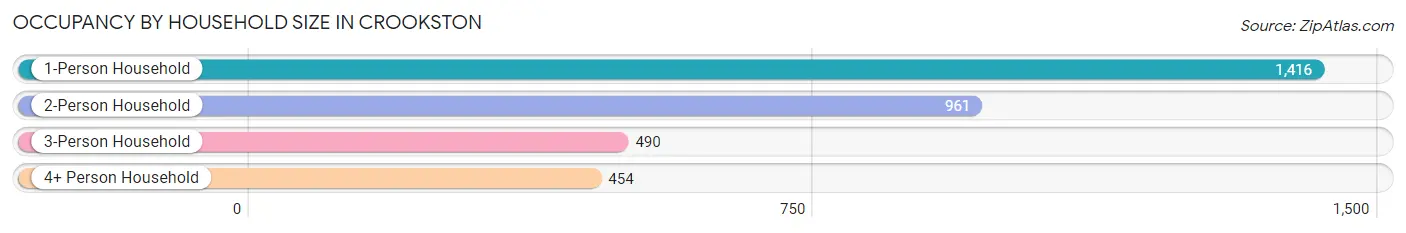
| Household Size | # Housing Units | % Housing Units |
| 1-Person Household | 1,416 | 42.6% |
| 2-Person Household | 961 | 28.9% |
| 3-Person Household | 490 | 14.7% |
| 4+ Person Household | 454 | 13.7% |
| Total Housing Units | 3,321 | 100.0% |
Occupancy by Ownership by Household Size in Crookston
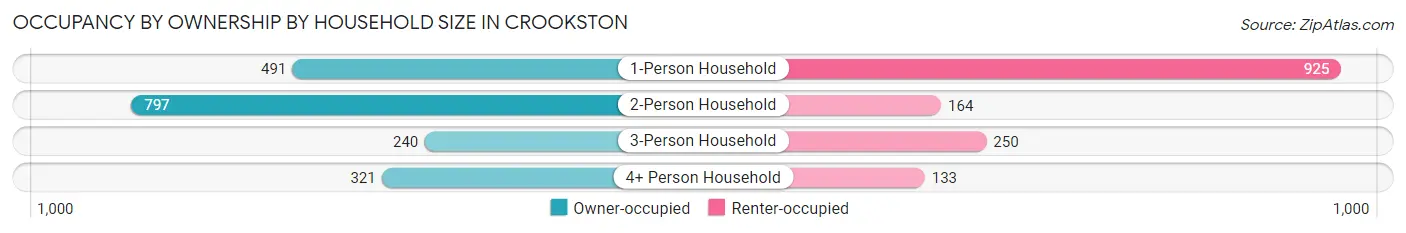
| Household Size | Owner-occupied | Renter-occupied |
| 1-Person Household | 491 (34.7%) | 925 (65.3%) |
| 2-Person Household | 797 (82.9%) | 164 (17.1%) |
| 3-Person Household | 240 (49.0%) | 250 (51.0%) |
| 4+ Person Household | 321 (70.7%) | 133 (29.3%) |
| Total Housing Units | 1,849 (55.7%) | 1,472 (44.3%) |
Occupancy by Educational Attainment in Crookston
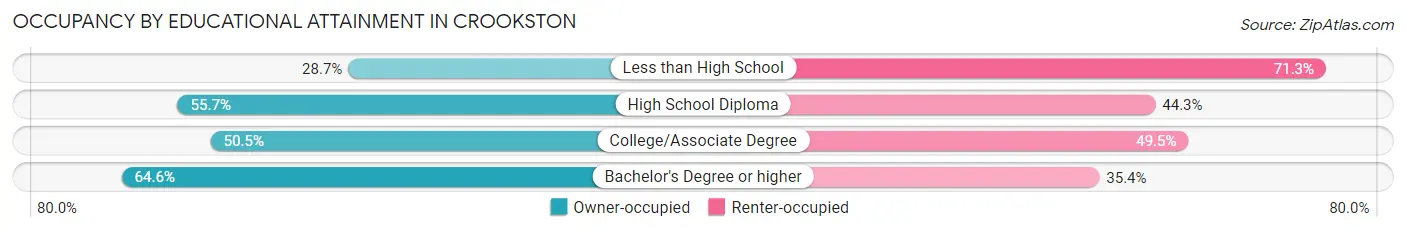
| Household Size | Owner-occupied | Renter-occupied |
| Less than High School | 37 (28.7%) | 92 (71.3%) |
| High School Diploma | 604 (55.7%) | 480 (44.3%) |
| College/Associate Degree | 551 (50.5%) | 540 (49.5%) |
| Bachelor's Degree or higher | 657 (64.6%) | 360 (35.4%) |
Occupancy by Age of Householder in Crookston
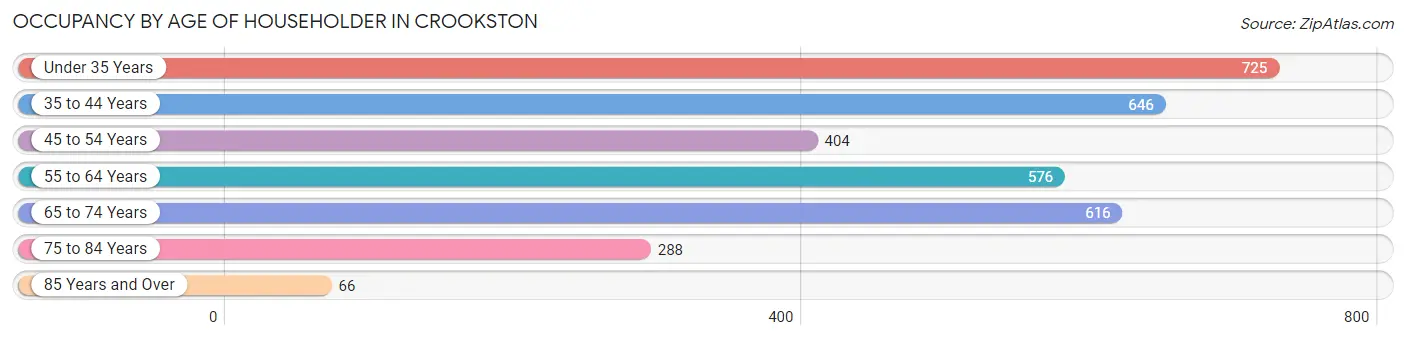
| Age Bracket | # Households | % Households |
| Under 35 Years | 725 | 21.8% |
| 35 to 44 Years | 646 | 19.5% |
| 45 to 54 Years | 404 | 12.2% |
| 55 to 64 Years | 576 | 17.3% |
| 65 to 74 Years | 616 | 18.5% |
| 75 to 84 Years | 288 | 8.7% |
| 85 Years and Over | 66 | 2.0% |
| Total | 3,321 | 100.0% |
Housing Finances in Crookston
Median Income by Occupancy in Crookston
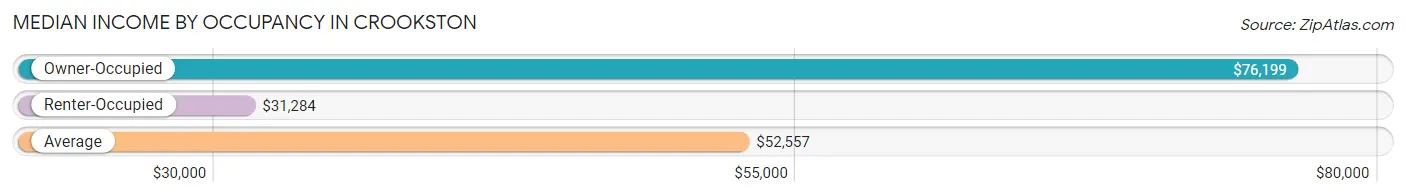
| Occupancy Type | # Households | Median Income |
| Owner-Occupied | 1,849 (55.7%) | $76,199 |
| Renter-Occupied | 1,472 (44.3%) | $31,284 |
| Average | 3,321 (100.0%) | $52,557 |
Occupancy by Householder Income Bracket in Crookston
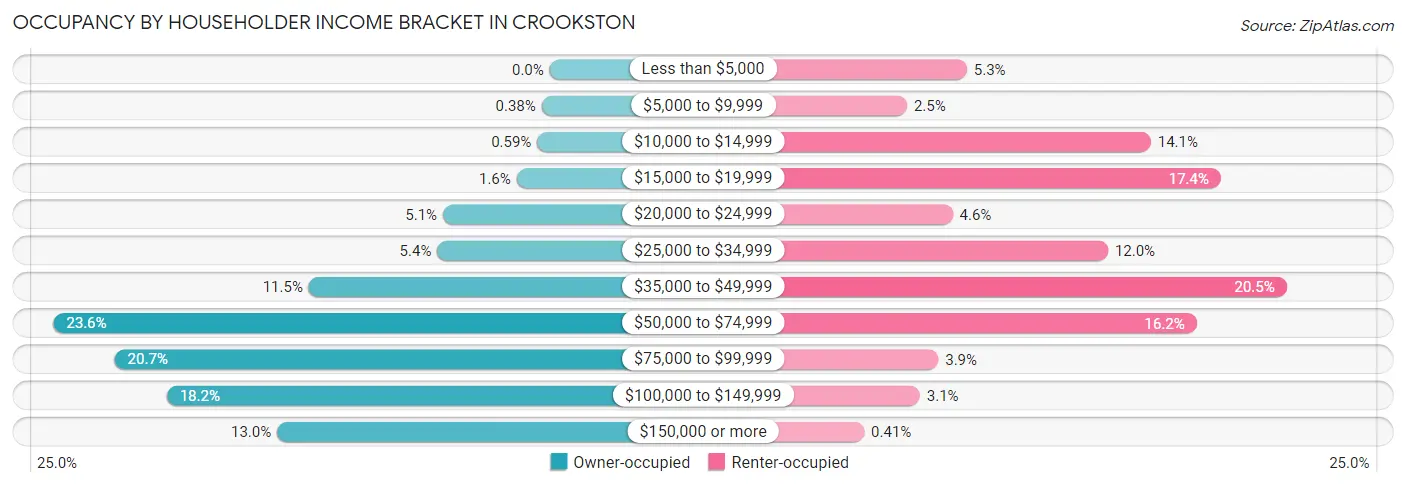
| Income Bracket | Owner-occupied | Renter-occupied |
| Less than $5,000 | 0 (0.0%) | 78 (5.3%) |
| $5,000 to $9,999 | 7 (0.4%) | 36 (2.5%) |
| $10,000 to $14,999 | 11 (0.6%) | 207 (14.1%) |
| $15,000 to $19,999 | 29 (1.6%) | 256 (17.4%) |
| $20,000 to $24,999 | 94 (5.1%) | 68 (4.6%) |
| $25,000 to $34,999 | 99 (5.3%) | 177 (12.0%) |
| $35,000 to $49,999 | 212 (11.5%) | 302 (20.5%) |
| $50,000 to $74,999 | 437 (23.6%) | 239 (16.2%) |
| $75,000 to $99,999 | 383 (20.7%) | 58 (3.9%) |
| $100,000 to $149,999 | 337 (18.2%) | 45 (3.1%) |
| $150,000 or more | 240 (13.0%) | 6 (0.4%) |
| Total | 1,849 (100.0%) | 1,472 (100.0%) |
Monthly Housing Cost Tiers in Crookston
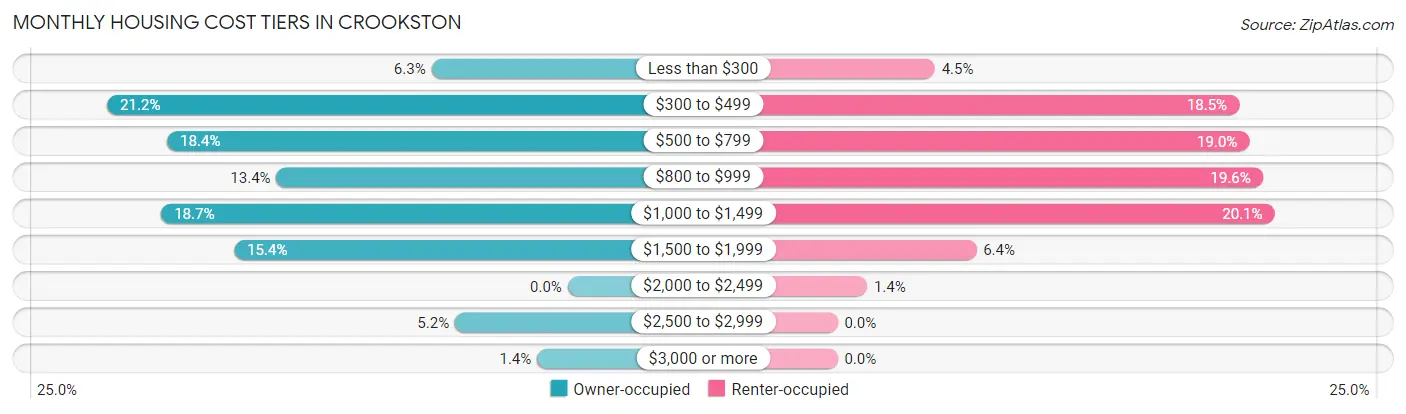
| Monthly Cost | Owner-occupied | Renter-occupied |
| Less than $300 | 116 (6.3%) | 66 (4.5%) |
| $300 to $499 | 392 (21.2%) | 272 (18.5%) |
| $500 to $799 | 341 (18.4%) | 279 (19.0%) |
| $800 to $999 | 248 (13.4%) | 288 (19.6%) |
| $1,000 to $1,499 | 346 (18.7%) | 296 (20.1%) |
| $1,500 to $1,999 | 284 (15.4%) | 94 (6.4%) |
| $2,000 to $2,499 | 0 (0.0%) | 20 (1.4%) |
| $2,500 to $2,999 | 96 (5.2%) | 0 (0.0%) |
| $3,000 or more | 26 (1.4%) | 0 (0.0%) |
| Total | 1,849 (100.0%) | 1,472 (100.0%) |
Physical Housing Characteristics in Crookston
Housing Structures in Crookston
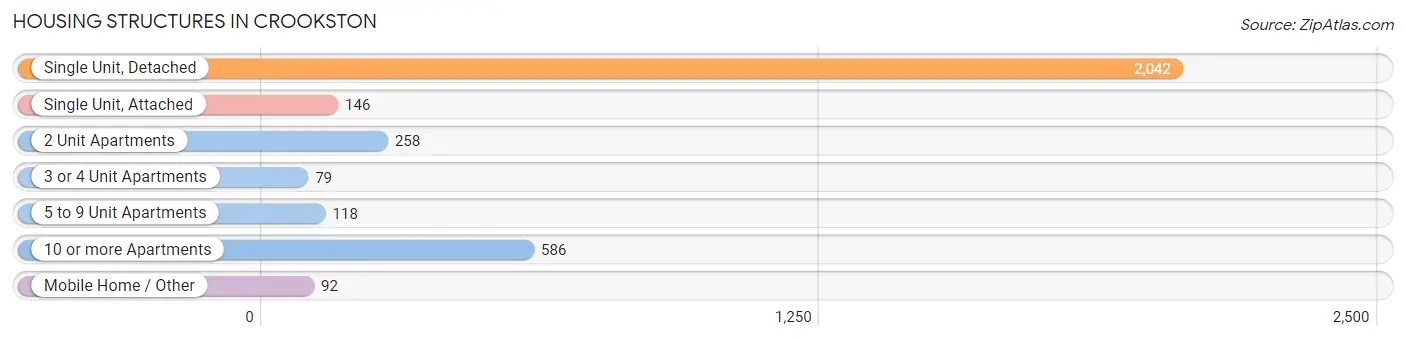
| Structure Type | # Housing Units | % Housing Units |
| Single Unit, Detached | 2,042 | 61.5% |
| Single Unit, Attached | 146 | 4.4% |
| 2 Unit Apartments | 258 | 7.8% |
| 3 or 4 Unit Apartments | 79 | 2.4% |
| 5 to 9 Unit Apartments | 118 | 3.5% |
| 10 or more Apartments | 586 | 17.6% |
| Mobile Home / Other | 92 | 2.8% |
| Total | 3,321 | 100.0% |
Housing Structures by Occupancy in Crookston
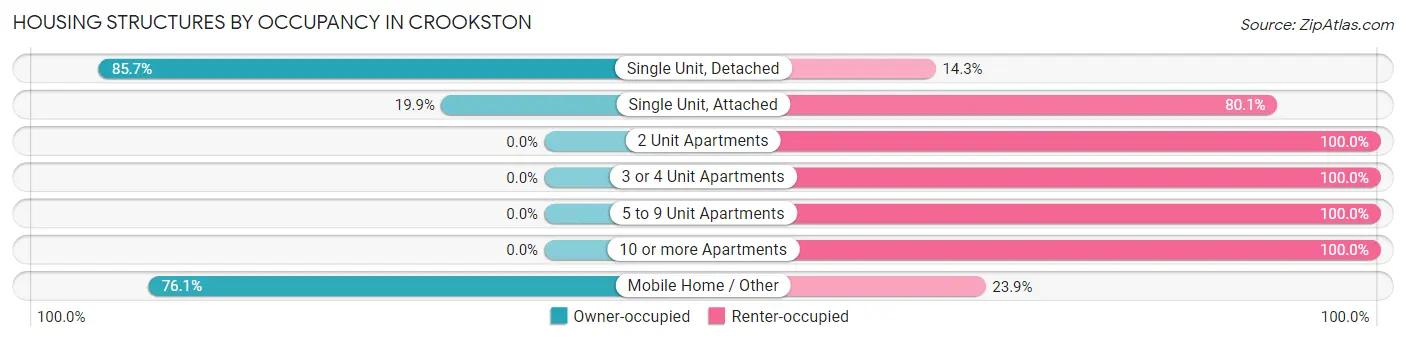
| Structure Type | Owner-occupied | Renter-occupied |
| Single Unit, Detached | 1,750 (85.7%) | 292 (14.3%) |
| Single Unit, Attached | 29 (19.9%) | 117 (80.1%) |
| 2 Unit Apartments | 0 (0.0%) | 258 (100.0%) |
| 3 or 4 Unit Apartments | 0 (0.0%) | 79 (100.0%) |
| 5 to 9 Unit Apartments | 0 (0.0%) | 118 (100.0%) |
| 10 or more Apartments | 0 (0.0%) | 586 (100.0%) |
| Mobile Home / Other | 70 (76.1%) | 22 (23.9%) |
| Total | 1,849 (55.7%) | 1,472 (44.3%) |
Housing Structures by Number of Rooms in Crookston
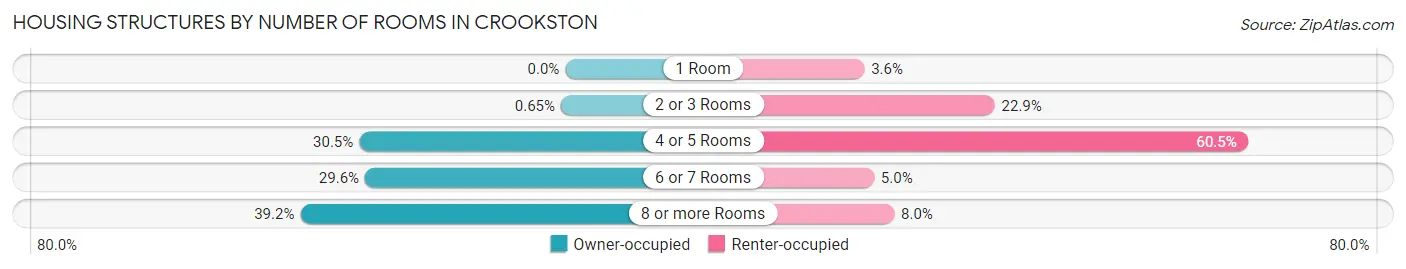
| Number of Rooms | Owner-occupied | Renter-occupied |
| 1 Room | 0 (0.0%) | 53 (3.6%) |
| 2 or 3 Rooms | 12 (0.6%) | 337 (22.9%) |
| 4 or 5 Rooms | 564 (30.5%) | 890 (60.5%) |
| 6 or 7 Rooms | 548 (29.6%) | 74 (5.0%) |
| 8 or more Rooms | 725 (39.2%) | 118 (8.0%) |
| Total | 1,849 (100.0%) | 1,472 (100.0%) |
Housing Structure by Heating Type in Crookston
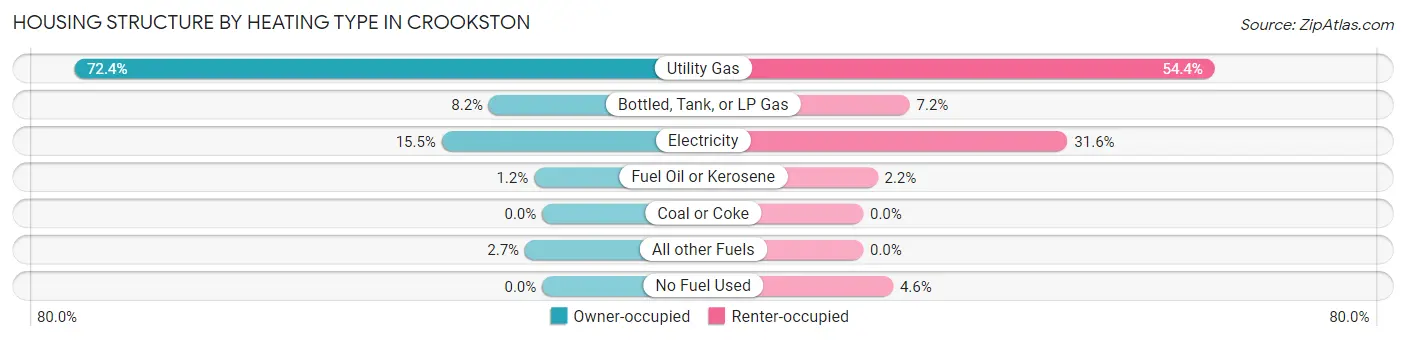
| Heating Type | Owner-occupied | Renter-occupied |
| Utility Gas | 1,338 (72.4%) | 800 (54.3%) |
| Bottled, Tank, or LP Gas | 152 (8.2%) | 106 (7.2%) |
| Electricity | 287 (15.5%) | 465 (31.6%) |
| Fuel Oil or Kerosene | 23 (1.2%) | 33 (2.2%) |
| Coal or Coke | 0 (0.0%) | 0 (0.0%) |
| All other Fuels | 49 (2.6%) | 0 (0.0%) |
| No Fuel Used | 0 (0.0%) | 68 (4.6%) |
| Total | 1,849 (100.0%) | 1,472 (100.0%) |
Household Vehicle Usage in Crookston
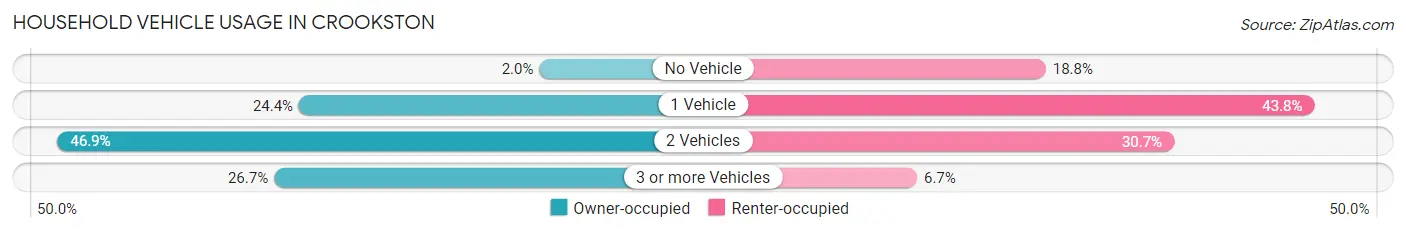
| Vehicles per Household | Owner-occupied | Renter-occupied |
| No Vehicle | 36 (1.9%) | 276 (18.8%) |
| 1 Vehicle | 451 (24.4%) | 645 (43.8%) |
| 2 Vehicles | 868 (46.9%) | 452 (30.7%) |
| 3 or more Vehicles | 494 (26.7%) | 99 (6.7%) |
| Total | 1,849 (100.0%) | 1,472 (100.0%) |
Real Estate & Mortgages in Crookston
Real Estate and Mortgage Overview in Crookston
| Characteristic | Without Mortgage | With Mortgage |
| Housing Units | 805 | 1,044 |
| Median Property Value | $156,600 | $164,300 |
| Median Household Income | $66,283 | $159 |
| Monthly Housing Costs | $456 | $26 |
| Real Estate Taxes | $2,030 | $16 |
Property Value by Mortgage Status in Crookston
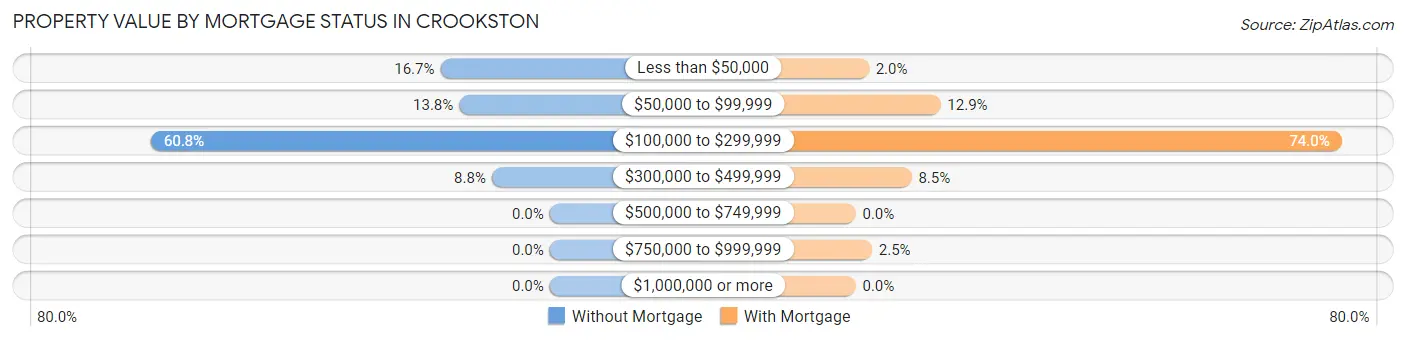
| Property Value | Without Mortgage | With Mortgage |
| Less than $50,000 | 134 (16.7%) | 21 (2.0%) |
| $50,000 to $99,999 | 111 (13.8%) | 135 (12.9%) |
| $100,000 to $299,999 | 489 (60.8%) | 773 (74.0%) |
| $300,000 to $499,999 | 71 (8.8%) | 89 (8.5%) |
| $500,000 to $749,999 | 0 (0.0%) | 0 (0.0%) |
| $750,000 to $999,999 | 0 (0.0%) | 26 (2.5%) |
| $1,000,000 or more | 0 (0.0%) | 0 (0.0%) |
| Total | 805 (100.0%) | 1,044 (100.0%) |
Household Income by Mortgage Status in Crookston
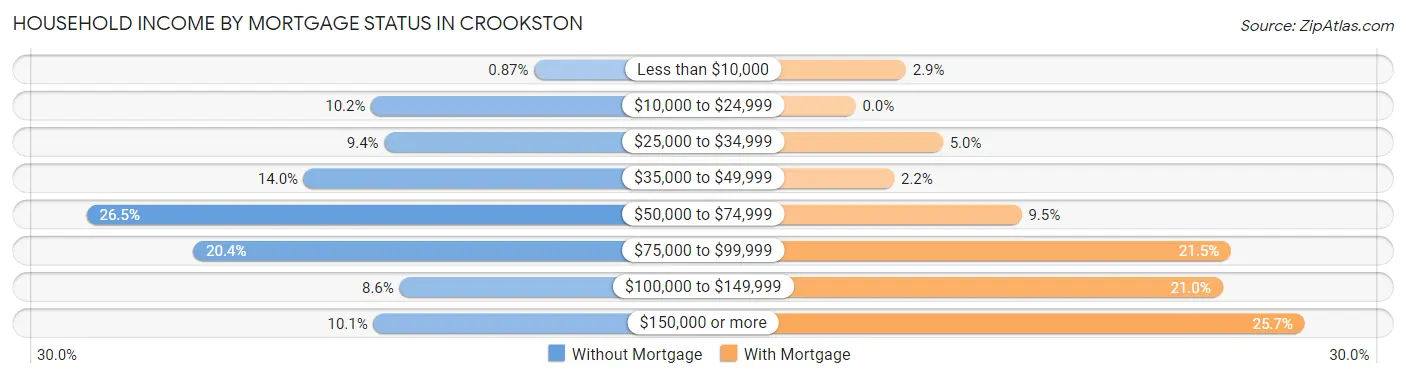
| Household Income | Without Mortgage | With Mortgage |
| Less than $10,000 | 7 (0.9%) | 30 (2.9%) |
| $10,000 to $24,999 | 82 (10.2%) | 0 (0.0%) |
| $25,000 to $34,999 | 76 (9.4%) | 52 (5.0%) |
| $35,000 to $49,999 | 113 (14.0%) | 23 (2.2%) |
| $50,000 to $74,999 | 213 (26.5%) | 99 (9.5%) |
| $75,000 to $99,999 | 164 (20.4%) | 224 (21.5%) |
| $100,000 to $149,999 | 69 (8.6%) | 219 (21.0%) |
| $150,000 or more | 81 (10.1%) | 268 (25.7%) |
| Total | 805 (100.0%) | 1,044 (100.0%) |
Property Value to Household Income Ratio in Crookston
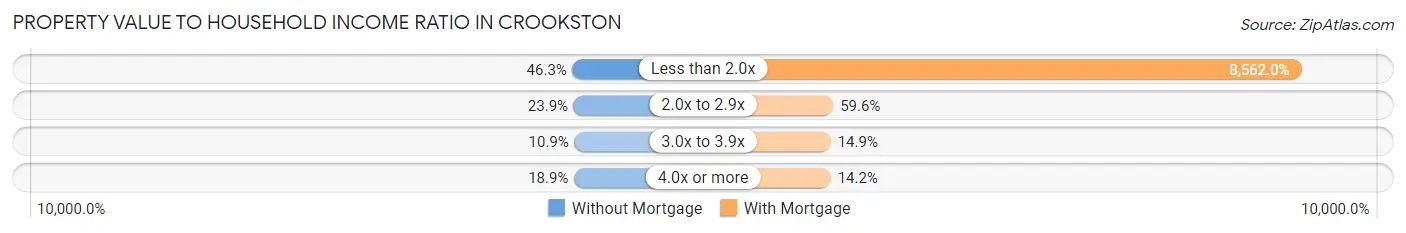
| Value-to-Income Ratio | Without Mortgage | With Mortgage |
| Less than 2.0x | 373 (46.3%) | 89,387 (8,562.0%) |
| 2.0x to 2.9x | 192 (23.8%) | 622 (59.6%) |
| 3.0x to 3.9x | 88 (10.9%) | 156 (14.9%) |
| 4.0x or more | 152 (18.9%) | 148 (14.2%) |
| Total | 805 (100.0%) | 1,044 (100.0%) |
Real Estate Taxes by Mortgage Status in Crookston
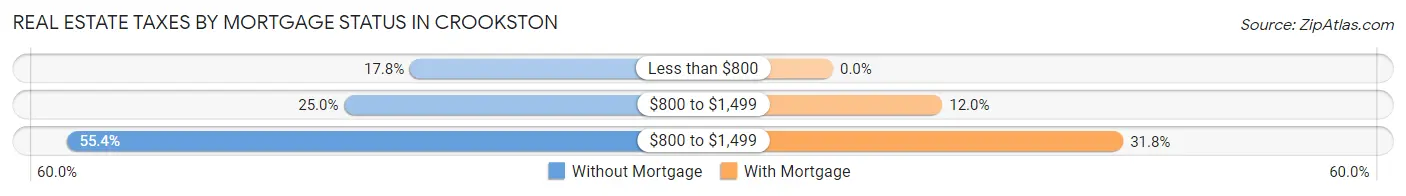
| Property Taxes | Without Mortgage | With Mortgage |
| Less than $800 | 143 (17.8%) | 0 (0.0%) |
| $800 to $1,499 | 201 (25.0%) | 125 (12.0%) |
| $800 to $1,499 | 446 (55.4%) | 332 (31.8%) |
| Total | 805 (100.0%) | 1,044 (100.0%) |
Health & Disability in Crookston
Health Insurance Coverage by Age in Crookston
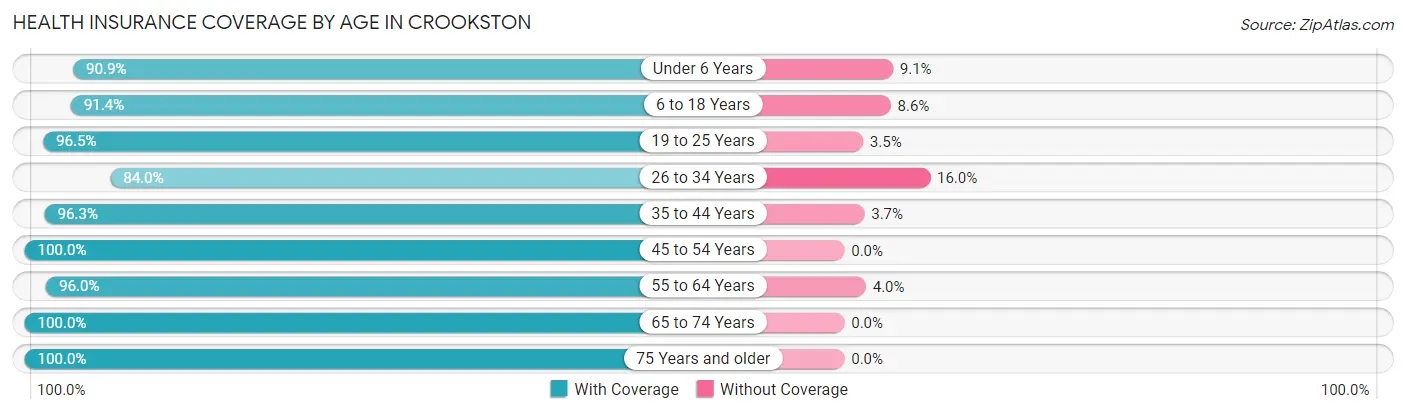
| Age Bracket | With Coverage | Without Coverage |
| Under 6 Years | 482 (90.9%) | 48 (9.1%) |
| 6 to 18 Years | 985 (91.4%) | 93 (8.6%) |
| 19 to 25 Years | 695 (96.5%) | 25 (3.5%) |
| 26 to 34 Years | 767 (84.0%) | 146 (16.0%) |
| 35 to 44 Years | 981 (96.3%) | 38 (3.7%) |
| 45 to 54 Years | 717 (100.0%) | 0 (0.0%) |
| 55 to 64 Years | 861 (96.0%) | 36 (4.0%) |
| 65 to 74 Years | 887 (100.0%) | 0 (0.0%) |
| 75 Years and older | 547 (100.0%) | 0 (0.0%) |
| Total | 6,922 (94.7%) | 386 (5.3%) |
Health Insurance Coverage by Citizenship Status in Crookston
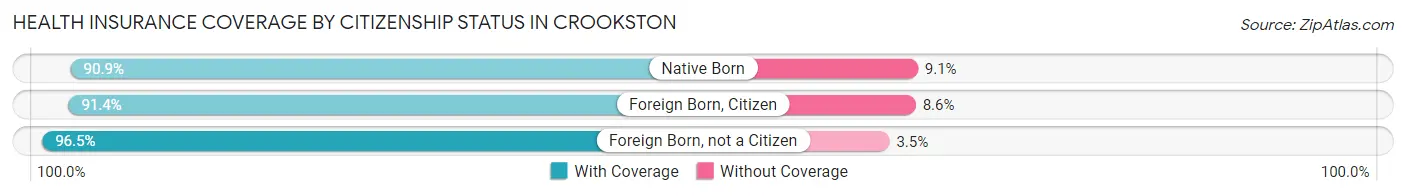
| Citizenship Status | With Coverage | Without Coverage |
| Native Born | 482 (90.9%) | 48 (9.1%) |
| Foreign Born, Citizen | 985 (91.4%) | 93 (8.6%) |
| Foreign Born, not a Citizen | 695 (96.5%) | 25 (3.5%) |
Health Insurance Coverage by Household Income in Crookston
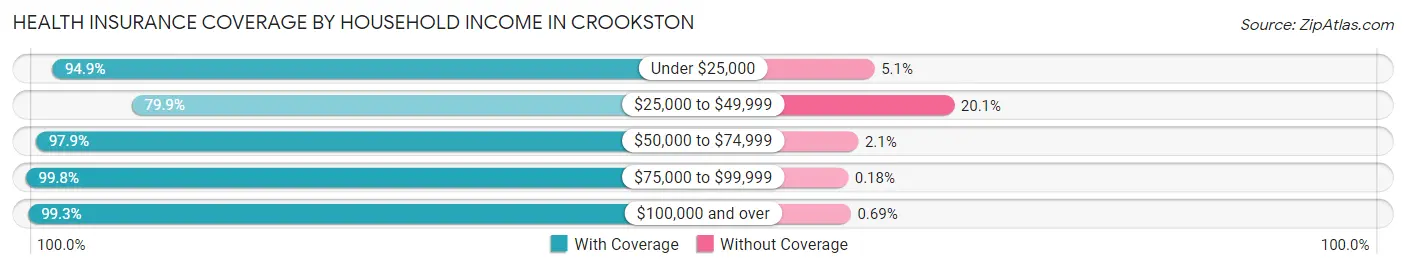
| Household Income | With Coverage | Without Coverage |
| Under $25,000 | 959 (94.9%) | 52 (5.1%) |
| $25,000 to $49,999 | 1,148 (79.9%) | 288 (20.1%) |
| $50,000 to $74,999 | 1,402 (97.9%) | 30 (2.1%) |
| $75,000 to $99,999 | 1,139 (99.8%) | 2 (0.2%) |
| $100,000 and over | 1,728 (99.3%) | 12 (0.7%) |
Public vs Private Health Insurance Coverage by Age in Crookston
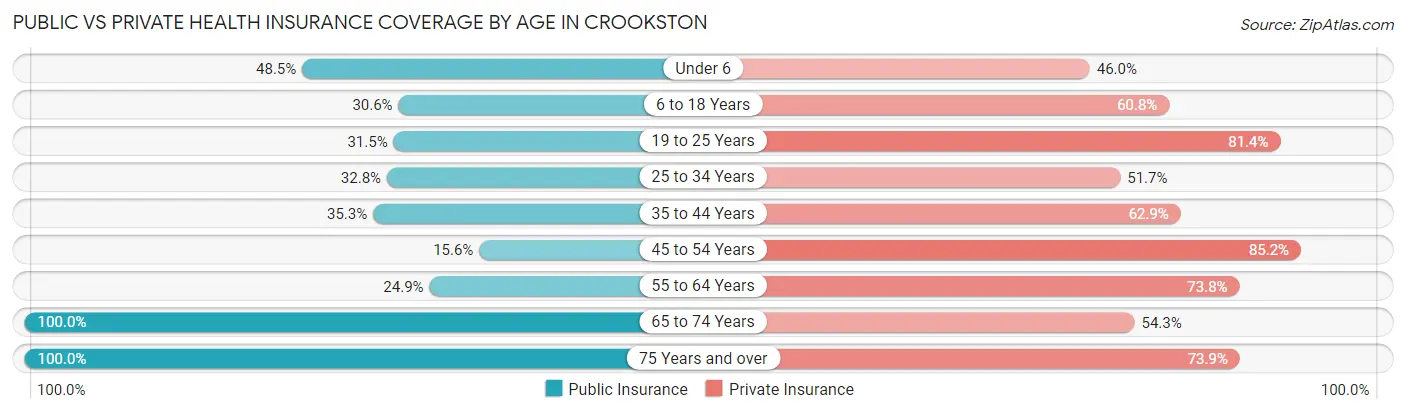
| Age Bracket | Public Insurance | Private Insurance |
| Under 6 | 257 (48.5%) | 244 (46.0%) |
| 6 to 18 Years | 330 (30.6%) | 655 (60.8%) |
| 19 to 25 Years | 227 (31.5%) | 586 (81.4%) |
| 25 to 34 Years | 299 (32.8%) | 472 (51.7%) |
| 35 to 44 Years | 360 (35.3%) | 641 (62.9%) |
| 45 to 54 Years | 112 (15.6%) | 611 (85.2%) |
| 55 to 64 Years | 223 (24.9%) | 662 (73.8%) |
| 65 to 74 Years | 887 (100.0%) | 482 (54.3%) |
| 75 Years and over | 547 (100.0%) | 404 (73.9%) |
| Total | 3,242 (44.4%) | 4,757 (65.1%) |
Disability Status by Sex by Age in Crookston
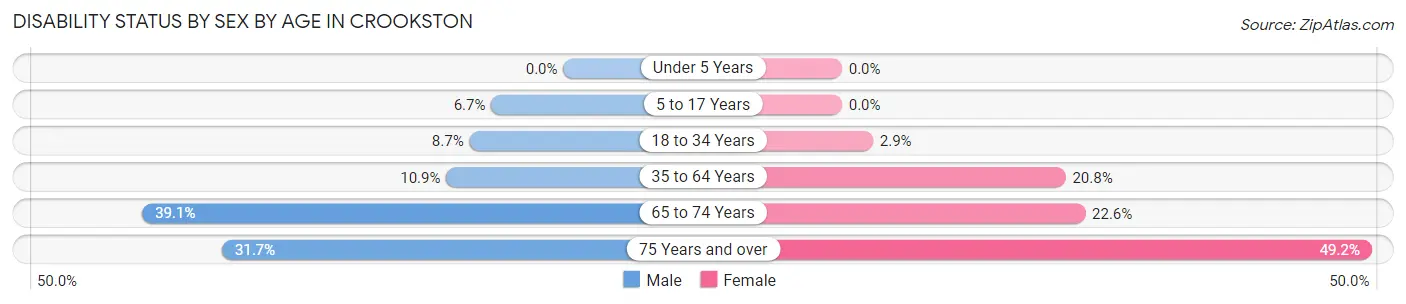
| Age Bracket | Male | Female |
| Under 5 Years | 0 (0.0%) | 0 (0.0%) |
| 5 to 17 Years | 38 (6.7%) | 0 (0.0%) |
| 18 to 34 Years | 77 (8.7%) | 25 (2.9%) |
| 35 to 64 Years | 140 (10.9%) | 279 (20.8%) |
| 65 to 74 Years | 165 (39.1%) | 105 (22.6%) |
| 75 Years and over | 58 (31.7%) | 179 (49.2%) |
Disability Class by Sex by Age in Crookston
Disability Class: Hearing Difficulty
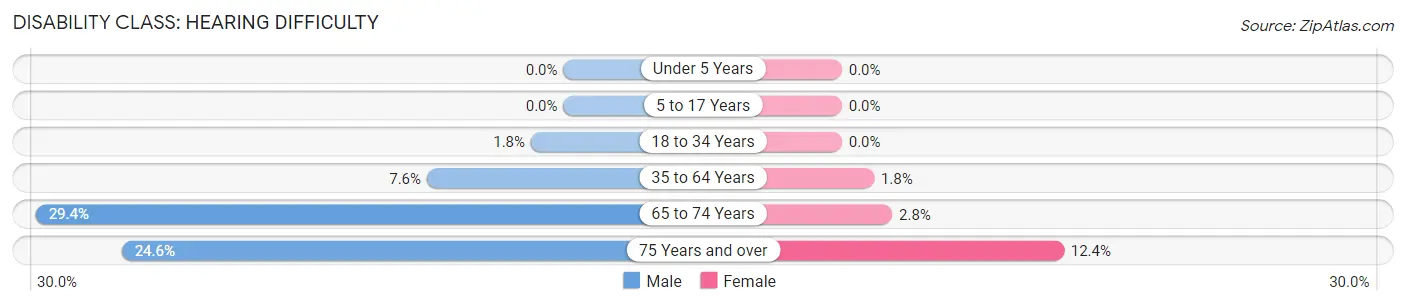
| Age Bracket | Male | Female |
| Under 5 Years | 0 (0.0%) | 0 (0.0%) |
| 5 to 17 Years | 0 (0.0%) | 0 (0.0%) |
| 18 to 34 Years | 16 (1.8%) | 0 (0.0%) |
| 35 to 64 Years | 98 (7.6%) | 24 (1.8%) |
| 65 to 74 Years | 124 (29.4%) | 13 (2.8%) |
| 75 Years and over | 45 (24.6%) | 45 (12.4%) |
Disability Class: Vision Difficulty
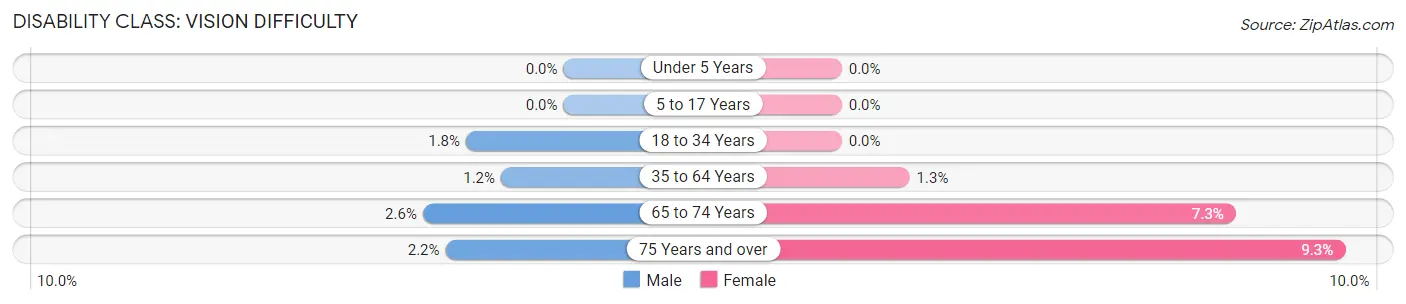
| Age Bracket | Male | Female |
| Under 5 Years | 0 (0.0%) | 0 (0.0%) |
| 5 to 17 Years | 0 (0.0%) | 0 (0.0%) |
| 18 to 34 Years | 16 (1.8%) | 0 (0.0%) |
| 35 to 64 Years | 15 (1.2%) | 17 (1.3%) |
| 65 to 74 Years | 11 (2.6%) | 34 (7.3%) |
| 75 Years and over | 4 (2.2%) | 34 (9.3%) |
Disability Class: Cognitive Difficulty
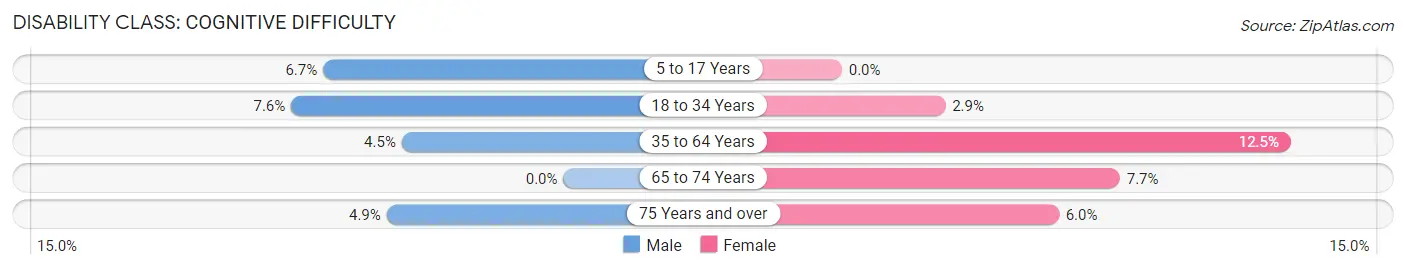
| Age Bracket | Male | Female |
| 5 to 17 Years | 38 (6.7%) | 0 (0.0%) |
| 18 to 34 Years | 67 (7.6%) | 25 (2.9%) |
| 35 to 64 Years | 58 (4.5%) | 168 (12.5%) |
| 65 to 74 Years | 0 (0.0%) | 36 (7.7%) |
| 75 Years and over | 9 (4.9%) | 22 (6.0%) |
Disability Class: Ambulatory Difficulty
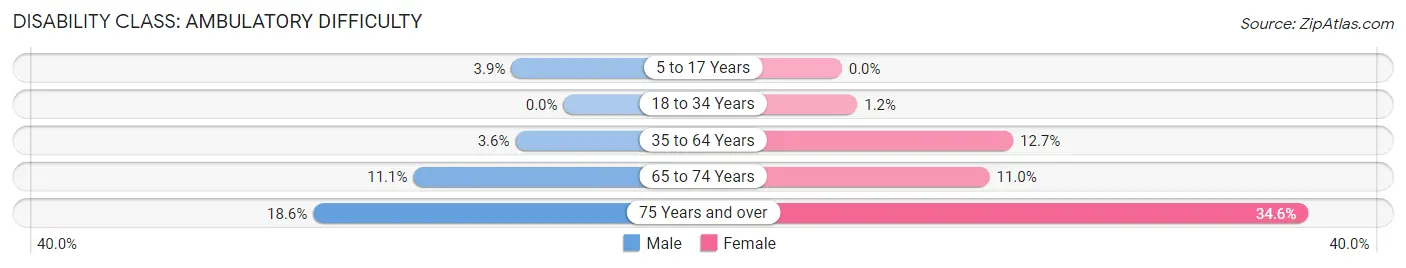
| Age Bracket | Male | Female |
| 5 to 17 Years | 22 (3.9%) | 0 (0.0%) |
| 18 to 34 Years | 0 (0.0%) | 10 (1.1%) |
| 35 to 64 Years | 46 (3.6%) | 171 (12.7%) |
| 65 to 74 Years | 47 (11.1%) | 51 (11.0%) |
| 75 Years and over | 34 (18.6%) | 126 (34.6%) |
Disability Class: Self-Care Difficulty
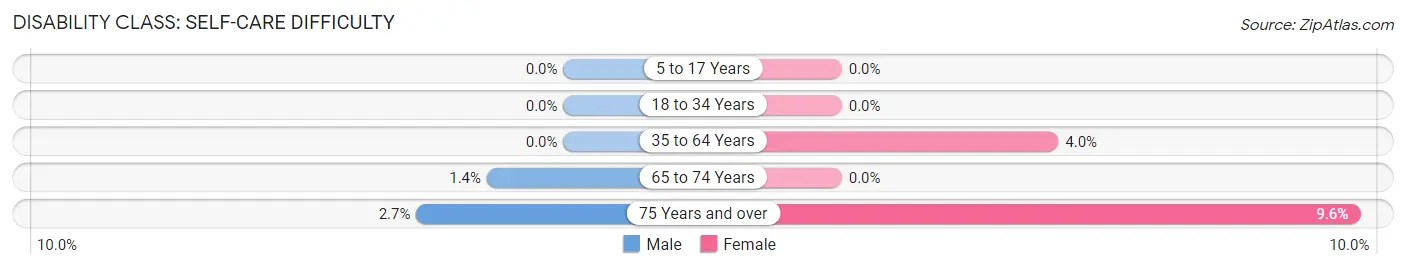
| Age Bracket | Male | Female |
| 5 to 17 Years | 0 (0.0%) | 0 (0.0%) |
| 18 to 34 Years | 0 (0.0%) | 0 (0.0%) |
| 35 to 64 Years | 0 (0.0%) | 54 (4.0%) |
| 65 to 74 Years | 6 (1.4%) | 0 (0.0%) |
| 75 Years and over | 5 (2.7%) | 35 (9.6%) |
Technology Access in Crookston
Computing Device Access in Crookston
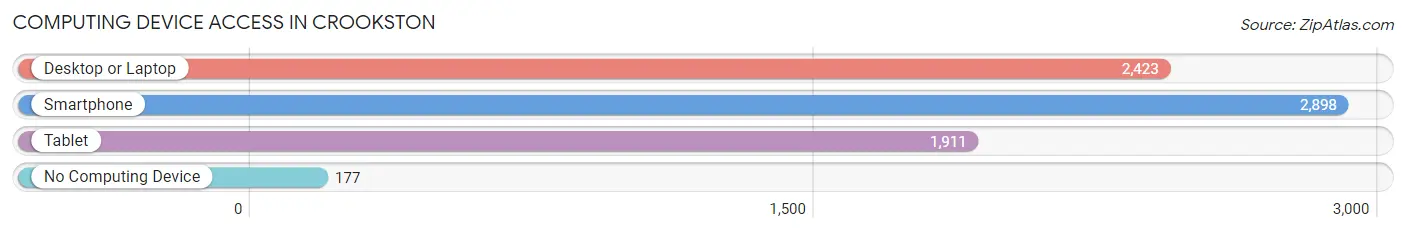
| Device Type | # Households | % Households |
| Desktop or Laptop | 2,423 | 73.0% |
| Smartphone | 2,898 | 87.3% |
| Tablet | 1,911 | 57.5% |
| No Computing Device | 177 | 5.3% |
| Total | 3,321 | 100.0% |
Internet Access in Crookston
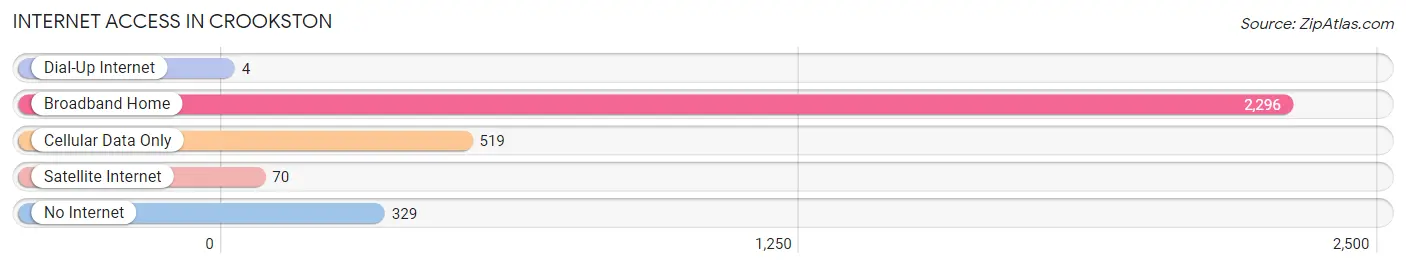
| Internet Type | # Households | % Households |
| Dial-Up Internet | 4 | 0.1% |
| Broadband Home | 2,296 | 69.1% |
| Cellular Data Only | 519 | 15.6% |
| Satellite Internet | 70 | 2.1% |
| No Internet | 329 | 9.9% |
| Total | 3,321 | 100.0% |
Crookston Summary
Crookston, Minnesota is a small city located in the northwest corner of the state, in Polk County. It is situated on the banks of the Red Lake River, and is the county seat of Polk County. The city has a population of 8,569, according to the 2010 census.
History
Crookston was founded in 1873 by a group of settlers from Norway, Sweden, and Germany. The city was named after William Crooks, a prominent railroad executive. The city was incorporated in 1881, and the first mayor was elected in 1882.
The city grew rapidly in the late 19th century, and by the early 20th century, it had become a major agricultural center. The city was also home to several large industries, including a sugar beet factory, a flour mill, and a lumber mill.
Geography
Crookston is located in the northwest corner of Minnesota, in Polk County. It is situated on the banks of the Red Lake River, and is the county seat of Polk County. The city has a total area of 4.2 square miles, all of which is land.
The city is located in a flat, open area, with rolling hills to the north and east. The Red Lake River flows through the city, and there are several small lakes in the area. The climate is humid continental, with cold winters and hot summers.
Economy
Crookston is a major agricultural center, and the city’s economy is largely based on farming and related industries. The city is home to several large agricultural companies, including the Crookston Seed Company, the Crookston Grain Company, and the Crookston Dairy Company.
The city is also home to several manufacturing companies, including a furniture factory, a plastics factory, and a printing company. The city is also home to several retail stores, restaurants, and other businesses.
Demographics
According to the 2010 census, the population of Crookston was 8,569. The racial makeup of the city was 94.3% White, 0.7% African American, 0.3% Native American, 0.7% Asian, 0.1% Pacific Islander, 2.2% from other races, and 1.9% from two or more races. Hispanic or Latino of any race were 4.2% of the population.
The median income for a household in the city was $37,917, and the median income for a family was $45,917. The per capita income for the city was $18,917. About 11.3% of families and 14.2% of the population were below the poverty line, including 19.2% of those under age 18 and 8.2% of those age 65 or over.
Crookston is a small city with a rich history and a diverse economy. The city is home to several large agricultural companies, manufacturing companies, and retail stores. The city has a diverse population, with a median income that is slightly below the state average. The city is a great place to live, work, and raise a family.
Common Questions
What is Per Capita Income in Crookston?
Per Capita income in Crookston is $31,017.
What is the Median Family Income in Crookston?
Median Family Income in Crookston is $76,392.
What is the Median Household income in Crookston?
Median Household Income in Crookston is $52,557.
What is Income or Wage Gap in Crookston?
Income or Wage Gap in Crookston is 42.3%.
Women in Crookston earn 57.7 cents for every dollar earned by a man.
What is Inequality or Gini Index in Crookston?
Inequality or Gini Index in Crookston is 0.42.
What is the Total Population of Crookston?
Total Population of Crookston is 7,472.
What is the Total Male Population of Crookston?
Total Male Population of Crookston is 3,682.
What is the Total Female Population of Crookston?
Total Female Population of Crookston is 3,790.
What is the Ratio of Males per 100 Females in Crookston?
There are 97.15 Males per 100 Females in Crookston.
What is the Ratio of Females per 100 Males in Crookston?
There are 102.93 Females per 100 Males in Crookston.
What is the Median Population Age in Crookston?
Median Population Age in Crookston is 39.4 Years.
What is the Average Family Size in Crookston
Average Family Size in Crookston is 2.8 People.
What is the Average Household Size in Crookston
Average Household Size in Crookston is 2.0 People.
How Large is the Labor Force in Crookston?
There are 3,825 People in the Labor Forcein in Crookston.
What is the Percentage of People in the Labor Force in Crookston?
61.0% of People are in the Labor Force in Crookston.
What is the Unemployment Rate in Crookston?
Unemployment Rate in Crookston is 3.5%.