Annandale, MN Map & Demographics
Annandale Map
Annandale Overview
$30,629
PER CAPITA INCOME
$84,800
AVG FAMILY INCOME
$51,525
AVG HOUSEHOLD INCOME
35.4%
WAGE / INCOME GAP [ % ]
64.6¢/ $1
WAGE / INCOME GAP [ $ ]
0.43
INEQUALITY / GINI INDEX
3,351
TOTAL POPULATION
1,477
MALE POPULATION
1,874
FEMALE POPULATION
78.82
MALES / 100 FEMALES
126.88
FEMALES / 100 MALES
42.6
MEDIAN AGE
2.9
AVG FAMILY SIZE
2.5
AVG HOUSEHOLD SIZE
1,521
LABOR FORCE [ PEOPLE ]
58.2%
PERCENT IN LABOR FORCE
5.7%
UNEMPLOYMENT RATE
Annandale Zip Codes
Annandale Area Codes
Income in Annandale
Income Overview in Annandale
Per Capita Income in Annandale is $30,629, while median incomes of families and households are $84,800 and $51,525 respectively.
| Characteristic | Number | Measure |
| Per Capita Income | 3,351 | $30,629 |
| Median Family Income | 950 | $84,800 |
| Mean Family Income | 950 | $91,115 |
| Median Household Income | 1,314 | $51,525 |
| Mean Household Income | 1,314 | $76,611 |
| Income Deficit | 950 | $0 |
| Wage / Income Gap (%) | 3,351 | 35.36% |
| Wage / Income Gap ($) | 3,351 | 64.64¢ per $1 |
| Gini / Inequality Index | 3,351 | 0.43 |
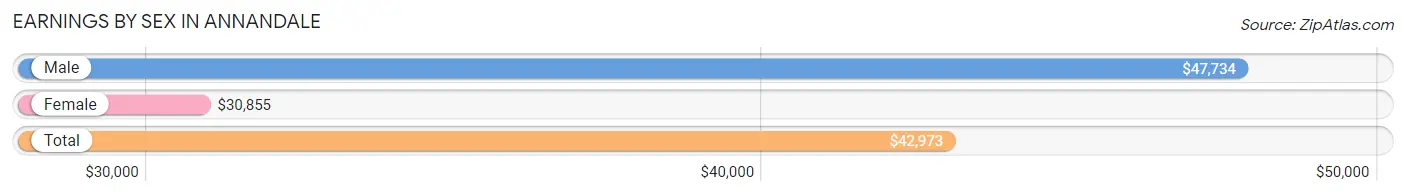
Earnings by Sex in Annandale
Average Earnings in Annandale are $42,973, $47,734 for men and $30,855 for women, a difference of 35.4%.
| Sex | Number | Average Earnings |
| Male | 785 (48.5%) | $47,734 |
| Female | 835 (51.5%) | $30,855 |
| Total | 1,620 (100.0%) | $42,973 |
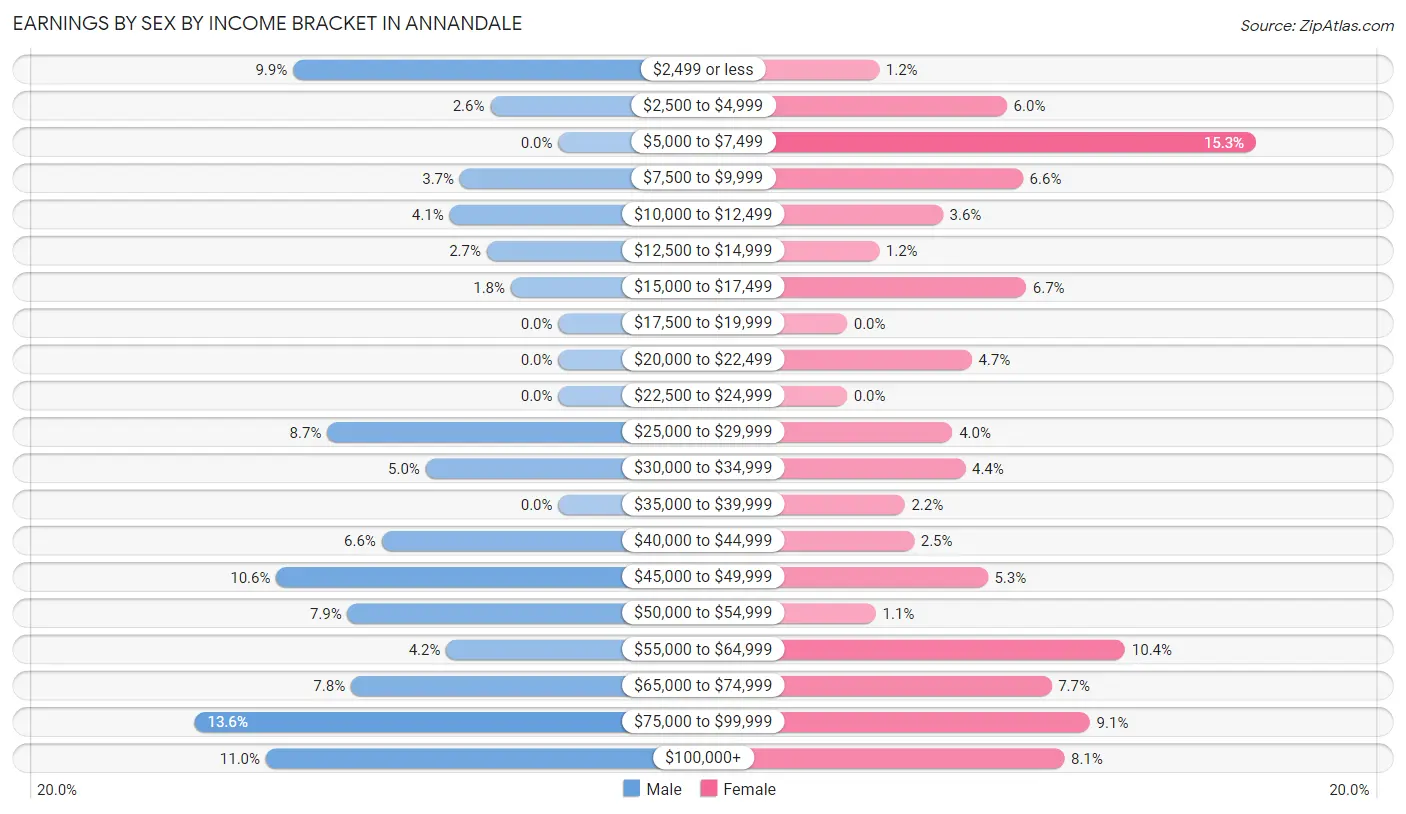
Earnings by Sex by Income Bracket in Annandale
The most common earnings brackets in Annandale are $75,000 to $99,999 for men (107 | 13.6%) and $5,000 to $7,499 for women (128 | 15.3%).
| Income | Male | Female |
| $2,499 or less | 78 (9.9%) | 10 (1.2%) |
| $2,500 to $4,999 | 20 (2.5%) | 50 (6.0%) |
| $5,000 to $7,499 | 0 (0.0%) | 128 (15.3%) |
| $7,500 to $9,999 | 29 (3.7%) | 55 (6.6%) |
| $10,000 to $12,499 | 32 (4.1%) | 30 (3.6%) |
| $12,500 to $14,999 | 21 (2.7%) | 10 (1.2%) |
| $15,000 to $17,499 | 14 (1.8%) | 56 (6.7%) |
| $17,500 to $19,999 | 0 (0.0%) | 0 (0.0%) |
| $20,000 to $22,499 | 0 (0.0%) | 39 (4.7%) |
| $22,500 to $24,999 | 0 (0.0%) | 0 (0.0%) |
| $25,000 to $29,999 | 68 (8.7%) | 33 (4.0%) |
| $30,000 to $34,999 | 39 (5.0%) | 37 (4.4%) |
| $35,000 to $39,999 | 0 (0.0%) | 18 (2.2%) |
| $40,000 to $44,999 | 52 (6.6%) | 21 (2.5%) |
| $45,000 to $49,999 | 83 (10.6%) | 44 (5.3%) |
| $50,000 to $54,999 | 62 (7.9%) | 9 (1.1%) |
| $55,000 to $64,999 | 33 (4.2%) | 87 (10.4%) |
| $65,000 to $74,999 | 61 (7.8%) | 64 (7.7%) |
| $75,000 to $99,999 | 107 (13.6%) | 76 (9.1%) |
| $100,000+ | 86 (11.0%) | 68 (8.1%) |
| Total | 785 (100.0%) | 835 (100.0%) |
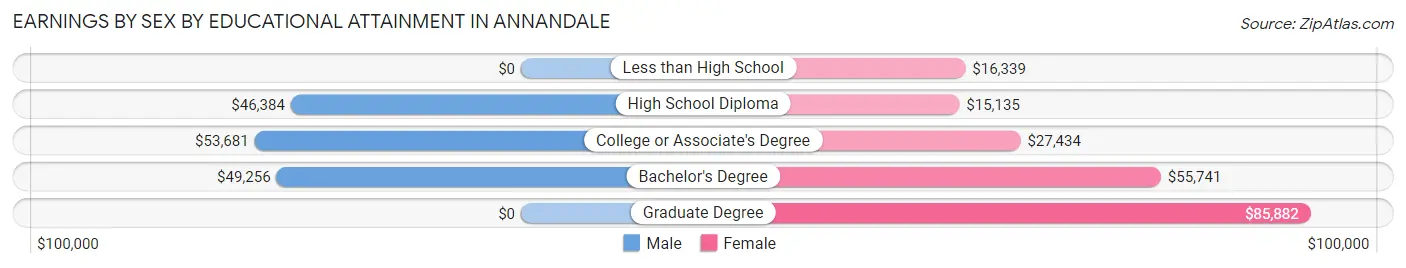
Earnings by Sex by Educational Attainment in Annandale
Average earnings in Annandale are $53,730 for men and $41,429 for women, a difference of 22.9%. Men with an educational attainment of college or associate's degree enjoy the highest average annual earnings of $53,681, while those with high school diploma education earn the least with $46,384. Women with an educational attainment of graduate degree earn the most with the average annual earnings of $85,882, while those with high school diploma education have the smallest earnings of $15,135.
| Educational Attainment | Male Income | Female Income |
| Less than High School | - | - |
| High School Diploma | $46,384 | $15,135 |
| College or Associate's Degree | $53,681 | $27,434 |
| Bachelor's Degree | $49,256 | $55,741 |
| Graduate Degree | - | - |
| Total | $53,730 | $41,429 |
Family Income in Annandale
Family Income Brackets in Annandale
According to the Annandale family income data, there are 186 families falling into the $25,000 to $34,999 income range, which is the most common income bracket and makes up 19.6% of all families. Conversely, the $10,000 to $14,999 income bracket is the least frequent group with only 24 families (2.5%) belonging to this category.
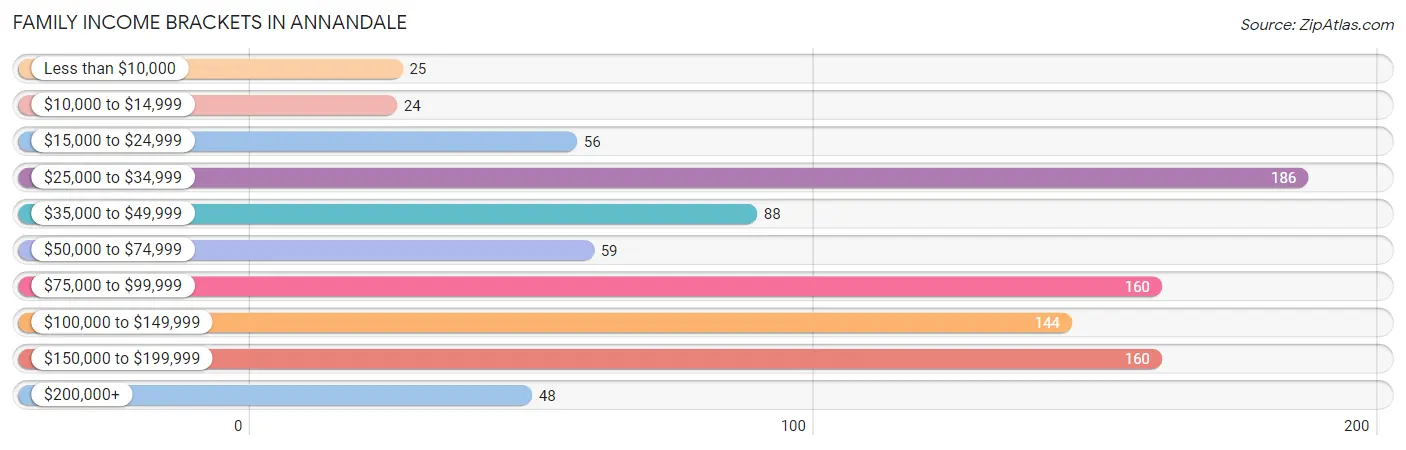
| Income Bracket | # Families | % Families |
| Less than $10,000 | 25 | 2.6% |
| $10,000 to $14,999 | 24 | 2.5% |
| $15,000 to $24,999 | 56 | 5.9% |
| $25,000 to $34,999 | 186 | 19.6% |
| $35,000 to $49,999 | 88 | 9.3% |
| $50,000 to $74,999 | 59 | 6.2% |
| $75,000 to $99,999 | 160 | 16.8% |
| $100,000 to $149,999 | 144 | 15.2% |
| $150,000 to $199,999 | 160 | 16.8% |
| $200,000+ | 48 | 5.1% |
Family Income by Famaliy Size in Annandale
4-person families (109 | 11.5%) account for the highest median family income in Annandale with $136,319 per family, while 4-person families (109 | 11.5%) have the highest median income of $34,080 per family member.
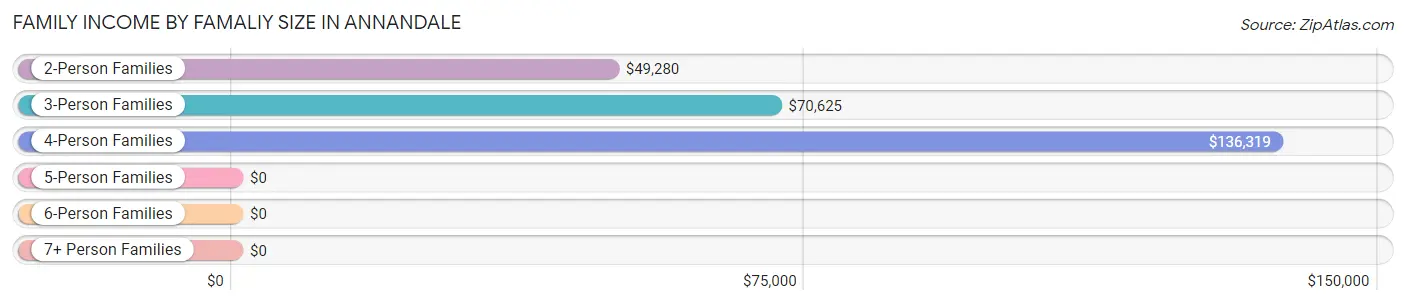
| Income Bracket | # Families | Median Income |
| 2-Person Families | 569 (59.9%) | $49,280 |
| 3-Person Families | 162 (17.1%) | $70,625 |
| 4-Person Families | 109 (11.5%) | $136,319 |
| 5-Person Families | 53 (5.6%) | $0 |
| 6-Person Families | 45 (4.7%) | $0 |
| 7+ Person Families | 12 (1.3%) | $0 |
| Total | 950 (100.0%) | $84,800 |
Family Income by Number of Earners in Annandale
The median family income in Annandale is $84,800, with families comprising 3+ earners (150) having the highest median family income of $164,333, while families with no earners (259) have the lowest median family income of $34,222, accounting for 15.8% and 27.3% of families, respectively.
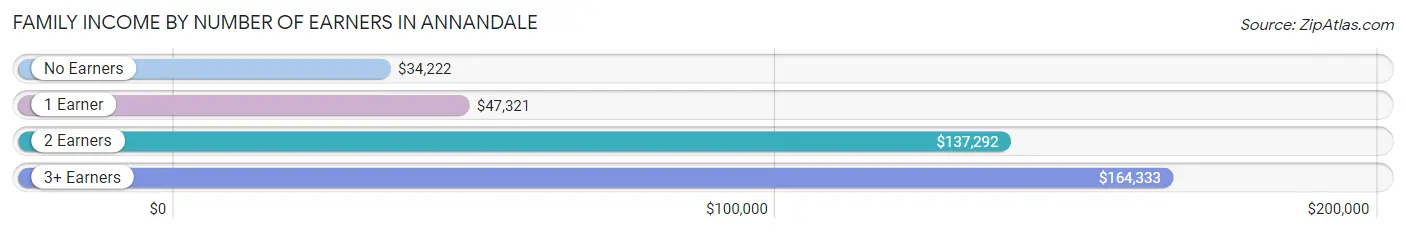
| Number of Earners | # Families | Median Income |
| No Earners | 259 (27.3%) | $34,222 |
| 1 Earner | 260 (27.4%) | $47,321 |
| 2 Earners | 281 (29.6%) | $137,292 |
| 3+ Earners | 150 (15.8%) | $164,333 |
| Total | 950 (100.0%) | $84,800 |
Household Income in Annandale
Household Income Brackets in Annandale
With 268 households falling in the category, the $25,000 to $34,999 income range is the most frequent in Annandale, accounting for 20.4% of all households. In contrast, only 25 households (1.9%) fall into the less than $10,000 income bracket, making it the least populous group.
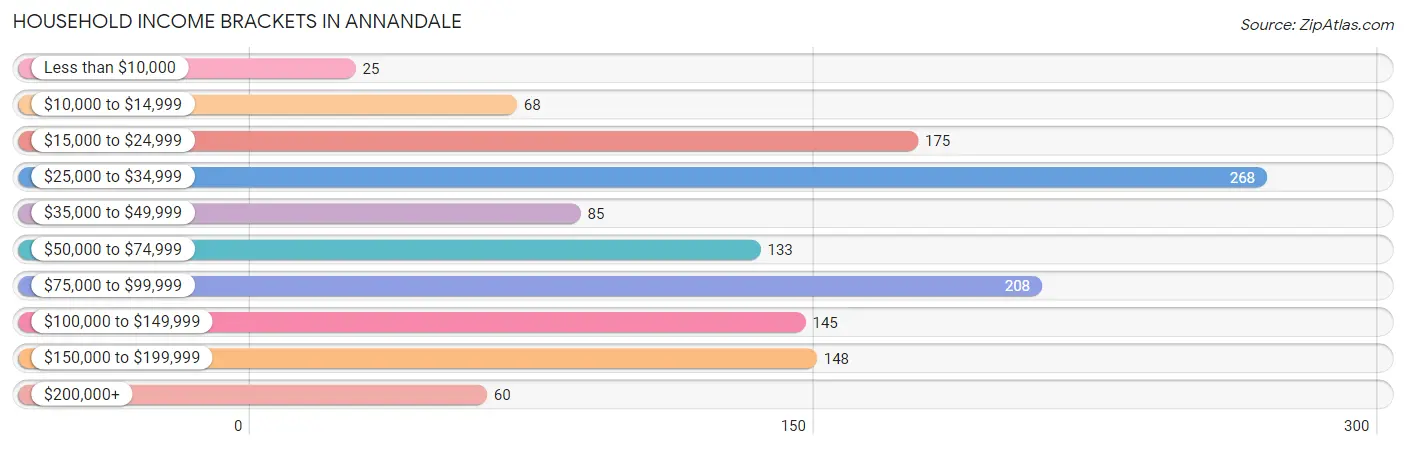
| Income Bracket | # Households | % Households |
| Less than $10,000 | 25 | 1.9% |
| $10,000 to $14,999 | 68 | 5.2% |
| $15,000 to $24,999 | 175 | 13.3% |
| $25,000 to $34,999 | 268 | 20.4% |
| $35,000 to $49,999 | 85 | 6.5% |
| $50,000 to $74,999 | 133 | 10.1% |
| $75,000 to $99,999 | 208 | 15.8% |
| $100,000 to $149,999 | 145 | 11.0% |
| $150,000 to $199,999 | 148 | 11.3% |
| $200,000+ | 60 | 4.6% |
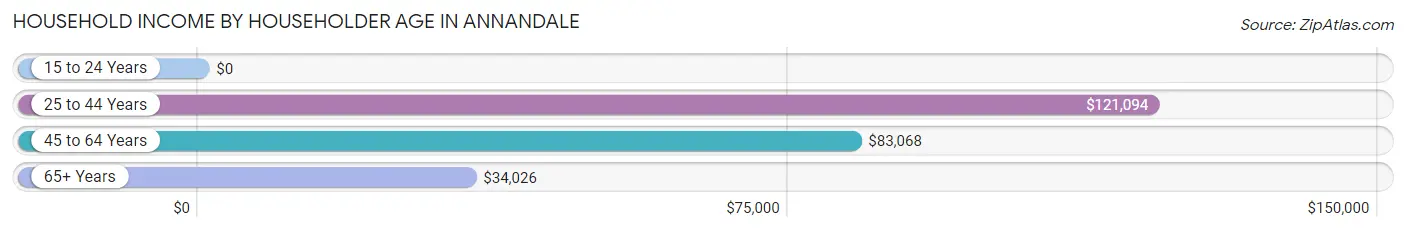
Household Income by Householder Age in Annandale
The median household income in Annandale is $51,525, with the highest median household income of $121,094 found in the 25 to 44 years age bracket for the primary householder. A total of 391 households (29.8%) fall into this category. Meanwhile, the 15 to 24 years age bracket for the primary householder has the lowest median household income of $0, with 37 households (2.8%) in this group.
| Income Bracket | # Households | Median Income |
| 15 to 24 Years | 37 (2.8%) | $0 |
| 25 to 44 Years | 391 (29.8%) | $121,094 |
| 45 to 64 Years | 315 (24.0%) | $83,068 |
| 65+ Years | 571 (43.5%) | $34,026 |
| Total | 1,314 (100.0%) | $51,525 |
Poverty in Annandale
Income Below Poverty by Sex and Age in Annandale
With 13.1% poverty level for males and 13.0% for females among the residents of Annandale, 15 year old males and 25 to 34 year old females are the most vulnerable to poverty, with 34 males (45.3%) and 74 females (44.9%) in their respective age groups living below the poverty level.
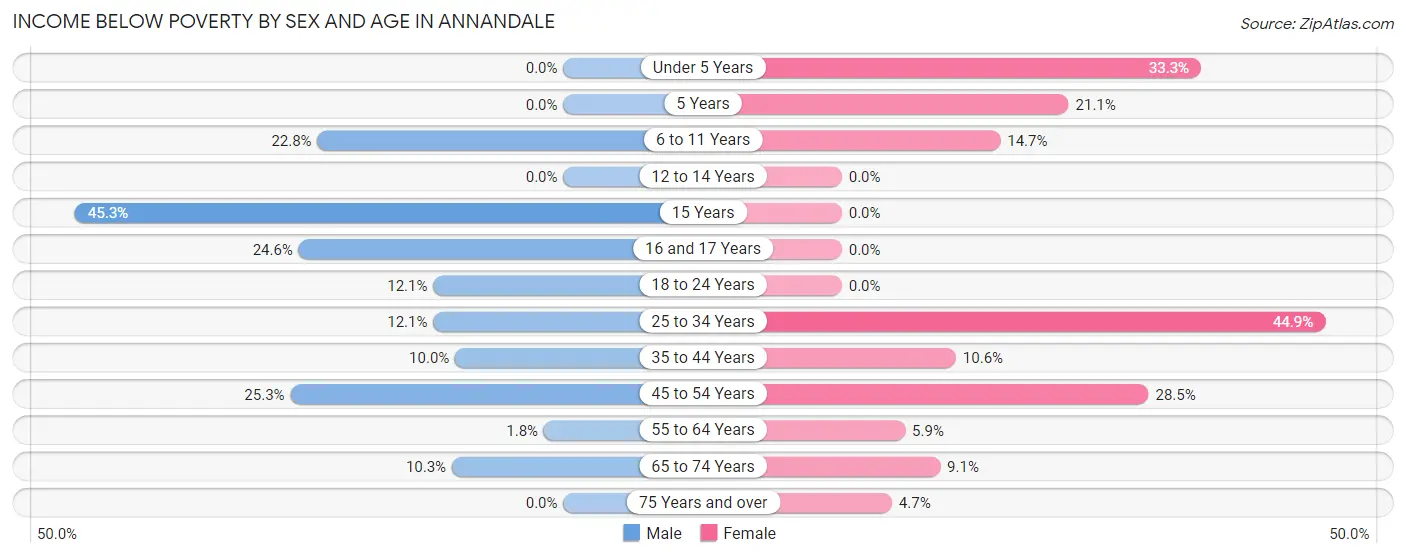
| Age Bracket | Male | Female |
| Under 5 Years | 0 (0.0%) | 29 (33.3%) |
| 5 Years | 0 (0.0%) | 8 (21.0%) |
| 6 to 11 Years | 34 (22.8%) | 15 (14.7%) |
| 12 to 14 Years | 0 (0.0%) | 0 (0.0%) |
| 15 Years | 34 (45.3%) | 0 (0.0%) |
| 16 and 17 Years | 14 (24.6%) | 0 (0.0%) |
| 18 to 24 Years | 21 (12.1%) | 0 (0.0%) |
| 25 to 34 Years | 7 (12.1%) | 74 (44.9%) |
| 35 to 44 Years | 23 (10.0%) | 27 (10.6%) |
| 45 to 54 Years | 38 (25.3%) | 41 (28.5%) |
| 55 to 64 Years | 2 (1.8%) | 9 (5.9%) |
| 65 to 74 Years | 18 (10.3%) | 22 (9.1%) |
| 75 Years and over | 0 (0.0%) | 12 (4.6%) |
| Total | 191 (13.1%) | 237 (13.0%) |
Income Above Poverty by Sex and Age in Annandale
According to the poverty statistics in Annandale, males aged under 5 years and females aged 12 to 14 years are the age groups that are most secure financially, with 100.0% of males and 100.0% of females in these age groups living above the poverty line.
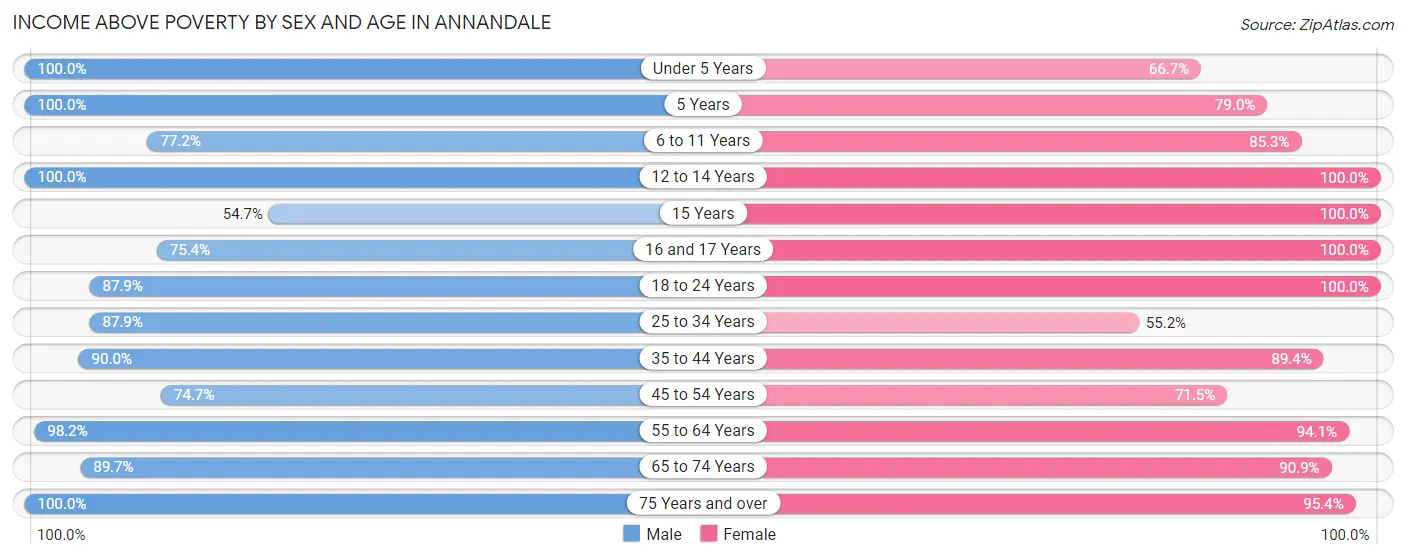
| Age Bracket | Male | Female |
| Under 5 Years | 17 (100.0%) | 58 (66.7%) |
| 5 Years | 34 (100.0%) | 30 (78.9%) |
| 6 to 11 Years | 115 (77.2%) | 87 (85.3%) |
| 12 to 14 Years | 50 (100.0%) | 162 (100.0%) |
| 15 Years | 41 (54.7%) | 19 (100.0%) |
| 16 and 17 Years | 43 (75.4%) | 40 (100.0%) |
| 18 to 24 Years | 153 (87.9%) | 155 (100.0%) |
| 25 to 34 Years | 51 (87.9%) | 91 (55.1%) |
| 35 to 44 Years | 206 (90.0%) | 228 (89.4%) |
| 45 to 54 Years | 112 (74.7%) | 103 (71.5%) |
| 55 to 64 Years | 109 (98.2%) | 144 (94.1%) |
| 65 to 74 Years | 156 (89.7%) | 219 (90.9%) |
| 75 Years and over | 185 (100.0%) | 246 (95.4%) |
| Total | 1,272 (86.9%) | 1,582 (87.0%) |
Income Below Poverty Among Married-Couple Families in Annandale
The poverty statistics for married-couple families in Annandale show that 1.2% or 8 of the total 671 families live below the poverty line. Families with 3 or 4 children have the highest poverty rate of 9.2%, comprising of 8 families. On the other hand, families with no children have the lowest poverty rate of 0.0%, which includes 0 families.
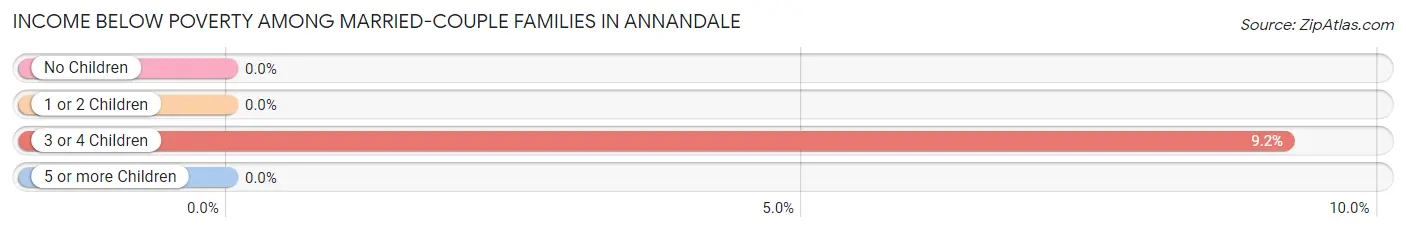
| Children | Above Poverty | Below Poverty |
| No Children | 452 (100.0%) | 0 (0.0%) |
| 1 or 2 Children | 120 (100.0%) | 0 (0.0%) |
| 3 or 4 Children | 79 (90.8%) | 8 (9.2%) |
| 5 or more Children | 12 (100.0%) | 0 (0.0%) |
| Total | 663 (98.8%) | 8 (1.2%) |
Income Below Poverty Among Single-Parent Households in Annandale
According to the poverty data in Annandale, 16.7% or 16 single-father households and 48.6% or 89 single-mother households are living below the poverty line. Among single-father households, those with 1 or 2 children have the highest poverty rate, with 16 households (32.0%) experiencing poverty. Likewise, among single-mother households, those with 1 or 2 children have the highest poverty rate, with 81 households (62.3%) falling below the poverty line.
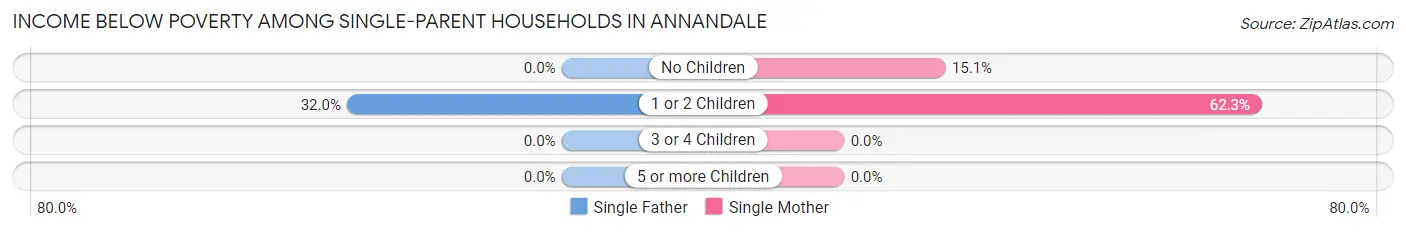
| Children | Single Father | Single Mother |
| No Children | 0 (0.0%) | 8 (15.1%) |
| 1 or 2 Children | 16 (32.0%) | 81 (62.3%) |
| 3 or 4 Children | 0 (0.0%) | 0 (0.0%) |
| 5 or more Children | 0 (0.0%) | 0 (0.0%) |
| Total | 16 (16.7%) | 89 (48.6%) |
Income Below Poverty Among Married-Couple vs Single-Parent Households in Annandale
The poverty data for Annandale shows that 8 of the married-couple family households (1.2%) and 105 of the single-parent households (37.6%) are living below the poverty level. Within the married-couple family households, those with 3 or 4 children have the highest poverty rate, with 8 households (9.2%) falling below the poverty line. Among the single-parent households, those with 1 or 2 children have the highest poverty rate, with 97 household (53.9%) living below poverty.
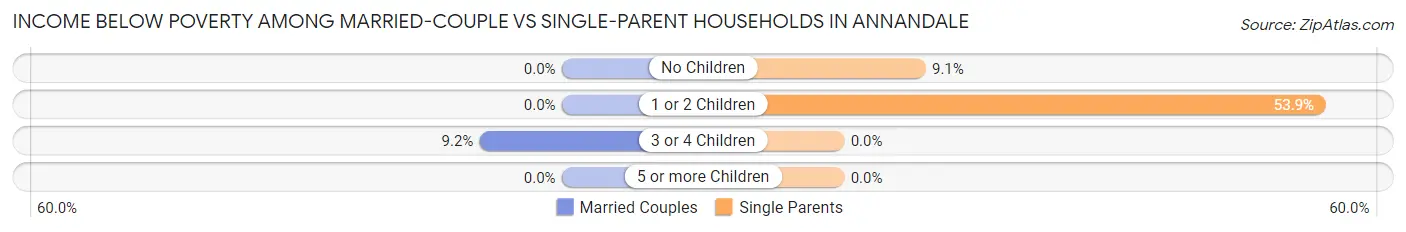
| Children | Married-Couple Families | Single-Parent Households |
| No Children | 0 (0.0%) | 8 (9.1%) |
| 1 or 2 Children | 0 (0.0%) | 97 (53.9%) |
| 3 or 4 Children | 8 (9.2%) | 0 (0.0%) |
| 5 or more Children | 0 (0.0%) | 0 (0.0%) |
| Total | 8 (1.2%) | 105 (37.6%) |
Race in Annandale
The most populous races in Annandale are White / Caucasian (3,086 | 92.1%), Two or more Races (198 | 5.9%), and Hispanic or Latino (44 | 1.3%).
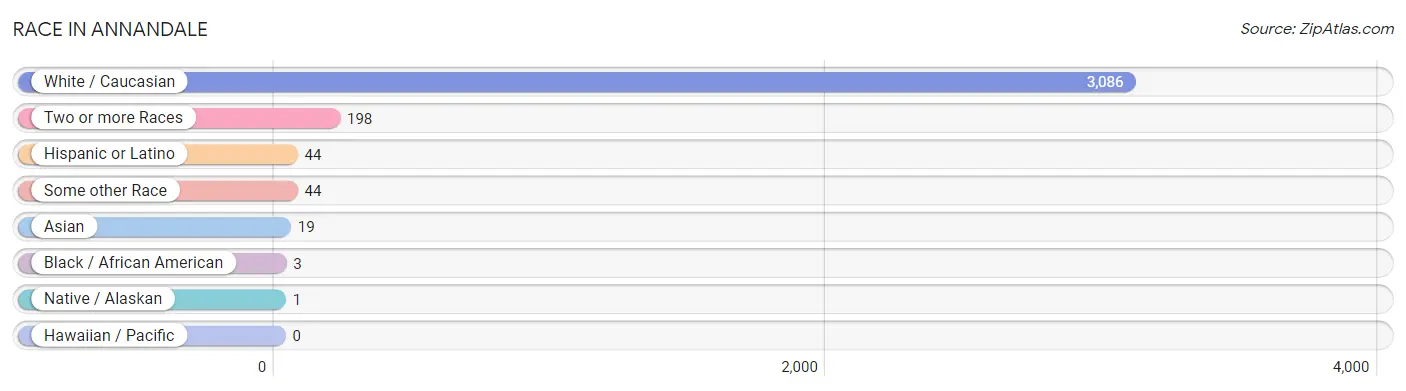
| Race | # Population | % Population |
| Asian | 19 | 0.6% |
| Black / African American | 3 | 0.1% |
| Hawaiian / Pacific | 0 | 0.0% |
| Hispanic or Latino | 44 | 1.3% |
| Native / Alaskan | 1 | 0.0% |
| White / Caucasian | 3,086 | 92.1% |
| Two or more Races | 198 | 5.9% |
| Some other Race | 44 | 1.3% |
| Total | 3,351 | 100.0% |
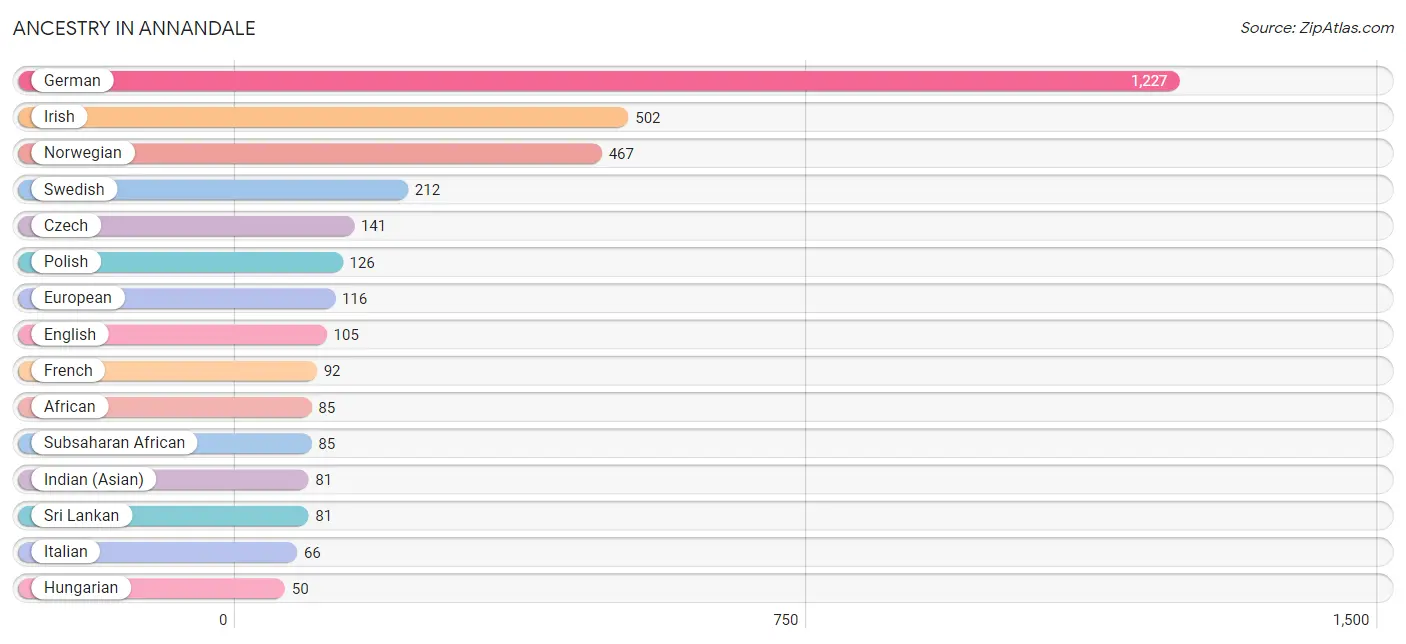
Ancestry in Annandale
The most populous ancestries reported in Annandale are German (1,227 | 36.6%), Irish (502 | 15.0%), Norwegian (467 | 13.9%), Swedish (212 | 6.3%), and Czech (141 | 4.2%), together accounting for 76.1% of all Annandale residents.
| Ancestry | # Population | % Population |
| African | 85 | 2.5% |
| American | 31 | 0.9% |
| Belgian | 21 | 0.6% |
| Bhutanese | 21 | 0.6% |
| Canadian | 15 | 0.4% |
| Central American | 44 | 1.3% |
| Czech | 141 | 4.2% |
| Czechoslovakian | 39 | 1.2% |
| Danish | 13 | 0.4% |
| Dutch | 15 | 0.4% |
| English | 105 | 3.1% |
| European | 116 | 3.5% |
| Finnish | 40 | 1.2% |
| French | 92 | 2.8% |
| German | 1,227 | 36.6% |
| Hungarian | 50 | 1.5% |
| Indian (Asian) | 81 | 2.4% |
| Irish | 502 | 15.0% |
| Italian | 66 | 2.0% |
| Lithuanian | 8 | 0.2% |
| Norwegian | 467 | 13.9% |
| Polish | 126 | 3.8% |
| Salvadoran | 44 | 1.3% |
| Slavic | 7 | 0.2% |
| Sri Lankan | 81 | 2.4% |
| Subsaharan African | 85 | 2.5% |
| Swedish | 212 | 6.3% |
| Welsh | 19 | 0.6% | View All 28 Rows |
Immigrants in Annandale
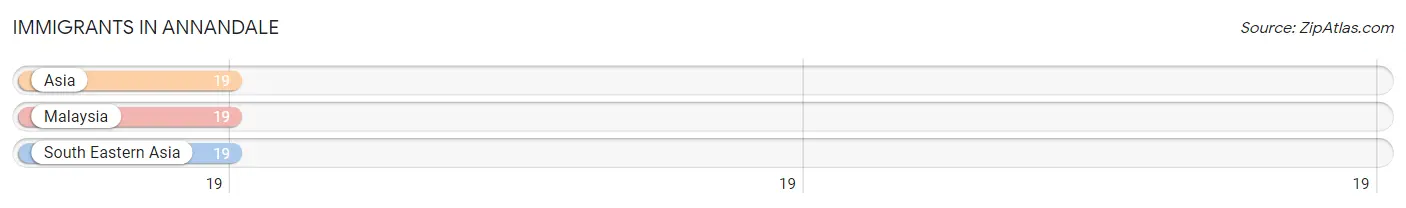
The most numerous immigrant groups reported in Annandale came from Asia (19 | 0.6%), Malaysia (19 | 0.6%), and South Eastern Asia (19 | 0.6%), together accounting for 1.7% of all Annandale residents.
| Immigration Origin | # Population | % Population |
| Asia | 19 | 0.6% |
| Malaysia | 19 | 0.6% |
| South Eastern Asia | 19 | 0.6% | View All 3 Rows |
Sex and Age in Annandale
Sex and Age in Annandale
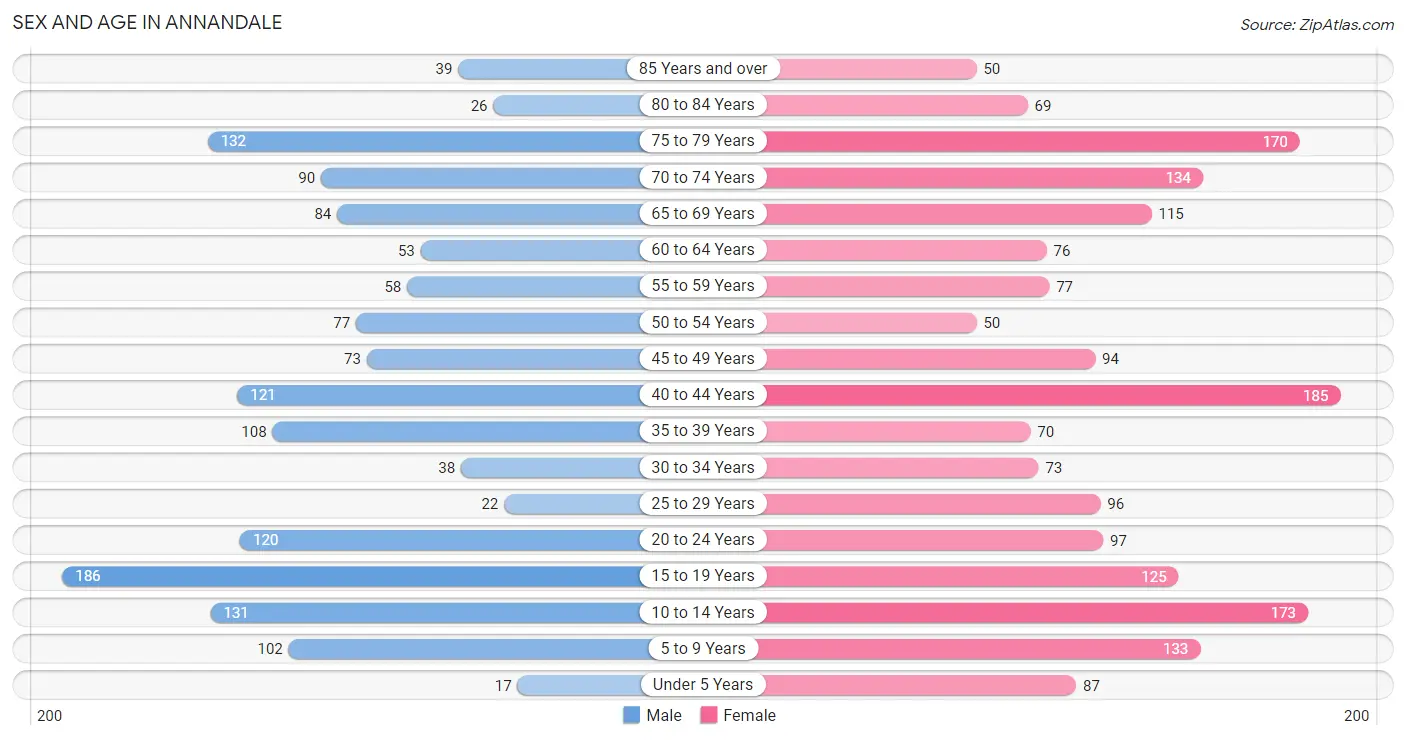
The most populous age groups in Annandale are 15 to 19 Years (186 | 12.6%) for men and 40 to 44 Years (185 | 9.9%) for women.
| Age Bracket | Male | Female |
| Under 5 Years | 17 (1.1%) | 87 (4.6%) |
| 5 to 9 Years | 102 (6.9%) | 133 (7.1%) |
| 10 to 14 Years | 131 (8.9%) | 173 (9.2%) |
| 15 to 19 Years | 186 (12.6%) | 125 (6.7%) |
| 20 to 24 Years | 120 (8.1%) | 97 (5.2%) |
| 25 to 29 Years | 22 (1.5%) | 96 (5.1%) |
| 30 to 34 Years | 38 (2.6%) | 73 (3.9%) |
| 35 to 39 Years | 108 (7.3%) | 70 (3.7%) |
| 40 to 44 Years | 121 (8.2%) | 185 (9.9%) |
| 45 to 49 Years | 73 (4.9%) | 94 (5.0%) |
| 50 to 54 Years | 77 (5.2%) | 50 (2.7%) |
| 55 to 59 Years | 58 (3.9%) | 77 (4.1%) |
| 60 to 64 Years | 53 (3.6%) | 76 (4.1%) |
| 65 to 69 Years | 84 (5.7%) | 115 (6.1%) |
| 70 to 74 Years | 90 (6.1%) | 134 (7.1%) |
| 75 to 79 Years | 132 (8.9%) | 170 (9.1%) |
| 80 to 84 Years | 26 (1.8%) | 69 (3.7%) |
| 85 Years and over | 39 (2.6%) | 50 (2.7%) |
| Total | 1,477 (100.0%) | 1,874 (100.0%) |
Families and Households in Annandale
Median Family Size in Annandale
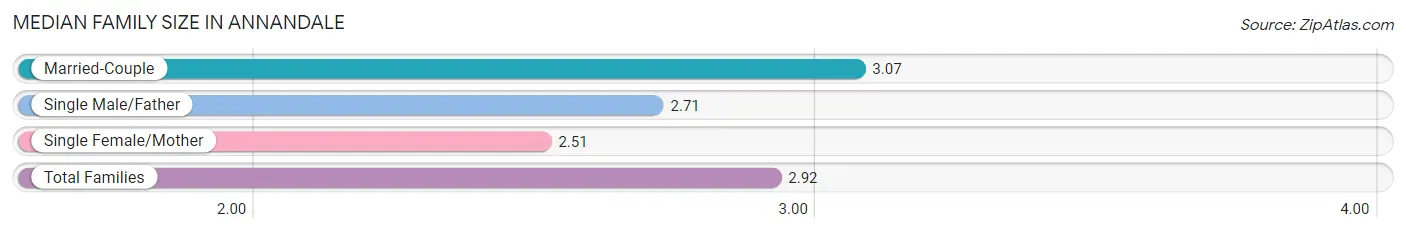
The median family size in Annandale is 2.92 persons per family, with married-couple families (671 | 70.6%) accounting for the largest median family size of 3.07 persons per family. On the other hand, single female/mother families (183 | 19.3%) represent the smallest median family size with 2.51 persons per family.
| Family Type | # Families | Family Size |
| Married-Couple | 671 (70.6%) | 3.07 |
| Single Male/Father | 96 (10.1%) | 2.71 |
| Single Female/Mother | 183 (19.3%) | 2.51 |
| Total Families | 950 (100.0%) | 2.92 |
Median Household Size in Annandale
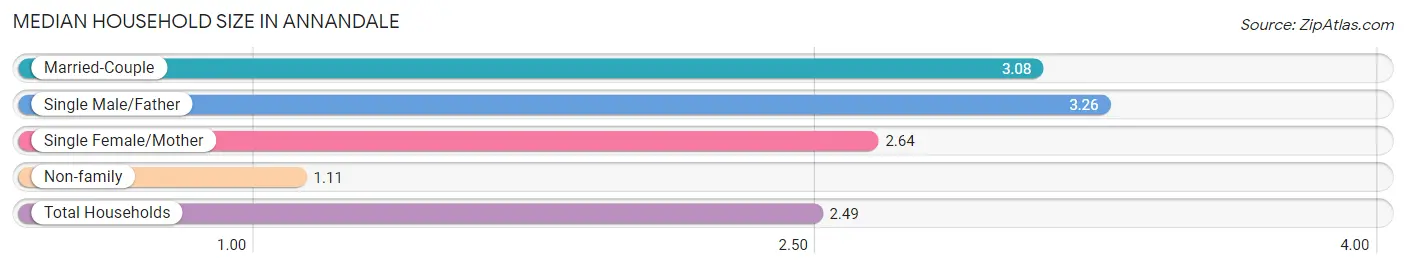
The median household size in Annandale is 2.49 persons per household, with single male/father households (96 | 7.3%) accounting for the largest median household size of 3.26 persons per household. non-family households (364 | 27.7%) represent the smallest median household size with 1.11 persons per household.
| Household Type | # Households | Household Size |
| Married-Couple | 671 (51.1%) | 3.08 |
| Single Male/Father | 96 (7.3%) | 3.26 |
| Single Female/Mother | 183 (13.9%) | 2.64 |
| Non-family | 364 (27.7%) | 1.11 |
| Total Households | 1,314 (100.0%) | 2.49 |
Household Size by Marriage Status in Annandale
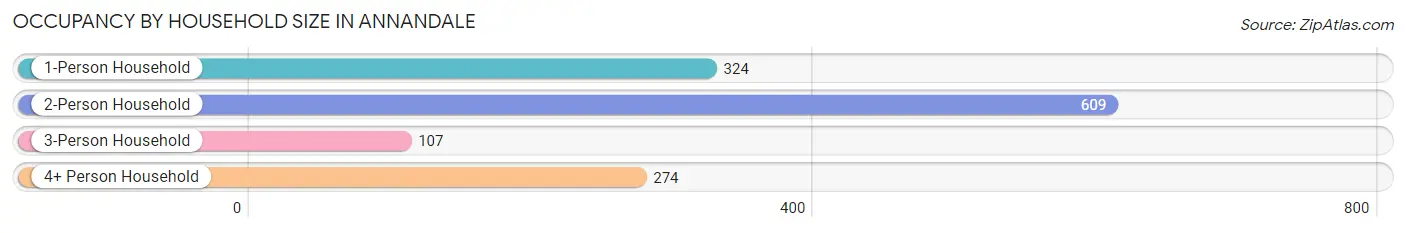
Out of a total of 1,314 households in Annandale, 950 (72.3%) are family households, while 364 (27.7%) are nonfamily households. The most numerous type of family households are 2-person households, comprising 569, and the most common type of nonfamily households are 1-person households, comprising 324.
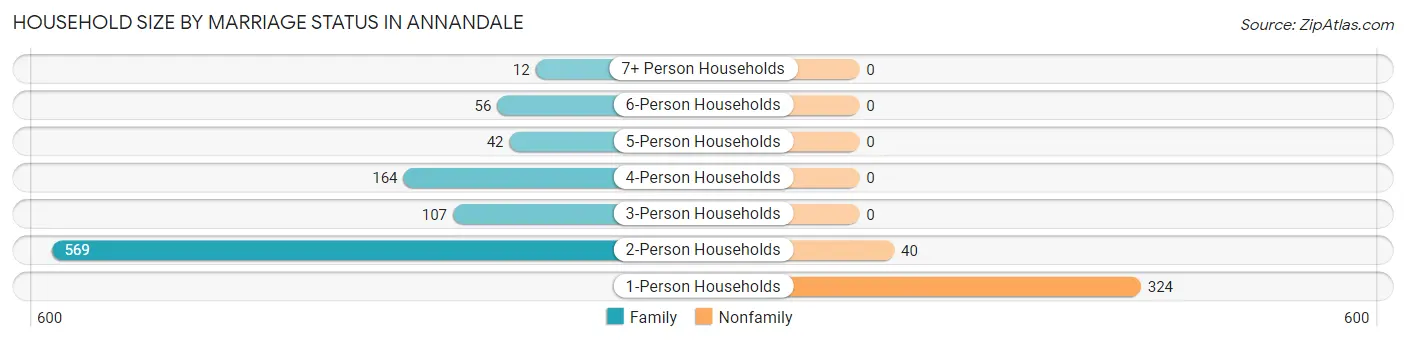
| Household Size | Family Households | Nonfamily Households |
| 1-Person Households | - | 324 (24.7%) |
| 2-Person Households | 569 (43.3%) | 40 (3.0%) |
| 3-Person Households | 107 (8.1%) | 0 (0.0%) |
| 4-Person Households | 164 (12.5%) | 0 (0.0%) |
| 5-Person Households | 42 (3.2%) | 0 (0.0%) |
| 6-Person Households | 56 (4.3%) | 0 (0.0%) |
| 7+ Person Households | 12 (0.9%) | 0 (0.0%) |
| Total | 950 (72.3%) | 364 (27.7%) |
Female Fertility in Annandale
Fertility by Age in Annandale
Average fertility rate in Annandale is 12.0 births per 1,000 women. Women in the age bracket of 20 to 34 years have the highest fertility rate with 34.0 births per 1,000 women. Women in the age bracket of 20 to 34 years acount for 100.0% of all women with births.
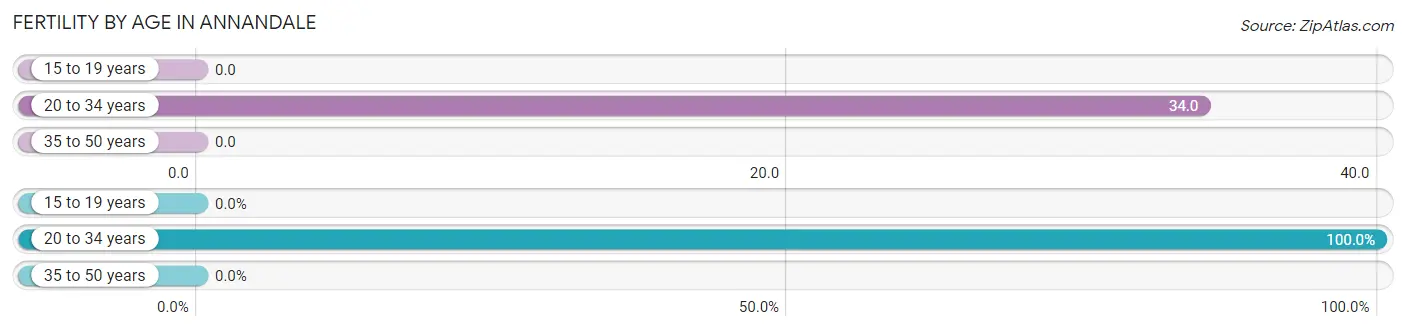
| Age Bracket | Women with Births | Births / 1,000 Women |
| 15 to 19 years | 0 (0.0%) | 0.0 |
| 20 to 34 years | 9 (100.0%) | 34.0 |
| 35 to 50 years | 0 (0.0%) | 0.0 |
| Total | 9 (100.0%) | 12.0 |
Fertility by Age by Marriage Status in Annandale
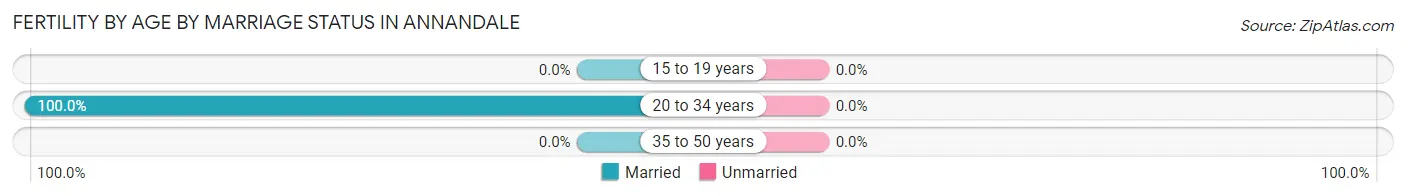
| Age Bracket | Married | Unmarried |
| 15 to 19 years | 0 (0.0%) | 0 (0.0%) |
| 20 to 34 years | 9 (100.0%) | 0 (0.0%) |
| 35 to 50 years | 0 (0.0%) | 0 (0.0%) |
| Total | 9 (100.0%) | 0 (0.0%) |
Fertility by Education in Annandale
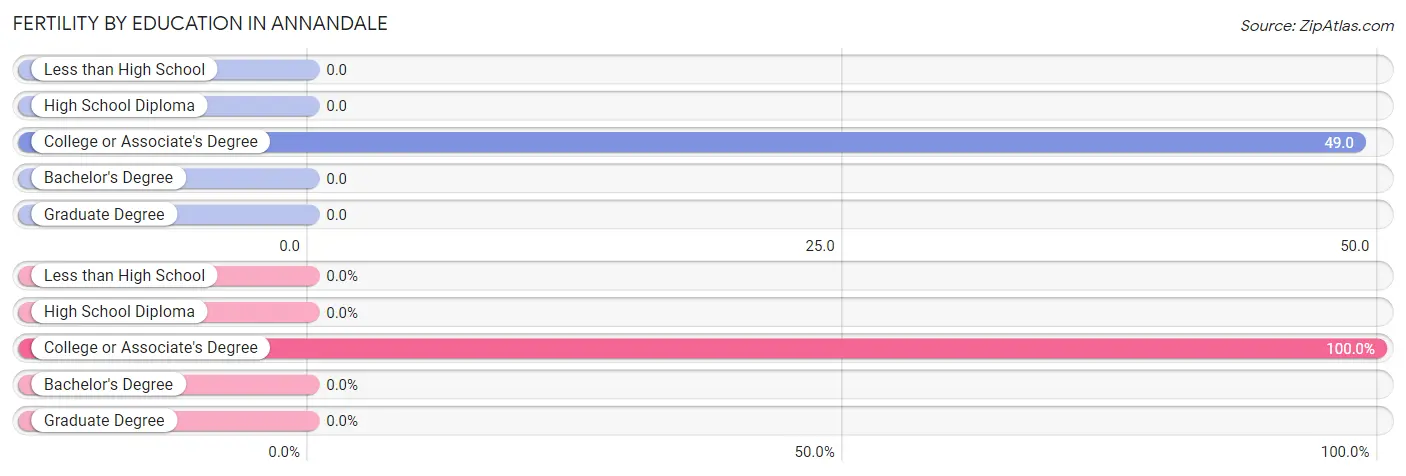
| Educational Attainment | Women with Births | Births / 1,000 Women |
| Less than High School | 0 (0.0%) | 0.0 |
| High School Diploma | 0 (0.0%) | 0.0 |
| College or Associate's Degree | 9 (100.0%) | 49.0 |
| Bachelor's Degree | 0 (0.0%) | 0.0 |
| Graduate Degree | 0 (0.0%) | 0.0 |
| Total | 9 (100.0%) | 12.0 |
Fertility by Education by Marriage Status in Annandale
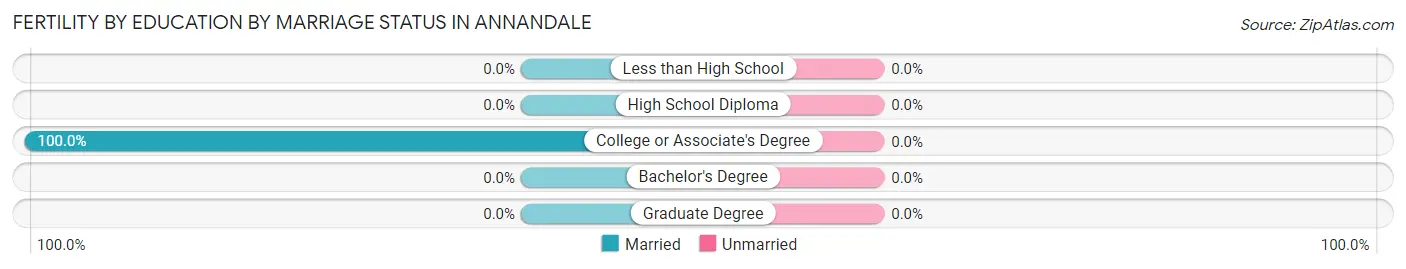
| Educational Attainment | Married | Unmarried |
| Less than High School | 0 (0.0%) | 0 (0.0%) |
| High School Diploma | 0 (0.0%) | 0 (0.0%) |
| College or Associate's Degree | 9 (100.0%) | 0 (0.0%) |
| Bachelor's Degree | 0 (0.0%) | 0 (0.0%) |
| Graduate Degree | 0 (0.0%) | 0 (0.0%) |
| Total | 9 (100.0%) | 0 (0.0%) |
Employment Characteristics in Annandale
Employment by Class of Employer in Annandale
Among the 1,415 employed individuals in Annandale, private company employees (716 | 50.6%), local government employees (200 | 14.1%), and state government employees (146 | 10.3%) make up the most common classes of employment.
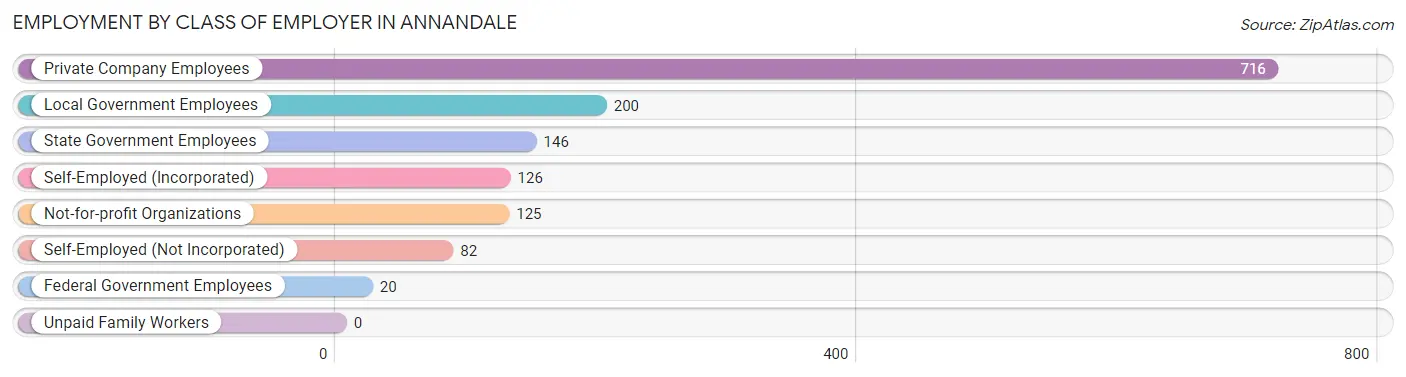
| Employer Class | # Employees | % Employees |
| Private Company Employees | 716 | 50.6% |
| Self-Employed (Incorporated) | 126 | 8.9% |
| Self-Employed (Not Incorporated) | 82 | 5.8% |
| Not-for-profit Organizations | 125 | 8.8% |
| Local Government Employees | 200 | 14.1% |
| State Government Employees | 146 | 10.3% |
| Federal Government Employees | 20 | 1.4% |
| Unpaid Family Workers | 0 | 0.0% |
| Total | 1,415 | 100.0% |
Employment Status by Age in Annandale
According to the labor force statistics for Annandale, out of the total population over 16 years of age (2,613), 58.2% or 1,521 individuals are in the labor force, with 5.7% or 87 of them unemployed. The age group with the highest labor force participation rate is 35 to 44 years, with 98.6% or 477 individuals in the labor force. Within the labor force, the 16 to 19 years age range has the highest percentage of unemployed individuals, with 24.4% or 29 of them being unemployed.
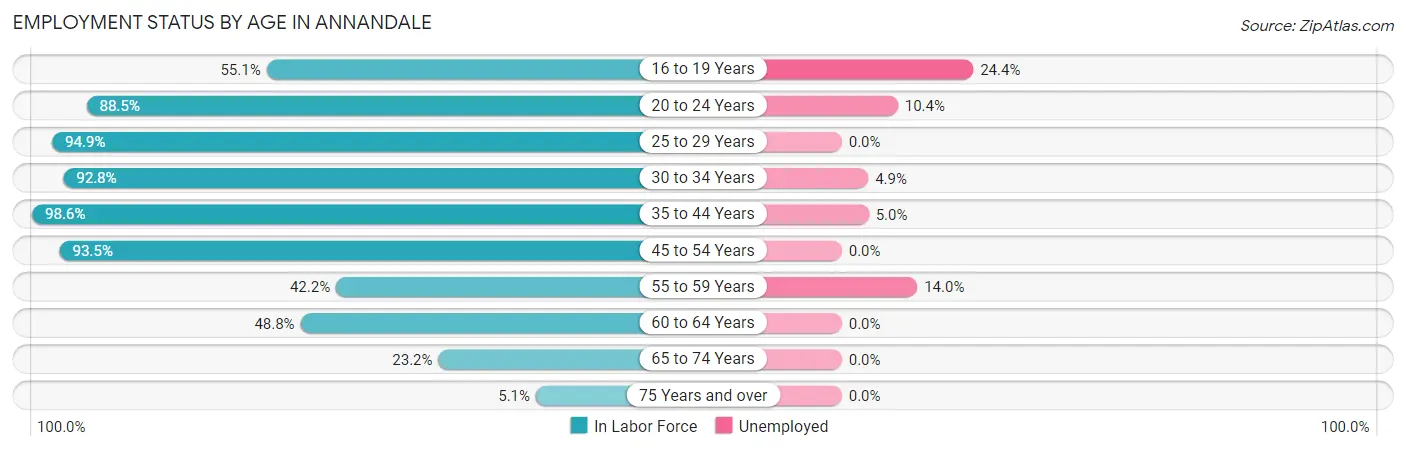
| Age Bracket | In Labor Force | Unemployed |
| 16 to 19 Years | 119 (55.1%) | 29 (24.4%) |
| 20 to 24 Years | 192 (88.5%) | 20 (10.4%) |
| 25 to 29 Years | 112 (94.9%) | 0 (0.0%) |
| 30 to 34 Years | 103 (92.8%) | 5 (4.9%) |
| 35 to 44 Years | 477 (98.6%) | 24 (5.0%) |
| 45 to 54 Years | 275 (93.5%) | 0 (0.0%) |
| 55 to 59 Years | 57 (42.2%) | 8 (14.0%) |
| 60 to 64 Years | 63 (48.8%) | 0 (0.0%) |
| 65 to 74 Years | 98 (23.2%) | 0 (0.0%) |
| 75 Years and over | 25 (5.1%) | 0 (0.0%) |
| Total | 1,521 (58.2%) | 87 (5.7%) |
Employment Status by Educational Attainment in Annandale
According to labor force statistics for Annandale, 85.5% of individuals (1,087) out of the total population between 25 and 64 years of age (1,271) are in the labor force, with 3.4% or 37 of them being unemployed. The group with the highest labor force participation rate are those with the educational attainment of bachelor's degree or higher, with 92.3% or 466 individuals in the labor force. Within the labor force, individuals with less than high school education have the highest percentage of unemployment, with 15.2% or 5 of them being unemployed.
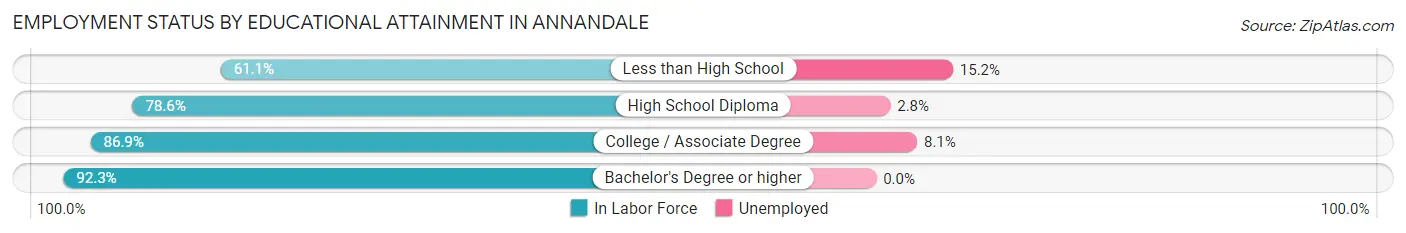
| Educational Attainment | In Labor Force | Unemployed |
| Less than High School | 33 (61.1%) | 8 (15.2%) |
| High School Diploma | 290 (78.6%) | 10 (2.8%) |
| College / Associate Degree | 298 (86.9%) | 28 (8.1%) |
| Bachelor's Degree or higher | 466 (92.3%) | 0 (0.0%) |
| Total | 1,087 (85.5%) | 43 (3.4%) |
Employment Occupations by Sex in Annandale
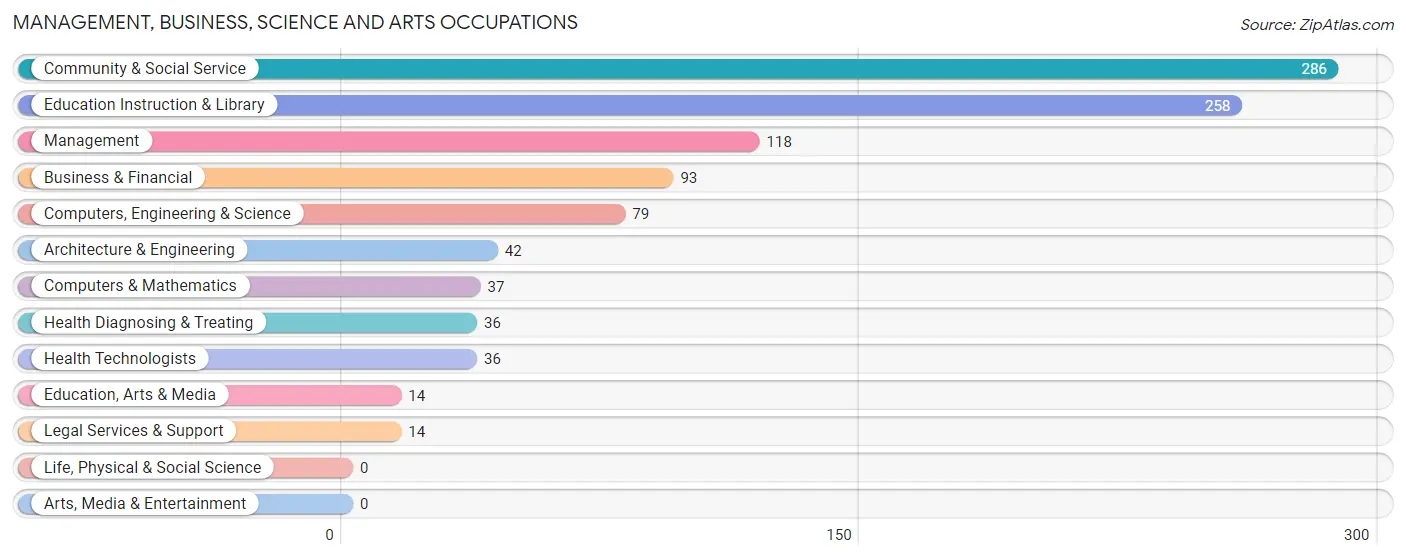
Management, Business, Science and Arts Occupations
The most common Management, Business, Science and Arts occupations in Annandale are Community & Social Service (286 | 19.9%), Education Instruction & Library (258 | 18.0%), Management (118 | 8.2%), Business & Financial (93 | 6.5%), and Computers, Engineering & Science (79 | 5.5%).
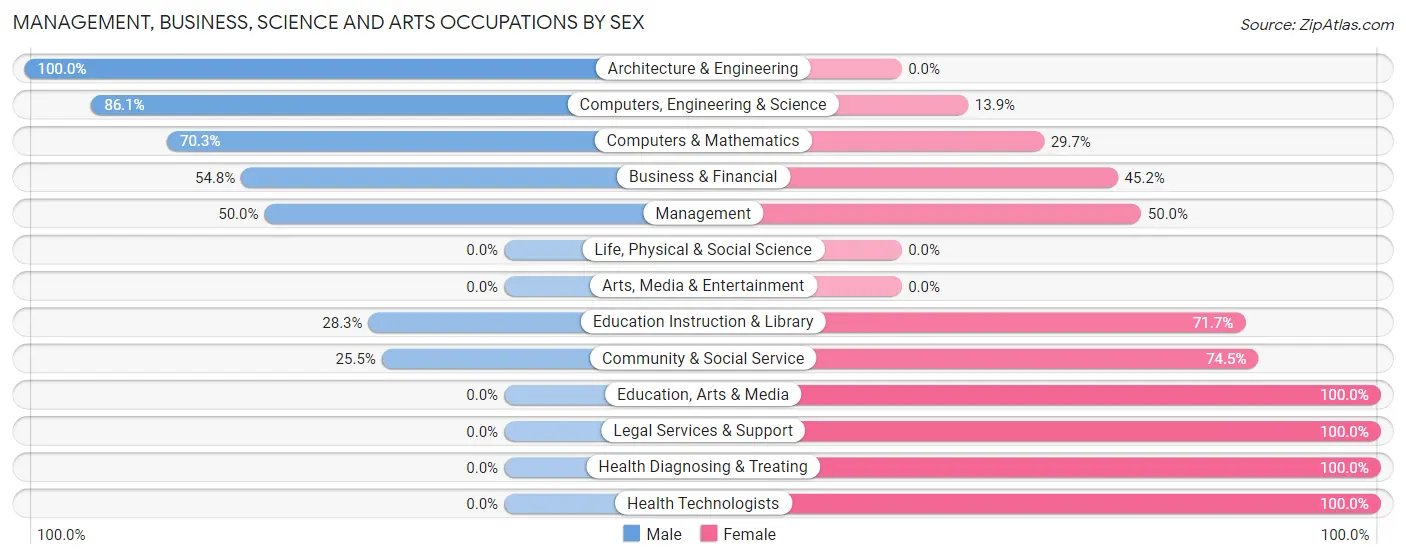
Management, Business, Science and Arts Occupations by Sex
Within the Management, Business, Science and Arts occupations in Annandale, the most male-oriented occupations are Architecture & Engineering (100.0%), Computers, Engineering & Science (86.1%), and Computers & Mathematics (70.3%), while the most female-oriented occupations are Education, Arts & Media (100.0%), Legal Services & Support (100.0%), and Health Diagnosing & Treating (100.0%).
| Occupation | Male | Female |
| Management | 59 (50.0%) | 59 (50.0%) |
| Business & Financial | 51 (54.8%) | 42 (45.2%) |
| Computers, Engineering & Science | 68 (86.1%) | 11 (13.9%) |
| Computers & Mathematics | 26 (70.3%) | 11 (29.7%) |
| Architecture & Engineering | 42 (100.0%) | 0 (0.0%) |
| Life, Physical & Social Science | 0 (0.0%) | 0 (0.0%) |
| Community & Social Service | 73 (25.5%) | 213 (74.5%) |
| Education, Arts & Media | 0 (0.0%) | 14 (100.0%) |
| Legal Services & Support | 0 (0.0%) | 14 (100.0%) |
| Education Instruction & Library | 73 (28.3%) | 185 (71.7%) |
| Arts, Media & Entertainment | 0 (0.0%) | 0 (0.0%) |
| Health Diagnosing & Treating | 0 (0.0%) | 36 (100.0%) |
| Health Technologists | 0 (0.0%) | 36 (100.0%) |
| Total (Category) | 251 (41.0%) | 361 (59.0%) |
| Total (Overall) | 654 (45.6%) | 781 (54.4%) |
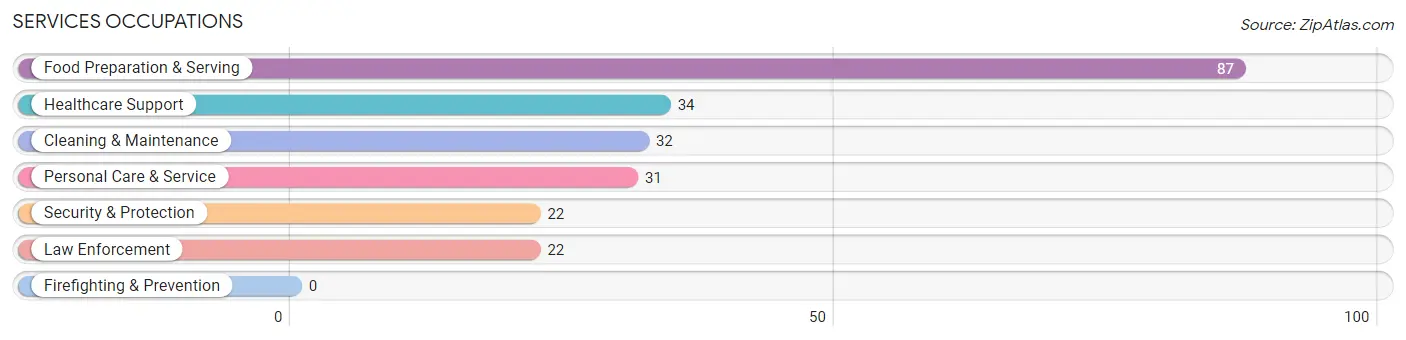
Services Occupations
The most common Services occupations in Annandale are Food Preparation & Serving (87 | 6.1%), Healthcare Support (34 | 2.4%), Cleaning & Maintenance (32 | 2.2%), Personal Care & Service (31 | 2.2%), and Security & Protection (22 | 1.5%).
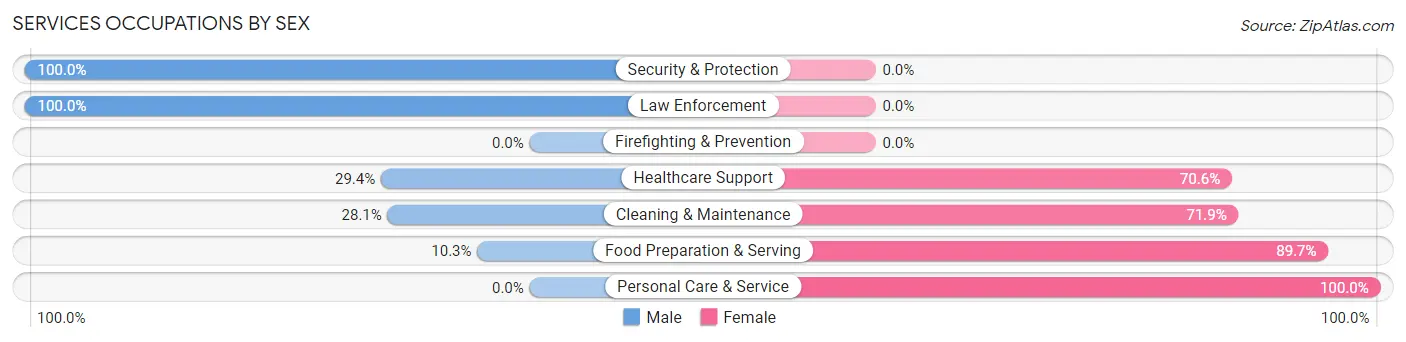
Services Occupations by Sex
Within the Services occupations in Annandale, the most male-oriented occupations are Security & Protection (100.0%), Law Enforcement (100.0%), and Healthcare Support (29.4%), while the most female-oriented occupations are Personal Care & Service (100.0%), Food Preparation & Serving (89.7%), and Cleaning & Maintenance (71.9%).
| Occupation | Male | Female |
| Healthcare Support | 10 (29.4%) | 24 (70.6%) |
| Security & Protection | 22 (100.0%) | 0 (0.0%) |
| Firefighting & Prevention | 0 (0.0%) | 0 (0.0%) |
| Law Enforcement | 22 (100.0%) | 0 (0.0%) |
| Food Preparation & Serving | 9 (10.3%) | 78 (89.7%) |
| Cleaning & Maintenance | 9 (28.1%) | 23 (71.9%) |
| Personal Care & Service | 0 (0.0%) | 31 (100.0%) |
| Total (Category) | 50 (24.3%) | 156 (75.7%) |
| Total (Overall) | 654 (45.6%) | 781 (54.4%) |
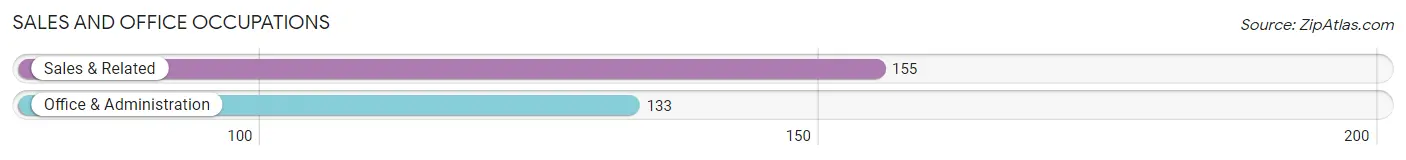
Sales and Office Occupations
The most common Sales and Office occupations in Annandale are Sales & Related (155 | 10.8%), and Office & Administration (133 | 9.3%).
Sales and Office Occupations by Sex
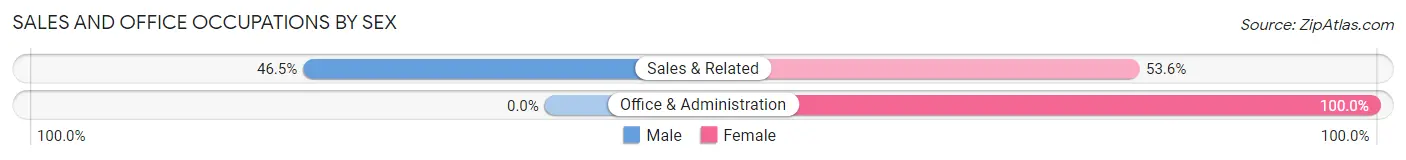
| Occupation | Male | Female |
| Sales & Related | 72 (46.5%) | 83 (53.5%) |
| Office & Administration | 0 (0.0%) | 133 (100.0%) |
| Total (Category) | 72 (25.0%) | 216 (75.0%) |
| Total (Overall) | 654 (45.6%) | 781 (54.4%) |
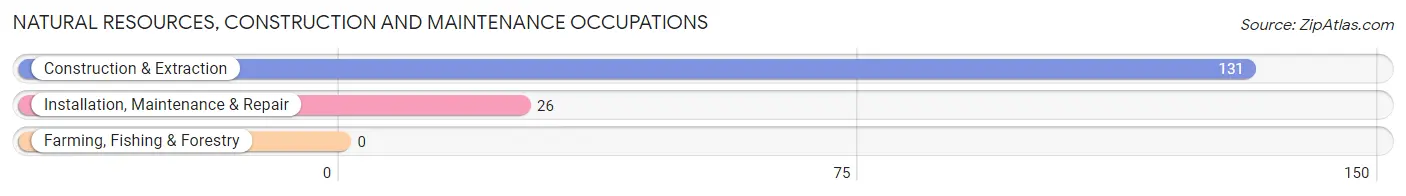
Natural Resources, Construction and Maintenance Occupations
The most common Natural Resources, Construction and Maintenance occupations in Annandale are Construction & Extraction (131 | 9.1%), and Installation, Maintenance & Repair (26 | 1.8%).
Natural Resources, Construction and Maintenance Occupations by Sex
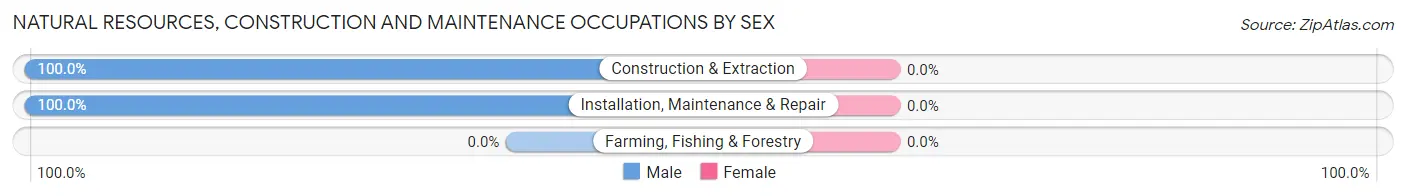
| Occupation | Male | Female |
| Farming, Fishing & Forestry | 0 (0.0%) | 0 (0.0%) |
| Construction & Extraction | 131 (100.0%) | 0 (0.0%) |
| Installation, Maintenance & Repair | 26 (100.0%) | 0 (0.0%) |
| Total (Category) | 157 (100.0%) | 0 (0.0%) |
| Total (Overall) | 654 (45.6%) | 781 (54.4%) |
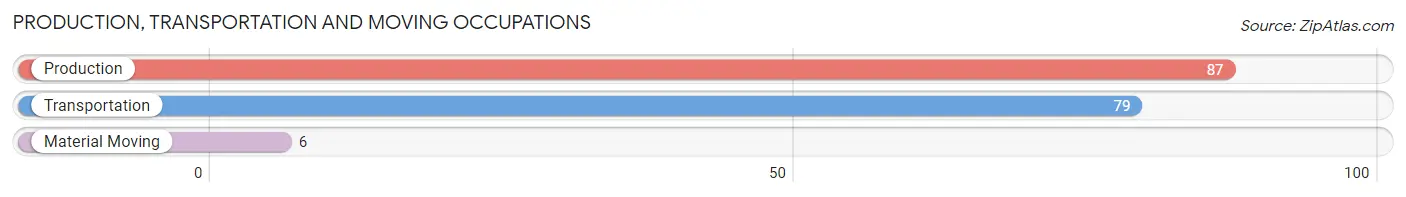
Production, Transportation and Moving Occupations
The most common Production, Transportation and Moving occupations in Annandale are Production (87 | 6.1%), Transportation (79 | 5.5%), and Material Moving (6 | 0.4%).
Production, Transportation and Moving Occupations by Sex
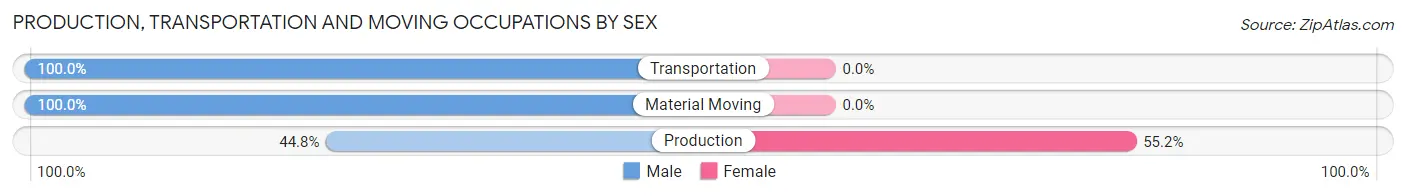
| Occupation | Male | Female |
| Production | 39 (44.8%) | 48 (55.2%) |
| Transportation | 79 (100.0%) | 0 (0.0%) |
| Material Moving | 6 (100.0%) | 0 (0.0%) |
| Total (Category) | 124 (72.1%) | 48 (27.9%) |
| Total (Overall) | 654 (45.6%) | 781 (54.4%) |
Employment Industries by Sex in Annandale
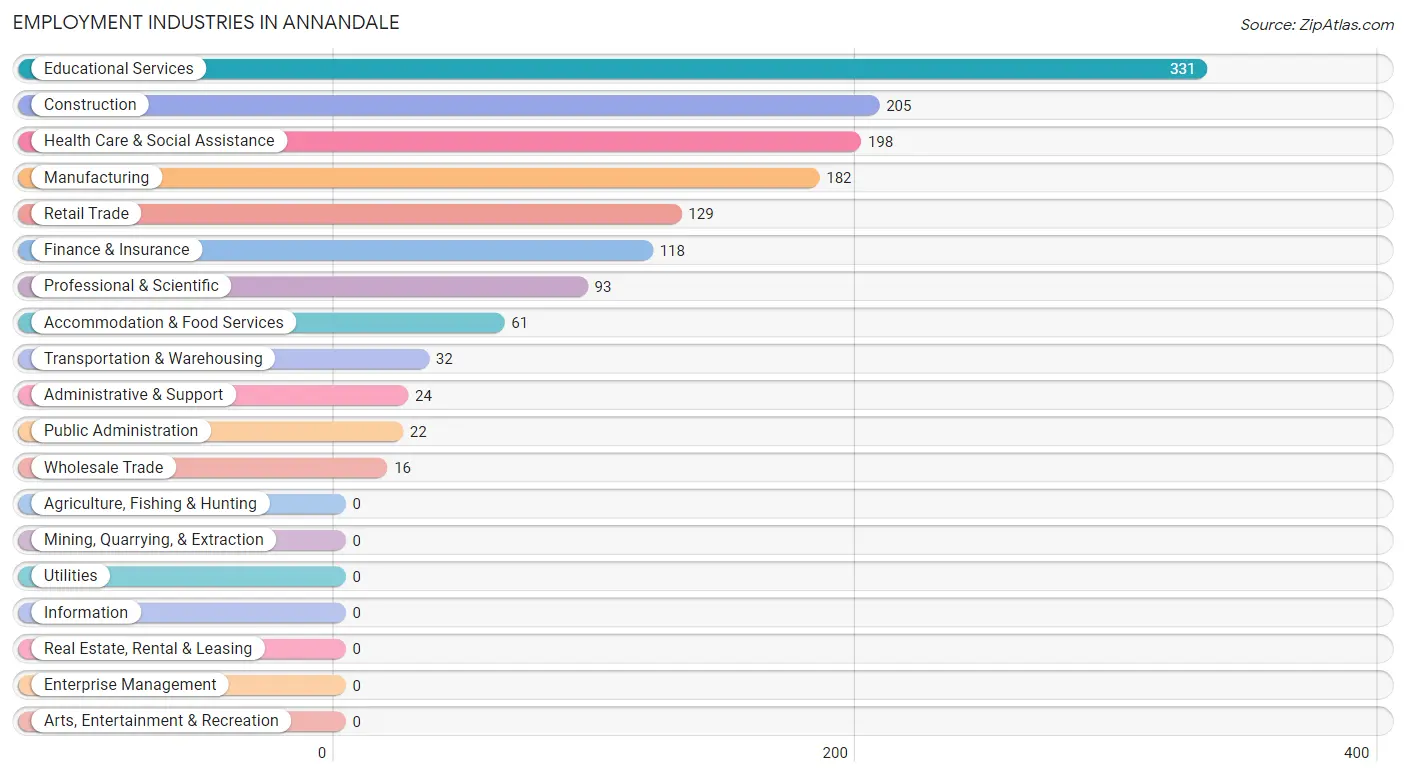
Employment Industries in Annandale
The major employment industries in Annandale include Educational Services (331 | 23.1%), Construction (205 | 14.3%), Health Care & Social Assistance (198 | 13.8%), Manufacturing (182 | 12.7%), and Retail Trade (129 | 9.0%).
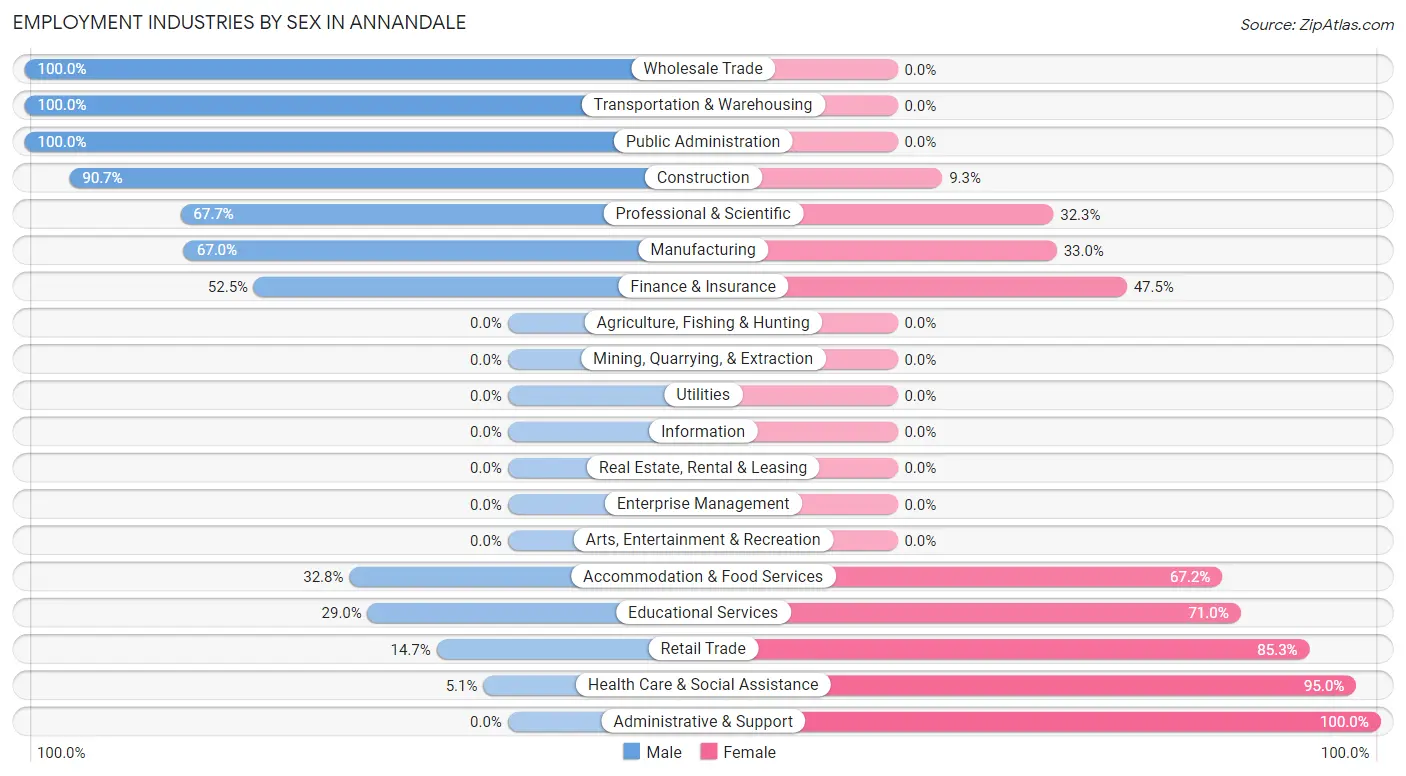
Employment Industries by Sex in Annandale
The Annandale industries that see more men than women are Wholesale Trade (100.0%), Transportation & Warehousing (100.0%), and Public Administration (100.0%), whereas the industries that tend to have a higher number of women are Administrative & Support (100.0%), Health Care & Social Assistance (95.0%), and Retail Trade (85.3%).
| Industry | Male | Female |
| Agriculture, Fishing & Hunting | 0 (0.0%) | 0 (0.0%) |
| Mining, Quarrying, & Extraction | 0 (0.0%) | 0 (0.0%) |
| Construction | 186 (90.7%) | 19 (9.3%) |
| Manufacturing | 122 (67.0%) | 60 (33.0%) |
| Wholesale Trade | 16 (100.0%) | 0 (0.0%) |
| Retail Trade | 19 (14.7%) | 110 (85.3%) |
| Transportation & Warehousing | 32 (100.0%) | 0 (0.0%) |
| Utilities | 0 (0.0%) | 0 (0.0%) |
| Information | 0 (0.0%) | 0 (0.0%) |
| Finance & Insurance | 62 (52.5%) | 56 (47.5%) |
| Real Estate, Rental & Leasing | 0 (0.0%) | 0 (0.0%) |
| Professional & Scientific | 63 (67.7%) | 30 (32.3%) |
| Enterprise Management | 0 (0.0%) | 0 (0.0%) |
| Administrative & Support | 0 (0.0%) | 24 (100.0%) |
| Educational Services | 96 (29.0%) | 235 (71.0%) |
| Health Care & Social Assistance | 10 (5.1%) | 188 (95.0%) |
| Arts, Entertainment & Recreation | 0 (0.0%) | 0 (0.0%) |
| Accommodation & Food Services | 20 (32.8%) | 41 (67.2%) |
| Public Administration | 22 (100.0%) | 0 (0.0%) |
| Total | 654 (45.6%) | 781 (54.4%) |
Education in Annandale
School Enrollment in Annandale
The most common levels of schooling among the 986 students in Annandale are high school (289 | 29.3%), middle school (268 | 27.2%), and elementary school (146 | 14.8%).
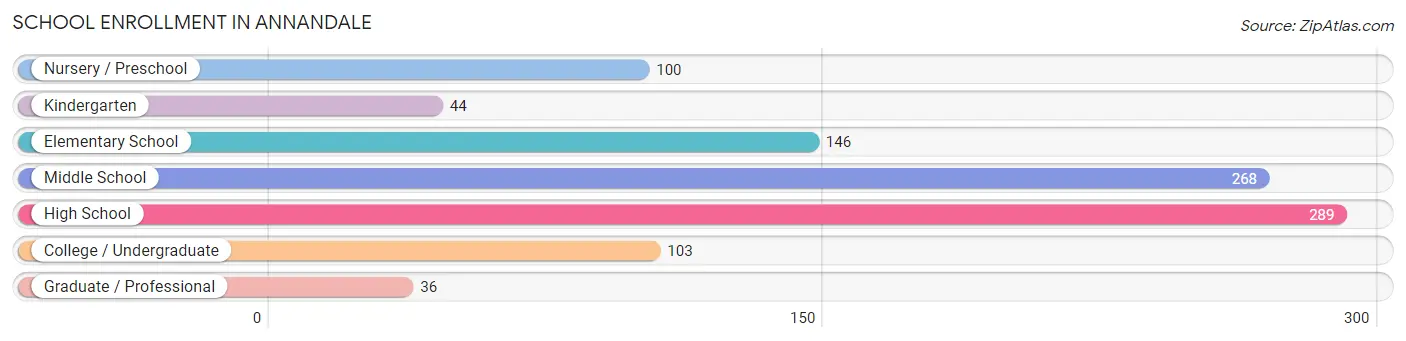
| School Level | # Students | % Students |
| Nursery / Preschool | 100 | 10.1% |
| Kindergarten | 44 | 4.5% |
| Elementary School | 146 | 14.8% |
| Middle School | 268 | 27.2% |
| High School | 289 | 29.3% |
| College / Undergraduate | 103 | 10.4% |
| Graduate / Professional | 36 | 3.6% |
| Total | 986 | 100.0% |
School Enrollment by Age by Funding Source in Annandale
Out of a total of 986 students who are enrolled in schools in Annandale, 73 (7.4%) attend a private institution, while the remaining 913 (92.6%) are enrolled in public schools. The age group of 25 to 34 year olds has the highest likelihood of being enrolled in private schools, with 36 (51.4% in the age bracket) enrolled. Conversely, the age group of 3 to 4 year olds has the lowest likelihood of being enrolled in a private school, with 28 (100.0% in the age bracket) attending a public institution.
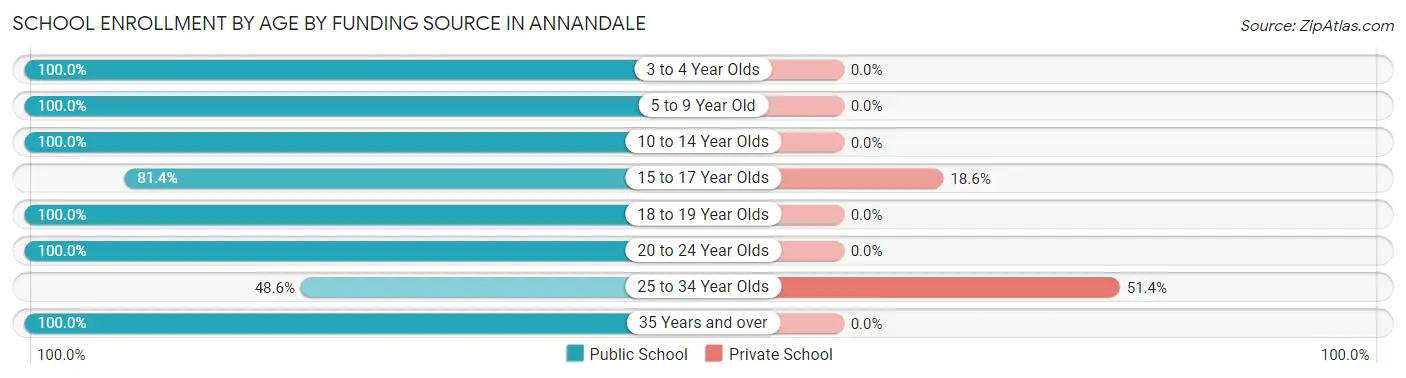
| Age Bracket | Public School | Private School |
| 3 to 4 Year Olds | 28 (100.0%) | 0 (0.0%) |
| 5 to 9 Year Old | 235 (100.0%) | 0 (0.0%) |
| 10 to 14 Year Olds | 304 (100.0%) | 0 (0.0%) |
| 15 to 17 Year Olds | 162 (81.4%) | 37 (18.6%) |
| 18 to 19 Year Olds | 95 (100.0%) | 0 (0.0%) |
| 20 to 24 Year Olds | 46 (100.0%) | 0 (0.0%) |
| 25 to 34 Year Olds | 34 (48.6%) | 36 (51.4%) |
| 35 Years and over | 9 (100.0%) | 0 (0.0%) |
| Total | 913 (92.6%) | 73 (7.4%) |
Educational Attainment by Field of Study in Annandale
Education (190 | 26.7%), science & technology (137 | 19.2%), business (78 | 10.9%), social sciences (61 | 8.6%), and bio, nature & agricultural (59 | 8.3%) are the most common fields of study among 713 individuals in Annandale who have obtained a bachelor's degree or higher.
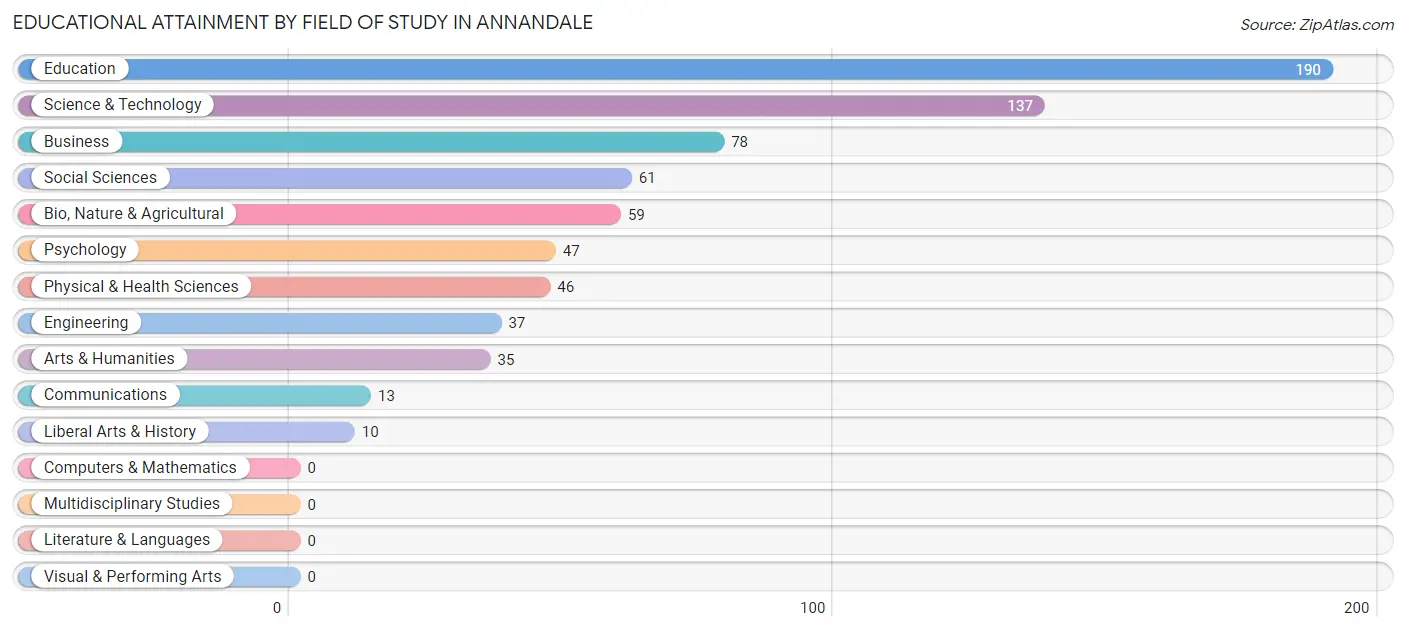
| Field of Study | # Graduates | % Graduates |
| Computers & Mathematics | 0 | 0.0% |
| Bio, Nature & Agricultural | 59 | 8.3% |
| Physical & Health Sciences | 46 | 6.5% |
| Psychology | 47 | 6.6% |
| Social Sciences | 61 | 8.6% |
| Engineering | 37 | 5.2% |
| Multidisciplinary Studies | 0 | 0.0% |
| Science & Technology | 137 | 19.2% |
| Business | 78 | 10.9% |
| Education | 190 | 26.7% |
| Literature & Languages | 0 | 0.0% |
| Liberal Arts & History | 10 | 1.4% |
| Visual & Performing Arts | 0 | 0.0% |
| Communications | 13 | 1.8% |
| Arts & Humanities | 35 | 4.9% |
| Total | 713 | 100.0% |
Transportation & Commute in Annandale
Vehicle Availability by Sex in Annandale
The most prevalent vehicle ownership categories in Annandale are males with 2 vehicles (354, accounting for 55.8%) and females with 2 vehicles (439, making up 45.8%).
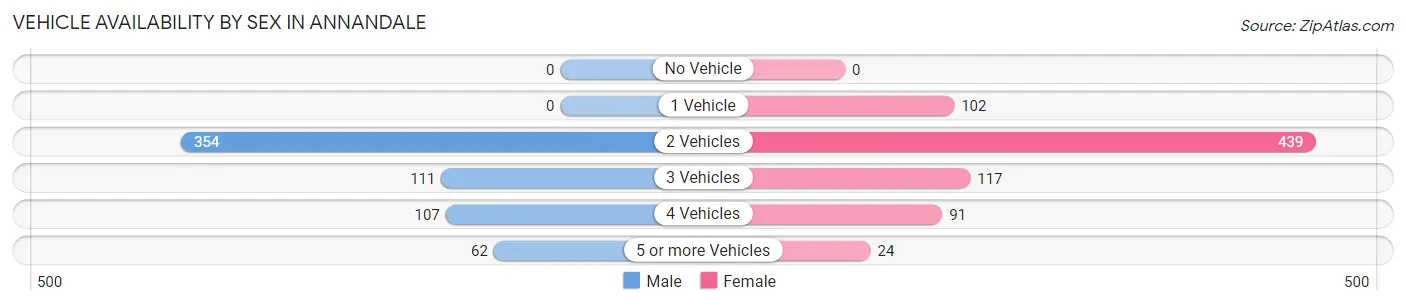
| Vehicles Available | Male | Female |
| No Vehicle | 0 (0.0%) | 0 (0.0%) |
| 1 Vehicle | 0 (0.0%) | 102 (13.2%) |
| 2 Vehicles | 354 (55.8%) | 439 (56.8%) |
| 3 Vehicles | 111 (17.5%) | 117 (15.1%) |
| 4 Vehicles | 107 (16.9%) | 91 (11.8%) |
| 5 or more Vehicles | 62 (9.8%) | 24 (3.1%) |
| Total | 634 (100.0%) | 773 (100.0%) |
Commute Time in Annandale
The most frequently occuring commute durations in Annandale are 5 to 9 minutes (202 commuters, 15.6%), 60 to 89 minutes (184 commuters, 14.2%), and less than 5 minutes (165 commuters, 12.8%).
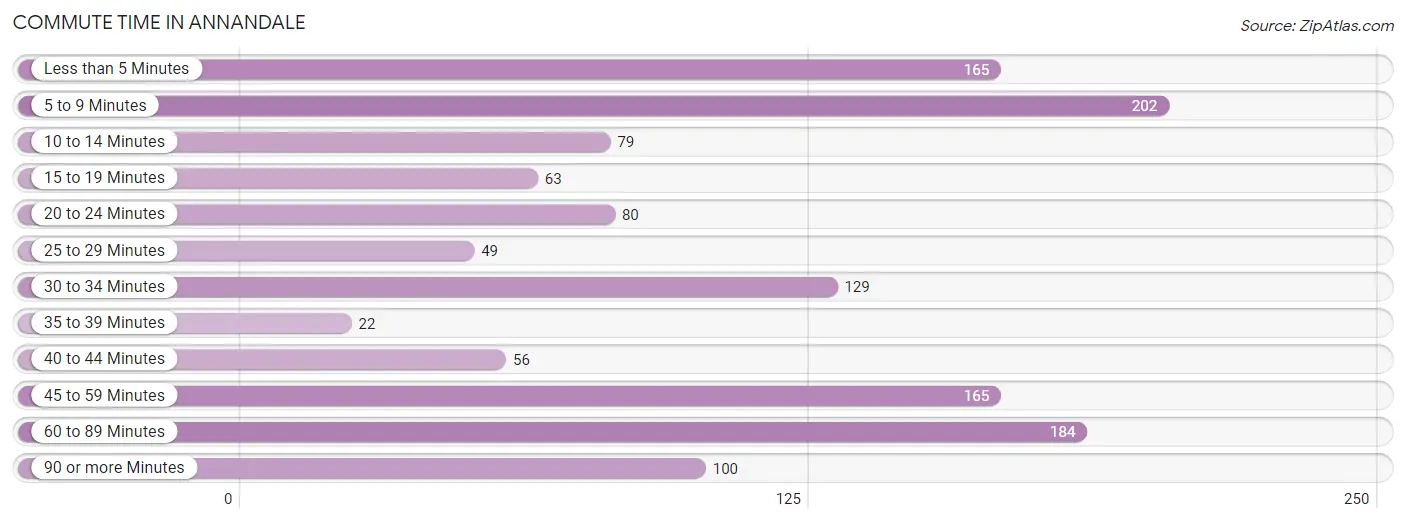
| Commute Time | # Commuters | % Commuters |
| Less than 5 Minutes | 165 | 12.8% |
| 5 to 9 Minutes | 202 | 15.6% |
| 10 to 14 Minutes | 79 | 6.1% |
| 15 to 19 Minutes | 63 | 4.9% |
| 20 to 24 Minutes | 80 | 6.2% |
| 25 to 29 Minutes | 49 | 3.8% |
| 30 to 34 Minutes | 129 | 10.0% |
| 35 to 39 Minutes | 22 | 1.7% |
| 40 to 44 Minutes | 56 | 4.3% |
| 45 to 59 Minutes | 165 | 12.8% |
| 60 to 89 Minutes | 184 | 14.2% |
| 90 or more Minutes | 100 | 7.7% |
Commute Time by Sex in Annandale
The most common commute times in Annandale are 60 to 89 minutes (116 commuters, 19.5%) for males and 5 to 9 minutes (121 commuters, 17.3%) for females.
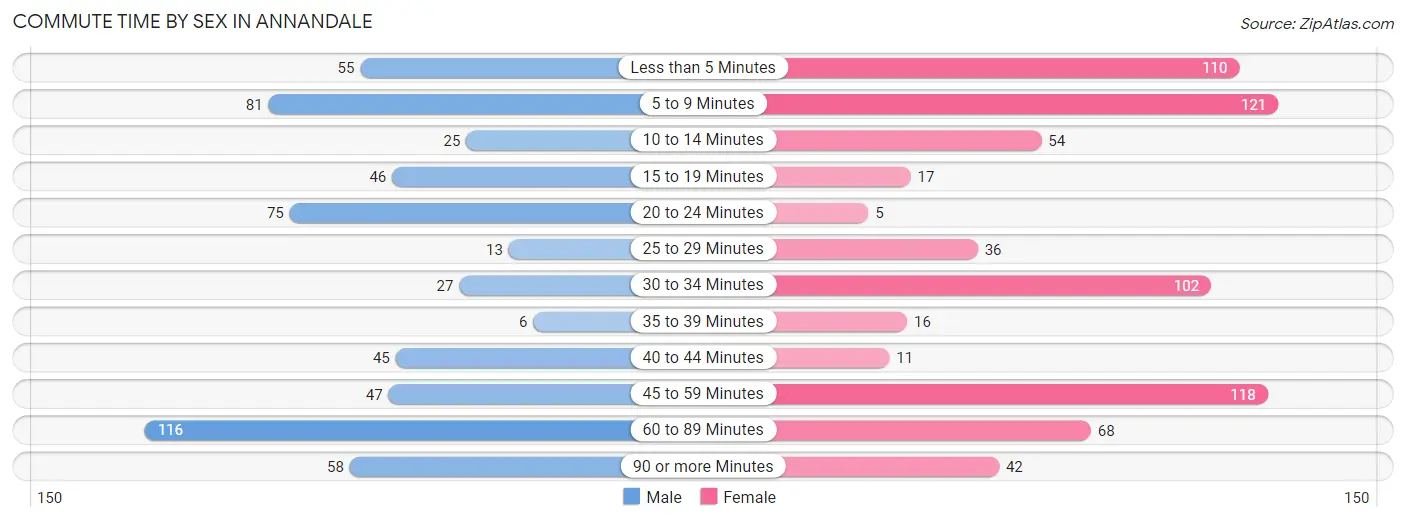
| Commute Time | Male | Female |
| Less than 5 Minutes | 55 (9.3%) | 110 (15.7%) |
| 5 to 9 Minutes | 81 (13.6%) | 121 (17.3%) |
| 10 to 14 Minutes | 25 (4.2%) | 54 (7.7%) |
| 15 to 19 Minutes | 46 (7.7%) | 17 (2.4%) |
| 20 to 24 Minutes | 75 (12.6%) | 5 (0.7%) |
| 25 to 29 Minutes | 13 (2.2%) | 36 (5.1%) |
| 30 to 34 Minutes | 27 (4.5%) | 102 (14.6%) |
| 35 to 39 Minutes | 6 (1.0%) | 16 (2.3%) |
| 40 to 44 Minutes | 45 (7.6%) | 11 (1.6%) |
| 45 to 59 Minutes | 47 (7.9%) | 118 (16.9%) |
| 60 to 89 Minutes | 116 (19.5%) | 68 (9.7%) |
| 90 or more Minutes | 58 (9.8%) | 42 (6.0%) |
Time of Departure to Work by Sex in Annandale
The most frequent times of departure to work in Annandale are 6:30 AM to 6:59 AM (165, 27.8%) for males and 6:30 AM to 6:59 AM (153, 21.9%) for females.
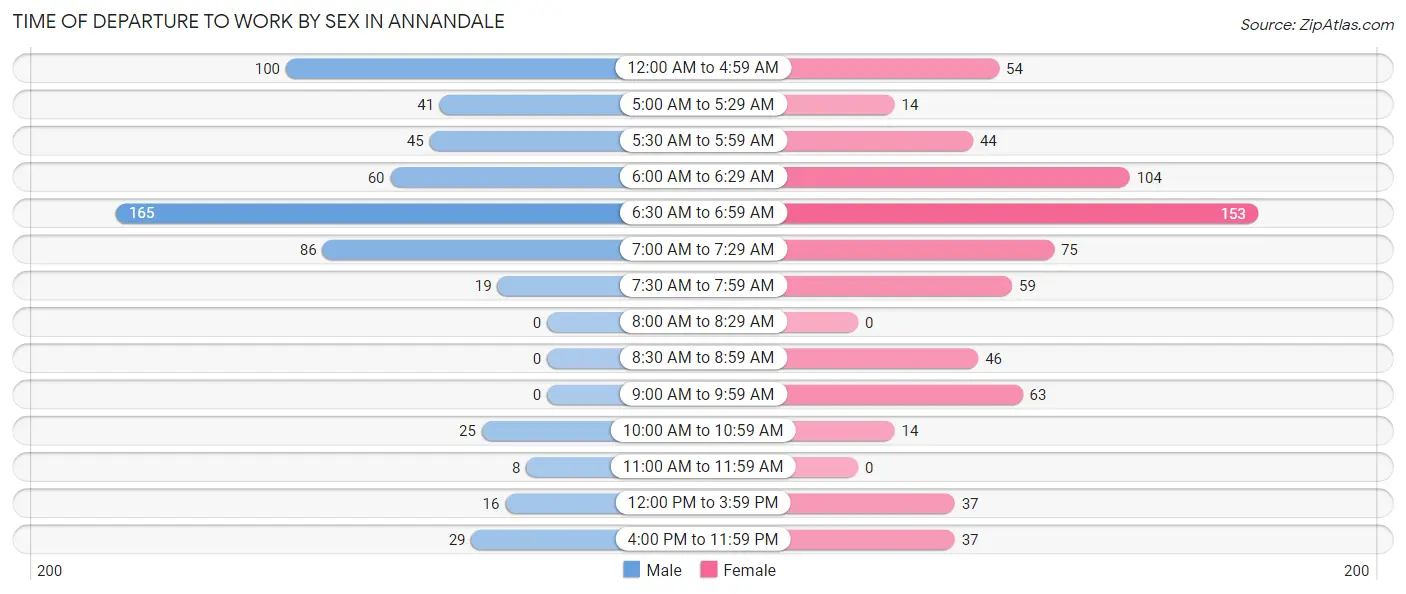
| Time of Departure | Male | Female |
| 12:00 AM to 4:59 AM | 100 (16.8%) | 54 (7.7%) |
| 5:00 AM to 5:29 AM | 41 (6.9%) | 14 (2.0%) |
| 5:30 AM to 5:59 AM | 45 (7.6%) | 44 (6.3%) |
| 6:00 AM to 6:29 AM | 60 (10.1%) | 104 (14.9%) |
| 6:30 AM to 6:59 AM | 165 (27.8%) | 153 (21.9%) |
| 7:00 AM to 7:29 AM | 86 (14.5%) | 75 (10.7%) |
| 7:30 AM to 7:59 AM | 19 (3.2%) | 59 (8.4%) |
| 8:00 AM to 8:29 AM | 0 (0.0%) | 0 (0.0%) |
| 8:30 AM to 8:59 AM | 0 (0.0%) | 46 (6.6%) |
| 9:00 AM to 9:59 AM | 0 (0.0%) | 63 (9.0%) |
| 10:00 AM to 10:59 AM | 25 (4.2%) | 14 (2.0%) |
| 11:00 AM to 11:59 AM | 8 (1.3%) | 0 (0.0%) |
| 12:00 PM to 3:59 PM | 16 (2.7%) | 37 (5.3%) |
| 4:00 PM to 11:59 PM | 29 (4.9%) | 37 (5.3%) |
| Total | 594 (100.0%) | 700 (100.0%) |
Housing Occupancy in Annandale
Occupancy by Ownership in Annandale
Of the total 1,314 dwellings in Annandale, owner-occupied units account for 989 (75.3%), while renter-occupied units make up 325 (24.7%).
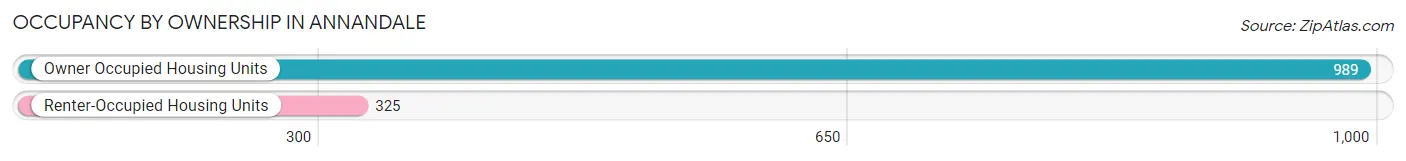
| Occupancy | # Housing Units | % Housing Units |
| Owner Occupied Housing Units | 989 | 75.3% |
| Renter-Occupied Housing Units | 325 | 24.7% |
| Total Occupied Housing Units | 1,314 | 100.0% |
Occupancy by Household Size in Annandale
| Household Size | # Housing Units | % Housing Units |
| 1-Person Household | 324 | 24.7% |
| 2-Person Household | 609 | 46.4% |
| 3-Person Household | 107 | 8.1% |
| 4+ Person Household | 274 | 20.8% |
| Total Housing Units | 1,314 | 100.0% |
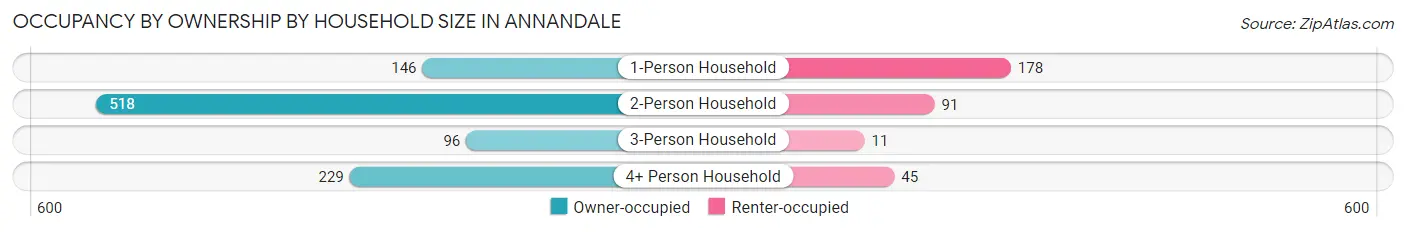
Occupancy by Ownership by Household Size in Annandale
| Household Size | Owner-occupied | Renter-occupied |
| 1-Person Household | 146 (45.1%) | 178 (54.9%) |
| 2-Person Household | 518 (85.1%) | 91 (14.9%) |
| 3-Person Household | 96 (89.7%) | 11 (10.3%) |
| 4+ Person Household | 229 (83.6%) | 45 (16.4%) |
| Total Housing Units | 989 (75.3%) | 325 (24.7%) |
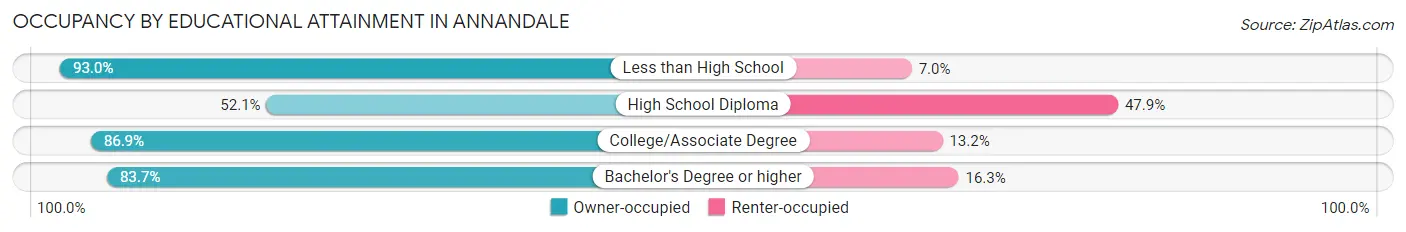
Occupancy by Educational Attainment in Annandale
| Household Size | Owner-occupied | Renter-occupied |
| Less than High School | 66 (93.0%) | 5 (7.0%) |
| High School Diploma | 215 (52.1%) | 198 (47.9%) |
| College/Associate Degree | 370 (86.9%) | 56 (13.2%) |
| Bachelor's Degree or higher | 338 (83.7%) | 66 (16.3%) |
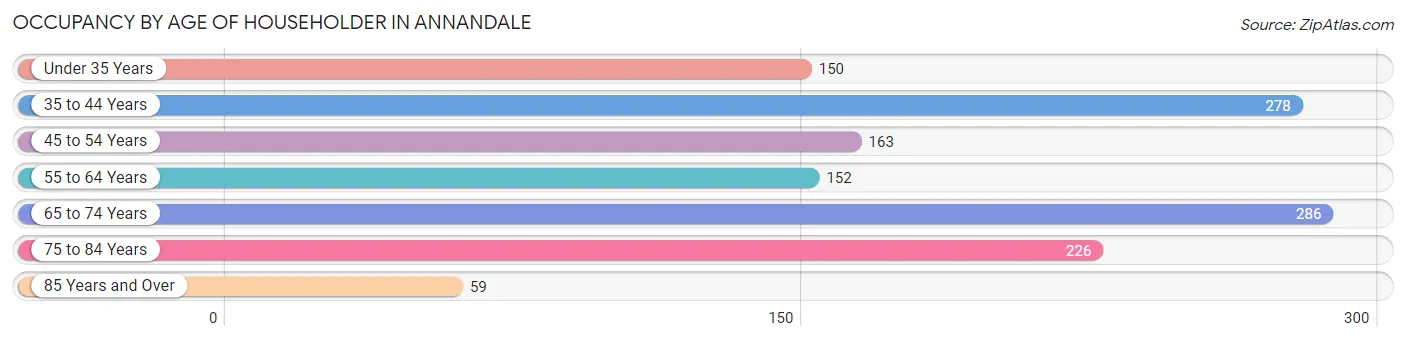
Occupancy by Age of Householder in Annandale
| Age Bracket | # Households | % Households |
| Under 35 Years | 150 | 11.4% |
| 35 to 44 Years | 278 | 21.2% |
| 45 to 54 Years | 163 | 12.4% |
| 55 to 64 Years | 152 | 11.6% |
| 65 to 74 Years | 286 | 21.8% |
| 75 to 84 Years | 226 | 17.2% |
| 85 Years and Over | 59 | 4.5% |
| Total | 1,314 | 100.0% |
Housing Finances in Annandale
Median Income by Occupancy in Annandale
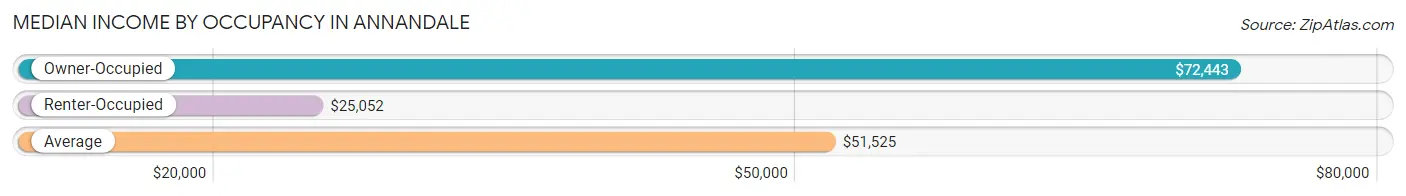
| Occupancy Type | # Households | Median Income |
| Owner-Occupied | 989 (75.3%) | $72,443 |
| Renter-Occupied | 325 (24.7%) | $25,052 |
| Average | 1,314 (100.0%) | $51,525 |
Occupancy by Householder Income Bracket in Annandale
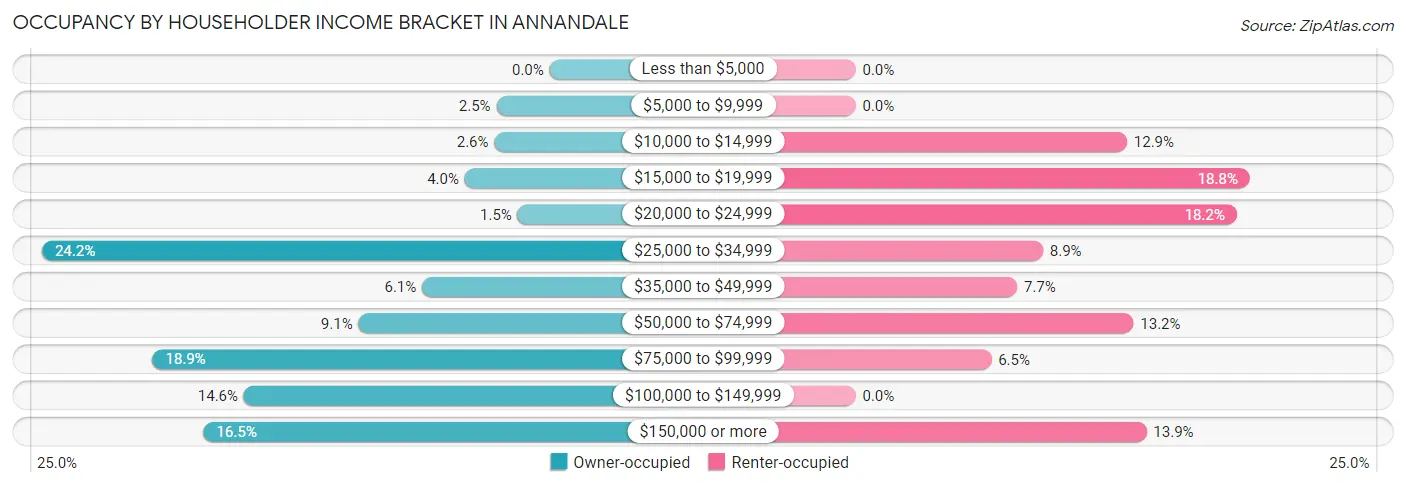
| Income Bracket | Owner-occupied | Renter-occupied |
| Less than $5,000 | 0 (0.0%) | 0 (0.0%) |
| $5,000 to $9,999 | 25 (2.5%) | 0 (0.0%) |
| $10,000 to $14,999 | 26 (2.6%) | 42 (12.9%) |
| $15,000 to $19,999 | 40 (4.0%) | 61 (18.8%) |
| $20,000 to $24,999 | 15 (1.5%) | 59 (18.1%) |
| $25,000 to $34,999 | 239 (24.2%) | 29 (8.9%) |
| $35,000 to $49,999 | 60 (6.1%) | 25 (7.7%) |
| $50,000 to $74,999 | 90 (9.1%) | 43 (13.2%) |
| $75,000 to $99,999 | 187 (18.9%) | 21 (6.5%) |
| $100,000 to $149,999 | 144 (14.6%) | 0 (0.0%) |
| $150,000 or more | 163 (16.5%) | 45 (13.9%) |
| Total | 989 (100.0%) | 325 (100.0%) |
Monthly Housing Cost Tiers in Annandale
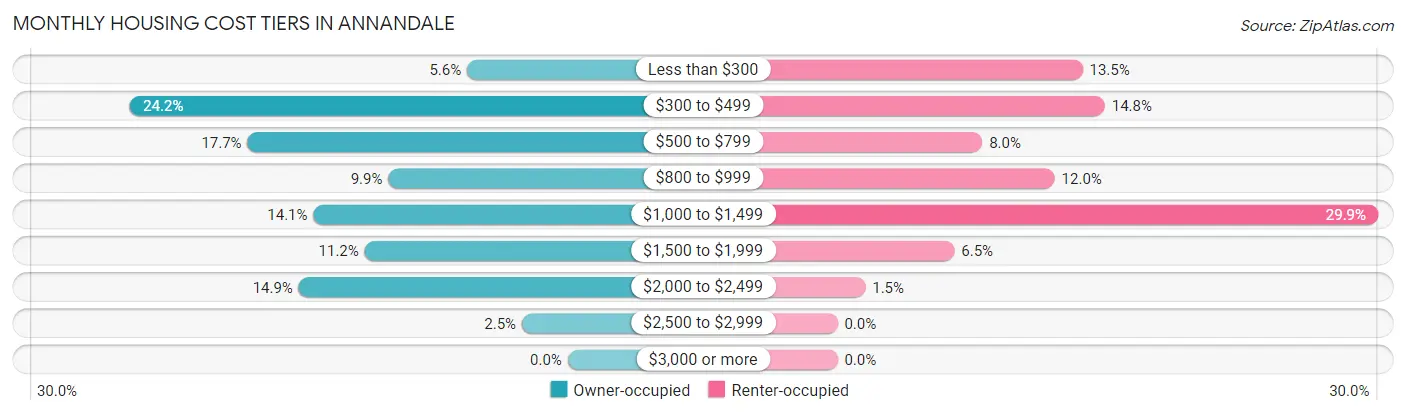
| Monthly Cost | Owner-occupied | Renter-occupied |
| Less than $300 | 55 (5.6%) | 44 (13.5%) |
| $300 to $499 | 239 (24.2%) | 48 (14.8%) |
| $500 to $799 | 175 (17.7%) | 26 (8.0%) |
| $800 to $999 | 98 (9.9%) | 39 (12.0%) |
| $1,000 to $1,499 | 139 (14.1%) | 97 (29.8%) |
| $1,500 to $1,999 | 111 (11.2%) | 21 (6.5%) |
| $2,000 to $2,499 | 147 (14.9%) | 5 (1.5%) |
| $2,500 to $2,999 | 25 (2.5%) | 0 (0.0%) |
| $3,000 or more | 0 (0.0%) | 0 (0.0%) |
| Total | 989 (100.0%) | 325 (100.0%) |
Physical Housing Characteristics in Annandale
Housing Structures in Annandale
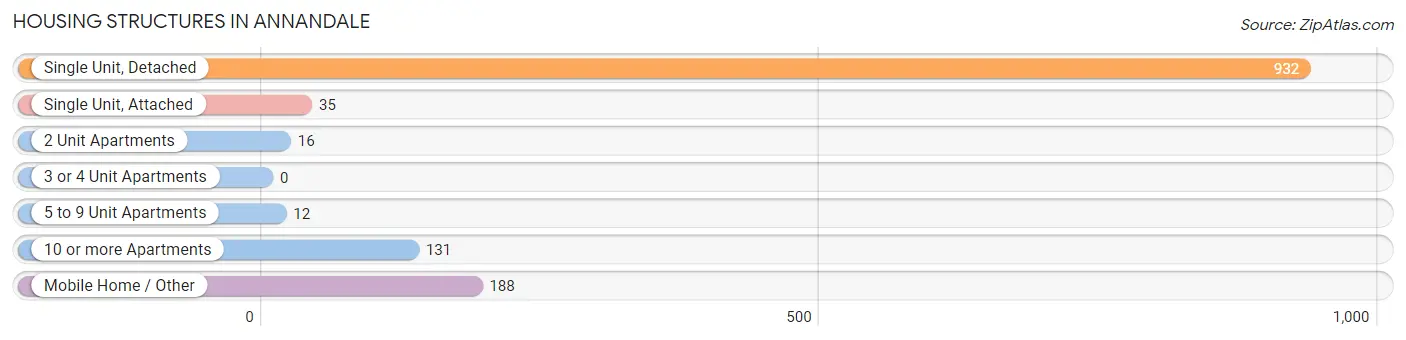
| Structure Type | # Housing Units | % Housing Units |
| Single Unit, Detached | 932 | 70.9% |
| Single Unit, Attached | 35 | 2.7% |
| 2 Unit Apartments | 16 | 1.2% |
| 3 or 4 Unit Apartments | 0 | 0.0% |
| 5 to 9 Unit Apartments | 12 | 0.9% |
| 10 or more Apartments | 131 | 10.0% |
| Mobile Home / Other | 188 | 14.3% |
| Total | 1,314 | 100.0% |
Housing Structures by Occupancy in Annandale
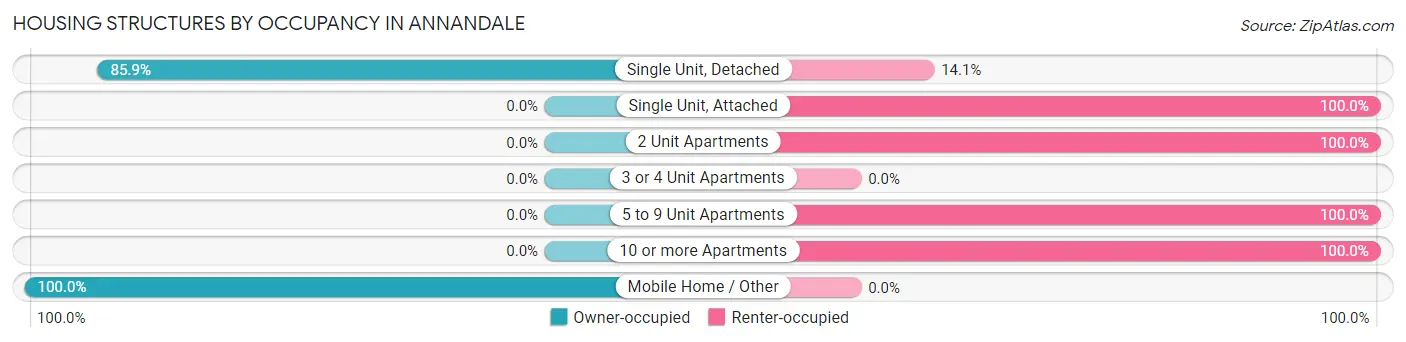
| Structure Type | Owner-occupied | Renter-occupied |
| Single Unit, Detached | 801 (85.9%) | 131 (14.1%) |
| Single Unit, Attached | 0 (0.0%) | 35 (100.0%) |
| 2 Unit Apartments | 0 (0.0%) | 16 (100.0%) |
| 3 or 4 Unit Apartments | 0 (0.0%) | 0 (0.0%) |
| 5 to 9 Unit Apartments | 0 (0.0%) | 12 (100.0%) |
| 10 or more Apartments | 0 (0.0%) | 131 (100.0%) |
| Mobile Home / Other | 188 (100.0%) | 0 (0.0%) |
| Total | 989 (75.3%) | 325 (24.7%) |
Housing Structures by Number of Rooms in Annandale
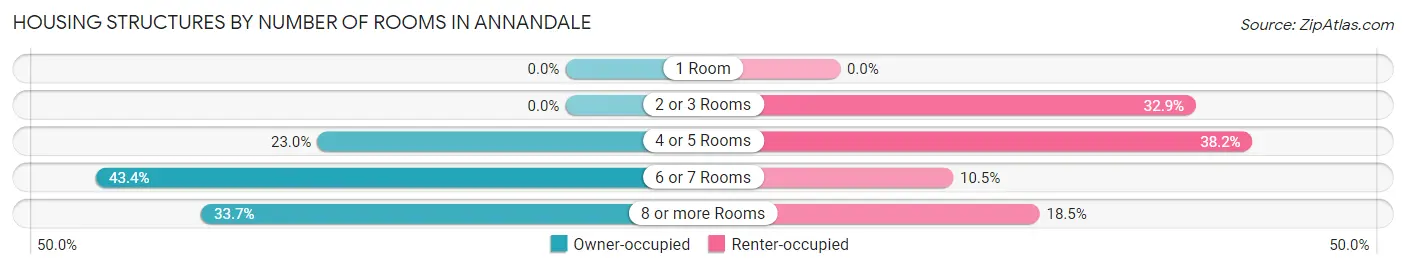
| Number of Rooms | Owner-occupied | Renter-occupied |
| 1 Room | 0 (0.0%) | 0 (0.0%) |
| 2 or 3 Rooms | 0 (0.0%) | 107 (32.9%) |
| 4 or 5 Rooms | 227 (23.0%) | 124 (38.2%) |
| 6 or 7 Rooms | 429 (43.4%) | 34 (10.5%) |
| 8 or more Rooms | 333 (33.7%) | 60 (18.5%) |
| Total | 989 (100.0%) | 325 (100.0%) |
Housing Structure by Heating Type in Annandale
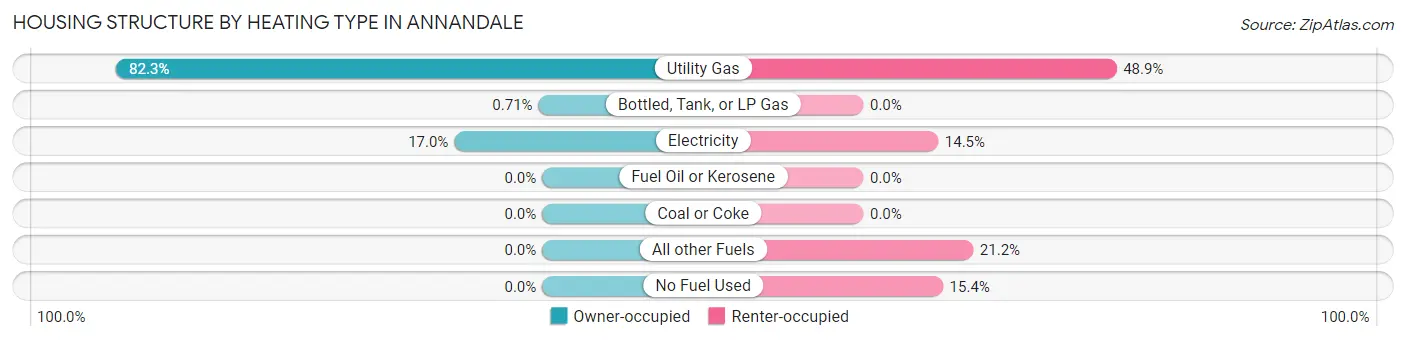
| Heating Type | Owner-occupied | Renter-occupied |
| Utility Gas | 814 (82.3%) | 159 (48.9%) |
| Bottled, Tank, or LP Gas | 7 (0.7%) | 0 (0.0%) |
| Electricity | 168 (17.0%) | 47 (14.5%) |
| Fuel Oil or Kerosene | 0 (0.0%) | 0 (0.0%) |
| Coal or Coke | 0 (0.0%) | 0 (0.0%) |
| All other Fuels | 0 (0.0%) | 69 (21.2%) |
| No Fuel Used | 0 (0.0%) | 50 (15.4%) |
| Total | 989 (100.0%) | 325 (100.0%) |
Household Vehicle Usage in Annandale
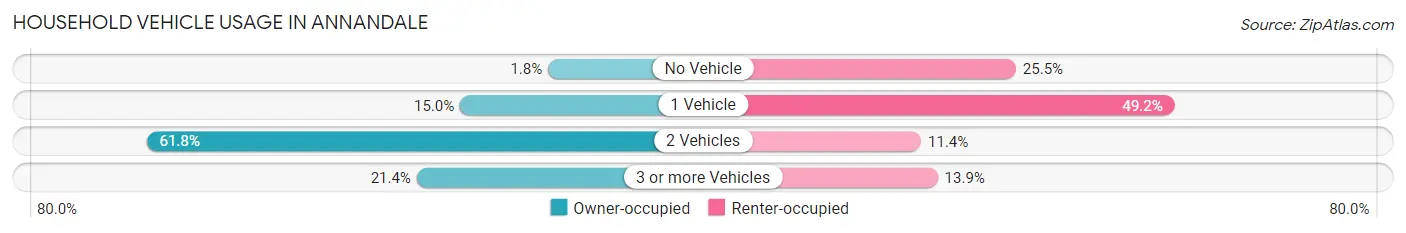
| Vehicles per Household | Owner-occupied | Renter-occupied |
| No Vehicle | 18 (1.8%) | 83 (25.5%) |
| 1 Vehicle | 148 (15.0%) | 160 (49.2%) |
| 2 Vehicles | 611 (61.8%) | 37 (11.4%) |
| 3 or more Vehicles | 212 (21.4%) | 45 (13.9%) |
| Total | 989 (100.0%) | 325 (100.0%) |
Real Estate & Mortgages in Annandale
Real Estate and Mortgage Overview in Annandale
| Characteristic | Without Mortgage | With Mortgage |
| Housing Units | 426 | 563 |
| Median Property Value | $161,100 | $271,100 |
| Median Household Income | $34,685 | $117 |
| Monthly Housing Costs | $472 | $0 |
| Real Estate Taxes | $2,250 | $0 |
Property Value by Mortgage Status in Annandale
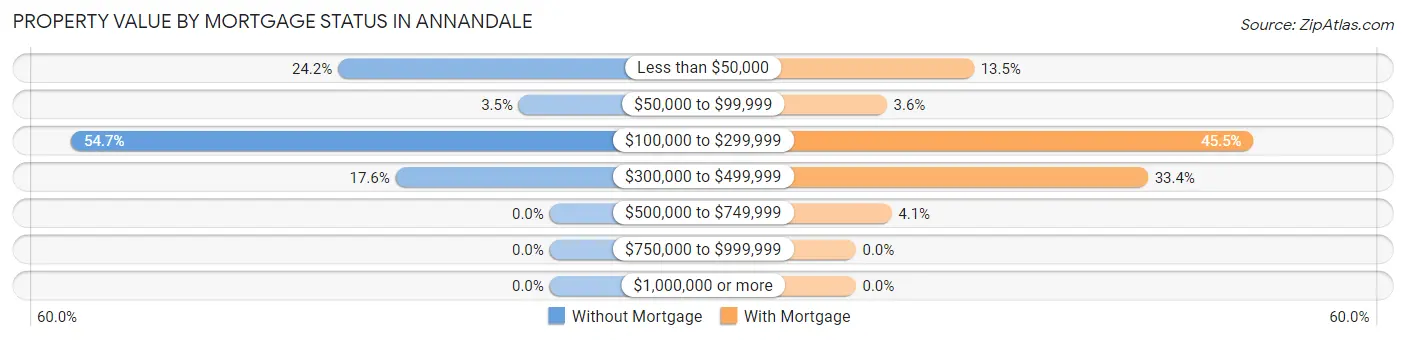
| Property Value | Without Mortgage | With Mortgage |
| Less than $50,000 | 103 (24.2%) | 76 (13.5%) |
| $50,000 to $99,999 | 15 (3.5%) | 20 (3.5%) |
| $100,000 to $299,999 | 233 (54.7%) | 256 (45.5%) |
| $300,000 to $499,999 | 75 (17.6%) | 188 (33.4%) |
| $500,000 to $749,999 | 0 (0.0%) | 23 (4.1%) |
| $750,000 to $999,999 | 0 (0.0%) | 0 (0.0%) |
| $1,000,000 or more | 0 (0.0%) | 0 (0.0%) |
| Total | 426 (100.0%) | 563 (100.0%) |
Household Income by Mortgage Status in Annandale
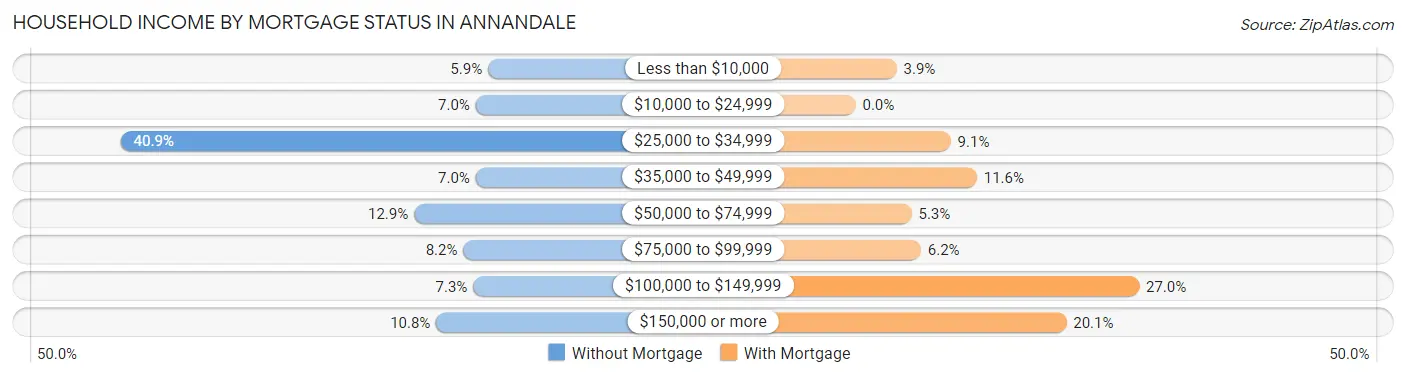
| Household Income | Without Mortgage | With Mortgage |
| Less than $10,000 | 25 (5.9%) | 22 (3.9%) |
| $10,000 to $24,999 | 30 (7.0%) | 0 (0.0%) |
| $25,000 to $34,999 | 174 (40.8%) | 51 (9.1%) |
| $35,000 to $49,999 | 30 (7.0%) | 65 (11.6%) |
| $50,000 to $74,999 | 55 (12.9%) | 30 (5.3%) |
| $75,000 to $99,999 | 35 (8.2%) | 35 (6.2%) |
| $100,000 to $149,999 | 31 (7.3%) | 152 (27.0%) |
| $150,000 or more | 46 (10.8%) | 113 (20.1%) |
| Total | 426 (100.0%) | 563 (100.0%) |
Property Value to Household Income Ratio in Annandale
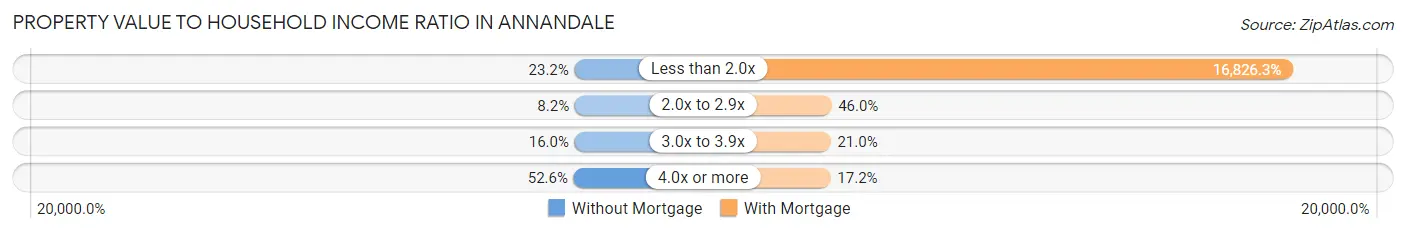
| Value-to-Income Ratio | Without Mortgage | With Mortgage |
| Less than 2.0x | 99 (23.2%) | 94,732 (16,826.3%) |
| 2.0x to 2.9x | 35 (8.2%) | 259 (46.0%) |
| 3.0x to 3.9x | 68 (16.0%) | 118 (21.0%) |
| 4.0x or more | 224 (52.6%) | 97 (17.2%) |
| Total | 426 (100.0%) | 563 (100.0%) |
Real Estate Taxes by Mortgage Status in Annandale
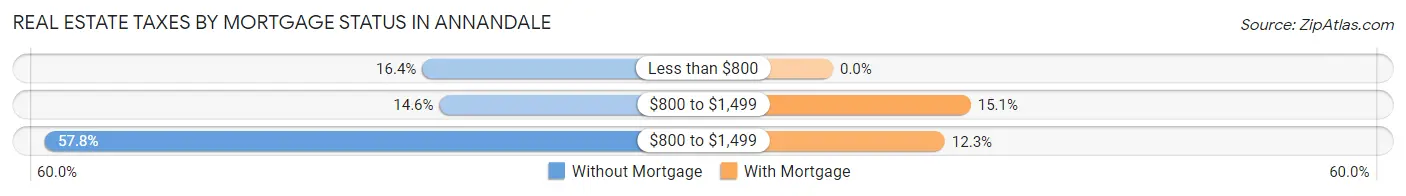
| Property Taxes | Without Mortgage | With Mortgage |
| Less than $800 | 70 (16.4%) | 0 (0.0%) |
| $800 to $1,499 | 62 (14.5%) | 85 (15.1%) |
| $800 to $1,499 | 246 (57.8%) | 69 (12.3%) |
| Total | 426 (100.0%) | 563 (100.0%) |
Health & Disability in Annandale
Health Insurance Coverage by Age in Annandale
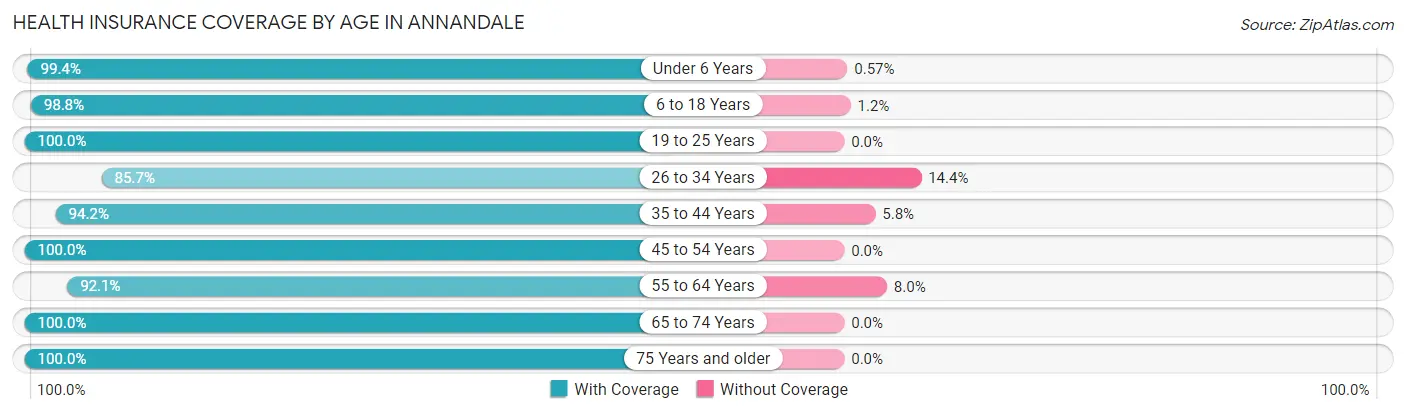
| Age Bracket | With Coverage | Without Coverage |
| Under 6 Years | 175 (99.4%) | 1 (0.6%) |
| 6 to 18 Years | 757 (98.8%) | 9 (1.2%) |
| 19 to 25 Years | 217 (100.0%) | 0 (0.0%) |
| 26 to 34 Years | 191 (85.7%) | 32 (14.3%) |
| 35 to 44 Years | 456 (94.2%) | 28 (5.8%) |
| 45 to 54 Years | 294 (100.0%) | 0 (0.0%) |
| 55 to 64 Years | 243 (92.0%) | 21 (8.0%) |
| 65 to 74 Years | 415 (100.0%) | 0 (0.0%) |
| 75 Years and older | 443 (100.0%) | 0 (0.0%) |
| Total | 3,191 (97.2%) | 91 (2.8%) |
Health Insurance Coverage by Citizenship Status in Annandale
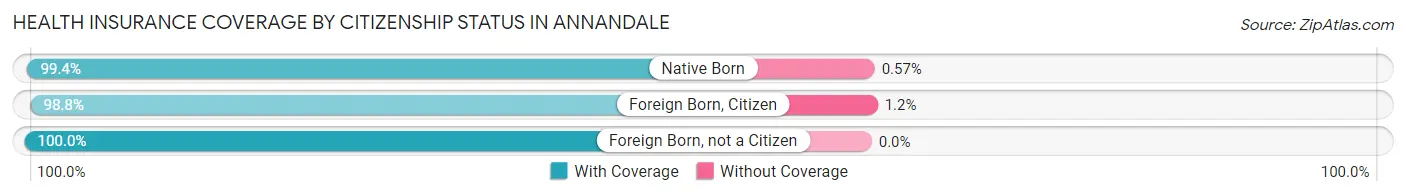
| Citizenship Status | With Coverage | Without Coverage |
| Native Born | 175 (99.4%) | 1 (0.6%) |
| Foreign Born, Citizen | 757 (98.8%) | 9 (1.2%) |
| Foreign Born, not a Citizen | 217 (100.0%) | 0 (0.0%) |
Health Insurance Coverage by Household Income in Annandale
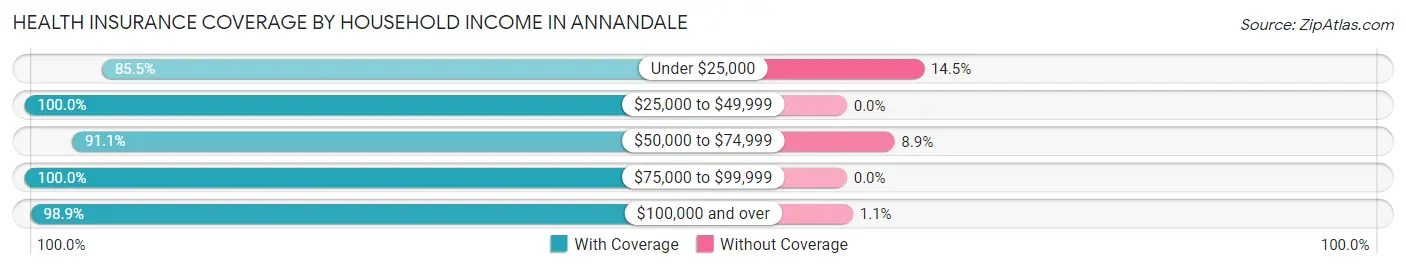
| Household Income | With Coverage | Without Coverage |
| Under $25,000 | 278 (85.5%) | 47 (14.5%) |
| $25,000 to $49,999 | 709 (100.0%) | 0 (0.0%) |
| $50,000 to $74,999 | 286 (91.1%) | 28 (8.9%) |
| $75,000 to $99,999 | 518 (100.0%) | 0 (0.0%) |
| $100,000 and over | 1,386 (98.9%) | 16 (1.1%) |
Public vs Private Health Insurance Coverage by Age in Annandale
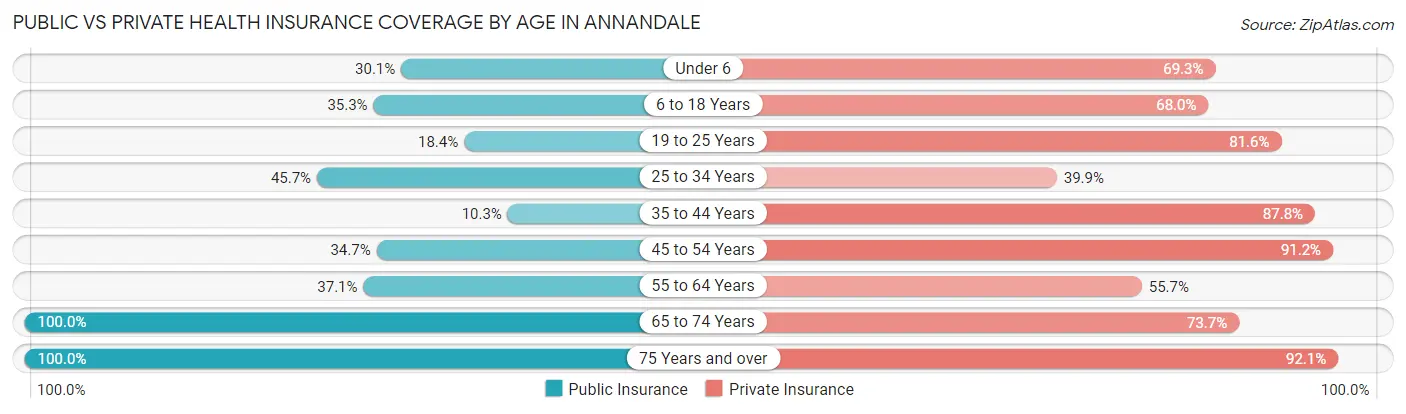
| Age Bracket | Public Insurance | Private Insurance |
| Under 6 | 53 (30.1%) | 122 (69.3%) |
| 6 to 18 Years | 270 (35.2%) | 521 (68.0%) |
| 19 to 25 Years | 40 (18.4%) | 177 (81.6%) |
| 25 to 34 Years | 102 (45.7%) | 89 (39.9%) |
| 35 to 44 Years | 50 (10.3%) | 425 (87.8%) |
| 45 to 54 Years | 102 (34.7%) | 268 (91.2%) |
| 55 to 64 Years | 98 (37.1%) | 147 (55.7%) |
| 65 to 74 Years | 415 (100.0%) | 306 (73.7%) |
| 75 Years and over | 443 (100.0%) | 408 (92.1%) |
| Total | 1,573 (47.9%) | 2,463 (75.0%) |
Disability Status by Sex by Age in Annandale
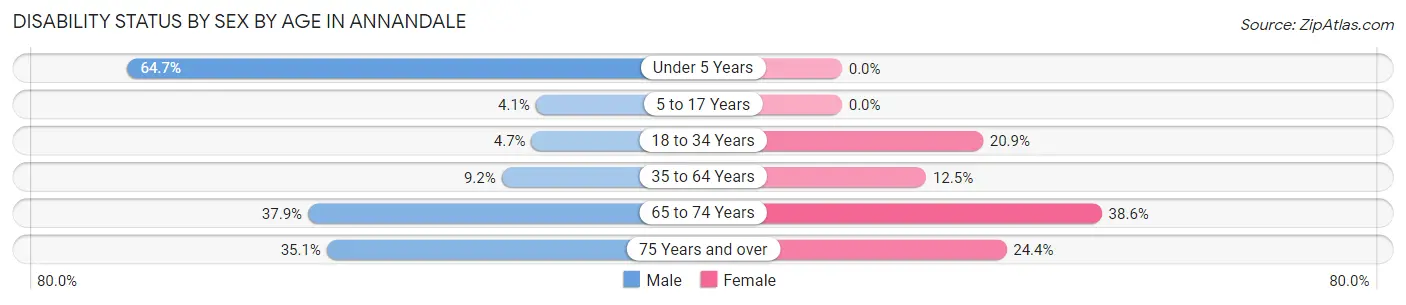
| Age Bracket | Male | Female |
| Under 5 Years | 11 (64.7%) | 0 (0.0%) |
| 5 to 17 Years | 15 (4.1%) | 0 (0.0%) |
| 18 to 34 Years | 11 (4.7%) | 67 (20.9%) |
| 35 to 64 Years | 45 (9.2%) | 69 (12.5%) |
| 65 to 74 Years | 66 (37.9%) | 93 (38.6%) |
| 75 Years and over | 65 (35.1%) | 63 (24.4%) |
Disability Class by Sex by Age in Annandale
Disability Class: Hearing Difficulty
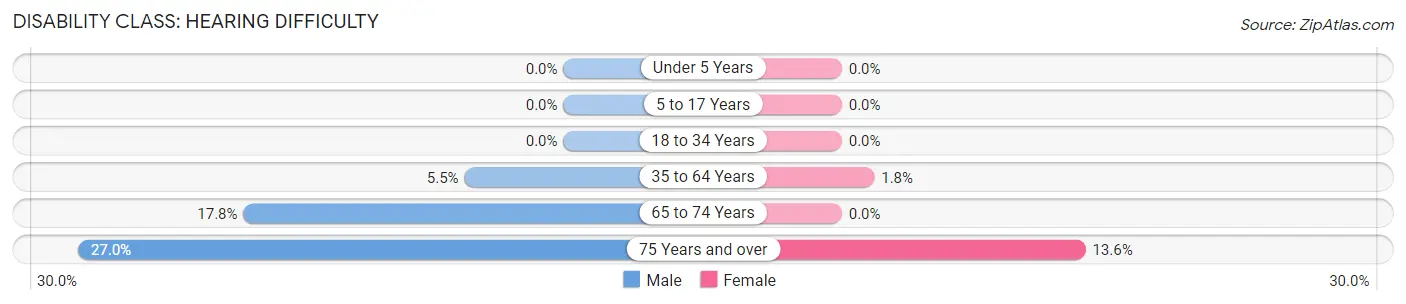
| Age Bracket | Male | Female |
| Under 5 Years | 0 (0.0%) | 0 (0.0%) |
| 5 to 17 Years | 0 (0.0%) | 0 (0.0%) |
| 18 to 34 Years | 0 (0.0%) | 0 (0.0%) |
| 35 to 64 Years | 27 (5.5%) | 10 (1.8%) |
| 65 to 74 Years | 31 (17.8%) | 0 (0.0%) |
| 75 Years and over | 50 (27.0%) | 35 (13.6%) |
Disability Class: Vision Difficulty
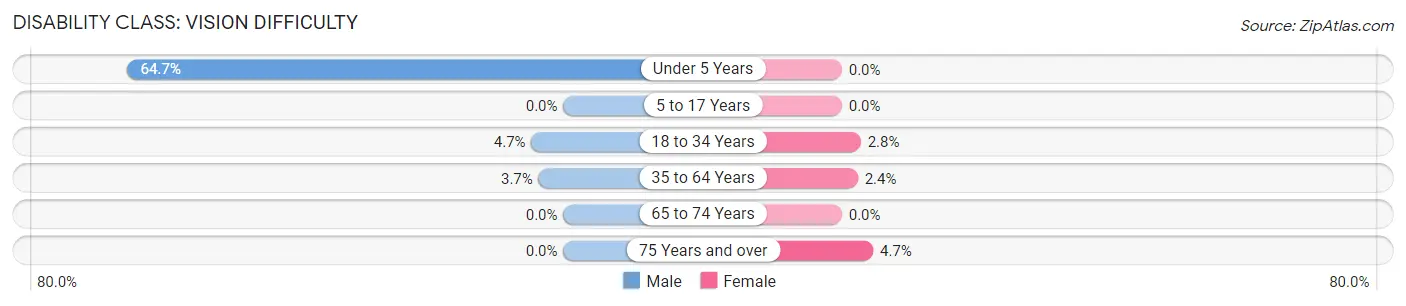
| Age Bracket | Male | Female |
| Under 5 Years | 11 (64.7%) | 0 (0.0%) |
| 5 to 17 Years | 0 (0.0%) | 0 (0.0%) |
| 18 to 34 Years | 11 (4.7%) | 9 (2.8%) |
| 35 to 64 Years | 18 (3.7%) | 13 (2.4%) |
| 65 to 74 Years | 0 (0.0%) | 0 (0.0%) |
| 75 Years and over | 0 (0.0%) | 12 (4.6%) |
Disability Class: Cognitive Difficulty
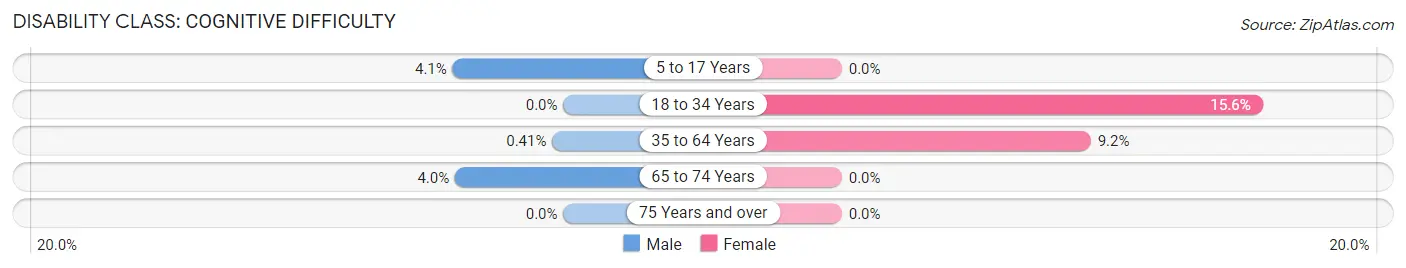
| Age Bracket | Male | Female |
| 5 to 17 Years | 15 (4.1%) | 0 (0.0%) |
| 18 to 34 Years | 0 (0.0%) | 50 (15.6%) |
| 35 to 64 Years | 2 (0.4%) | 51 (9.2%) |
| 65 to 74 Years | 7 (4.0%) | 0 (0.0%) |
| 75 Years and over | 0 (0.0%) | 0 (0.0%) |
Disability Class: Ambulatory Difficulty
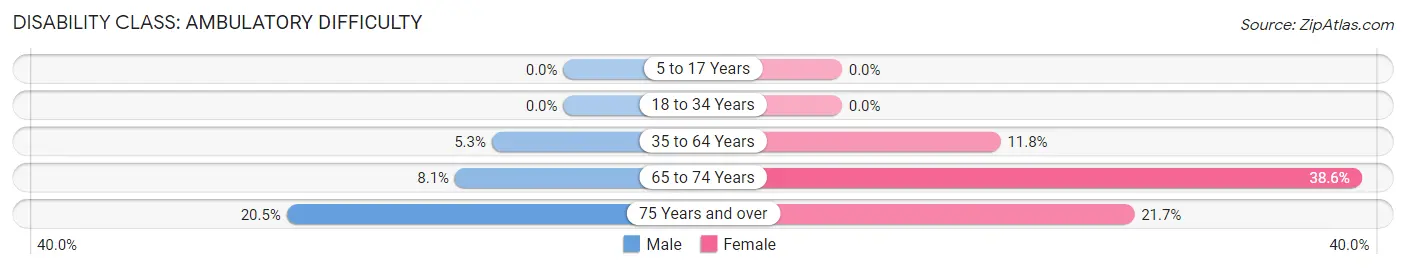
| Age Bracket | Male | Female |
| 5 to 17 Years | 0 (0.0%) | 0 (0.0%) |
| 18 to 34 Years | 0 (0.0%) | 0 (0.0%) |
| 35 to 64 Years | 26 (5.3%) | 65 (11.8%) |
| 65 to 74 Years | 14 (8.1%) | 93 (38.6%) |
| 75 Years and over | 38 (20.5%) | 56 (21.7%) |
Disability Class: Self-Care Difficulty
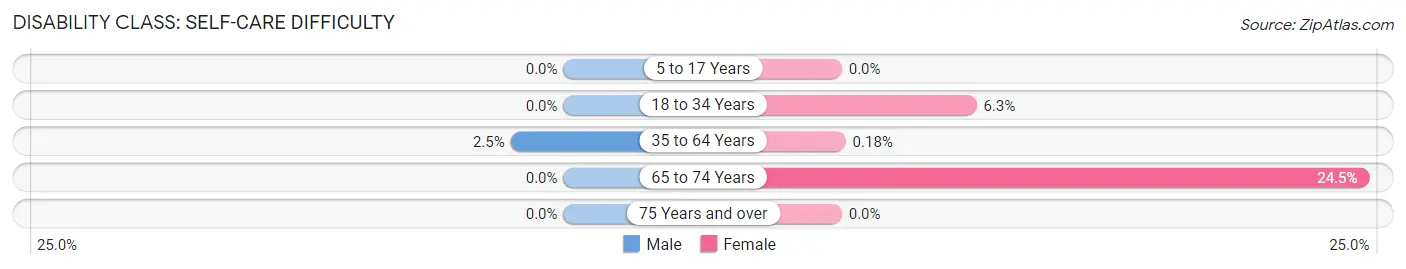
| Age Bracket | Male | Female |
| 5 to 17 Years | 0 (0.0%) | 0 (0.0%) |
| 18 to 34 Years | 0 (0.0%) | 20 (6.2%) |
| 35 to 64 Years | 12 (2.5%) | 1 (0.2%) |
| 65 to 74 Years | 0 (0.0%) | 59 (24.5%) |
| 75 Years and over | 0 (0.0%) | 0 (0.0%) |
Technology Access in Annandale
Computing Device Access in Annandale
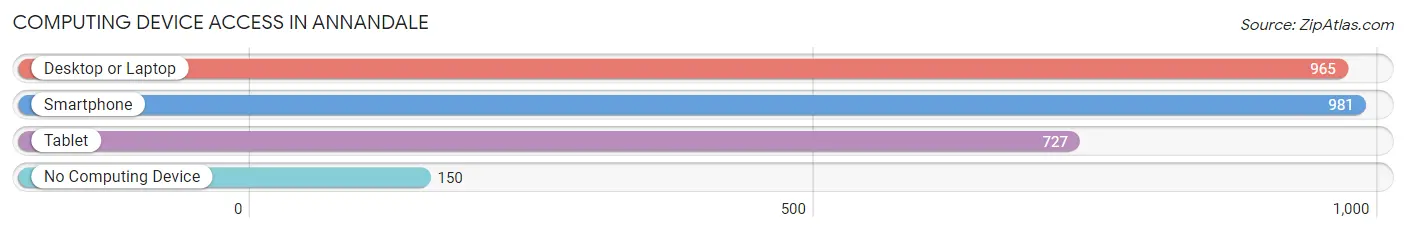
| Device Type | # Households | % Households |
| Desktop or Laptop | 965 | 73.4% |
| Smartphone | 981 | 74.7% |
| Tablet | 727 | 55.3% |
| No Computing Device | 150 | 11.4% |
| Total | 1,314 | 100.0% |
Internet Access in Annandale
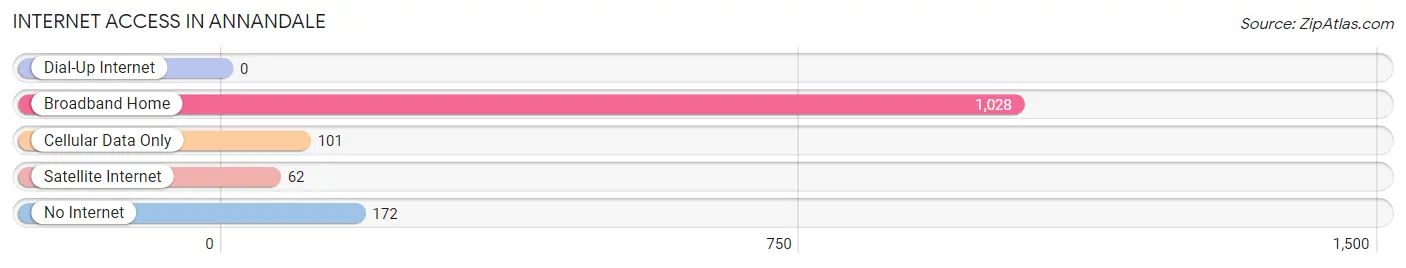
| Internet Type | # Households | % Households |
| Dial-Up Internet | 0 | 0.0% |
| Broadband Home | 1,028 | 78.2% |
| Cellular Data Only | 101 | 7.7% |
| Satellite Internet | 62 | 4.7% |
| No Internet | 172 | 13.1% |
| Total | 1,314 | 100.0% |
Annandale Summary
Annandale, Minnesota is a small city located in Wright County, in the central part of the state. It is situated on the banks of the Crow River, and is part of the Minneapolis-St. Paul metropolitan area. The city has a population of approximately 4,000 people, and is known for its small-town charm and friendly atmosphere.
History
The area that is now Annandale was first settled in the late 1800s by a group of German immigrants. The town was originally called “New Germany”, and was later renamed Annandale in honor of the Scottish town of Annan. The city was officially incorporated in 1891, and has since grown to become a thriving community.
Geography
Annandale is located in Wright County, in the central part of Minnesota. It is situated on the banks of the Crow River, and is part of the Minneapolis-St. Paul metropolitan area. The city has a total area of 4.2 square miles, all of which is land. The terrain is mostly flat, with some rolling hills in the surrounding area.
Economy
Annandale’s economy is largely based on agriculture and tourism. The city is home to several farms, as well as a number of small businesses. The city also has a thriving tourism industry, with many visitors coming to enjoy the city’s small-town charm and outdoor activities.
Demographics
As of the 2010 census, Annandale had a population of 4,000 people. The racial makeup of the city was 97.2% White, 0.7% African American, 0.3% Native American, 0.3% Asian, 0.2% from other races, and 1.5% from two or more races. Hispanic or Latino of any race were 1.2% of the population.
Annandale is a small city with a friendly atmosphere and a strong sense of community. The city is home to a diverse population, and is a great place to live, work, and play. With its beautiful scenery and outdoor activities, Annandale is a great place to visit or call home.
Common Questions
What is Per Capita Income in Annandale?
Per Capita income in Annandale is $30,629.
What is the Median Family Income in Annandale?
Median Family Income in Annandale is $84,800.
What is the Median Household income in Annandale?
Median Household Income in Annandale is $51,525.
What is Income or Wage Gap in Annandale?
Income or Wage Gap in Annandale is 35.4%.
Women in Annandale earn 64.6 cents for every dollar earned by a man.
What is Inequality or Gini Index in Annandale?
Inequality or Gini Index in Annandale is 0.43.
What is the Total Population of Annandale?
Total Population of Annandale is 3,351.
What is the Total Male Population of Annandale?
Total Male Population of Annandale is 1,477.
What is the Total Female Population of Annandale?
Total Female Population of Annandale is 1,874.
What is the Ratio of Males per 100 Females in Annandale?
There are 78.82 Males per 100 Females in Annandale.
What is the Ratio of Females per 100 Males in Annandale?
There are 126.88 Females per 100 Males in Annandale.
What is the Median Population Age in Annandale?
Median Population Age in Annandale is 42.6 Years.
What is the Average Family Size in Annandale
Average Family Size in Annandale is 2.9 People.
What is the Average Household Size in Annandale
Average Household Size in Annandale is 2.5 People.
How Large is the Labor Force in Annandale?
There are 1,521 People in the Labor Forcein in Annandale.
What is the Percentage of People in the Labor Force in Annandale?
58.2% of People are in the Labor Force in Annandale.
What is the Unemployment Rate in Annandale?
Unemployment Rate in Annandale is 5.7%.