Thief River Falls, MN Map & Demographics
Thief River Falls Map
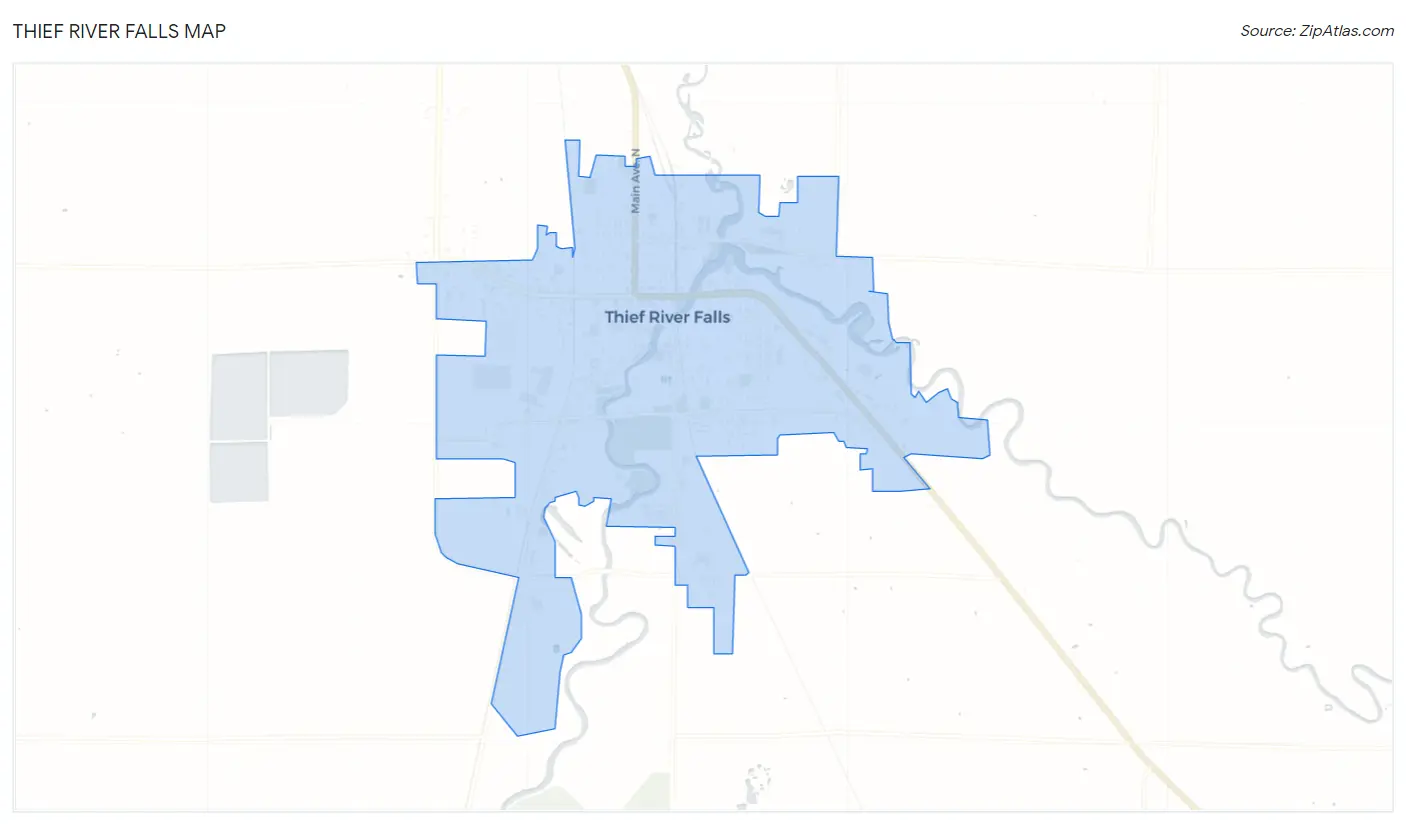
Thief River Falls Overview
$35,528
PER CAPITA INCOME
$88,239
AVG FAMILY INCOME
$65,086
AVG HOUSEHOLD INCOME
19.8%
WAGE / INCOME GAP [ % ]
80.2¢/ $1
WAGE / INCOME GAP [ $ ]
$10,875
FAMILY INCOME DEFICIT
0.39
INEQUALITY / GINI INDEX
8,871
TOTAL POPULATION
4,370
MALE POPULATION
4,501
FEMALE POPULATION
97.09
MALES / 100 FEMALES
103.00
FEMALES / 100 MALES
37.6
MEDIAN AGE
2.8
AVG FAMILY SIZE
2.1
AVG HOUSEHOLD SIZE
4,814
LABOR FORCE [ PEOPLE ]
67.2%
PERCENT IN LABOR FORCE
1.3%
UNEMPLOYMENT RATE
Thief River Falls Zip Codes
Thief River Falls Area Codes
Income in Thief River Falls
Income Overview in Thief River Falls
Per Capita Income in Thief River Falls is $35,528, while median incomes of families and households are $88,239 and $65,086 respectively.
| Characteristic | Number | Measure |
| Per Capita Income | 8,871 | $35,528 |
| Median Family Income | 2,125 | $88,239 |
| Mean Family Income | 2,125 | $93,981 |
| Median Household Income | 4,126 | $65,086 |
| Mean Household Income | 4,126 | $76,704 |
| Income Deficit | 2,125 | $10,875 |
| Wage / Income Gap (%) | 8,871 | 19.85% |
| Wage / Income Gap ($) | 8,871 | 80.15¢ per $1 |
| Gini / Inequality Index | 8,871 | 0.39 |
Earnings by Sex in Thief River Falls
Average Earnings in Thief River Falls are $45,205, $51,036 for men and $40,907 for women, a difference of 19.9%.
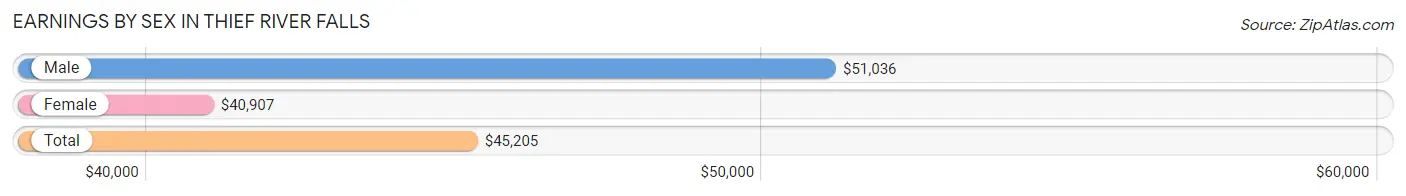
| Sex | Number | Average Earnings |
| Male | 2,690 (53.1%) | $51,036 |
| Female | 2,376 (46.9%) | $40,907 |
| Total | 5,066 (100.0%) | $45,205 |
Earnings by Sex by Income Bracket in Thief River Falls
The most common earnings brackets in Thief River Falls are $55,000 to $64,999 for men (401 | 14.9%) and $40,000 to $44,999 for women (305 | 12.8%).
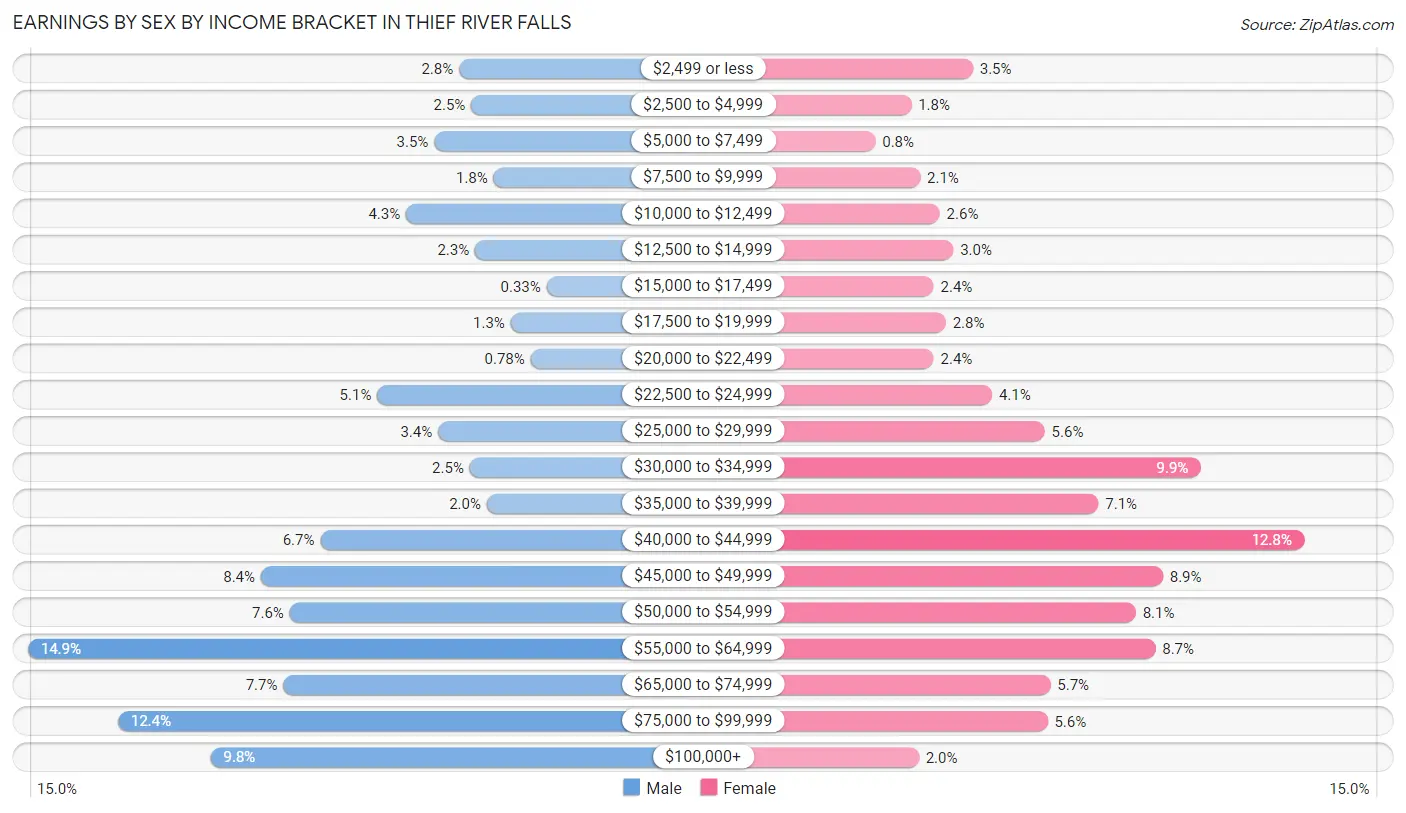
| Income | Male | Female |
| $2,499 or less | 75 (2.8%) | 84 (3.5%) |
| $2,500 to $4,999 | 66 (2.5%) | 43 (1.8%) |
| $5,000 to $7,499 | 94 (3.5%) | 19 (0.8%) |
| $7,500 to $9,999 | 49 (1.8%) | 49 (2.1%) |
| $10,000 to $12,499 | 115 (4.3%) | 62 (2.6%) |
| $12,500 to $14,999 | 63 (2.3%) | 71 (3.0%) |
| $15,000 to $17,499 | 9 (0.3%) | 58 (2.4%) |
| $17,500 to $19,999 | 36 (1.3%) | 66 (2.8%) |
| $20,000 to $22,499 | 21 (0.8%) | 58 (2.4%) |
| $22,500 to $24,999 | 137 (5.1%) | 97 (4.1%) |
| $25,000 to $29,999 | 91 (3.4%) | 132 (5.6%) |
| $30,000 to $34,999 | 67 (2.5%) | 236 (9.9%) |
| $35,000 to $39,999 | 54 (2.0%) | 168 (7.1%) |
| $40,000 to $44,999 | 180 (6.7%) | 305 (12.8%) |
| $45,000 to $49,999 | 225 (8.4%) | 211 (8.9%) |
| $50,000 to $54,999 | 203 (7.5%) | 193 (8.1%) |
| $55,000 to $64,999 | 401 (14.9%) | 206 (8.7%) |
| $65,000 to $74,999 | 208 (7.7%) | 136 (5.7%) |
| $75,000 to $99,999 | 333 (12.4%) | 134 (5.6%) |
| $100,000+ | 263 (9.8%) | 48 (2.0%) |
| Total | 2,690 (100.0%) | 2,376 (100.0%) |
Earnings by Sex by Educational Attainment in Thief River Falls
Average earnings in Thief River Falls are $54,632 for men and $42,705 for women, a difference of 21.8%. Men with an educational attainment of graduate degree enjoy the highest average annual earnings of $100,060, while those with less than high school education earn the least with $45,169. Women with an educational attainment of graduate degree earn the most with the average annual earnings of $66,813, while those with high school diploma education have the smallest earnings of $32,879.
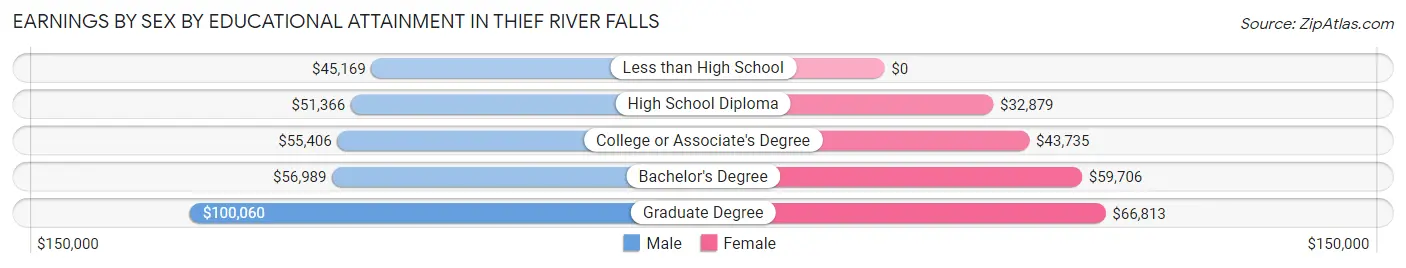
| Educational Attainment | Male Income | Female Income |
| Less than High School | $45,169 | $0 |
| High School Diploma | $51,366 | $32,879 |
| College or Associate's Degree | $55,406 | $43,735 |
| Bachelor's Degree | $56,989 | $59,706 |
| Graduate Degree | $100,060 | $66,813 |
| Total | $54,632 | $42,705 |
Family Income in Thief River Falls
Family Income Brackets in Thief River Falls
According to the Thief River Falls family income data, there are 657 families falling into the $100,000 to $149,999 income range, which is the most common income bracket and makes up 30.9% of all families. Conversely, the $10,000 to $14,999 income bracket is the least frequent group with only 17 families (0.8%) belonging to this category.
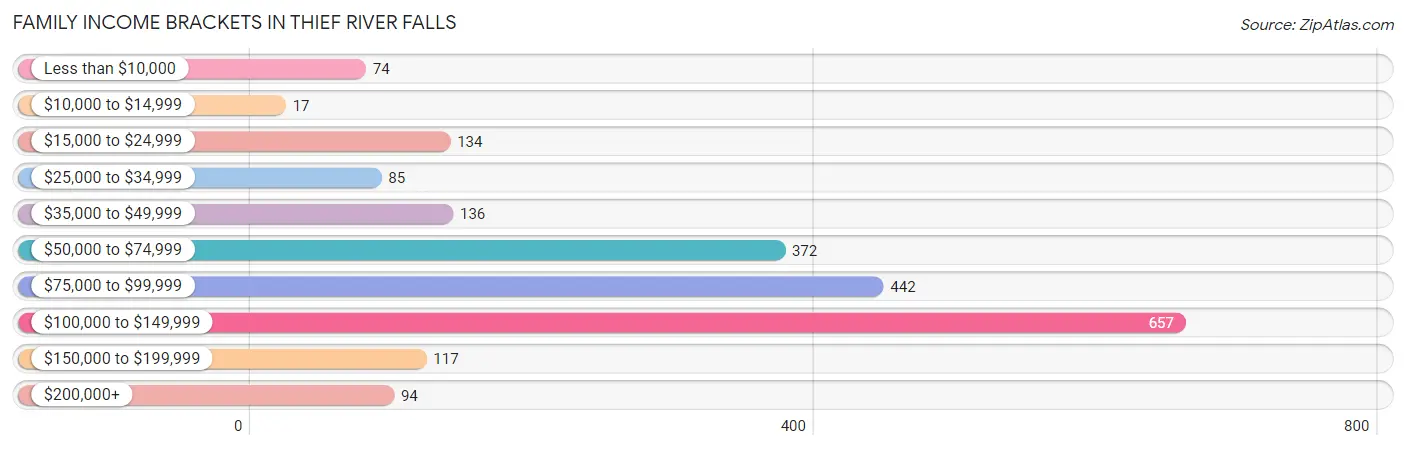
| Income Bracket | # Families | % Families |
| Less than $10,000 | 74 | 3.5% |
| $10,000 to $14,999 | 17 | 0.8% |
| $15,000 to $24,999 | 134 | 6.3% |
| $25,000 to $34,999 | 85 | 4.0% |
| $35,000 to $49,999 | 136 | 6.4% |
| $50,000 to $74,999 | 372 | 17.5% |
| $75,000 to $99,999 | 442 | 20.8% |
| $100,000 to $149,999 | 657 | 30.9% |
| $150,000 to $199,999 | 117 | 5.5% |
| $200,000+ | 94 | 4.4% |
Family Income by Famaliy Size in Thief River Falls
5-person families (123 | 5.8%) account for the highest median family income in Thief River Falls with $115,104 per family, while 2-person families (1,121 | 52.7%) have the highest median income of $40,302 per family member.
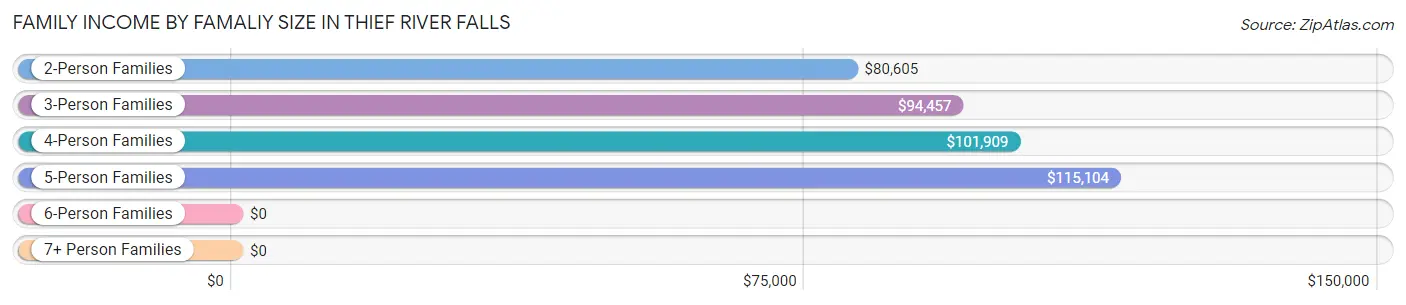
| Income Bracket | # Families | Median Income |
| 2-Person Families | 1,121 (52.7%) | $80,605 |
| 3-Person Families | 394 (18.5%) | $94,457 |
| 4-Person Families | 436 (20.5%) | $101,909 |
| 5-Person Families | 123 (5.8%) | $115,104 |
| 6-Person Families | 41 (1.9%) | $0 |
| 7+ Person Families | 10 (0.5%) | $0 |
| Total | 2,125 (100.0%) | $88,239 |
Family Income by Number of Earners in Thief River Falls
The median family income in Thief River Falls is $88,239, with families comprising 3+ earners (247) having the highest median family income of $117,063, while families with no earners (369) have the lowest median family income of $50,850, accounting for 11.6% and 17.4% of families, respectively.
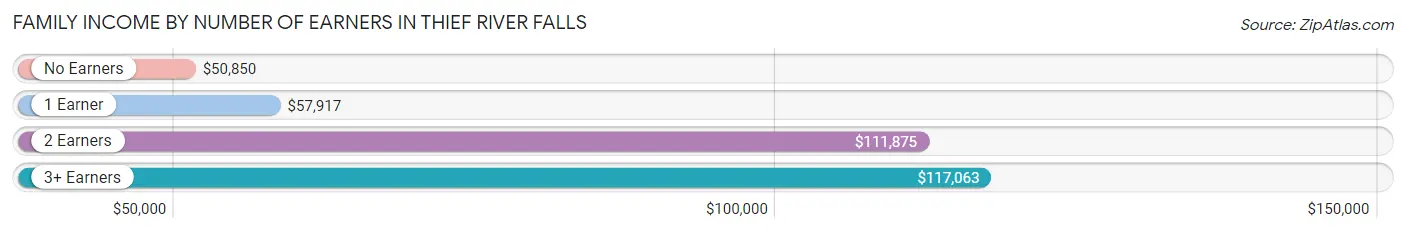
| Number of Earners | # Families | Median Income |
| No Earners | 369 (17.4%) | $50,850 |
| 1 Earner | 568 (26.7%) | $57,917 |
| 2 Earners | 941 (44.3%) | $111,875 |
| 3+ Earners | 247 (11.6%) | $117,063 |
| Total | 2,125 (100.0%) | $88,239 |
Household Income in Thief River Falls
Household Income Brackets in Thief River Falls
With 875 households falling in the category, the $100,000 to $149,999 income range is the most frequent in Thief River Falls, accounting for 21.2% of all households. In contrast, only 116 households (2.8%) fall into the less than $10,000 income bracket, making it the least populous group.
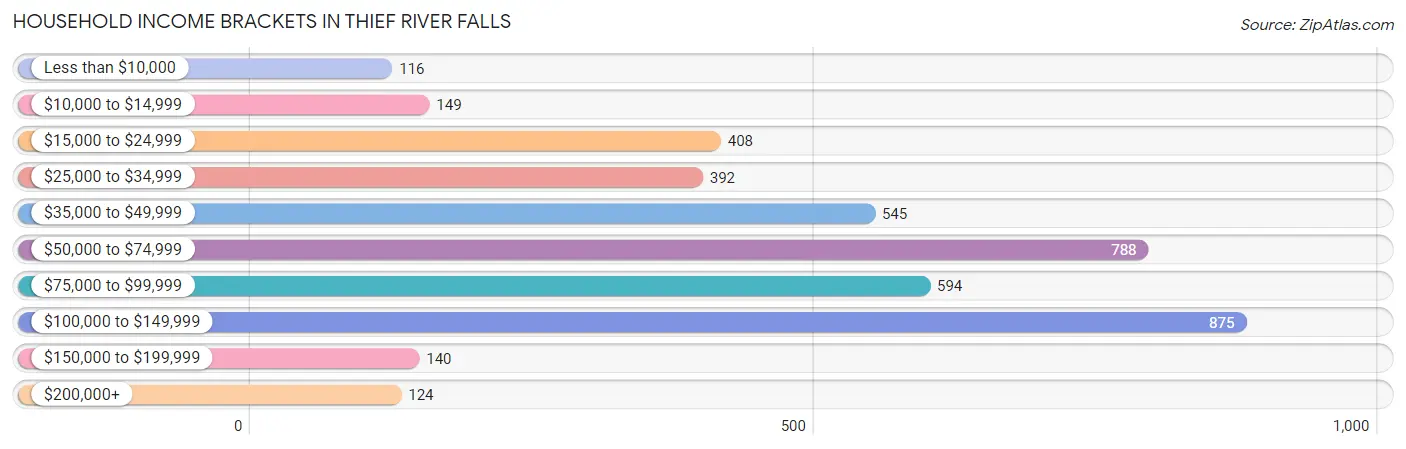
| Income Bracket | # Households | % Households |
| Less than $10,000 | 116 | 2.8% |
| $10,000 to $14,999 | 149 | 3.6% |
| $15,000 to $24,999 | 408 | 9.9% |
| $25,000 to $34,999 | 392 | 9.5% |
| $35,000 to $49,999 | 545 | 13.2% |
| $50,000 to $74,999 | 788 | 19.1% |
| $75,000 to $99,999 | 594 | 14.4% |
| $100,000 to $149,999 | 875 | 21.2% |
| $150,000 to $199,999 | 140 | 3.4% |
| $200,000+ | 124 | 3.0% |
Household Income by Householder Age in Thief River Falls
The median household income in Thief River Falls is $65,086, with the highest median household income of $76,433 found in the 45 to 64 years age bracket for the primary householder. A total of 1,201 households (29.1%) fall into this category. Meanwhile, the 65+ years age bracket for the primary householder has the lowest median household income of $43,627, with 1,074 households (26.0%) in this group.
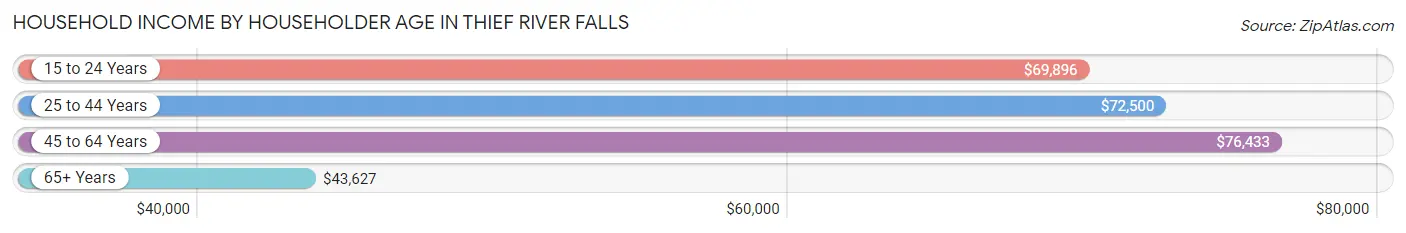
| Income Bracket | # Households | Median Income |
| 15 to 24 Years | 299 (7.2%) | $69,896 |
| 25 to 44 Years | 1,552 (37.6%) | $72,500 |
| 45 to 64 Years | 1,201 (29.1%) | $76,433 |
| 65+ Years | 1,074 (26.0%) | $43,627 |
| Total | 4,126 (100.0%) | $65,086 |
Poverty in Thief River Falls
Income Below Poverty by Sex and Age in Thief River Falls
With 11.5% poverty level for males and 11.2% for females among the residents of Thief River Falls, 16 and 17 year old males and 12 to 14 year old females are the most vulnerable to poverty, with 64 males (59.8%) and 44 females (28.0%) in their respective age groups living below the poverty level.
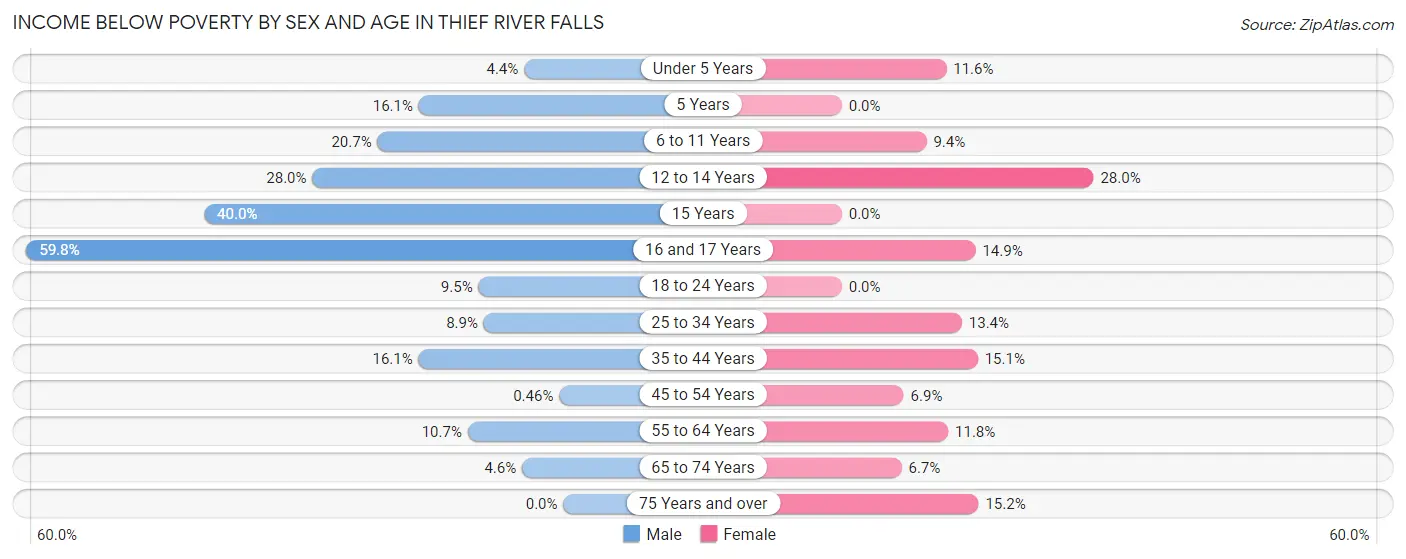
| Age Bracket | Male | Female |
| Under 5 Years | 10 (4.4%) | 37 (11.6%) |
| 5 Years | 19 (16.1%) | 0 (0.0%) |
| 6 to 11 Years | 53 (20.7%) | 25 (9.4%) |
| 12 to 14 Years | 45 (28.0%) | 44 (28.0%) |
| 15 Years | 32 (40.0%) | 0 (0.0%) |
| 16 and 17 Years | 64 (59.8%) | 14 (14.9%) |
| 18 to 24 Years | 45 (9.5%) | 0 (0.0%) |
| 25 to 34 Years | 63 (8.9%) | 88 (13.4%) |
| 35 to 44 Years | 80 (16.1%) | 89 (15.1%) |
| 45 to 54 Years | 2 (0.5%) | 29 (6.9%) |
| 55 to 64 Years | 61 (10.6%) | 63 (11.8%) |
| 65 to 74 Years | 18 (4.6%) | 31 (6.7%) |
| 75 Years and over | 0 (0.0%) | 70 (15.2%) |
| Total | 492 (11.5%) | 490 (11.2%) |
Income Above Poverty by Sex and Age in Thief River Falls
According to the poverty statistics in Thief River Falls, males aged 75 years and over and females aged 5 years are the age groups that are most secure financially, with 100.0% of males and 100.0% of females in these age groups living above the poverty line.
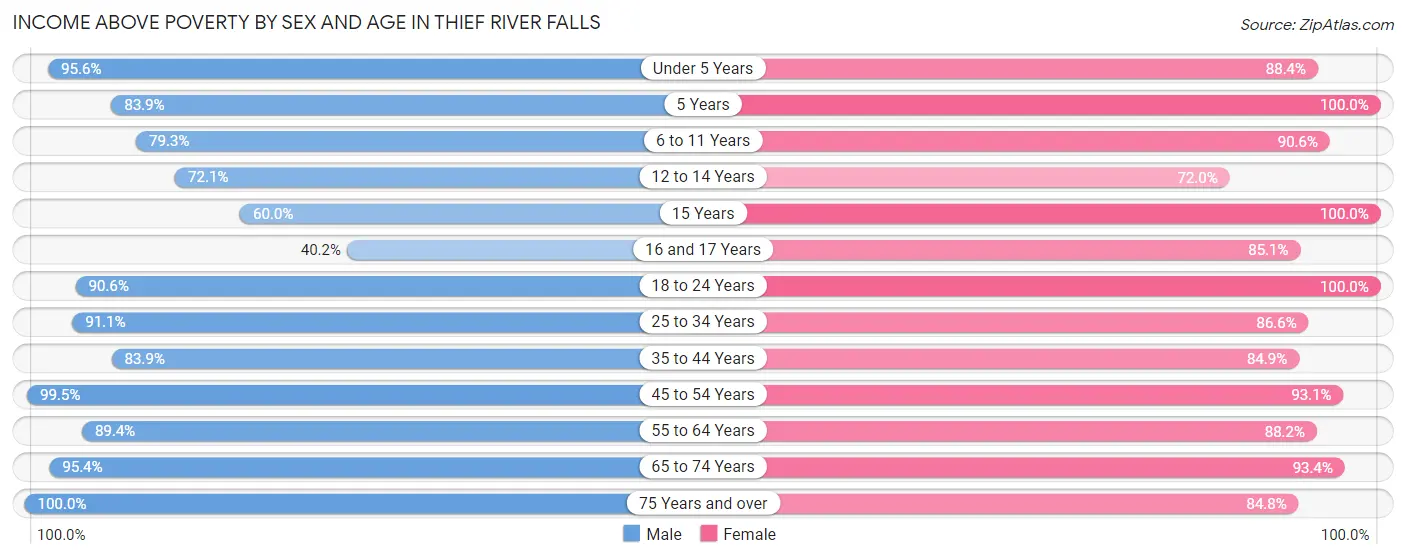
| Age Bracket | Male | Female |
| Under 5 Years | 219 (95.6%) | 281 (88.4%) |
| 5 Years | 99 (83.9%) | 47 (100.0%) |
| 6 to 11 Years | 203 (79.3%) | 240 (90.6%) |
| 12 to 14 Years | 116 (72.1%) | 113 (72.0%) |
| 15 Years | 48 (60.0%) | 60 (100.0%) |
| 16 and 17 Years | 43 (40.2%) | 80 (85.1%) |
| 18 to 24 Years | 431 (90.5%) | 307 (100.0%) |
| 25 to 34 Years | 648 (91.1%) | 570 (86.6%) |
| 35 to 44 Years | 416 (83.9%) | 499 (84.9%) |
| 45 to 54 Years | 435 (99.5%) | 392 (93.1%) |
| 55 to 64 Years | 512 (89.3%) | 469 (88.2%) |
| 65 to 74 Years | 373 (95.4%) | 435 (93.3%) |
| 75 Years and over | 238 (100.0%) | 390 (84.8%) |
| Total | 3,781 (88.5%) | 3,883 (88.8%) |
Income Below Poverty Among Married-Couple Families in Thief River Falls
The poverty statistics for married-couple families in Thief River Falls show that 2.3% or 37 of the total 1,596 families live below the poverty line. Families with 3 or 4 children have the highest poverty rate of 7.4%, comprising of 7 families. On the other hand, families with 5 or more children have the lowest poverty rate of 0.0%, which includes 0 families.
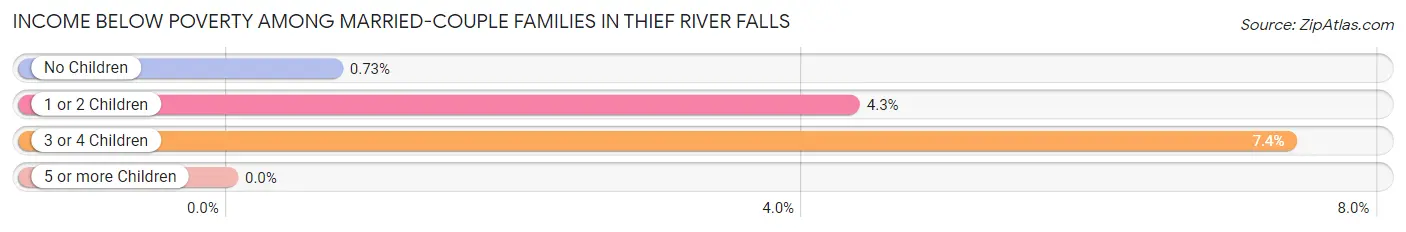
| Children | Above Poverty | Below Poverty |
| No Children | 953 (99.3%) | 7 (0.7%) |
| 1 or 2 Children | 508 (95.7%) | 23 (4.3%) |
| 3 or 4 Children | 88 (92.6%) | 7 (7.4%) |
| 5 or more Children | 10 (100.0%) | 0 (0.0%) |
| Total | 1,559 (97.7%) | 37 (2.3%) |
Income Below Poverty Among Single-Parent Households in Thief River Falls
| Children | Single Father | Single Mother |
| No Children | 0 (0.0%) | 0 (0.0%) |
| 1 or 2 Children | 0 (0.0%) | 128 (37.5%) |
| 3 or 4 Children | 0 (0.0%) | 26 (59.1%) |
| 5 or more Children | 0 (0.0%) | 0 (0.0%) |
| Total | 0 (0.0%) | 154 (32.6%) |
Income Below Poverty Among Married-Couple vs Single-Parent Households in Thief River Falls
The poverty data for Thief River Falls shows that 37 of the married-couple family households (2.3%) and 154 of the single-parent households (29.1%) are living below the poverty level. Within the married-couple family households, those with 3 or 4 children have the highest poverty rate, with 7 households (7.4%) falling below the poverty line. Among the single-parent households, those with 3 or 4 children have the highest poverty rate, with 26 household (59.1%) living below poverty.
| Children | Married-Couple Families | Single-Parent Households |
| No Children | 7 (0.7%) | 0 (0.0%) |
| 1 or 2 Children | 23 (4.3%) | 128 (33.4%) |
| 3 or 4 Children | 7 (7.4%) | 26 (59.1%) |
| 5 or more Children | 0 (0.0%) | 0 (0.0%) |
| Total | 37 (2.3%) | 154 (29.1%) |
Race in Thief River Falls
The most populous races in Thief River Falls are White / Caucasian (8,101 | 91.3%), Hispanic or Latino (566 | 6.4%), and Two or more Races (309 | 3.5%).
| Race | # Population | % Population |
| Asian | 51 | 0.6% |
| Black / African American | 164 | 1.8% |
| Hawaiian / Pacific | 0 | 0.0% |
| Hispanic or Latino | 566 | 6.4% |
| Native / Alaskan | 144 | 1.6% |
| White / Caucasian | 8,101 | 91.3% |
| Two or more Races | 309 | 3.5% |
| Some other Race | 102 | 1.1% |
| Total | 8,871 | 100.0% |
Ancestry in Thief River Falls
The most populous ancestries reported in Thief River Falls are Norwegian (3,132 | 35.3%), German (2,103 | 23.7%), Swedish (1,014 | 11.4%), Irish (767 | 8.6%), and Mexican (453 | 5.1%), together accounting for 84.2% of all Thief River Falls residents.
| Ancestry | # Population | % Population |
| African | 66 | 0.7% |
| American | 166 | 1.9% |
| British | 13 | 0.2% |
| Central American | 33 | 0.4% |
| Cherokee | 90 | 1.0% |
| Chippewa | 111 | 1.3% |
| Czech | 60 | 0.7% |
| Danish | 56 | 0.6% |
| Dutch | 110 | 1.2% |
| Eastern European | 6 | 0.1% |
| English | 324 | 3.6% |
| European | 241 | 2.7% |
| Finnish | 39 | 0.4% |
| French | 334 | 3.8% |
| French Canadian | 123 | 1.4% |
| German | 2,103 | 23.7% |
| Greek | 7 | 0.1% |
| Guatemalan | 33 | 0.4% |
| Icelander | 9 | 0.1% |
| Irish | 767 | 8.6% |
| Italian | 91 | 1.0% |
| Lithuanian | 16 | 0.2% |
| Mexican | 453 | 5.1% |
| Northern European | 7 | 0.1% |
| Norwegian | 3,132 | 35.3% |
| Pennsylvania German | 20 | 0.2% |
| Polish | 307 | 3.5% |
| Portuguese | 8 | 0.1% |
| Russian | 14 | 0.2% |
| Scandinavian | 99 | 1.1% |
| Scotch-Irish | 31 | 0.4% |
| Scottish | 30 | 0.3% |
| Slovene | 29 | 0.3% |
| Sri Lankan | 51 | 0.6% |
| Subsaharan African | 68 | 0.8% |
| Sudanese | 2 | 0.0% |
| Swedish | 1,014 | 11.4% |
| Welsh | 18 | 0.2% |
| Yugoslavian | 37 | 0.4% | View All 39 Rows |
Immigrants in Thief River Falls
The most numerous immigrant groups reported in Thief River Falls came from Central America (107 | 1.2%), Latin America (107 | 1.2%), Mexico (74 | 0.8%), Europe (50 | 0.6%), and Bosnia and Herzegovina (37 | 0.4%), together accounting for 4.2% of all Thief River Falls residents.
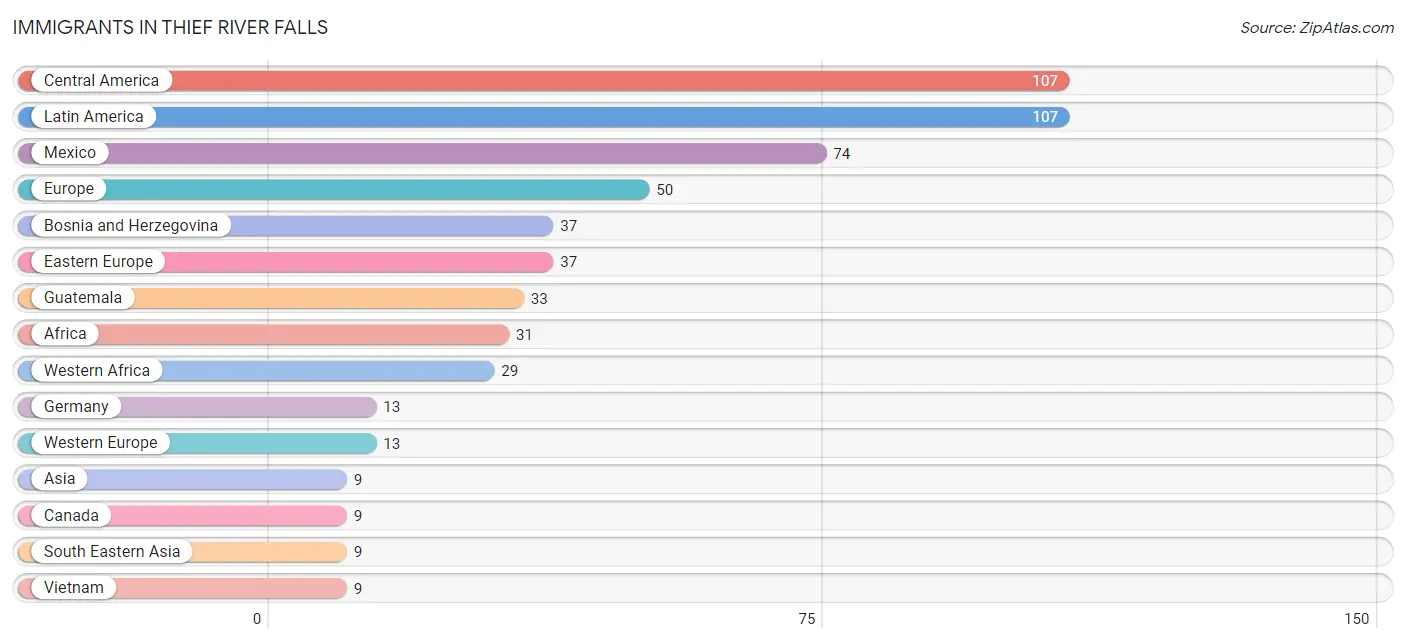
| Immigration Origin | # Population | % Population |
| Africa | 31 | 0.4% |
| Asia | 9 | 0.1% |
| Bosnia and Herzegovina | 37 | 0.4% |
| Canada | 9 | 0.1% |
| Central America | 107 | 1.2% |
| Eastern Europe | 37 | 0.4% |
| Europe | 50 | 0.6% |
| Germany | 13 | 0.2% |
| Guatemala | 33 | 0.4% |
| Latin America | 107 | 1.2% |
| Mexico | 74 | 0.8% |
| Northern Africa | 2 | 0.0% |
| South Eastern Asia | 9 | 0.1% |
| Sudan | 2 | 0.0% |
| Vietnam | 9 | 0.1% |
| Western Africa | 29 | 0.3% |
| Western Europe | 13 | 0.2% | View All 17 Rows |
Sex and Age in Thief River Falls
Sex and Age in Thief River Falls
The most populous age groups in Thief River Falls are 35 to 39 Years (393 | 9.0%) for men and 25 to 29 Years (349 | 7.7%) for women.
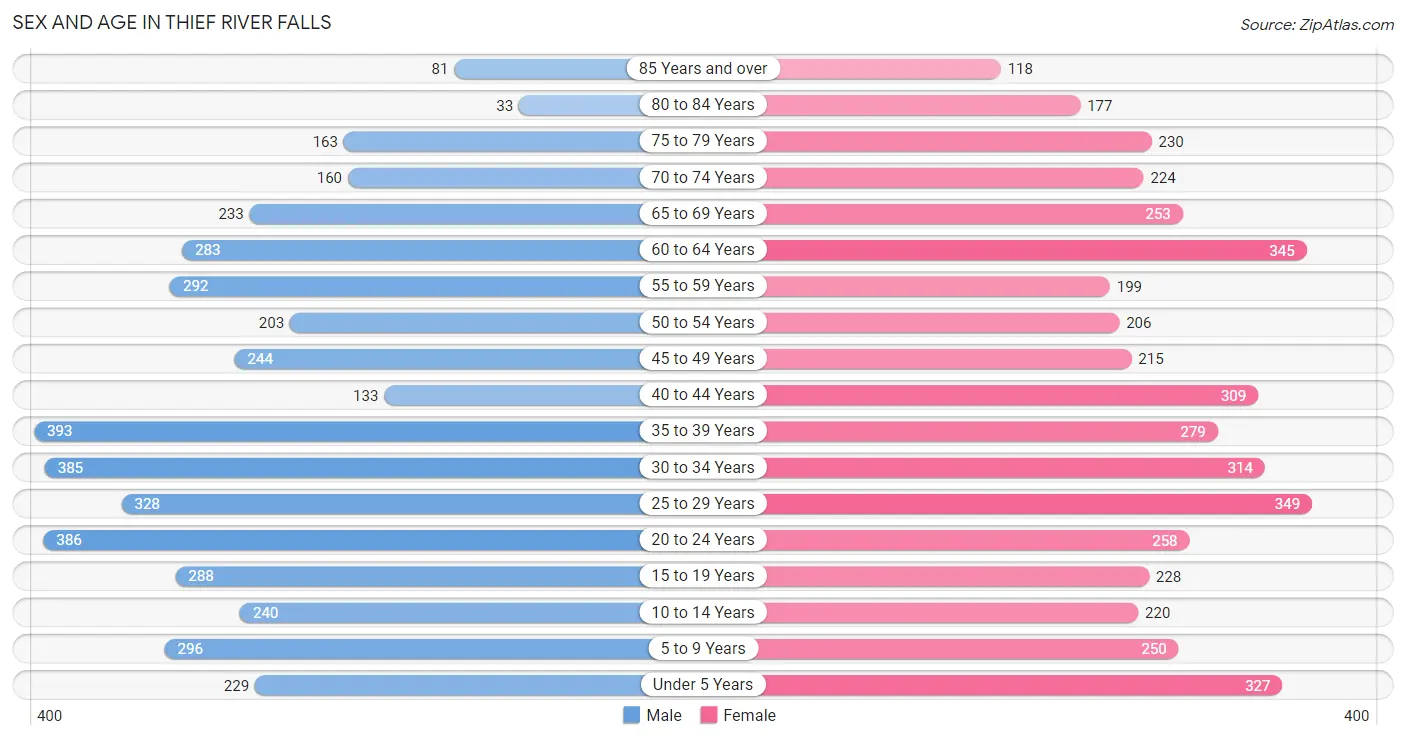
| Age Bracket | Male | Female |
| Under 5 Years | 229 (5.2%) | 327 (7.3%) |
| 5 to 9 Years | 296 (6.8%) | 250 (5.6%) |
| 10 to 14 Years | 240 (5.5%) | 220 (4.9%) |
| 15 to 19 Years | 288 (6.6%) | 228 (5.1%) |
| 20 to 24 Years | 386 (8.8%) | 258 (5.7%) |
| 25 to 29 Years | 328 (7.5%) | 349 (7.7%) |
| 30 to 34 Years | 385 (8.8%) | 314 (7.0%) |
| 35 to 39 Years | 393 (9.0%) | 279 (6.2%) |
| 40 to 44 Years | 133 (3.0%) | 309 (6.9%) |
| 45 to 49 Years | 244 (5.6%) | 215 (4.8%) |
| 50 to 54 Years | 203 (4.6%) | 206 (4.6%) |
| 55 to 59 Years | 292 (6.7%) | 199 (4.4%) |
| 60 to 64 Years | 283 (6.5%) | 345 (7.7%) |
| 65 to 69 Years | 233 (5.3%) | 253 (5.6%) |
| 70 to 74 Years | 160 (3.7%) | 224 (5.0%) |
| 75 to 79 Years | 163 (3.7%) | 230 (5.1%) |
| 80 to 84 Years | 33 (0.8%) | 177 (3.9%) |
| 85 Years and over | 81 (1.8%) | 118 (2.6%) |
| Total | 4,370 (100.0%) | 4,501 (100.0%) |
Families and Households in Thief River Falls
Median Family Size in Thief River Falls
The median family size in Thief River Falls is 2.79 persons per family, with married-couple families (1,596 | 75.1%) accounting for the largest median family size of 2.89 persons per family. On the other hand, single male/father families (56 | 2.6%) represent the smallest median family size with 2.25 persons per family.
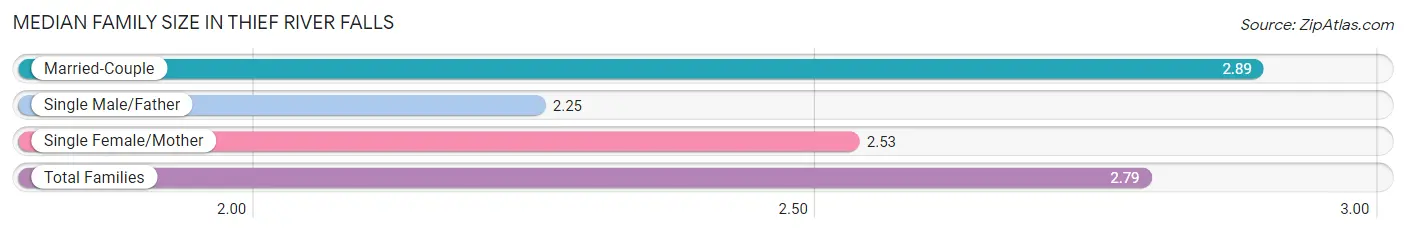
| Family Type | # Families | Family Size |
| Married-Couple | 1,596 (75.1%) | 2.89 |
| Single Male/Father | 56 (2.6%) | 2.25 |
| Single Female/Mother | 473 (22.3%) | 2.53 |
| Total Families | 2,125 (100.0%) | 2.79 |
Median Household Size in Thief River Falls
The median household size in Thief River Falls is 2.09 persons per household, with single male/father households (56 | 1.4%) accounting for the largest median household size of 3.02 persons per household. non-family households (2,001 | 48.5%) represent the smallest median household size with 1.25 persons per household.
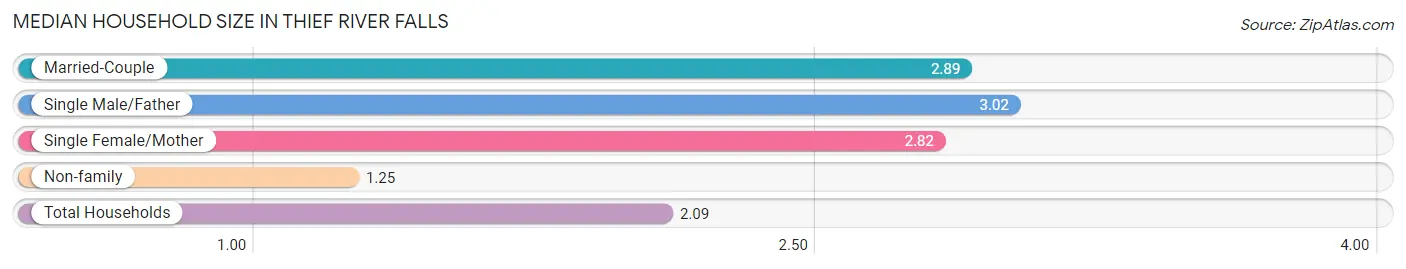
| Household Type | # Households | Household Size |
| Married-Couple | 1,596 (38.7%) | 2.89 |
| Single Male/Father | 56 (1.4%) | 3.02 |
| Single Female/Mother | 473 (11.5%) | 2.82 |
| Non-family | 2,001 (48.5%) | 1.25 |
| Total Households | 4,126 (100.0%) | 2.09 |
Household Size by Marriage Status in Thief River Falls
Out of a total of 4,126 households in Thief River Falls, 2,125 (51.5%) are family households, while 2,001 (48.5%) are nonfamily households. The most numerous type of family households are 2-person households, comprising 1,041, and the most common type of nonfamily households are 1-person households, comprising 1,668.
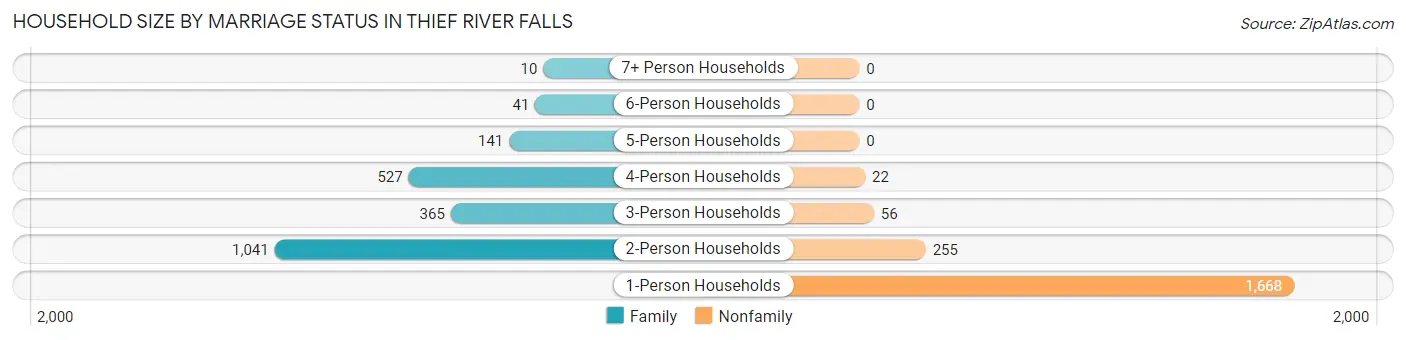
| Household Size | Family Households | Nonfamily Households |
| 1-Person Households | - | 1,668 (40.4%) |
| 2-Person Households | 1,041 (25.2%) | 255 (6.2%) |
| 3-Person Households | 365 (8.8%) | 56 (1.4%) |
| 4-Person Households | 527 (12.8%) | 22 (0.5%) |
| 5-Person Households | 141 (3.4%) | 0 (0.0%) |
| 6-Person Households | 41 (1.0%) | 0 (0.0%) |
| 7+ Person Households | 10 (0.2%) | 0 (0.0%) |
| Total | 2,125 (51.5%) | 2,001 (48.5%) |
Female Fertility in Thief River Falls
Fertility by Age in Thief River Falls
Average fertility rate in Thief River Falls is 71.0 births per 1,000 women. Women in the age bracket of 20 to 34 years have the highest fertility rate with 113.0 births per 1,000 women. Women in the age bracket of 20 to 34 years acount for 73.8% of all women with births.
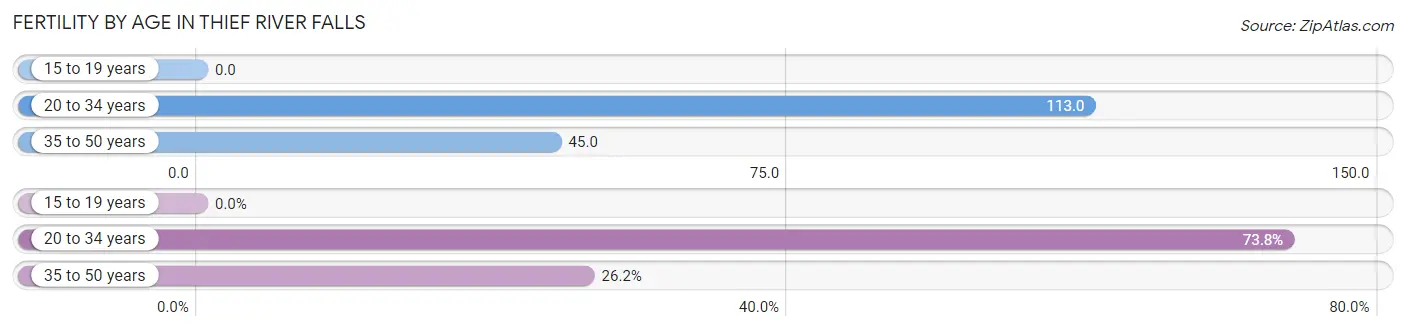
| Age Bracket | Women with Births | Births / 1,000 Women |
| 15 to 19 years | 0 (0.0%) | 0.0 |
| 20 to 34 years | 104 (73.8%) | 113.0 |
| 35 to 50 years | 37 (26.2%) | 45.0 |
| Total | 141 (100.0%) | 71.0 |
Fertility by Age by Marriage Status in Thief River Falls
70.9% of women with births (141) in Thief River Falls are married. The highest percentage of unmarried women with births falls into 35 to 50 years age bracket with 62.2% of them unmarried at the time of birth, while the lowest percentage of unmarried women with births belong to 20 to 34 years age bracket with 17.3% of them unmarried.
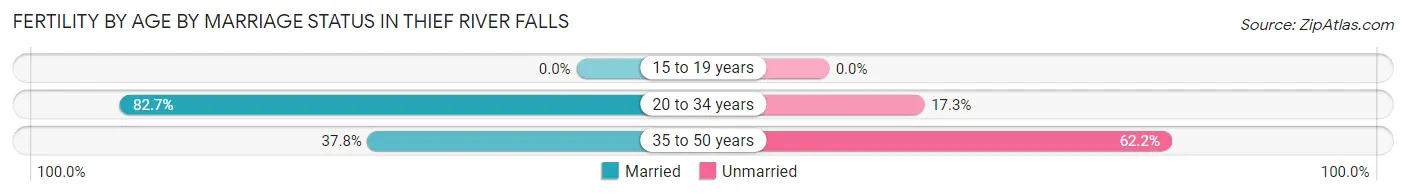
| Age Bracket | Married | Unmarried |
| 15 to 19 years | 0 (0.0%) | 0 (0.0%) |
| 20 to 34 years | 86 (82.7%) | 18 (17.3%) |
| 35 to 50 years | 14 (37.8%) | 23 (62.2%) |
| Total | 100 (70.9%) | 41 (29.1%) |
Fertility by Education in Thief River Falls
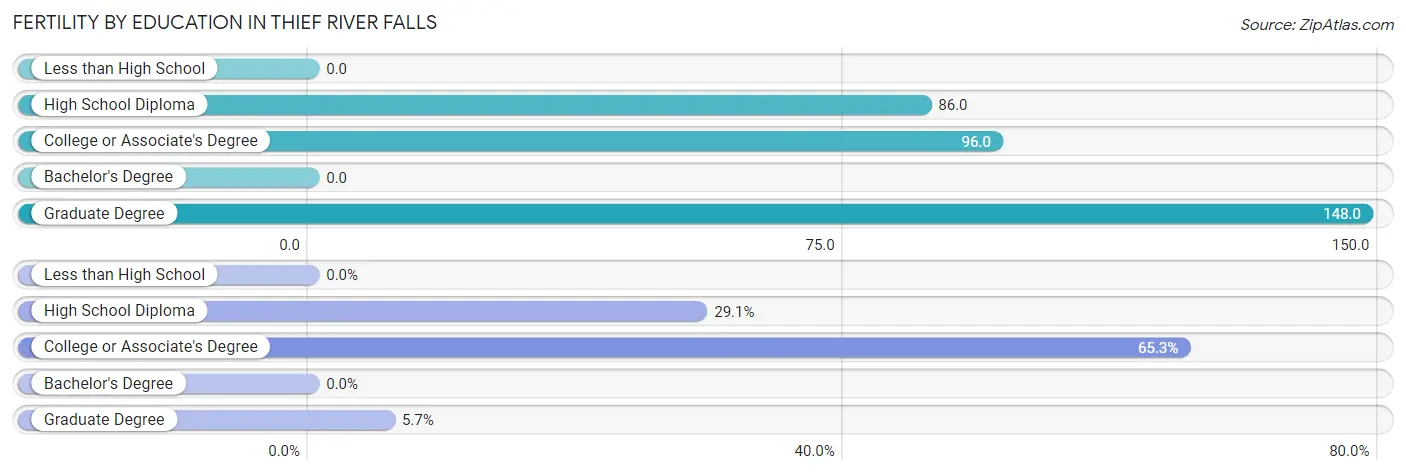
| Educational Attainment | Women with Births | Births / 1,000 Women |
| Less than High School | 0 (0.0%) | 0.0 |
| High School Diploma | 41 (29.1%) | 86.0 |
| College or Associate's Degree | 92 (65.2%) | 96.0 |
| Bachelor's Degree | 0 (0.0%) | 0.0 |
| Graduate Degree | 8 (5.7%) | 148.0 |
| Total | 141 (100.0%) | 71.0 |
Fertility by Education by Marriage Status in Thief River Falls
29.1% of women with births in Thief River Falls are unmarried. Women with the educational attainment of graduate degree are most likely to be married with 100.0% of them married at childbirth, while women with the educational attainment of high school diploma are least likely to be married with 43.9% of them unmarried at childbirth.
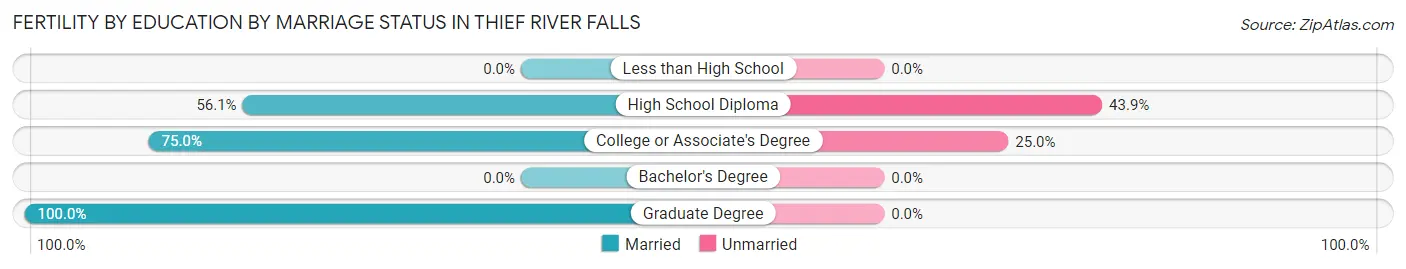
| Educational Attainment | Married | Unmarried |
| Less than High School | 0 (0.0%) | 0 (0.0%) |
| High School Diploma | 23 (56.1%) | 18 (43.9%) |
| College or Associate's Degree | 69 (75.0%) | 23 (25.0%) |
| Bachelor's Degree | 0 (0.0%) | 0 (0.0%) |
| Graduate Degree | 8 (100.0%) | 0 (0.0%) |
| Total | 100 (70.9%) | 41 (29.1%) |
Employment Characteristics in Thief River Falls
Employment by Class of Employer in Thief River Falls
Among the 4,622 employed individuals in Thief River Falls, private company employees (3,817 | 82.6%), not-for-profit organizations (220 | 4.8%), and local government employees (167 | 3.6%) make up the most common classes of employment.
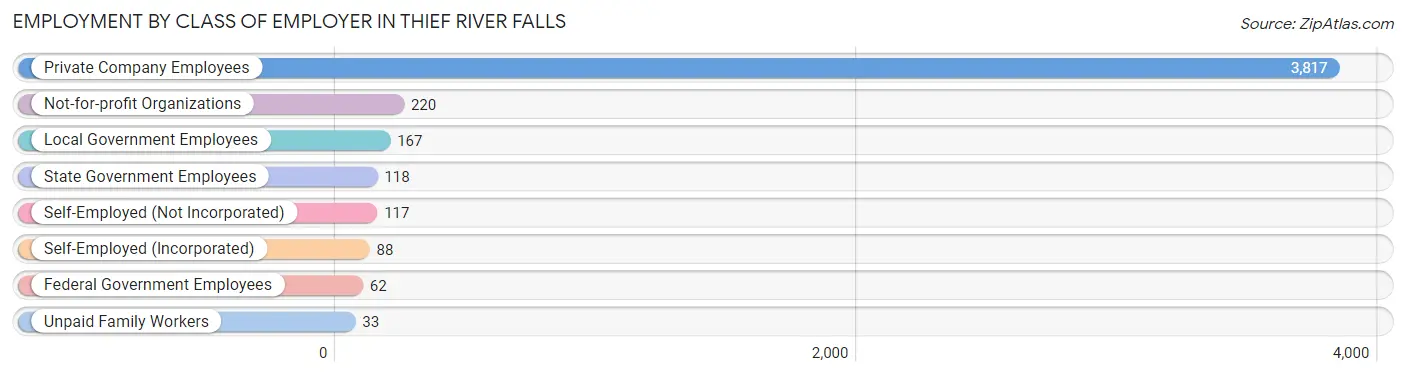
| Employer Class | # Employees | % Employees |
| Private Company Employees | 3,817 | 82.6% |
| Self-Employed (Incorporated) | 88 | 1.9% |
| Self-Employed (Not Incorporated) | 117 | 2.5% |
| Not-for-profit Organizations | 220 | 4.8% |
| Local Government Employees | 167 | 3.6% |
| State Government Employees | 118 | 2.5% |
| Federal Government Employees | 62 | 1.3% |
| Unpaid Family Workers | 33 | 0.7% |
| Total | 4,622 | 100.0% |
Employment Status by Age in Thief River Falls
According to the labor force statistics for Thief River Falls, out of the total population over 16 years of age (7,164), 67.2% or 4,814 individuals are in the labor force, with 1.3% or 63 of them unemployed. The age group with the highest labor force participation rate is 20 to 24 years, with 95.8% or 617 individuals in the labor force. Within the labor force, the 65 to 74 years age range has the highest percentage of unemployed individuals, with 5.5% or 13 of them being unemployed.
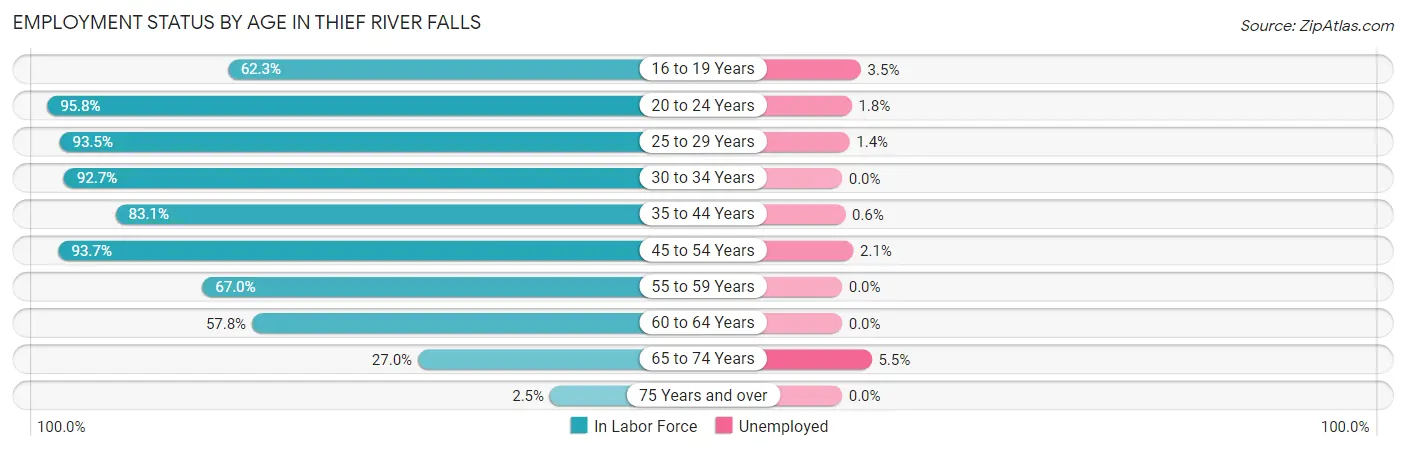
| Age Bracket | In Labor Force | Unemployed |
| 16 to 19 Years | 231 (62.3%) | 8 (3.5%) |
| 20 to 24 Years | 617 (95.8%) | 11 (1.8%) |
| 25 to 29 Years | 633 (93.5%) | 9 (1.4%) |
| 30 to 34 Years | 648 (92.7%) | 0 (0.0%) |
| 35 to 44 Years | 926 (83.1%) | 6 (0.6%) |
| 45 to 54 Years | 813 (93.7%) | 17 (2.1%) |
| 55 to 59 Years | 329 (67.0%) | 0 (0.0%) |
| 60 to 64 Years | 363 (57.8%) | 0 (0.0%) |
| 65 to 74 Years | 235 (27.0%) | 13 (5.5%) |
| 75 Years and over | 20 (2.5%) | 0 (0.0%) |
| Total | 4,814 (67.2%) | 63 (1.3%) |
Employment Status by Educational Attainment in Thief River Falls
According to labor force statistics for Thief River Falls, 82.9% of individuals (3,711) out of the total population between 25 and 64 years of age (4,477) are in the labor force, with 0.9% or 33 of them being unemployed. The group with the highest labor force participation rate are those with the educational attainment of bachelor's degree or higher, with 85.2% or 681 individuals in the labor force. Within the labor force, individuals with college / associate degree education have the highest percentage of unemployment, with 1.4% or 26 of them being unemployed.
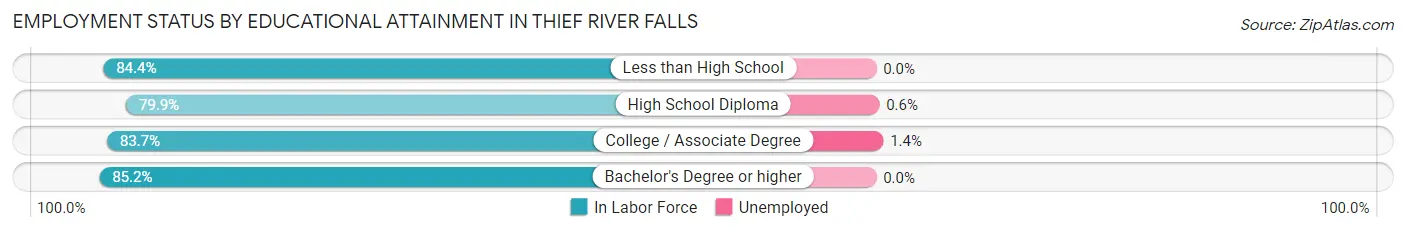
| Educational Attainment | In Labor Force | Unemployed |
| Less than High School | 135 (84.4%) | 0 (0.0%) |
| High School Diploma | 1,032 (79.9%) | 8 (0.6%) |
| College / Associate Degree | 1,864 (83.7%) | 31 (1.4%) |
| Bachelor's Degree or higher | 681 (85.2%) | 0 (0.0%) |
| Total | 3,711 (82.9%) | 40 (0.9%) |
Employment Occupations by Sex in Thief River Falls
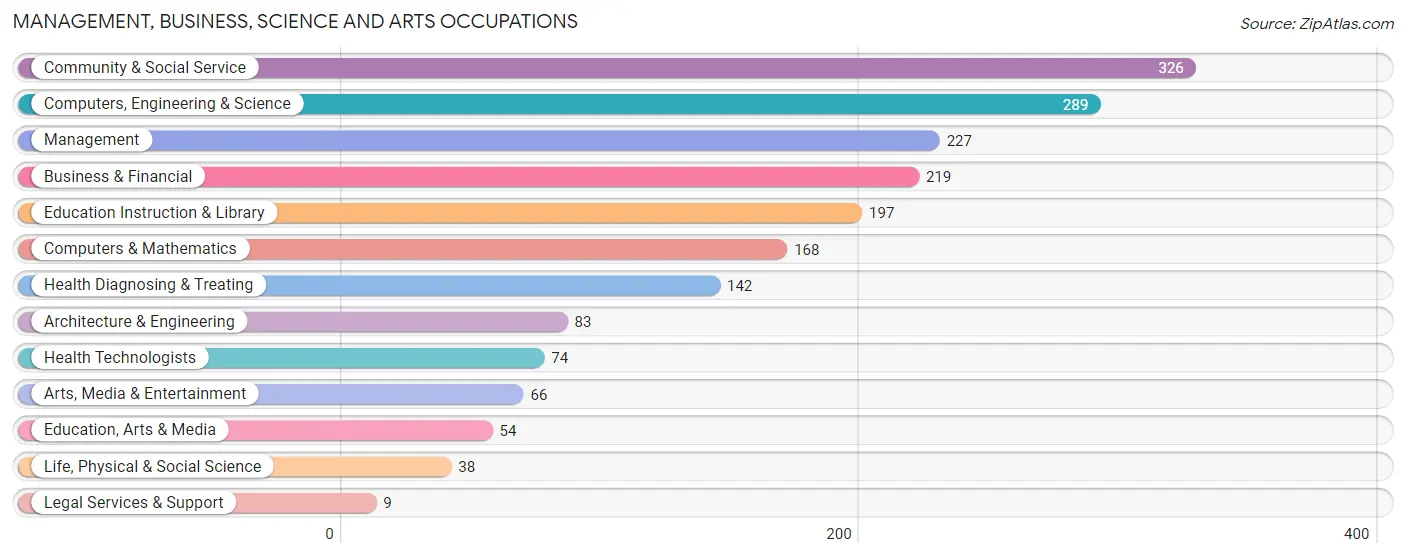
Management, Business, Science and Arts Occupations
The most common Management, Business, Science and Arts occupations in Thief River Falls are Community & Social Service (326 | 6.9%), Computers, Engineering & Science (289 | 6.1%), Management (227 | 4.8%), Business & Financial (219 | 4.6%), and Education Instruction & Library (197 | 4.2%).
Management, Business, Science and Arts Occupations by Sex
Within the Management, Business, Science and Arts occupations in Thief River Falls, the most male-oriented occupations are Architecture & Engineering (100.0%), Life, Physical & Social Science (100.0%), and Computers, Engineering & Science (82.7%), while the most female-oriented occupations are Legal Services & Support (100.0%), Health Diagnosing & Treating (95.8%), and Health Technologists (91.9%).
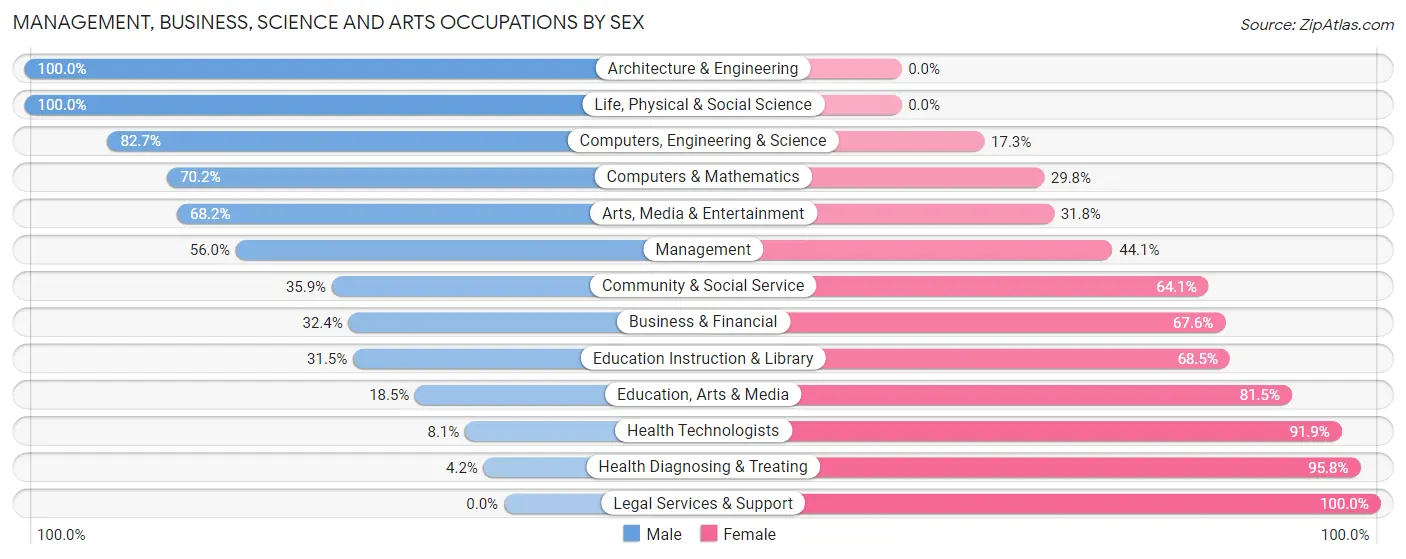
| Occupation | Male | Female |
| Management | 127 (55.9%) | 100 (44.1%) |
| Business & Financial | 71 (32.4%) | 148 (67.6%) |
| Computers, Engineering & Science | 239 (82.7%) | 50 (17.3%) |
| Computers & Mathematics | 118 (70.2%) | 50 (29.8%) |
| Architecture & Engineering | 83 (100.0%) | 0 (0.0%) |
| Life, Physical & Social Science | 38 (100.0%) | 0 (0.0%) |
| Community & Social Service | 117 (35.9%) | 209 (64.1%) |
| Education, Arts & Media | 10 (18.5%) | 44 (81.5%) |
| Legal Services & Support | 0 (0.0%) | 9 (100.0%) |
| Education Instruction & Library | 62 (31.5%) | 135 (68.5%) |
| Arts, Media & Entertainment | 45 (68.2%) | 21 (31.8%) |
| Health Diagnosing & Treating | 6 (4.2%) | 136 (95.8%) |
| Health Technologists | 6 (8.1%) | 68 (91.9%) |
| Total (Category) | 560 (46.6%) | 643 (53.4%) |
| Total (Overall) | 2,490 (52.4%) | 2,261 (47.6%) |
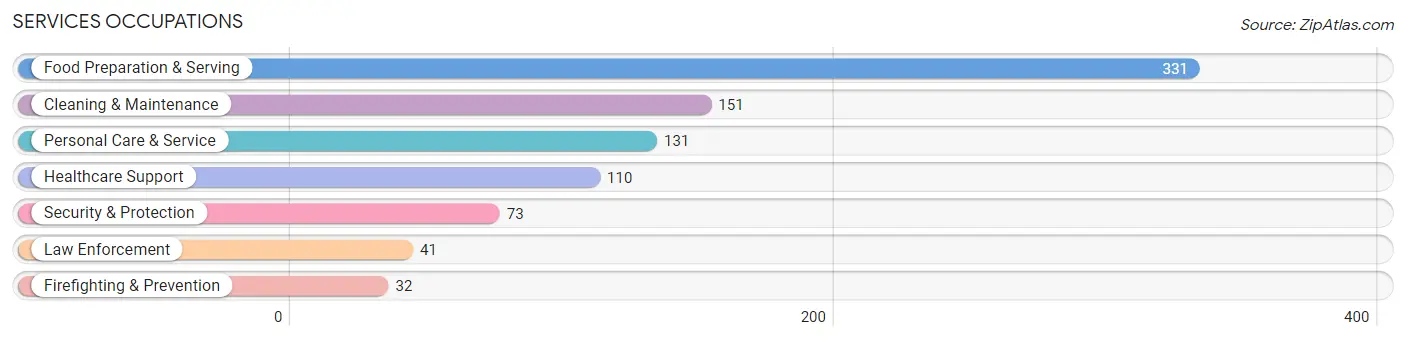
Services Occupations
The most common Services occupations in Thief River Falls are Food Preparation & Serving (331 | 7.0%), Cleaning & Maintenance (151 | 3.2%), Personal Care & Service (131 | 2.8%), Healthcare Support (110 | 2.3%), and Security & Protection (73 | 1.5%).
Services Occupations by Sex
Within the Services occupations in Thief River Falls, the most male-oriented occupations are Law Enforcement (100.0%), Security & Protection (89.0%), and Firefighting & Prevention (75.0%), while the most female-oriented occupations are Personal Care & Service (100.0%), Healthcare Support (93.6%), and Cleaning & Maintenance (70.2%).
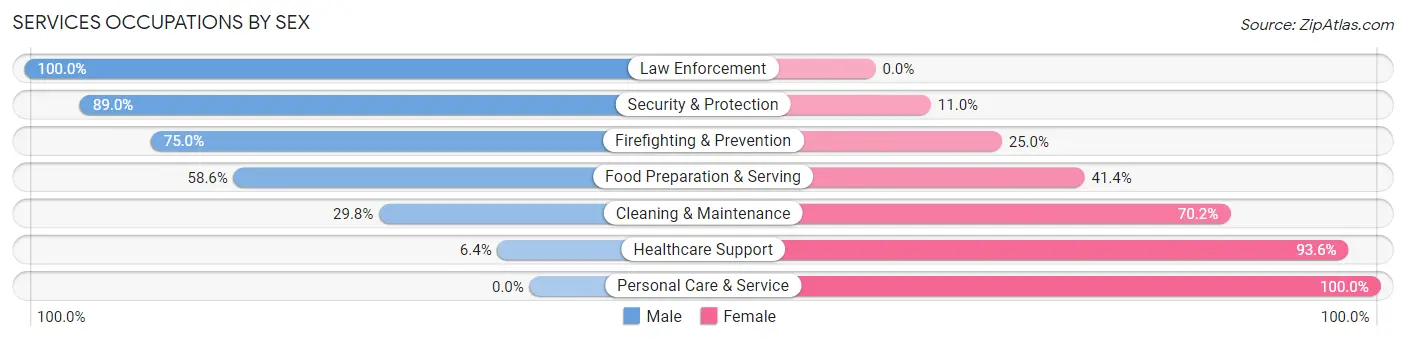
| Occupation | Male | Female |
| Healthcare Support | 7 (6.4%) | 103 (93.6%) |
| Security & Protection | 65 (89.0%) | 8 (11.0%) |
| Firefighting & Prevention | 24 (75.0%) | 8 (25.0%) |
| Law Enforcement | 41 (100.0%) | 0 (0.0%) |
| Food Preparation & Serving | 194 (58.6%) | 137 (41.4%) |
| Cleaning & Maintenance | 45 (29.8%) | 106 (70.2%) |
| Personal Care & Service | 0 (0.0%) | 131 (100.0%) |
| Total (Category) | 311 (39.1%) | 485 (60.9%) |
| Total (Overall) | 2,490 (52.4%) | 2,261 (47.6%) |
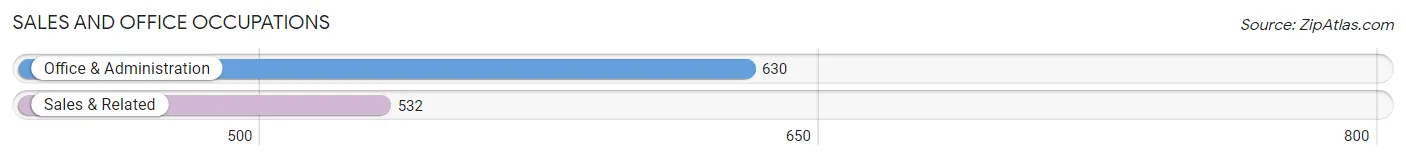
Sales and Office Occupations
The most common Sales and Office occupations in Thief River Falls are Office & Administration (630 | 13.3%), and Sales & Related (532 | 11.2%).
Sales and Office Occupations by Sex
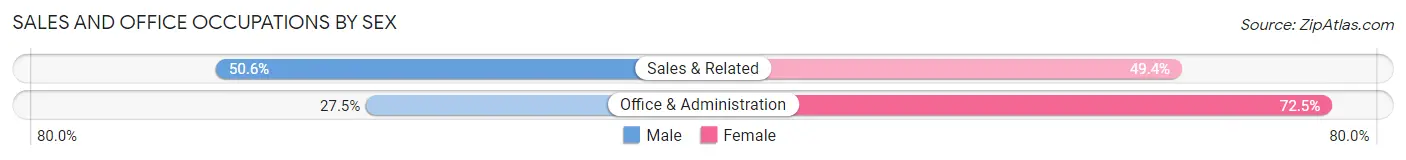
| Occupation | Male | Female |
| Sales & Related | 269 (50.6%) | 263 (49.4%) |
| Office & Administration | 173 (27.5%) | 457 (72.5%) |
| Total (Category) | 442 (38.0%) | 720 (62.0%) |
| Total (Overall) | 2,490 (52.4%) | 2,261 (47.6%) |
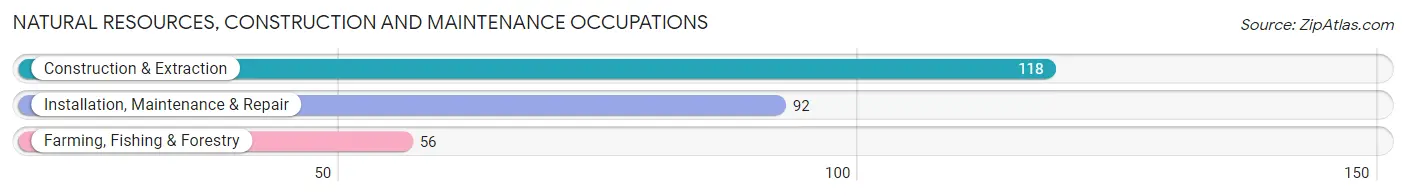
Natural Resources, Construction and Maintenance Occupations
The most common Natural Resources, Construction and Maintenance occupations in Thief River Falls are Construction & Extraction (118 | 2.5%), Installation, Maintenance & Repair (92 | 1.9%), and Farming, Fishing & Forestry (56 | 1.2%).
Natural Resources, Construction and Maintenance Occupations by Sex
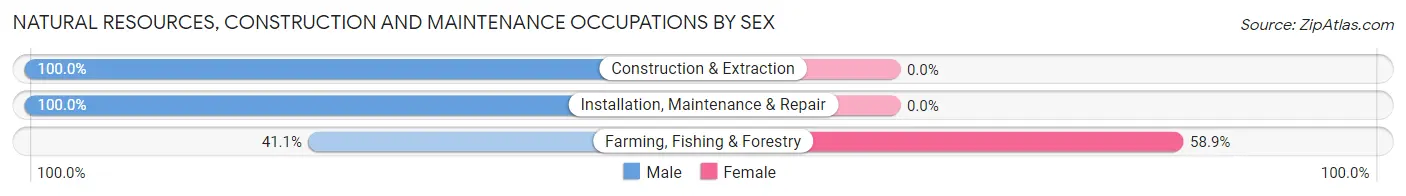
| Occupation | Male | Female |
| Farming, Fishing & Forestry | 23 (41.1%) | 33 (58.9%) |
| Construction & Extraction | 118 (100.0%) | 0 (0.0%) |
| Installation, Maintenance & Repair | 92 (100.0%) | 0 (0.0%) |
| Total (Category) | 233 (87.6%) | 33 (12.4%) |
| Total (Overall) | 2,490 (52.4%) | 2,261 (47.6%) |
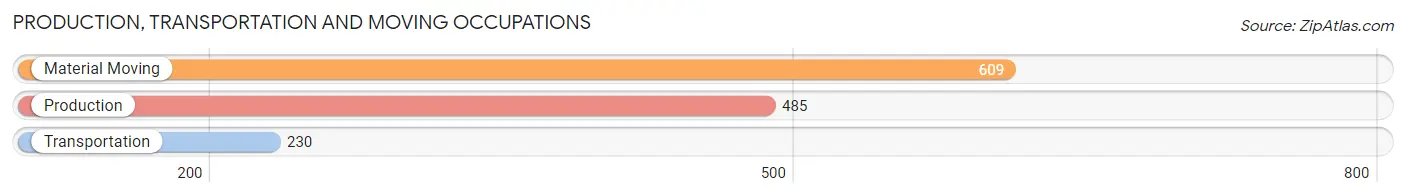
Production, Transportation and Moving Occupations
The most common Production, Transportation and Moving occupations in Thief River Falls are Material Moving (609 | 12.8%), Production (485 | 10.2%), and Transportation (230 | 4.8%).
Production, Transportation and Moving Occupations by Sex
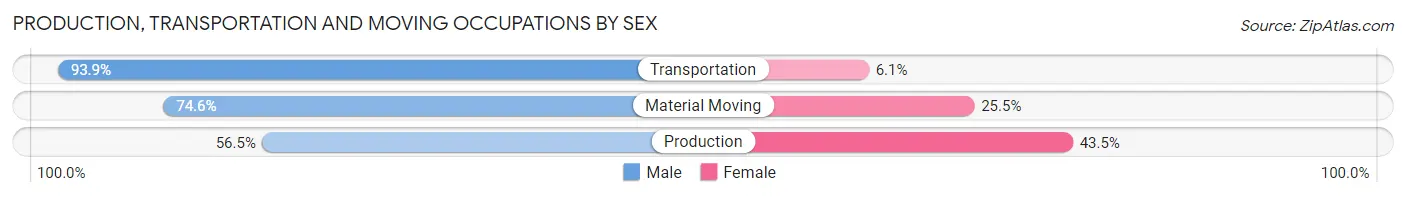
| Occupation | Male | Female |
| Production | 274 (56.5%) | 211 (43.5%) |
| Transportation | 216 (93.9%) | 14 (6.1%) |
| Material Moving | 454 (74.6%) | 155 (25.5%) |
| Total (Category) | 944 (71.3%) | 380 (28.7%) |
| Total (Overall) | 2,490 (52.4%) | 2,261 (47.6%) |
Employment Industries by Sex in Thief River Falls
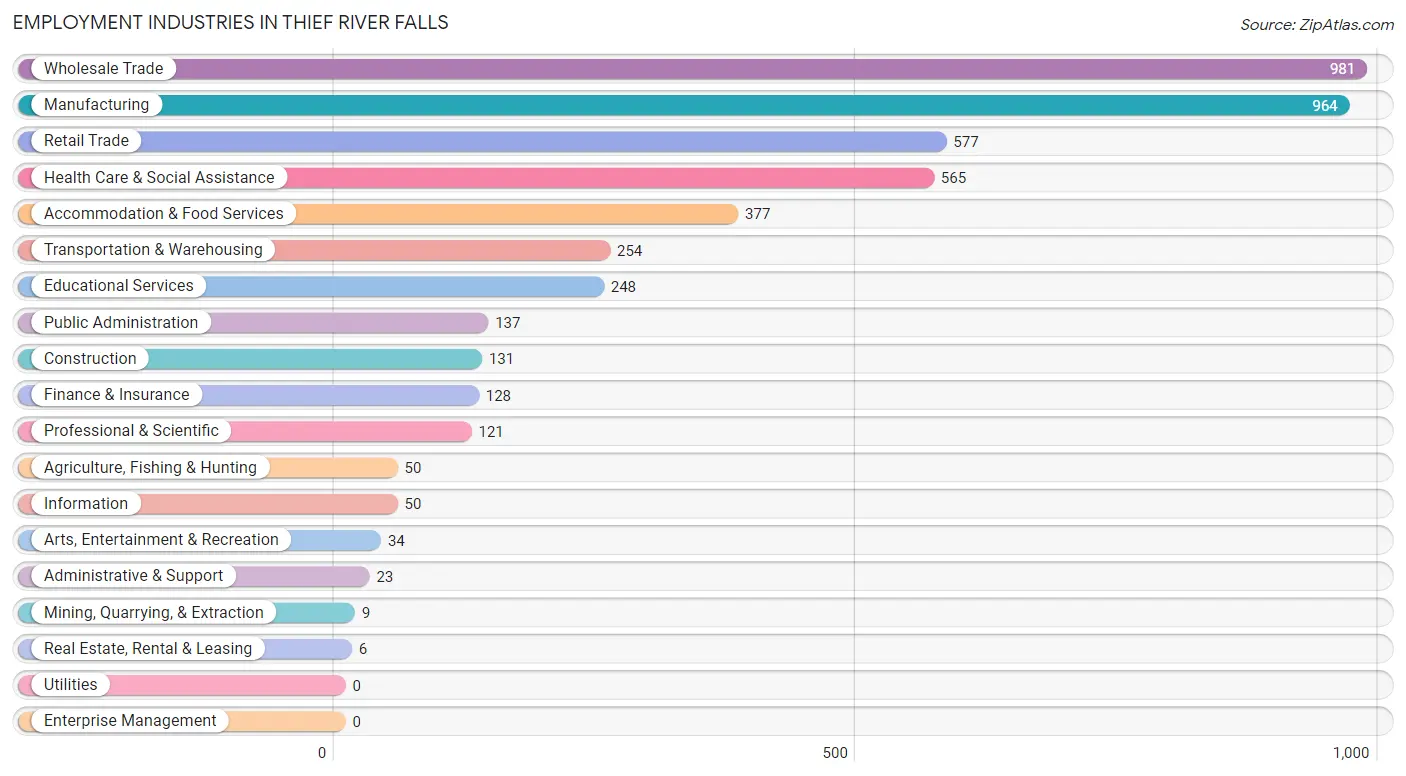
Employment Industries in Thief River Falls
The major employment industries in Thief River Falls include Wholesale Trade (981 | 20.6%), Manufacturing (964 | 20.3%), Retail Trade (577 | 12.1%), Health Care & Social Assistance (565 | 11.9%), and Accommodation & Food Services (377 | 7.9%).
Employment Industries by Sex in Thief River Falls
The Thief River Falls industries that see more men than women are Mining, Quarrying, & Extraction (100.0%), Construction (100.0%), and Real Estate, Rental & Leasing (100.0%), whereas the industries that tend to have a higher number of women are Arts, Entertainment & Recreation (100.0%), Health Care & Social Assistance (95.0%), and Finance & Insurance (82.8%).
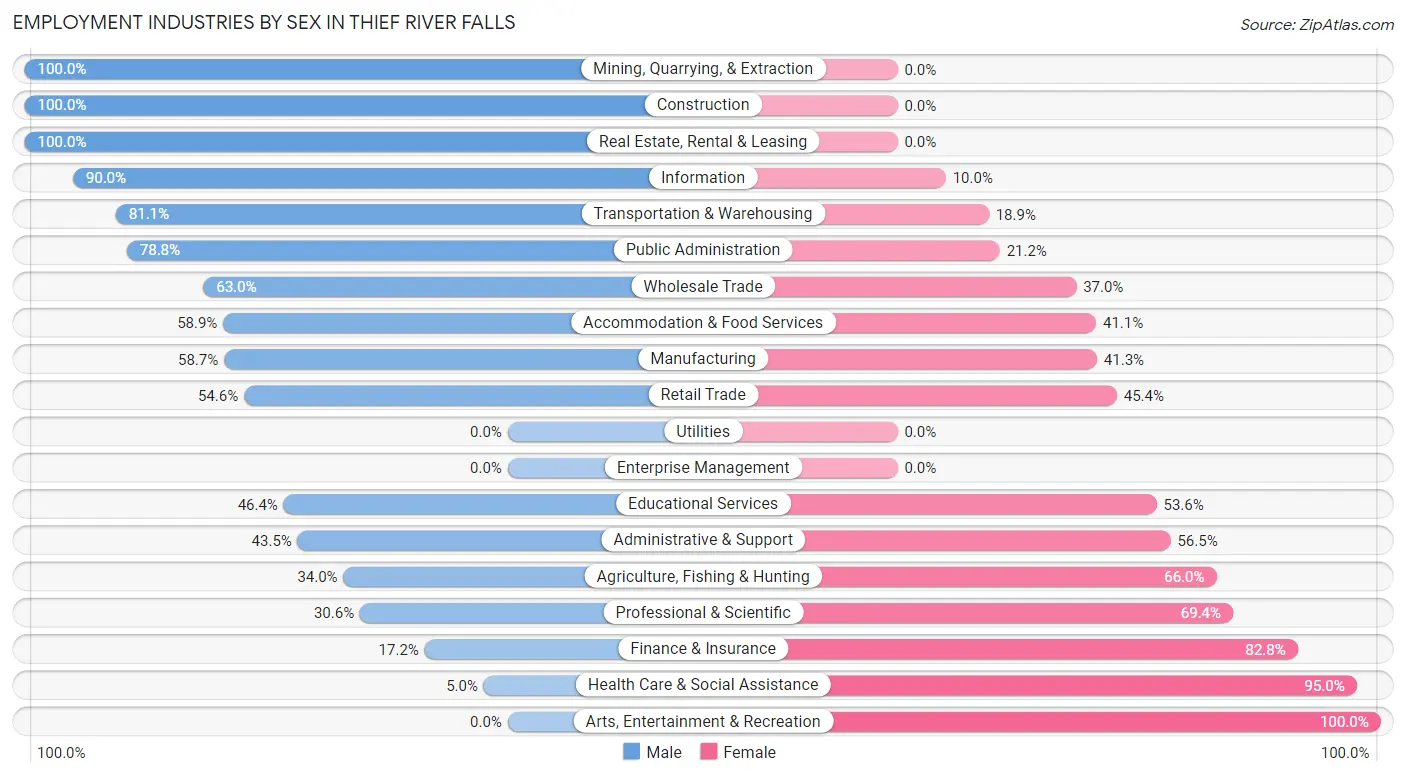
| Industry | Male | Female |
| Agriculture, Fishing & Hunting | 17 (34.0%) | 33 (66.0%) |
| Mining, Quarrying, & Extraction | 9 (100.0%) | 0 (0.0%) |
| Construction | 131 (100.0%) | 0 (0.0%) |
| Manufacturing | 566 (58.7%) | 398 (41.3%) |
| Wholesale Trade | 618 (63.0%) | 363 (37.0%) |
| Retail Trade | 315 (54.6%) | 262 (45.4%) |
| Transportation & Warehousing | 206 (81.1%) | 48 (18.9%) |
| Utilities | 0 (0.0%) | 0 (0.0%) |
| Information | 45 (90.0%) | 5 (10.0%) |
| Finance & Insurance | 22 (17.2%) | 106 (82.8%) |
| Real Estate, Rental & Leasing | 6 (100.0%) | 0 (0.0%) |
| Professional & Scientific | 37 (30.6%) | 84 (69.4%) |
| Enterprise Management | 0 (0.0%) | 0 (0.0%) |
| Administrative & Support | 10 (43.5%) | 13 (56.5%) |
| Educational Services | 115 (46.4%) | 133 (53.6%) |
| Health Care & Social Assistance | 28 (5.0%) | 537 (95.0%) |
| Arts, Entertainment & Recreation | 0 (0.0%) | 34 (100.0%) |
| Accommodation & Food Services | 222 (58.9%) | 155 (41.1%) |
| Public Administration | 108 (78.8%) | 29 (21.2%) |
| Total | 2,490 (52.4%) | 2,261 (47.6%) |
Education in Thief River Falls
School Enrollment in Thief River Falls
The most common levels of schooling among the 1,814 students in Thief River Falls are high school (422 | 23.3%), middle school (409 | 22.6%), and college / undergraduate (363 | 20.0%).
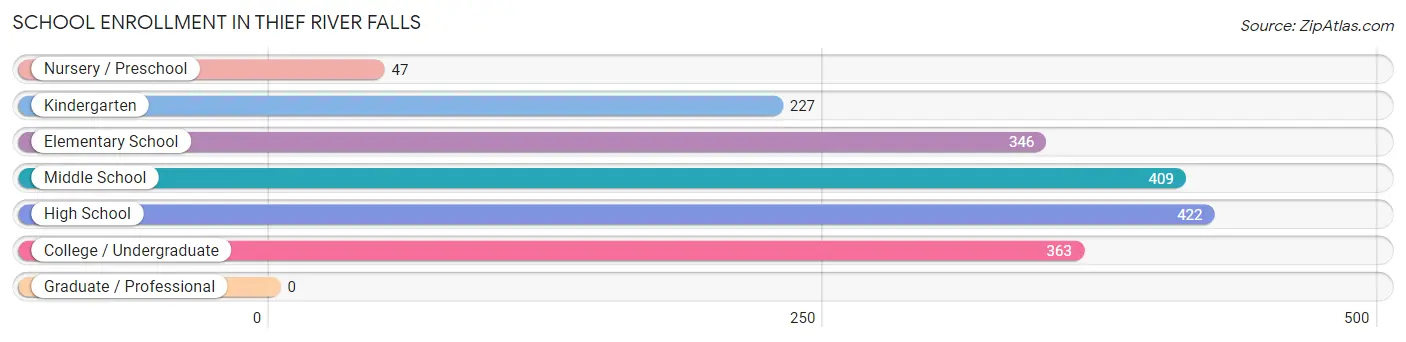
| School Level | # Students | % Students |
| Nursery / Preschool | 47 | 2.6% |
| Kindergarten | 227 | 12.5% |
| Elementary School | 346 | 19.1% |
| Middle School | 409 | 22.6% |
| High School | 422 | 23.3% |
| College / Undergraduate | 363 | 20.0% |
| Graduate / Professional | 0 | 0.0% |
| Total | 1,814 | 100.0% |
School Enrollment by Age by Funding Source in Thief River Falls
Out of a total of 1,814 students who are enrolled in schools in Thief River Falls, 174 (9.6%) attend a private institution, while the remaining 1,640 (90.4%) are enrolled in public schools. The age group of 35 years and over has the highest likelihood of being enrolled in private schools, with 43 (41.7% in the age bracket) enrolled. Conversely, the age group of 15 to 17 year olds has the lowest likelihood of being enrolled in a private school, with 337 (97.1% in the age bracket) attending a public institution.
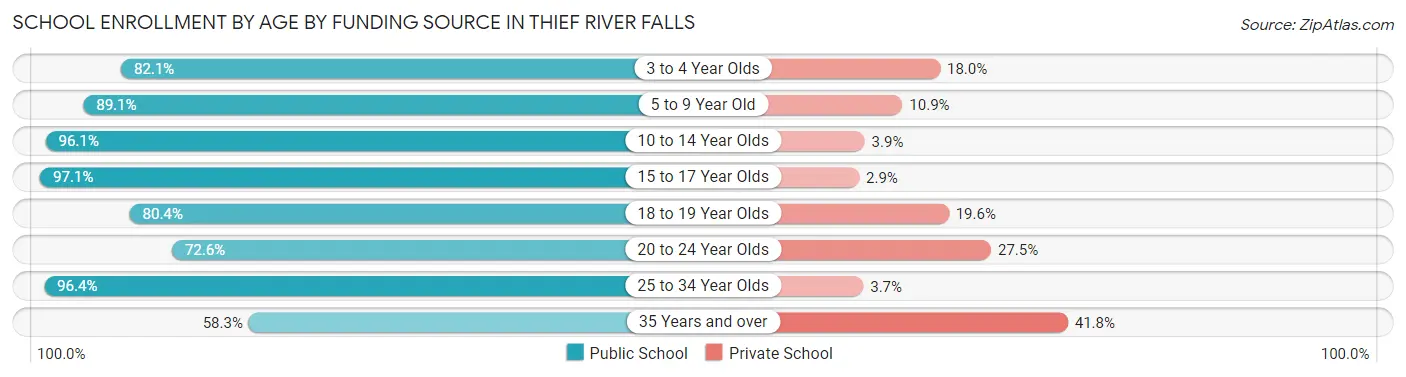
| Age Bracket | Public School | Private School |
| 3 to 4 Year Olds | 32 (82.1%) | 7 (17.9%) |
| 5 to 9 Year Old | 472 (89.1%) | 58 (10.9%) |
| 10 to 14 Year Olds | 442 (96.1%) | 18 (3.9%) |
| 15 to 17 Year Olds | 337 (97.1%) | 10 (2.9%) |
| 18 to 19 Year Olds | 74 (80.4%) | 18 (19.6%) |
| 20 to 24 Year Olds | 37 (72.6%) | 14 (27.5%) |
| 25 to 34 Year Olds | 185 (96.4%) | 7 (3.6%) |
| 35 Years and over | 60 (58.3%) | 43 (41.7%) |
| Total | 1,640 (90.4%) | 174 (9.6%) |
Educational Attainment by Field of Study in Thief River Falls
Education (366 | 27.3%), business (197 | 14.7%), bio, nature & agricultural (183 | 13.7%), science & technology (144 | 10.7%), and arts & humanities (79 | 5.9%) are the most common fields of study among 1,339 individuals in Thief River Falls who have obtained a bachelor's degree or higher.
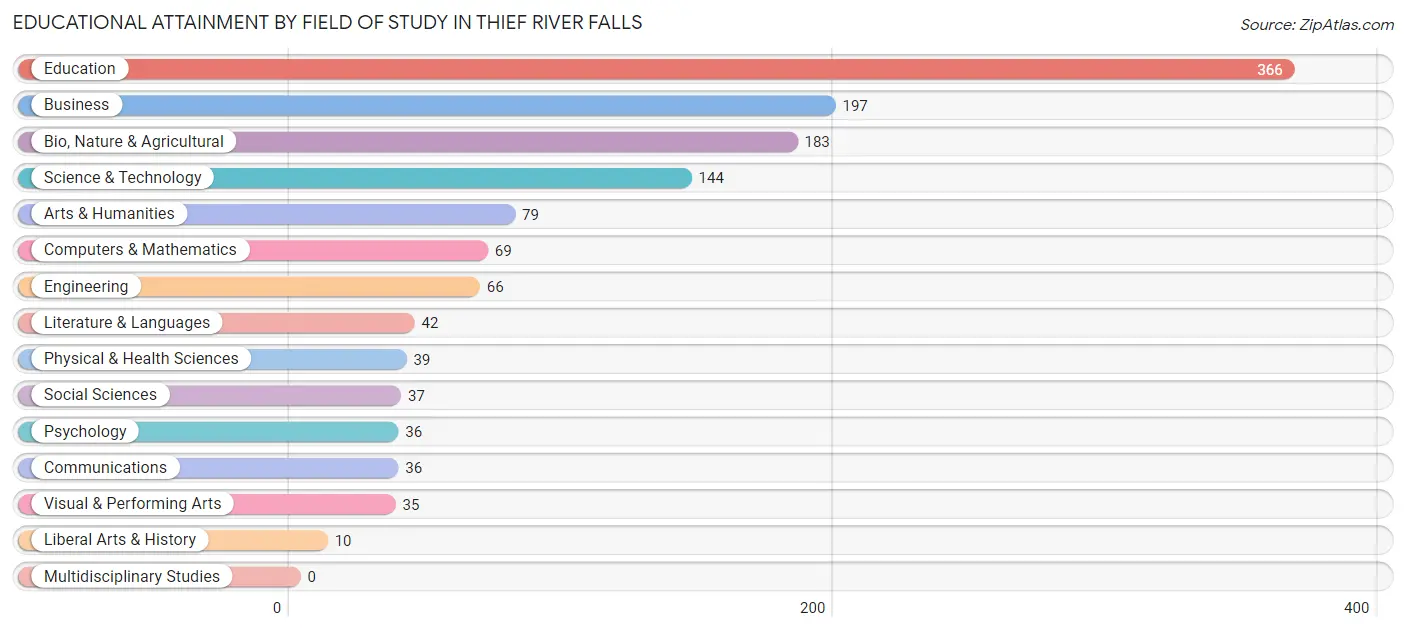
| Field of Study | # Graduates | % Graduates |
| Computers & Mathematics | 69 | 5.1% |
| Bio, Nature & Agricultural | 183 | 13.7% |
| Physical & Health Sciences | 39 | 2.9% |
| Psychology | 36 | 2.7% |
| Social Sciences | 37 | 2.8% |
| Engineering | 66 | 4.9% |
| Multidisciplinary Studies | 0 | 0.0% |
| Science & Technology | 144 | 10.7% |
| Business | 197 | 14.7% |
| Education | 366 | 27.3% |
| Literature & Languages | 42 | 3.1% |
| Liberal Arts & History | 10 | 0.7% |
| Visual & Performing Arts | 35 | 2.6% |
| Communications | 36 | 2.7% |
| Arts & Humanities | 79 | 5.9% |
| Total | 1,339 | 100.0% |
Transportation & Commute in Thief River Falls
Vehicle Availability by Sex in Thief River Falls
The most prevalent vehicle ownership categories in Thief River Falls are males with 2 vehicles (1,080, accounting for 44.4%) and females with 2 vehicles (997, making up 49.9%).
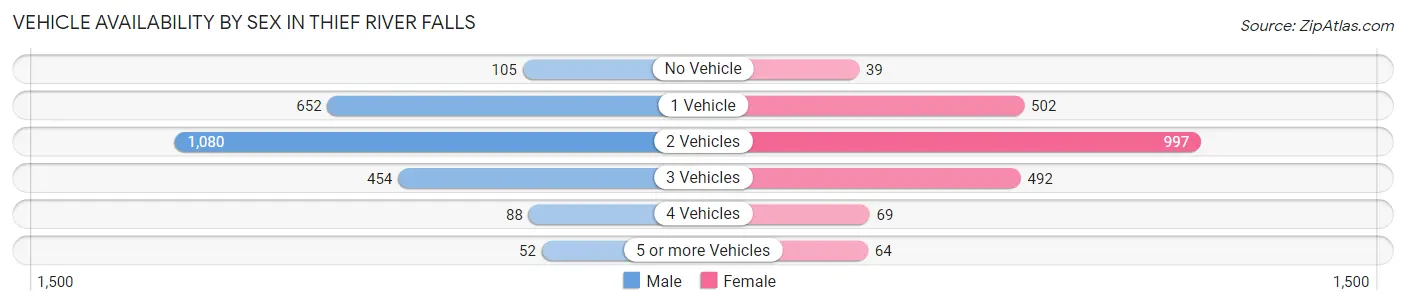
| Vehicles Available | Male | Female |
| No Vehicle | 105 (4.3%) | 39 (1.8%) |
| 1 Vehicle | 652 (26.8%) | 502 (23.2%) |
| 2 Vehicles | 1,080 (44.4%) | 997 (46.1%) |
| 3 Vehicles | 454 (18.7%) | 492 (22.8%) |
| 4 Vehicles | 88 (3.6%) | 69 (3.2%) |
| 5 or more Vehicles | 52 (2.1%) | 64 (3.0%) |
| Total | 2,431 (100.0%) | 2,163 (100.0%) |
Commute Time in Thief River Falls
The most frequently occuring commute durations in Thief River Falls are 5 to 9 minutes (2,003 commuters, 46.6%), 10 to 14 minutes (1,088 commuters, 25.3%), and less than 5 minutes (546 commuters, 12.7%).
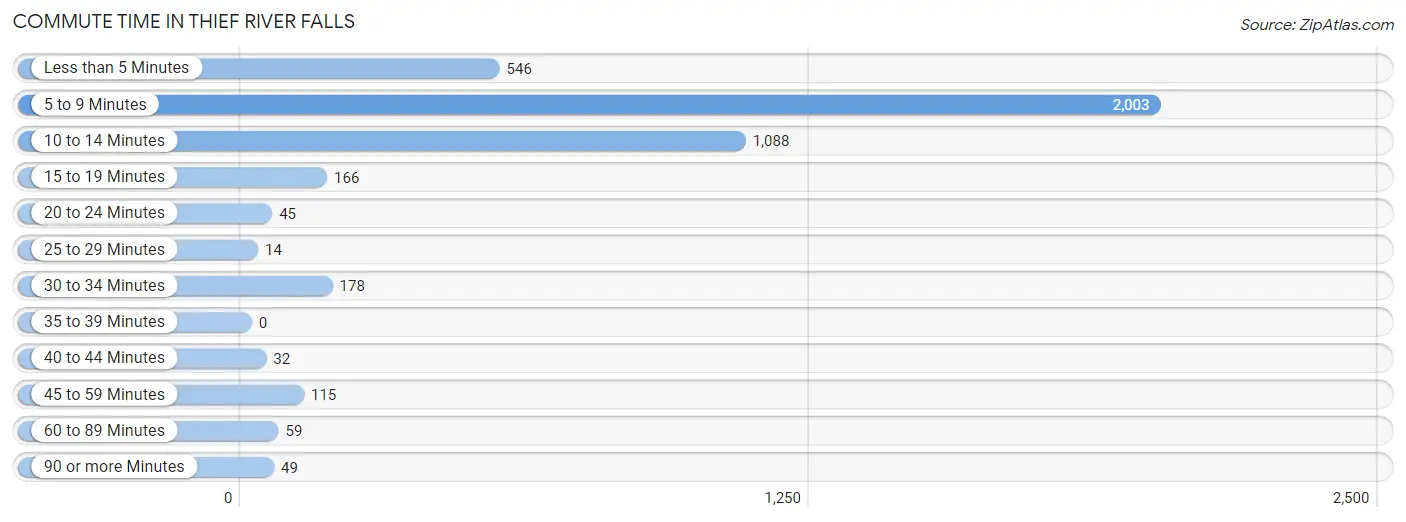
| Commute Time | # Commuters | % Commuters |
| Less than 5 Minutes | 546 | 12.7% |
| 5 to 9 Minutes | 2,003 | 46.6% |
| 10 to 14 Minutes | 1,088 | 25.3% |
| 15 to 19 Minutes | 166 | 3.9% |
| 20 to 24 Minutes | 45 | 1.1% |
| 25 to 29 Minutes | 14 | 0.3% |
| 30 to 34 Minutes | 178 | 4.1% |
| 35 to 39 Minutes | 0 | 0.0% |
| 40 to 44 Minutes | 32 | 0.7% |
| 45 to 59 Minutes | 115 | 2.7% |
| 60 to 89 Minutes | 59 | 1.4% |
| 90 or more Minutes | 49 | 1.1% |
Commute Time by Sex in Thief River Falls
The most common commute times in Thief River Falls are 5 to 9 minutes (1,019 commuters, 43.8%) for males and 5 to 9 minutes (984 commuters, 50.0%) for females.
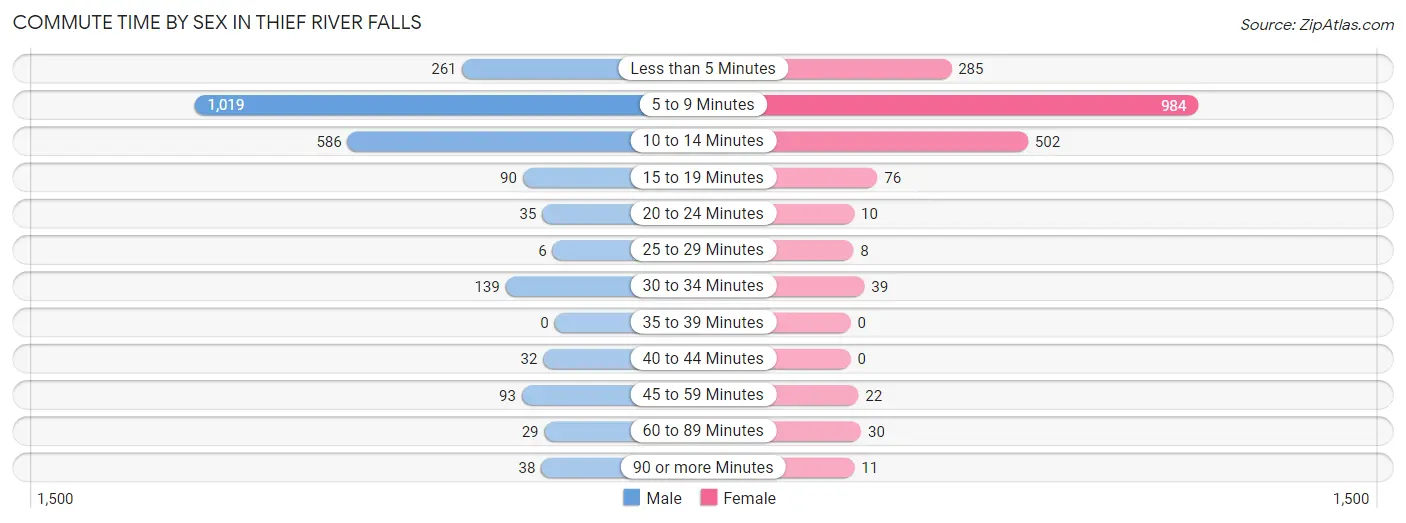
| Commute Time | Male | Female |
| Less than 5 Minutes | 261 (11.2%) | 285 (14.5%) |
| 5 to 9 Minutes | 1,019 (43.8%) | 984 (50.0%) |
| 10 to 14 Minutes | 586 (25.2%) | 502 (25.5%) |
| 15 to 19 Minutes | 90 (3.9%) | 76 (3.9%) |
| 20 to 24 Minutes | 35 (1.5%) | 10 (0.5%) |
| 25 to 29 Minutes | 6 (0.3%) | 8 (0.4%) |
| 30 to 34 Minutes | 139 (6.0%) | 39 (2.0%) |
| 35 to 39 Minutes | 0 (0.0%) | 0 (0.0%) |
| 40 to 44 Minutes | 32 (1.4%) | 0 (0.0%) |
| 45 to 59 Minutes | 93 (4.0%) | 22 (1.1%) |
| 60 to 89 Minutes | 29 (1.3%) | 30 (1.5%) |
| 90 or more Minutes | 38 (1.6%) | 11 (0.6%) |
Time of Departure to Work by Sex in Thief River Falls
The most frequent times of departure to work in Thief River Falls are 7:30 AM to 7:59 AM (368, 15.8%) for males and 7:30 AM to 7:59 AM (364, 18.5%) for females.
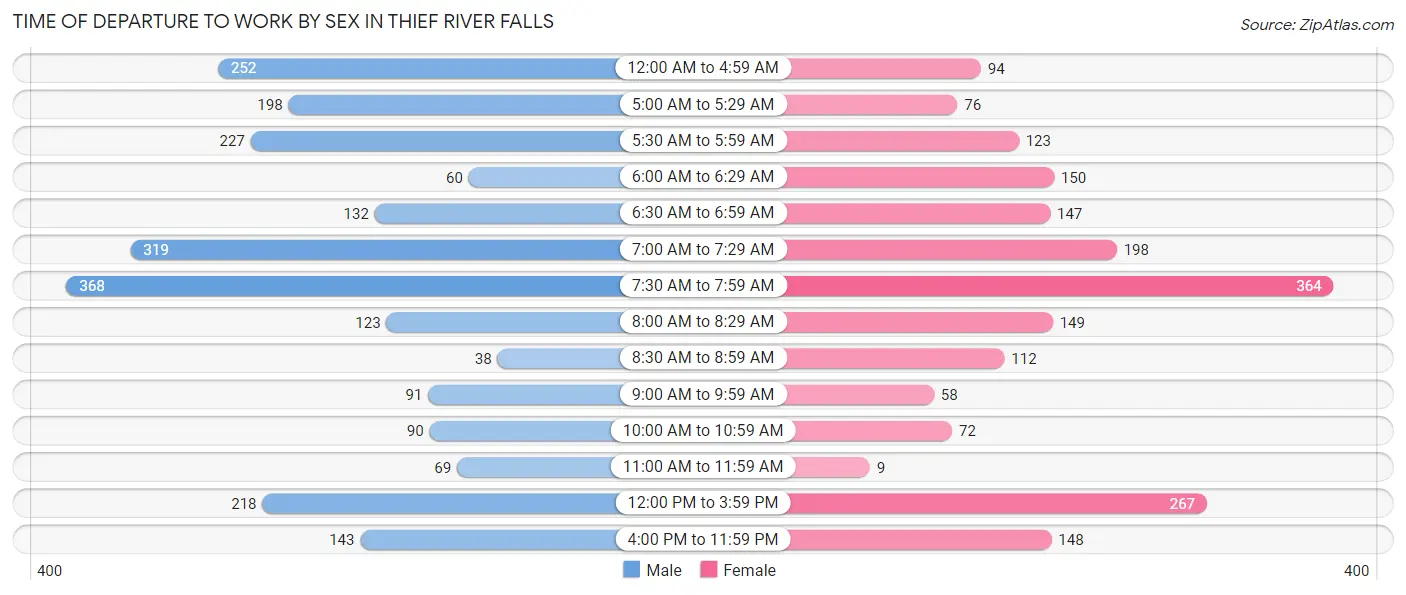
| Time of Departure | Male | Female |
| 12:00 AM to 4:59 AM | 252 (10.8%) | 94 (4.8%) |
| 5:00 AM to 5:29 AM | 198 (8.5%) | 76 (3.9%) |
| 5:30 AM to 5:59 AM | 227 (9.8%) | 123 (6.2%) |
| 6:00 AM to 6:29 AM | 60 (2.6%) | 150 (7.6%) |
| 6:30 AM to 6:59 AM | 132 (5.7%) | 147 (7.5%) |
| 7:00 AM to 7:29 AM | 319 (13.7%) | 198 (10.1%) |
| 7:30 AM to 7:59 AM | 368 (15.8%) | 364 (18.5%) |
| 8:00 AM to 8:29 AM | 123 (5.3%) | 149 (7.6%) |
| 8:30 AM to 8:59 AM | 38 (1.6%) | 112 (5.7%) |
| 9:00 AM to 9:59 AM | 91 (3.9%) | 58 (2.9%) |
| 10:00 AM to 10:59 AM | 90 (3.9%) | 72 (3.7%) |
| 11:00 AM to 11:59 AM | 69 (3.0%) | 9 (0.5%) |
| 12:00 PM to 3:59 PM | 218 (9.4%) | 267 (13.6%) |
| 4:00 PM to 11:59 PM | 143 (6.1%) | 148 (7.5%) |
| Total | 2,328 (100.0%) | 1,967 (100.0%) |
Housing Occupancy in Thief River Falls
Occupancy by Ownership in Thief River Falls
Of the total 4,126 dwellings in Thief River Falls, owner-occupied units account for 2,596 (62.9%), while renter-occupied units make up 1,530 (37.1%).
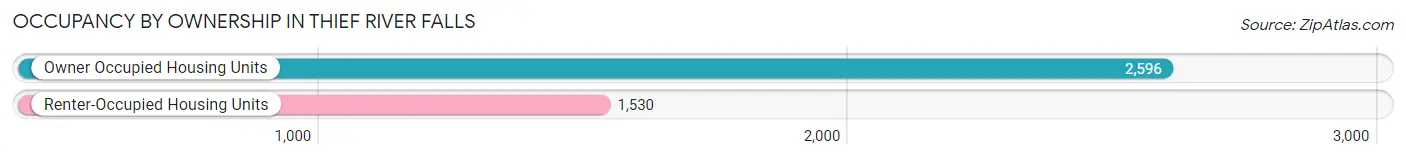
| Occupancy | # Housing Units | % Housing Units |
| Owner Occupied Housing Units | 2,596 | 62.9% |
| Renter-Occupied Housing Units | 1,530 | 37.1% |
| Total Occupied Housing Units | 4,126 | 100.0% |
Occupancy by Household Size in Thief River Falls
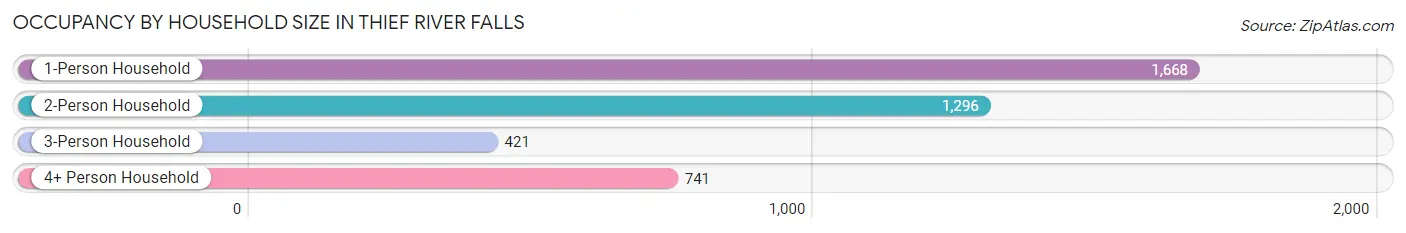
| Household Size | # Housing Units | % Housing Units |
| 1-Person Household | 1,668 | 40.4% |
| 2-Person Household | 1,296 | 31.4% |
| 3-Person Household | 421 | 10.2% |
| 4+ Person Household | 741 | 18.0% |
| Total Housing Units | 4,126 | 100.0% |
Occupancy by Ownership by Household Size in Thief River Falls
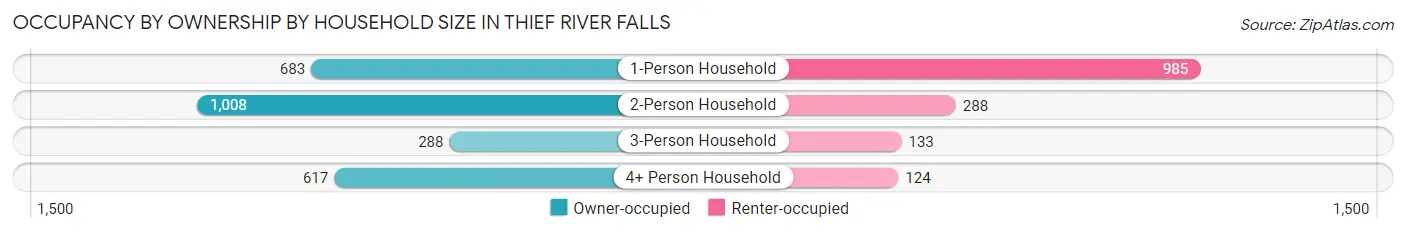
| Household Size | Owner-occupied | Renter-occupied |
| 1-Person Household | 683 (40.9%) | 985 (59.1%) |
| 2-Person Household | 1,008 (77.8%) | 288 (22.2%) |
| 3-Person Household | 288 (68.4%) | 133 (31.6%) |
| 4+ Person Household | 617 (83.3%) | 124 (16.7%) |
| Total Housing Units | 2,596 (62.9%) | 1,530 (37.1%) |
Occupancy by Educational Attainment in Thief River Falls
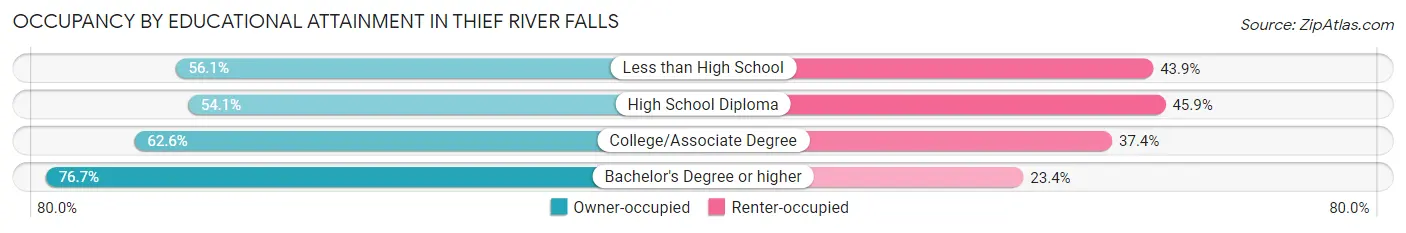
| Household Size | Owner-occupied | Renter-occupied |
| Less than High School | 74 (56.1%) | 58 (43.9%) |
| High School Diploma | 645 (54.1%) | 547 (45.9%) |
| College/Associate Degree | 1,204 (62.6%) | 720 (37.4%) |
| Bachelor's Degree or higher | 673 (76.6%) | 205 (23.4%) |
Occupancy by Age of Householder in Thief River Falls
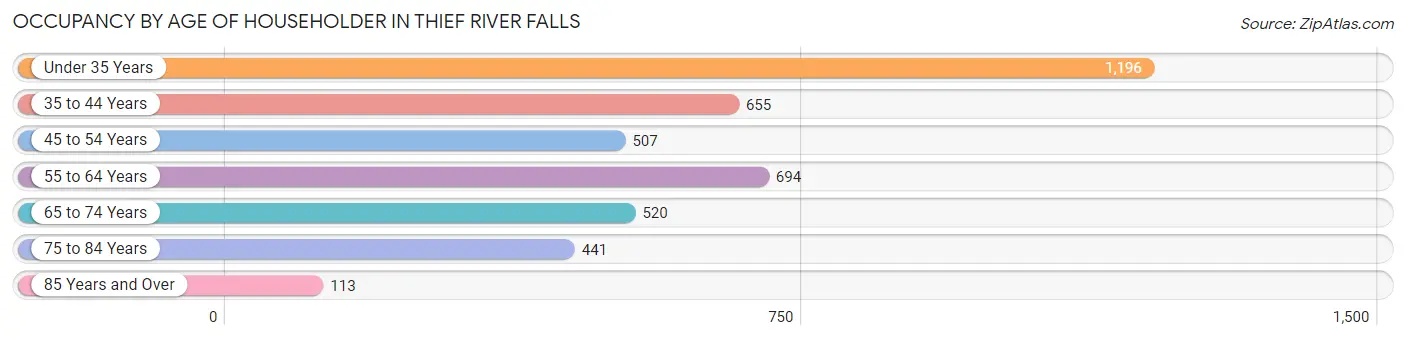
| Age Bracket | # Households | % Households |
| Under 35 Years | 1,196 | 29.0% |
| 35 to 44 Years | 655 | 15.9% |
| 45 to 54 Years | 507 | 12.3% |
| 55 to 64 Years | 694 | 16.8% |
| 65 to 74 Years | 520 | 12.6% |
| 75 to 84 Years | 441 | 10.7% |
| 85 Years and Over | 113 | 2.7% |
| Total | 4,126 | 100.0% |
Housing Finances in Thief River Falls
Median Income by Occupancy in Thief River Falls
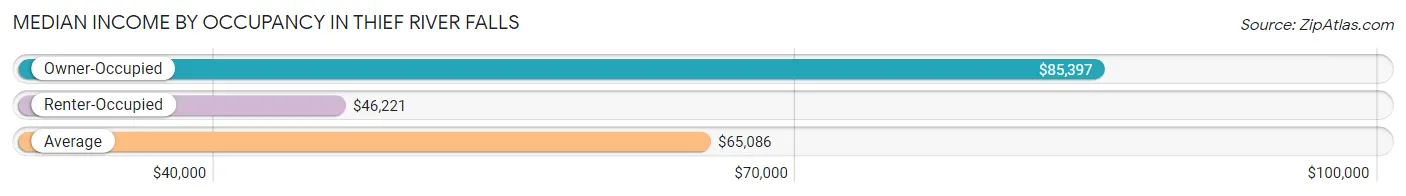
| Occupancy Type | # Households | Median Income |
| Owner-Occupied | 2,596 (62.9%) | $85,397 |
| Renter-Occupied | 1,530 (37.1%) | $46,221 |
| Average | 4,126 (100.0%) | $65,086 |
Occupancy by Householder Income Bracket in Thief River Falls
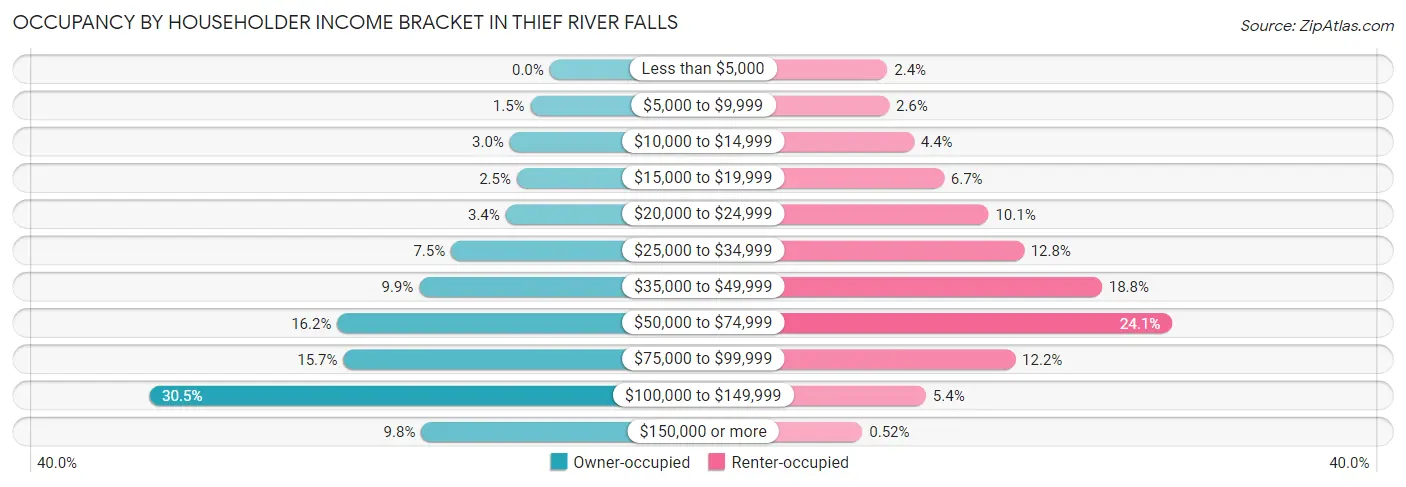
| Income Bracket | Owner-occupied | Renter-occupied |
| Less than $5,000 | 0 (0.0%) | 37 (2.4%) |
| $5,000 to $9,999 | 38 (1.5%) | 39 (2.5%) |
| $10,000 to $14,999 | 79 (3.0%) | 68 (4.4%) |
| $15,000 to $19,999 | 65 (2.5%) | 103 (6.7%) |
| $20,000 to $24,999 | 87 (3.4%) | 155 (10.1%) |
| $25,000 to $34,999 | 195 (7.5%) | 196 (12.8%) |
| $35,000 to $49,999 | 258 (9.9%) | 287 (18.8%) |
| $50,000 to $74,999 | 420 (16.2%) | 369 (24.1%) |
| $75,000 to $99,999 | 408 (15.7%) | 186 (12.2%) |
| $100,000 to $149,999 | 792 (30.5%) | 82 (5.4%) |
| $150,000 or more | 254 (9.8%) | 8 (0.5%) |
| Total | 2,596 (100.0%) | 1,530 (100.0%) |
Monthly Housing Cost Tiers in Thief River Falls
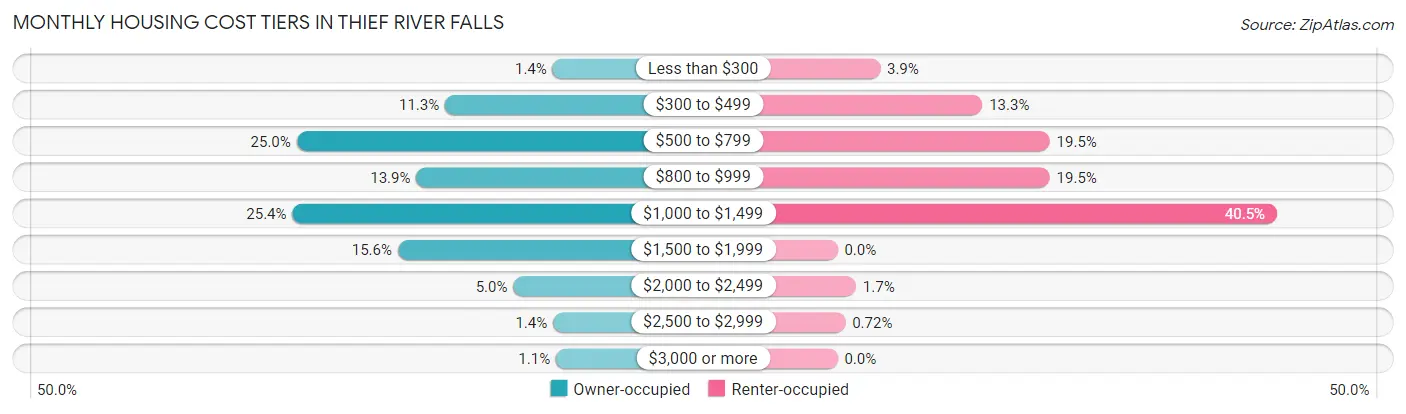
| Monthly Cost | Owner-occupied | Renter-occupied |
| Less than $300 | 36 (1.4%) | 60 (3.9%) |
| $300 to $499 | 293 (11.3%) | 204 (13.3%) |
| $500 to $799 | 648 (25.0%) | 299 (19.5%) |
| $800 to $999 | 362 (13.9%) | 299 (19.5%) |
| $1,000 to $1,499 | 658 (25.4%) | 619 (40.5%) |
| $1,500 to $1,999 | 406 (15.6%) | 0 (0.0%) |
| $2,000 to $2,499 | 130 (5.0%) | 26 (1.7%) |
| $2,500 to $2,999 | 35 (1.3%) | 11 (0.7%) |
| $3,000 or more | 28 (1.1%) | 0 (0.0%) |
| Total | 2,596 (100.0%) | 1,530 (100.0%) |
Physical Housing Characteristics in Thief River Falls
Housing Structures in Thief River Falls
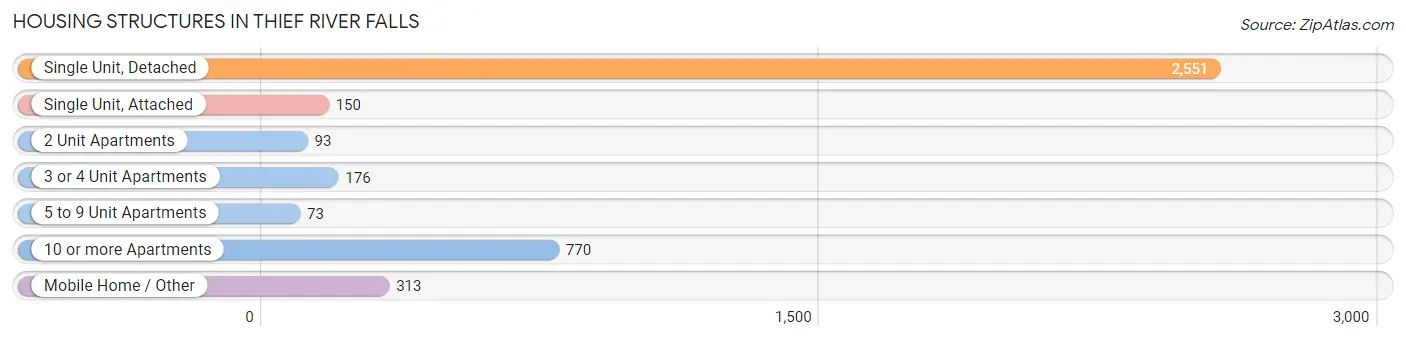
| Structure Type | # Housing Units | % Housing Units |
| Single Unit, Detached | 2,551 | 61.8% |
| Single Unit, Attached | 150 | 3.6% |
| 2 Unit Apartments | 93 | 2.2% |
| 3 or 4 Unit Apartments | 176 | 4.3% |
| 5 to 9 Unit Apartments | 73 | 1.8% |
| 10 or more Apartments | 770 | 18.7% |
| Mobile Home / Other | 313 | 7.6% |
| Total | 4,126 | 100.0% |
Housing Structures by Occupancy in Thief River Falls
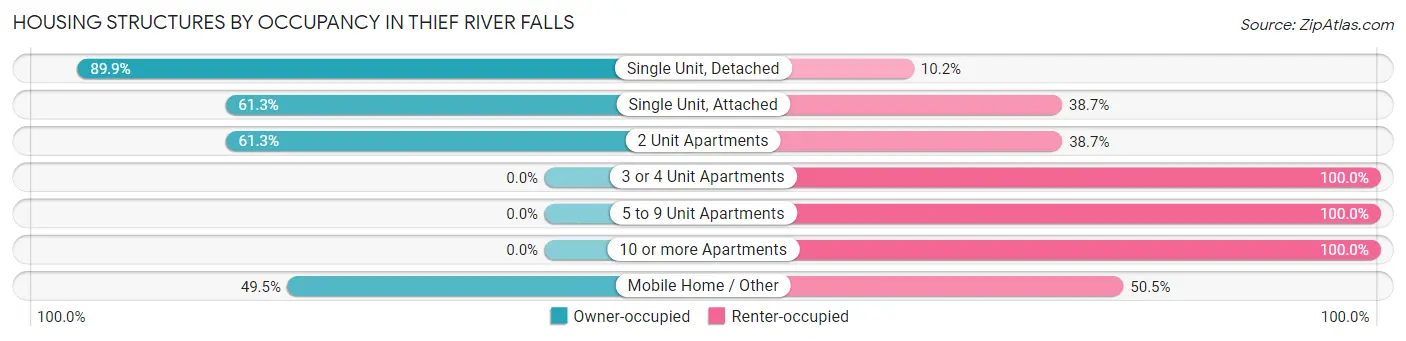
| Structure Type | Owner-occupied | Renter-occupied |
| Single Unit, Detached | 2,292 (89.8%) | 259 (10.2%) |
| Single Unit, Attached | 92 (61.3%) | 58 (38.7%) |
| 2 Unit Apartments | 57 (61.3%) | 36 (38.7%) |
| 3 or 4 Unit Apartments | 0 (0.0%) | 176 (100.0%) |
| 5 to 9 Unit Apartments | 0 (0.0%) | 73 (100.0%) |
| 10 or more Apartments | 0 (0.0%) | 770 (100.0%) |
| Mobile Home / Other | 155 (49.5%) | 158 (50.5%) |
| Total | 2,596 (62.9%) | 1,530 (37.1%) |
Housing Structures by Number of Rooms in Thief River Falls
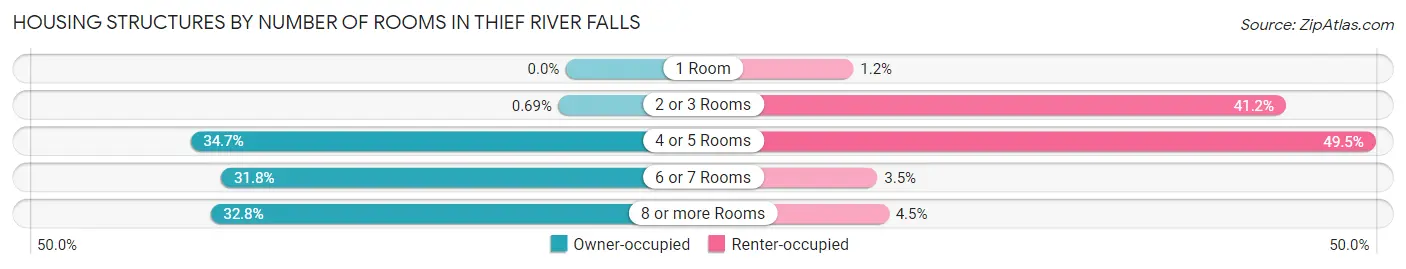
| Number of Rooms | Owner-occupied | Renter-occupied |
| 1 Room | 0 (0.0%) | 19 (1.2%) |
| 2 or 3 Rooms | 18 (0.7%) | 631 (41.2%) |
| 4 or 5 Rooms | 900 (34.7%) | 758 (49.5%) |
| 6 or 7 Rooms | 826 (31.8%) | 53 (3.5%) |
| 8 or more Rooms | 852 (32.8%) | 69 (4.5%) |
| Total | 2,596 (100.0%) | 1,530 (100.0%) |
Housing Structure by Heating Type in Thief River Falls
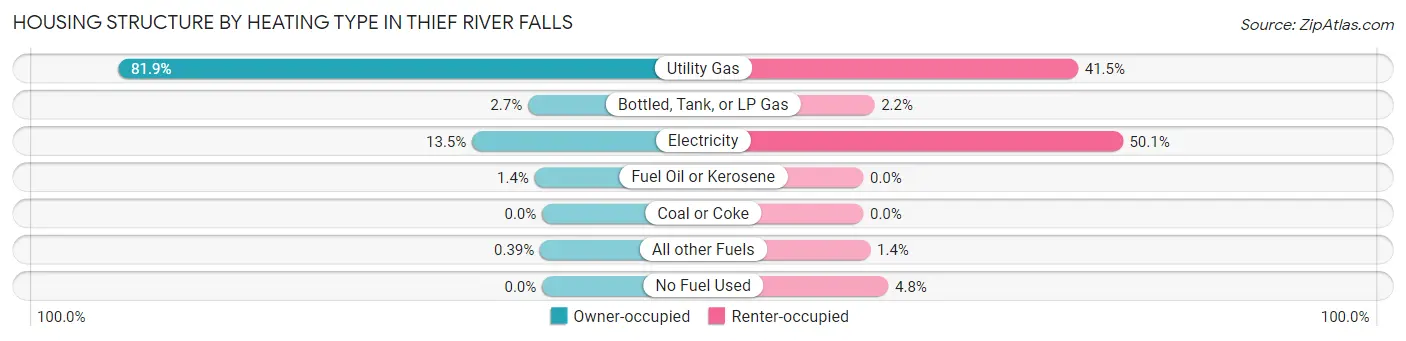
| Heating Type | Owner-occupied | Renter-occupied |
| Utility Gas | 2,127 (81.9%) | 635 (41.5%) |
| Bottled, Tank, or LP Gas | 71 (2.7%) | 33 (2.2%) |
| Electricity | 351 (13.5%) | 767 (50.1%) |
| Fuel Oil or Kerosene | 37 (1.4%) | 0 (0.0%) |
| Coal or Coke | 0 (0.0%) | 0 (0.0%) |
| All other Fuels | 10 (0.4%) | 21 (1.4%) |
| No Fuel Used | 0 (0.0%) | 74 (4.8%) |
| Total | 2,596 (100.0%) | 1,530 (100.0%) |
Household Vehicle Usage in Thief River Falls
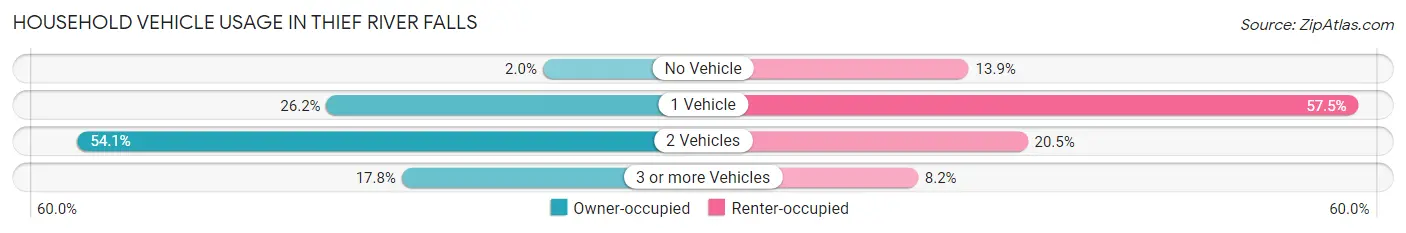
| Vehicles per Household | Owner-occupied | Renter-occupied |
| No Vehicle | 51 (2.0%) | 212 (13.9%) |
| 1 Vehicle | 680 (26.2%) | 880 (57.5%) |
| 2 Vehicles | 1,404 (54.1%) | 313 (20.5%) |
| 3 or more Vehicles | 461 (17.8%) | 125 (8.2%) |
| Total | 2,596 (100.0%) | 1,530 (100.0%) |
Real Estate & Mortgages in Thief River Falls
Real Estate and Mortgage Overview in Thief River Falls
| Characteristic | Without Mortgage | With Mortgage |
| Housing Units | 896 | 1,700 |
| Median Property Value | $158,500 | $161,200 |
| Median Household Income | $62,000 | $182 |
| Monthly Housing Costs | $573 | $28 |
| Real Estate Taxes | $2,149 | $0 |
Property Value by Mortgage Status in Thief River Falls
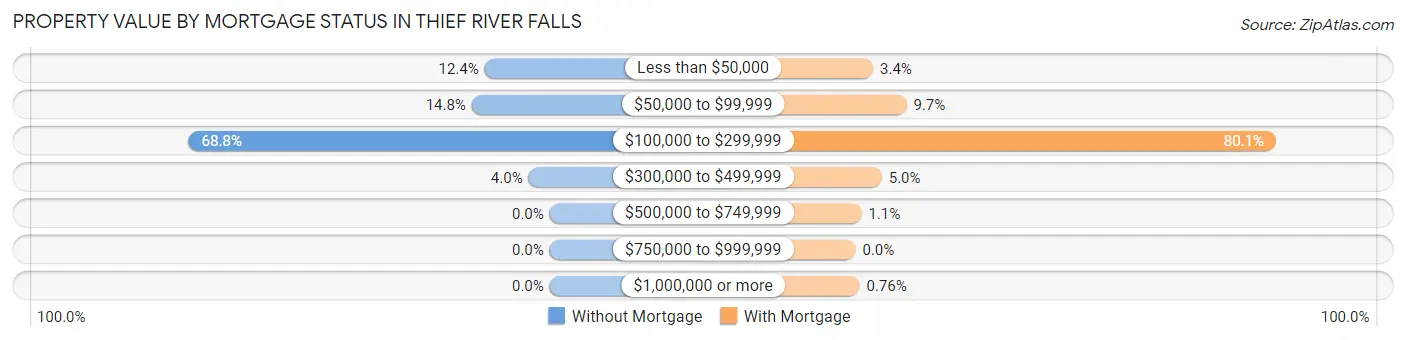
| Property Value | Without Mortgage | With Mortgage |
| Less than $50,000 | 111 (12.4%) | 57 (3.4%) |
| $50,000 to $99,999 | 133 (14.8%) | 165 (9.7%) |
| $100,000 to $299,999 | 616 (68.8%) | 1,361 (80.1%) |
| $300,000 to $499,999 | 36 (4.0%) | 85 (5.0%) |
| $500,000 to $749,999 | 0 (0.0%) | 19 (1.1%) |
| $750,000 to $999,999 | 0 (0.0%) | 0 (0.0%) |
| $1,000,000 or more | 0 (0.0%) | 13 (0.8%) |
| Total | 896 (100.0%) | 1,700 (100.0%) |
Household Income by Mortgage Status in Thief River Falls
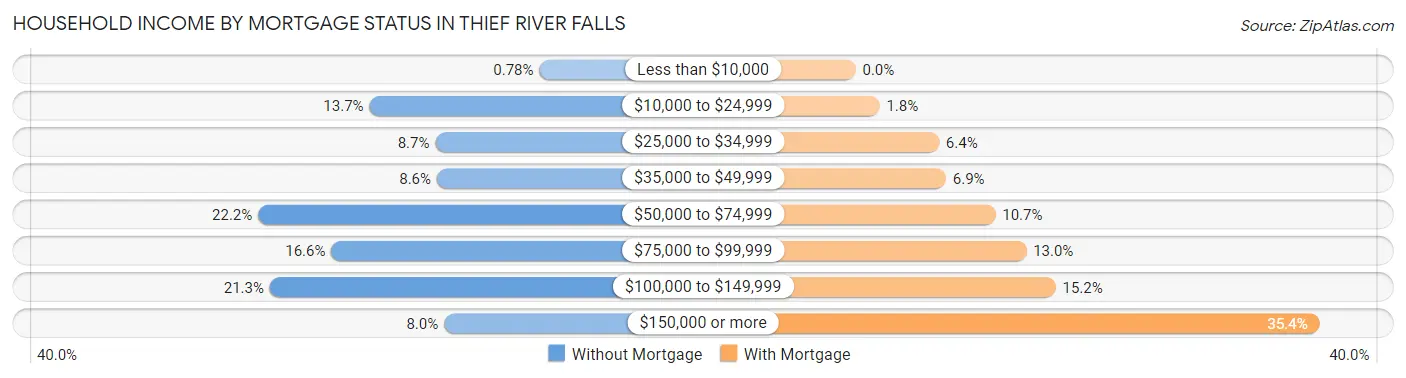
| Household Income | Without Mortgage | With Mortgage |
| Less than $10,000 | 7 (0.8%) | 0 (0.0%) |
| $10,000 to $24,999 | 123 (13.7%) | 31 (1.8%) |
| $25,000 to $34,999 | 78 (8.7%) | 108 (6.4%) |
| $35,000 to $49,999 | 77 (8.6%) | 117 (6.9%) |
| $50,000 to $74,999 | 199 (22.2%) | 181 (10.6%) |
| $75,000 to $99,999 | 149 (16.6%) | 221 (13.0%) |
| $100,000 to $149,999 | 191 (21.3%) | 259 (15.2%) |
| $150,000 or more | 72 (8.0%) | 601 (35.3%) |
| Total | 896 (100.0%) | 1,700 (100.0%) |
Property Value to Household Income Ratio in Thief River Falls
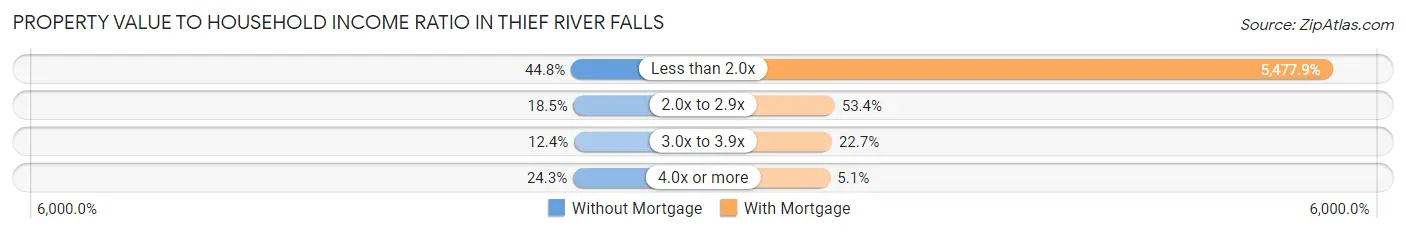
| Value-to-Income Ratio | Without Mortgage | With Mortgage |
| Less than 2.0x | 401 (44.8%) | 93,125 (5,477.9%) |
| 2.0x to 2.9x | 166 (18.5%) | 907 (53.3%) |
| 3.0x to 3.9x | 111 (12.4%) | 385 (22.7%) |
| 4.0x or more | 218 (24.3%) | 87 (5.1%) |
| Total | 896 (100.0%) | 1,700 (100.0%) |
Real Estate Taxes by Mortgage Status in Thief River Falls
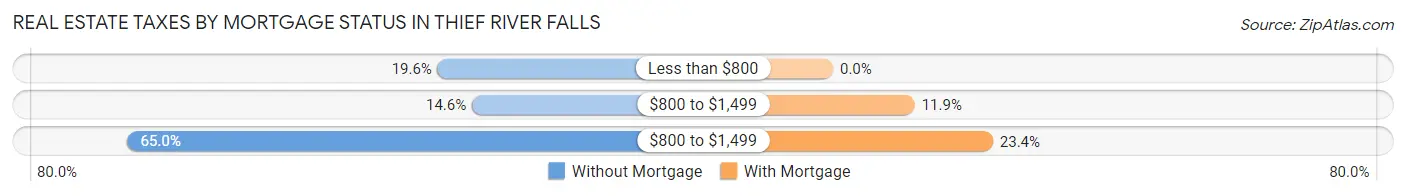
| Property Taxes | Without Mortgage | With Mortgage |
| Less than $800 | 176 (19.6%) | 0 (0.0%) |
| $800 to $1,499 | 131 (14.6%) | 203 (11.9%) |
| $800 to $1,499 | 582 (65.0%) | 397 (23.4%) |
| Total | 896 (100.0%) | 1,700 (100.0%) |
Health & Disability in Thief River Falls
Health Insurance Coverage by Age in Thief River Falls
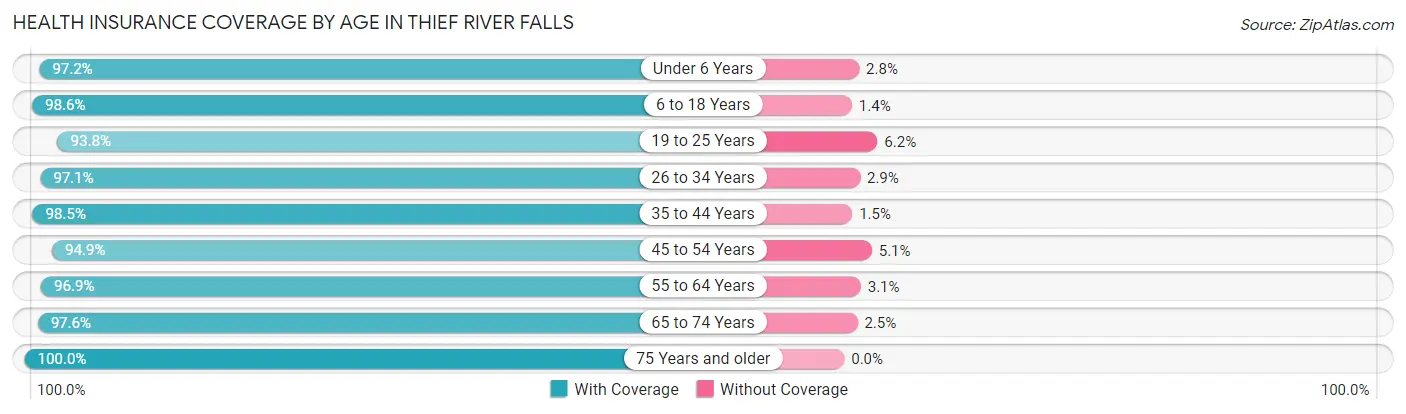
| Age Bracket | With Coverage | Without Coverage |
| Under 6 Years | 701 (97.2%) | 20 (2.8%) |
| 6 to 18 Years | 1,247 (98.6%) | 18 (1.4%) |
| 19 to 25 Years | 776 (93.8%) | 51 (6.2%) |
| 26 to 34 Years | 1,225 (97.1%) | 37 (2.9%) |
| 35 to 44 Years | 1,068 (98.5%) | 16 (1.5%) |
| 45 to 54 Years | 814 (94.9%) | 44 (5.1%) |
| 55 to 64 Years | 1,071 (96.9%) | 34 (3.1%) |
| 65 to 74 Years | 836 (97.6%) | 21 (2.5%) |
| 75 Years and older | 698 (100.0%) | 0 (0.0%) |
| Total | 8,436 (97.2%) | 241 (2.8%) |
Health Insurance Coverage by Citizenship Status in Thief River Falls
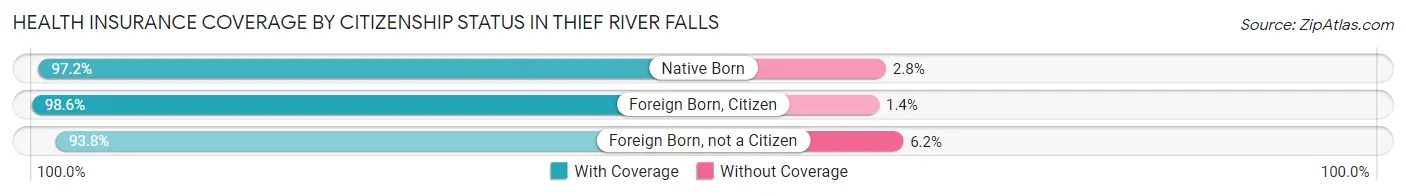
| Citizenship Status | With Coverage | Without Coverage |
| Native Born | 701 (97.2%) | 20 (2.8%) |
| Foreign Born, Citizen | 1,247 (98.6%) | 18 (1.4%) |
| Foreign Born, not a Citizen | 776 (93.8%) | 51 (6.2%) |
Health Insurance Coverage by Household Income in Thief River Falls
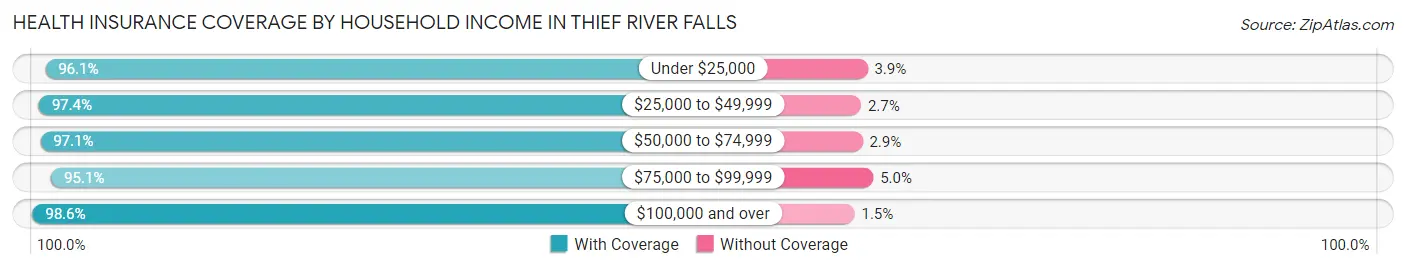
| Household Income | With Coverage | Without Coverage |
| Under $25,000 | 919 (96.1%) | 37 (3.9%) |
| $25,000 to $49,999 | 1,431 (97.4%) | 39 (2.6%) |
| $50,000 to $74,999 | 1,457 (97.1%) | 44 (2.9%) |
| $75,000 to $99,999 | 1,440 (95.1%) | 75 (5.0%) |
| $100,000 and over | 3,131 (98.6%) | 46 (1.5%) |
Public vs Private Health Insurance Coverage by Age in Thief River Falls
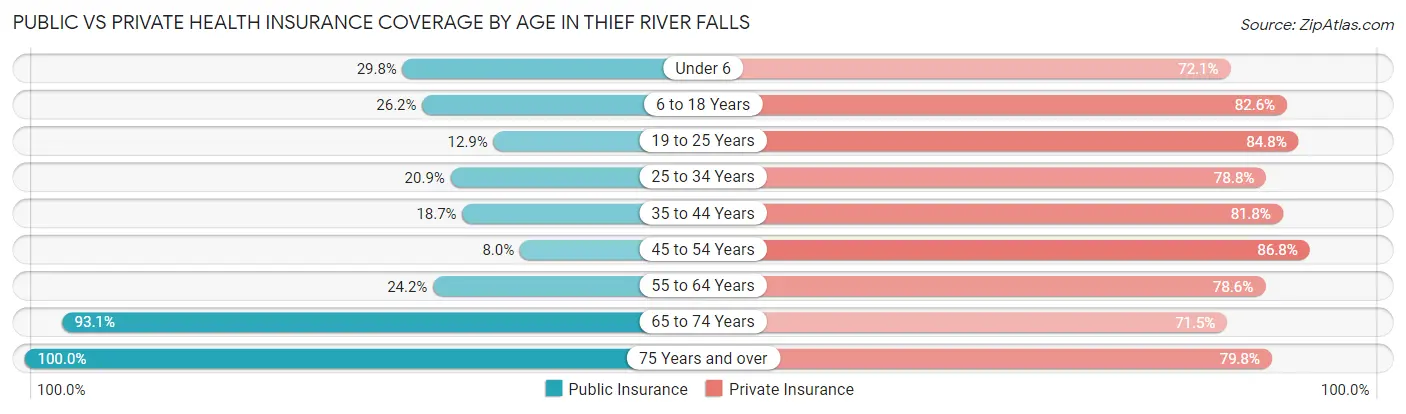
| Age Bracket | Public Insurance | Private Insurance |
| Under 6 | 215 (29.8%) | 520 (72.1%) |
| 6 to 18 Years | 331 (26.2%) | 1,045 (82.6%) |
| 19 to 25 Years | 107 (12.9%) | 701 (84.8%) |
| 25 to 34 Years | 264 (20.9%) | 994 (78.8%) |
| 35 to 44 Years | 203 (18.7%) | 887 (81.8%) |
| 45 to 54 Years | 69 (8.0%) | 745 (86.8%) |
| 55 to 64 Years | 267 (24.2%) | 868 (78.5%) |
| 65 to 74 Years | 798 (93.1%) | 613 (71.5%) |
| 75 Years and over | 698 (100.0%) | 557 (79.8%) |
| Total | 2,952 (34.0%) | 6,930 (79.9%) |
Disability Status by Sex by Age in Thief River Falls
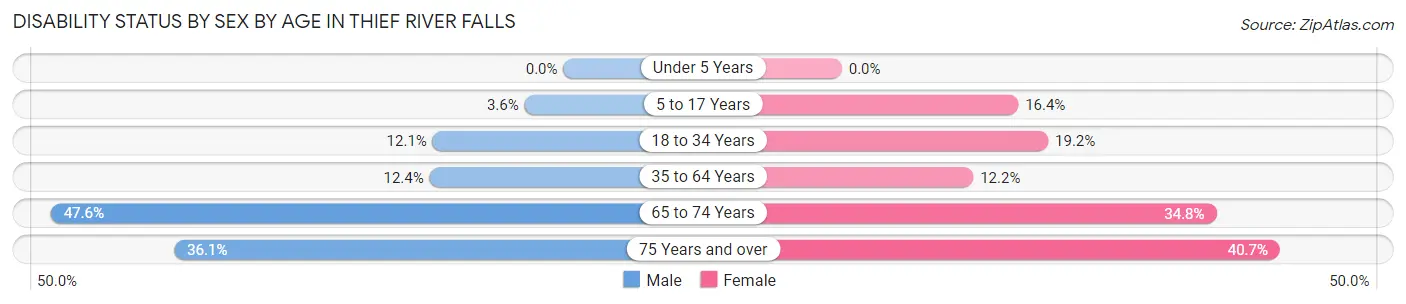
| Age Bracket | Male | Female |
| Under 5 Years | 0 (0.0%) | 0 (0.0%) |
| 5 to 17 Years | 26 (3.6%) | 102 (16.4%) |
| 18 to 34 Years | 144 (12.1%) | 189 (19.2%) |
| 35 to 64 Years | 187 (12.4%) | 188 (12.2%) |
| 65 to 74 Years | 186 (47.6%) | 162 (34.8%) |
| 75 Years and over | 86 (36.1%) | 187 (40.6%) |
Disability Class by Sex by Age in Thief River Falls
Disability Class: Hearing Difficulty
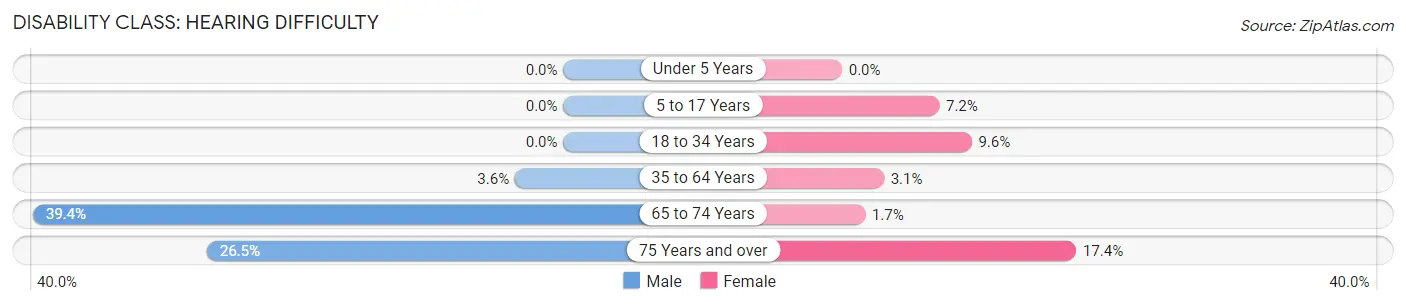
| Age Bracket | Male | Female |
| Under 5 Years | 0 (0.0%) | 0 (0.0%) |
| 5 to 17 Years | 0 (0.0%) | 45 (7.2%) |
| 18 to 34 Years | 0 (0.0%) | 95 (9.6%) |
| 35 to 64 Years | 54 (3.6%) | 48 (3.1%) |
| 65 to 74 Years | 154 (39.4%) | 8 (1.7%) |
| 75 Years and over | 63 (26.5%) | 80 (17.4%) |
Disability Class: Vision Difficulty
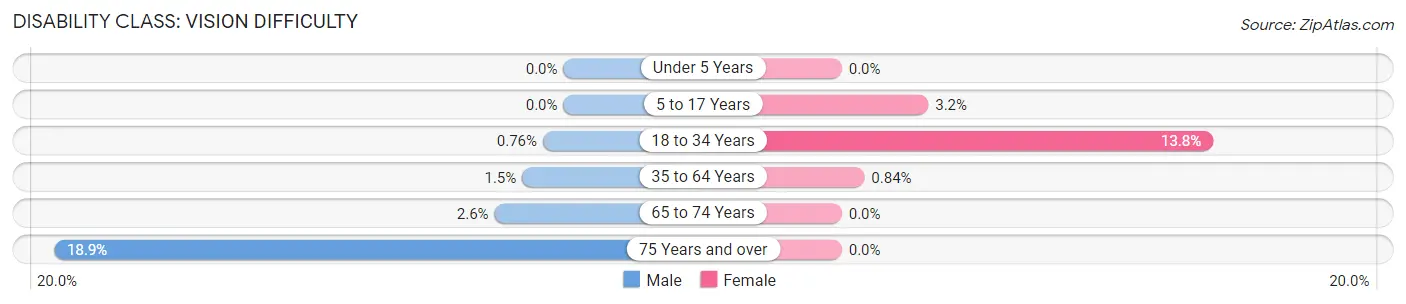
| Age Bracket | Male | Female |
| Under 5 Years | 0 (0.0%) | 0 (0.0%) |
| 5 to 17 Years | 0 (0.0%) | 20 (3.2%) |
| 18 to 34 Years | 9 (0.8%) | 136 (13.8%) |
| 35 to 64 Years | 23 (1.5%) | 13 (0.8%) |
| 65 to 74 Years | 10 (2.6%) | 0 (0.0%) |
| 75 Years and over | 45 (18.9%) | 0 (0.0%) |
Disability Class: Cognitive Difficulty
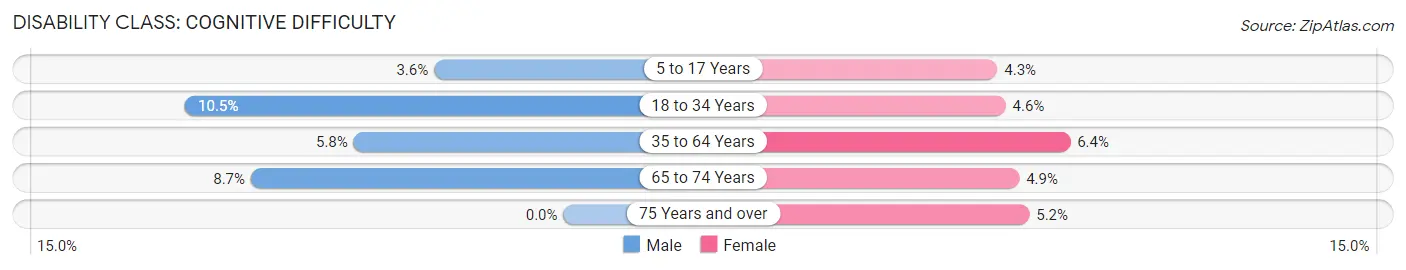
| Age Bracket | Male | Female |
| 5 to 17 Years | 26 (3.6%) | 27 (4.3%) |
| 18 to 34 Years | 125 (10.5%) | 45 (4.6%) |
| 35 to 64 Years | 88 (5.8%) | 98 (6.4%) |
| 65 to 74 Years | 34 (8.7%) | 23 (4.9%) |
| 75 Years and over | 0 (0.0%) | 24 (5.2%) |
Disability Class: Ambulatory Difficulty
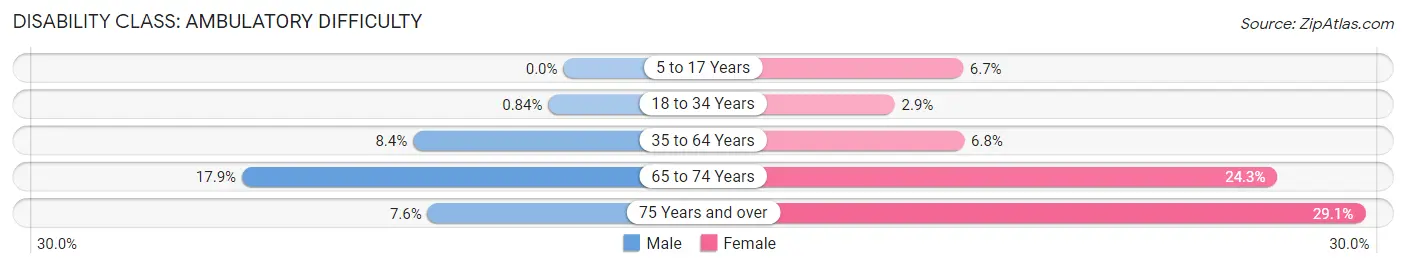
| Age Bracket | Male | Female |
| 5 to 17 Years | 0 (0.0%) | 42 (6.7%) |
| 18 to 34 Years | 10 (0.8%) | 29 (2.9%) |
| 35 to 64 Years | 126 (8.4%) | 105 (6.8%) |
| 65 to 74 Years | 70 (17.9%) | 113 (24.2%) |
| 75 Years and over | 18 (7.6%) | 134 (29.1%) |
Disability Class: Self-Care Difficulty
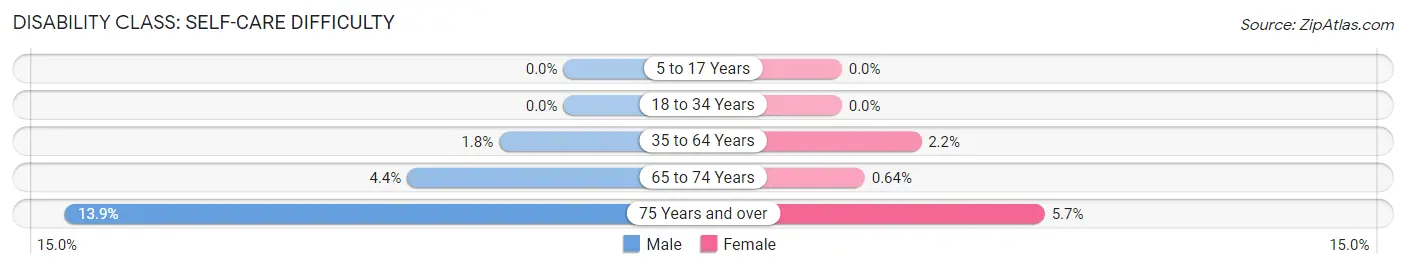
| Age Bracket | Male | Female |
| 5 to 17 Years | 0 (0.0%) | 0 (0.0%) |
| 18 to 34 Years | 0 (0.0%) | 0 (0.0%) |
| 35 to 64 Years | 27 (1.8%) | 34 (2.2%) |
| 65 to 74 Years | 17 (4.3%) | 3 (0.6%) |
| 75 Years and over | 33 (13.9%) | 26 (5.7%) |
Technology Access in Thief River Falls
Computing Device Access in Thief River Falls

| Device Type | # Households | % Households |
| Desktop or Laptop | 3,154 | 76.4% |
| Smartphone | 3,561 | 86.3% |
| Tablet | 2,313 | 56.1% |
| No Computing Device | 211 | 5.1% |
| Total | 4,126 | 100.0% |
Internet Access in Thief River Falls
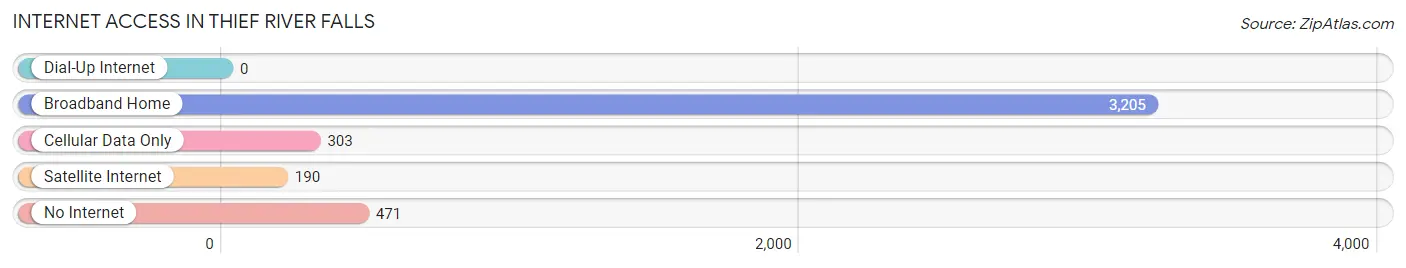
| Internet Type | # Households | % Households |
| Dial-Up Internet | 0 | 0.0% |
| Broadband Home | 3,205 | 77.7% |
| Cellular Data Only | 303 | 7.3% |
| Satellite Internet | 190 | 4.6% |
| No Internet | 471 | 11.4% |
| Total | 4,126 | 100.0% |
Thief River Falls Summary
Thief River Falls, Minnesota is a city located in Pennington County, in the northwestern part of the state. It is situated along the Red Lake River, and is the county seat of Pennington County. The city is home to a population of 8,715 people, according to the 2019 United States Census.
History
The area that is now Thief River Falls was first inhabited by the Ojibwe people, who called the area “Nee-Gaw-Ning”, which translates to “thief river”. The name was given to the area due to the Ojibwe’s belief that the river was a thief, stealing away the fish they were trying to catch.
The first European settlers arrived in the area in the late 1800s, and the city was officially incorporated in 1896. The city was named after the river, and the name was officially changed to Thief River Falls in 1901.
The city quickly grew in the early 1900s, and by 1910, the population had grown to 1,845 people. The city continued to grow throughout the 20th century, and by the 2000 census, the population had grown to 8,715 people.
Geography
Thief River Falls is located in northwestern Minnesota, in Pennington County. It is situated along the Red Lake River, and is the county seat of Pennington County. The city is located at the intersection of U.S. Route 59 and Minnesota State Highway 1.
The city has a total area of 8.3 square miles, of which 8.2 square miles is land and 0.1 square miles is water. The city is located in a flat, open area, with no major hills or mountains.
Economy
Thief River Falls is home to a variety of businesses and industries. The city is home to a number of manufacturing companies, including Arctic Cat, Digi-Key, and Polaris Industries. The city is also home to a number of retail stores, restaurants, and other businesses.
The city is also home to a number of educational institutions, including Northland Community and Technical College, and the University of Minnesota-Crookston.
Demographics
According to the 2019 United States Census, the population of Thief River Falls is 8,715 people. The city has a population density of 1,053 people per square mile. The median age of the population is 37.7 years, and the median household income is $45,945.
The racial makeup of the city is 94.2% White, 0.7% African American, 0.7% Native American, 0.7% Asian, 0.1% Pacific Islander, 1.7% from other races, and 2.0% from two or more races. The city is also home to a large number of immigrants, with 8.3% of the population being foreign-born.
Conclusion
Thief River Falls, Minnesota is a city located in Pennington County, in the northwestern part of the state. It is situated along the Red Lake River, and is the county seat of Pennington County. The city is home to a population of 8,715 people, according to the 2019 United States Census. The city is home to a variety of businesses and industries, and is also home to a number of educational institutions. The racial makeup of the city is 94.2% White, 0.7% African American, 0.7% Native American, 0.7% Asian, 0.1% Pacific Islander, 1.7% from other races, and 2.0% from two or more races. The city is also home to a large number of immigrants, with 8.3% of the population being foreign-born.
Common Questions
What is Per Capita Income in Thief River Falls?
Per Capita income in Thief River Falls is $35,528.
What is the Median Family Income in Thief River Falls?
Median Family Income in Thief River Falls is $88,239.
What is the Median Household income in Thief River Falls?
Median Household Income in Thief River Falls is $65,086.
What is Income or Wage Gap in Thief River Falls?
Income or Wage Gap in Thief River Falls is 19.8%.
Women in Thief River Falls earn 80.2 cents for every dollar earned by a man.
What is Family Income Deficit in Thief River Falls?
Family Income Deficit in Thief River Falls is $10,875.
Families that are below poverty line in Thief River Falls earn $10,875 less on average than the poverty threshold level.
What is Inequality or Gini Index in Thief River Falls?
Inequality or Gini Index in Thief River Falls is 0.39.
What is the Total Population of Thief River Falls?
Total Population of Thief River Falls is 8,871.
What is the Total Male Population of Thief River Falls?
Total Male Population of Thief River Falls is 4,370.
What is the Total Female Population of Thief River Falls?
Total Female Population of Thief River Falls is 4,501.
What is the Ratio of Males per 100 Females in Thief River Falls?
There are 97.09 Males per 100 Females in Thief River Falls.
What is the Ratio of Females per 100 Males in Thief River Falls?
There are 103.00 Females per 100 Males in Thief River Falls.
What is the Median Population Age in Thief River Falls?
Median Population Age in Thief River Falls is 37.6 Years.
What is the Average Family Size in Thief River Falls
Average Family Size in Thief River Falls is 2.8 People.
What is the Average Household Size in Thief River Falls
Average Household Size in Thief River Falls is 2.1 People.
How Large is the Labor Force in Thief River Falls?
There are 4,814 People in the Labor Forcein in Thief River Falls.
What is the Percentage of People in the Labor Force in Thief River Falls?
67.2% of People are in the Labor Force in Thief River Falls.
What is the Unemployment Rate in Thief River Falls?
Unemployment Rate in Thief River Falls is 1.3%.