Sherburn, MN Map & Demographics
Sherburn Map
Sherburn Overview
$29,211
PER CAPITA INCOME
$75,833
AVG FAMILY INCOME
$59,844
AVG HOUSEHOLD INCOME
34.2%
WAGE / INCOME GAP [ % ]
65.8¢/ $1
WAGE / INCOME GAP [ $ ]
0.39
INEQUALITY / GINI INDEX
1,035
TOTAL POPULATION
482
MALE POPULATION
553
FEMALE POPULATION
87.16
MALES / 100 FEMALES
114.73
FEMALES / 100 MALES
44.5
MEDIAN AGE
2.9
AVG FAMILY SIZE
2.4
AVG HOUSEHOLD SIZE
499
LABOR FORCE [ PEOPLE ]
61.1%
PERCENT IN LABOR FORCE
7.0%
UNEMPLOYMENT RATE
Sherburn Zip Codes
Sherburn Area Codes
Income in Sherburn
Income Overview in Sherburn
Per Capita Income in Sherburn is $29,211, while median incomes of families and households are $75,833 and $59,844 respectively.
| Characteristic | Number | Measure |
| Per Capita Income | 1,035 | $29,211 |
| Median Family Income | 276 | $75,833 |
| Mean Family Income | 276 | $85,745 |
| Median Household Income | 415 | $59,844 |
| Mean Household Income | 415 | $69,309 |
| Income Deficit | 276 | $0 |
| Wage / Income Gap (%) | 1,035 | 34.24% |
| Wage / Income Gap ($) | 1,035 | 65.76¢ per $1 |
| Gini / Inequality Index | 1,035 | 0.39 |
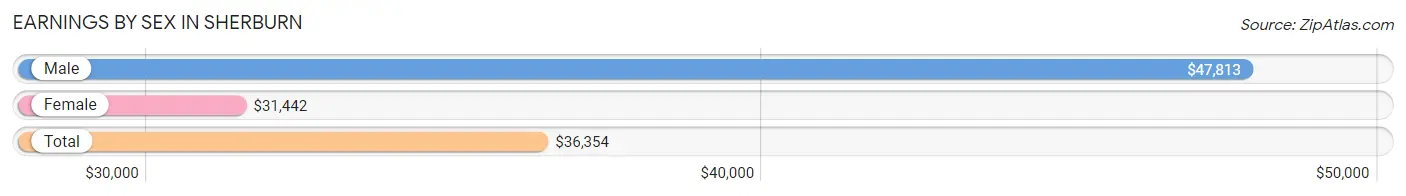
Earnings by Sex in Sherburn
Average Earnings in Sherburn are $36,354, $47,813 for men and $31,442 for women, a difference of 34.2%.
| Sex | Number | Average Earnings |
| Male | 259 (52.9%) | $47,813 |
| Female | 231 (47.1%) | $31,442 |
| Total | 490 (100.0%) | $36,354 |
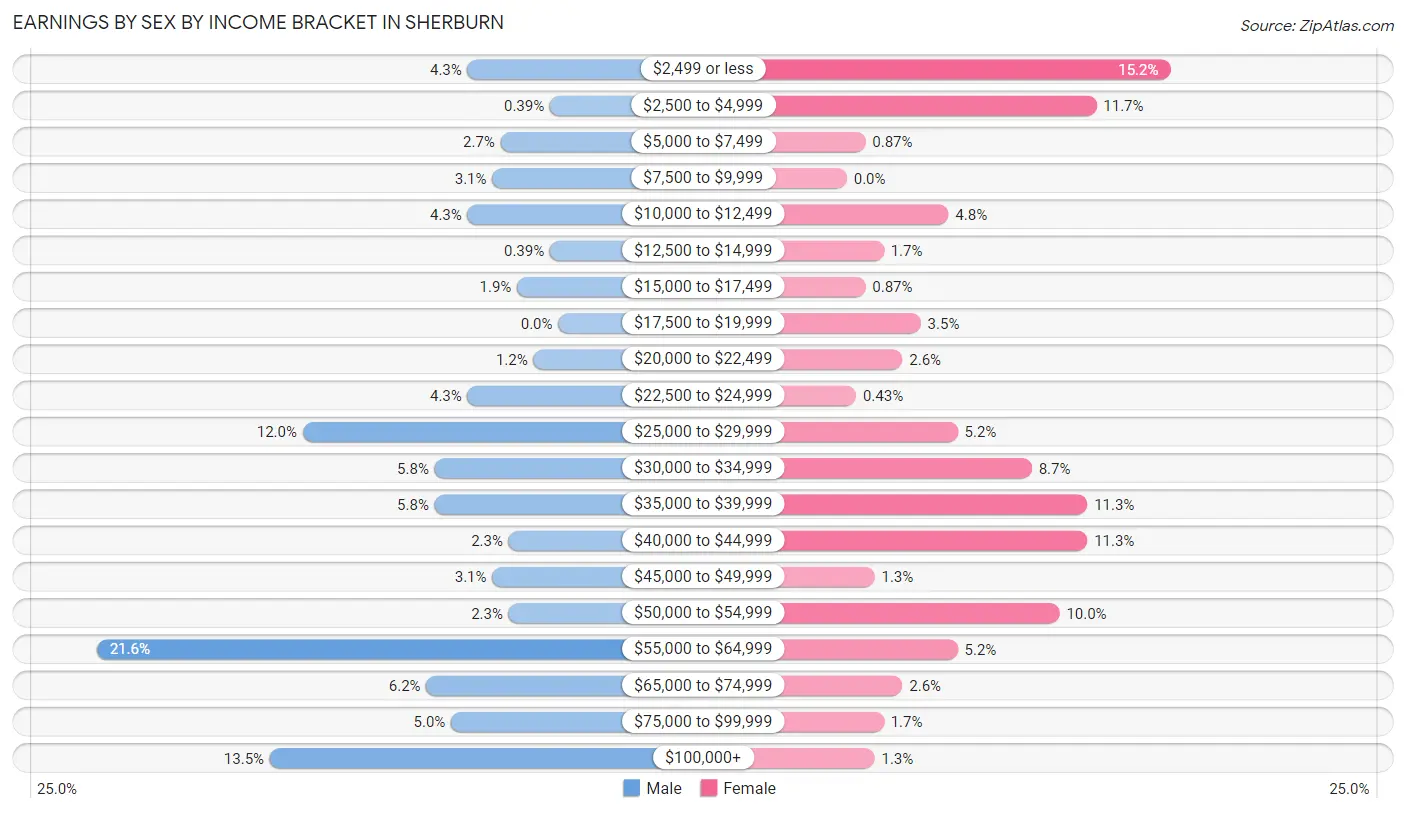
Earnings by Sex by Income Bracket in Sherburn
The most common earnings brackets in Sherburn are $55,000 to $64,999 for men (56 | 21.6%) and $2,499 or less for women (35 | 15.1%).
| Income | Male | Female |
| $2,499 or less | 11 (4.3%) | 35 (15.1%) |
| $2,500 to $4,999 | 1 (0.4%) | 27 (11.7%) |
| $5,000 to $7,499 | 7 (2.7%) | 2 (0.9%) |
| $7,500 to $9,999 | 8 (3.1%) | 0 (0.0%) |
| $10,000 to $12,499 | 11 (4.3%) | 11 (4.8%) |
| $12,500 to $14,999 | 1 (0.4%) | 4 (1.7%) |
| $15,000 to $17,499 | 5 (1.9%) | 2 (0.9%) |
| $17,500 to $19,999 | 0 (0.0%) | 8 (3.5%) |
| $20,000 to $22,499 | 3 (1.2%) | 6 (2.6%) |
| $22,500 to $24,999 | 11 (4.3%) | 1 (0.4%) |
| $25,000 to $29,999 | 31 (12.0%) | 12 (5.2%) |
| $30,000 to $34,999 | 15 (5.8%) | 20 (8.7%) |
| $35,000 to $39,999 | 15 (5.8%) | 26 (11.3%) |
| $40,000 to $44,999 | 6 (2.3%) | 26 (11.3%) |
| $45,000 to $49,999 | 8 (3.1%) | 3 (1.3%) |
| $50,000 to $54,999 | 6 (2.3%) | 23 (10.0%) |
| $55,000 to $64,999 | 56 (21.6%) | 12 (5.2%) |
| $65,000 to $74,999 | 16 (6.2%) | 6 (2.6%) |
| $75,000 to $99,999 | 13 (5.0%) | 4 (1.7%) |
| $100,000+ | 35 (13.5%) | 3 (1.3%) |
| Total | 259 (100.0%) | 231 (100.0%) |
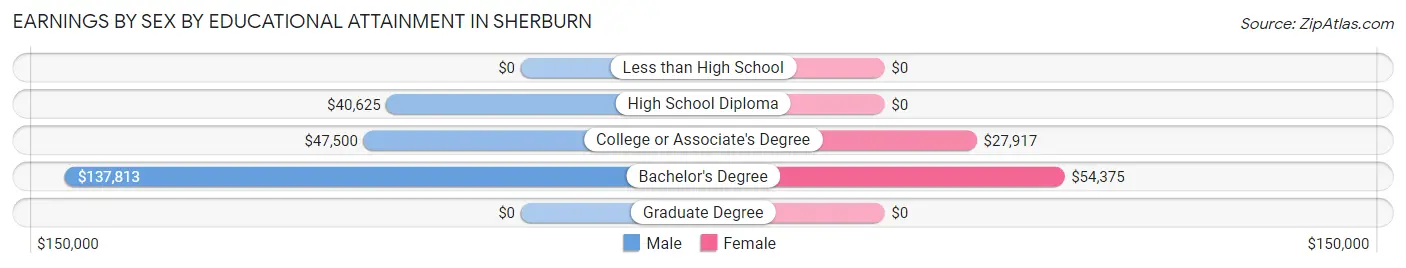
Earnings by Sex by Educational Attainment in Sherburn
Average earnings in Sherburn are $48,750 for men and $32,500 for women, a difference of 33.3%. Men with an educational attainment of bachelor's degree enjoy the highest average annual earnings of $137,813, while those with high school diploma education earn the least with $40,625. Women with an educational attainment of bachelor's degree earn the most with the average annual earnings of $54,375, while those with college or associate's degree education have the smallest earnings of $27,917.
| Educational Attainment | Male Income | Female Income |
| Less than High School | - | - |
| High School Diploma | $40,625 | $0 |
| College or Associate's Degree | $47,500 | $27,917 |
| Bachelor's Degree | $137,813 | $54,375 |
| Graduate Degree | - | - |
| Total | $48,750 | $32,500 |
Family Income in Sherburn
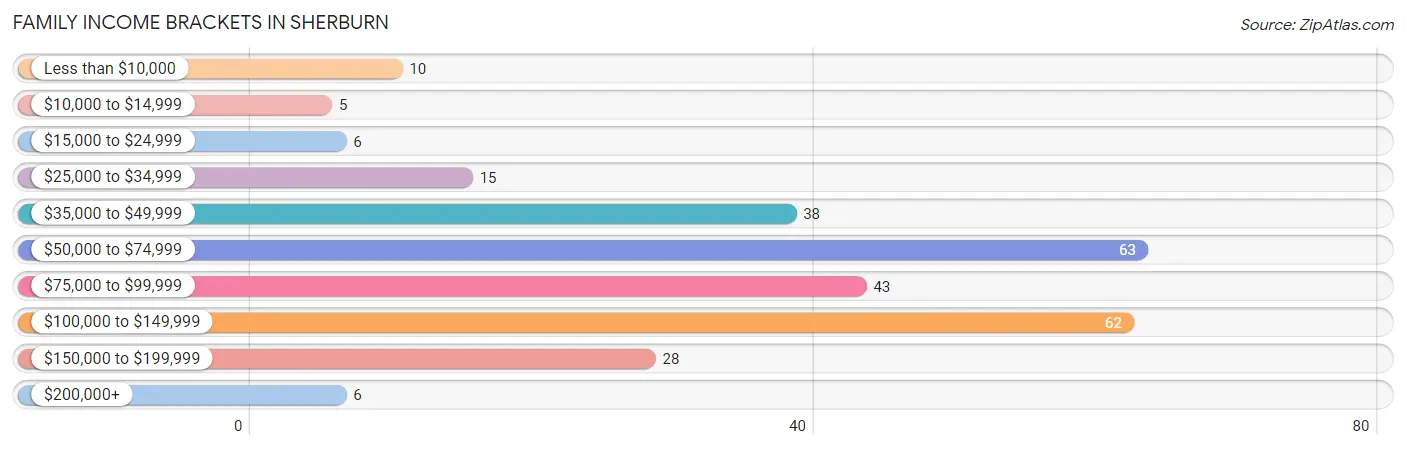
Family Income Brackets in Sherburn
According to the Sherburn family income data, there are 63 families falling into the $50,000 to $74,999 income range, which is the most common income bracket and makes up 22.8% of all families. Conversely, the $10,000 to $14,999 income bracket is the least frequent group with only 5 families (1.8%) belonging to this category.
| Income Bracket | # Families | % Families |
| Less than $10,000 | 10 | 3.6% |
| $10,000 to $14,999 | 5 | 1.8% |
| $15,000 to $24,999 | 6 | 2.2% |
| $25,000 to $34,999 | 15 | 5.4% |
| $35,000 to $49,999 | 38 | 13.8% |
| $50,000 to $74,999 | 63 | 22.8% |
| $75,000 to $99,999 | 43 | 15.6% |
| $100,000 to $149,999 | 62 | 22.5% |
| $150,000 to $199,999 | 28 | 10.1% |
| $200,000+ | 6 | 2.2% |
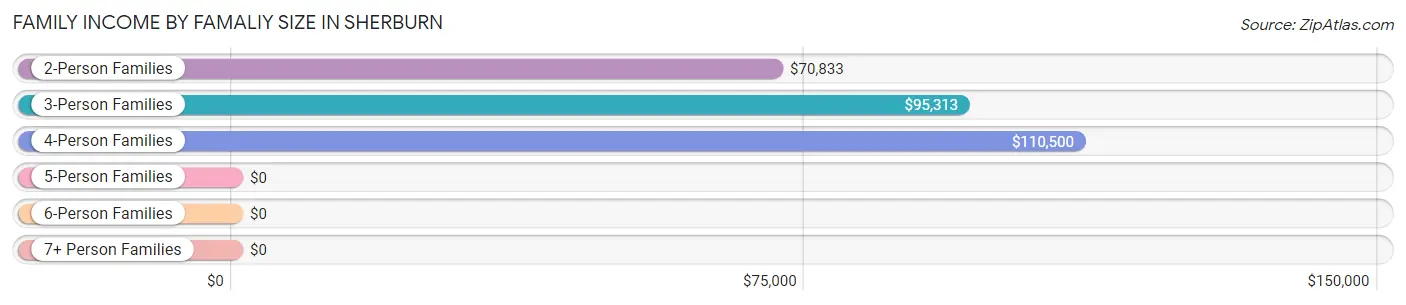
Family Income by Famaliy Size in Sherburn
4-person families (48 | 17.4%) account for the highest median family income in Sherburn with $110,500 per family, while 2-person families (158 | 57.3%) have the highest median income of $35,416 per family member.
| Income Bracket | # Families | Median Income |
| 2-Person Families | 158 (57.3%) | $70,833 |
| 3-Person Families | 46 (16.7%) | $95,313 |
| 4-Person Families | 48 (17.4%) | $110,500 |
| 5-Person Families | 16 (5.8%) | $0 |
| 6-Person Families | 8 (2.9%) | $0 |
| 7+ Person Families | 0 (0.0%) | $0 |
| Total | 276 (100.0%) | $75,833 |
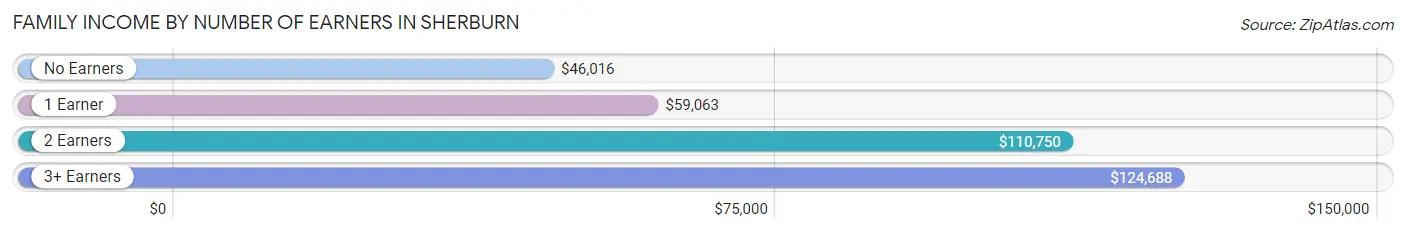
Family Income by Number of Earners in Sherburn
The median family income in Sherburn is $75,833, with families comprising 3+ earners (23) having the highest median family income of $124,688, while families with no earners (63) have the lowest median family income of $46,016, accounting for 8.3% and 22.8% of families, respectively.
| Number of Earners | # Families | Median Income |
| No Earners | 63 (22.8%) | $46,016 |
| 1 Earner | 66 (23.9%) | $59,063 |
| 2 Earners | 124 (44.9%) | $110,750 |
| 3+ Earners | 23 (8.3%) | $124,688 |
| Total | 276 (100.0%) | $75,833 |
Household Income in Sherburn
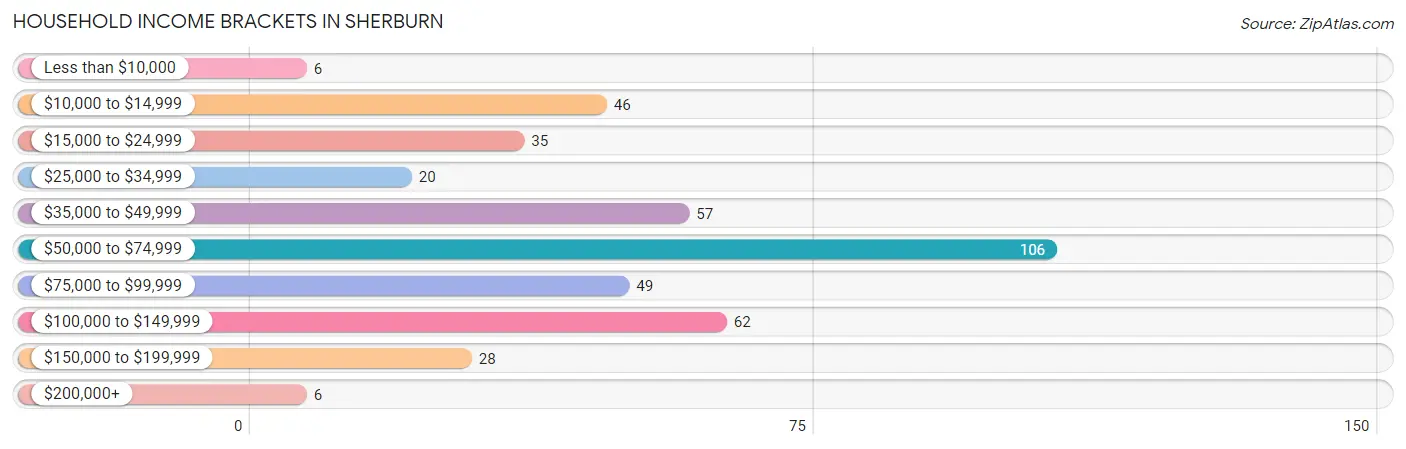
Household Income Brackets in Sherburn
With 106 households falling in the category, the $50,000 to $74,999 income range is the most frequent in Sherburn, accounting for 25.5% of all households. In contrast, only 6 households (1.5%) fall into the less than $10,000 income bracket, making it the least populous group.
| Income Bracket | # Households | % Households |
| Less than $10,000 | 6 | 1.4% |
| $10,000 to $14,999 | 46 | 11.1% |
| $15,000 to $24,999 | 35 | 8.4% |
| $25,000 to $34,999 | 20 | 4.8% |
| $35,000 to $49,999 | 57 | 13.7% |
| $50,000 to $74,999 | 106 | 25.5% |
| $75,000 to $99,999 | 49 | 11.8% |
| $100,000 to $149,999 | 62 | 14.9% |
| $150,000 to $199,999 | 28 | 6.7% |
| $200,000+ | 6 | 1.4% |
Household Income by Householder Age in Sherburn
The median household income in Sherburn is $59,844, with the highest median household income of $73,750 found in the 25 to 44 years age bracket for the primary householder. A total of 108 households (26.0%) fall into this category. Meanwhile, the 15 to 24 years age bracket for the primary householder has the lowest median household income of $0, with 8 households (1.9%) in this group.
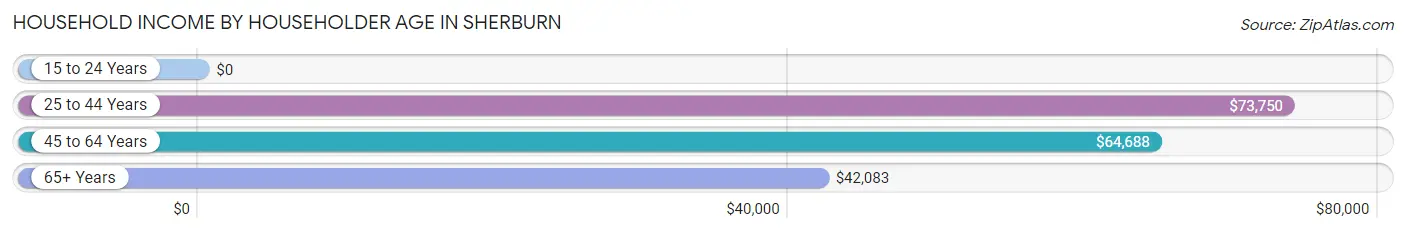
| Income Bracket | # Households | Median Income |
| 15 to 24 Years | 8 (1.9%) | $0 |
| 25 to 44 Years | 108 (26.0%) | $73,750 |
| 45 to 64 Years | 107 (25.8%) | $64,688 |
| 65+ Years | 192 (46.3%) | $42,083 |
| Total | 415 (100.0%) | $59,844 |
Poverty in Sherburn
Income Below Poverty by Sex and Age in Sherburn
With 11.6% poverty level for males and 21.2% for females among the residents of Sherburn, 16 and 17 year old males and 6 to 11 year old females are the most vulnerable to poverty, with 11 males (64.7%) and 40 females (71.4%) in their respective age groups living below the poverty level.
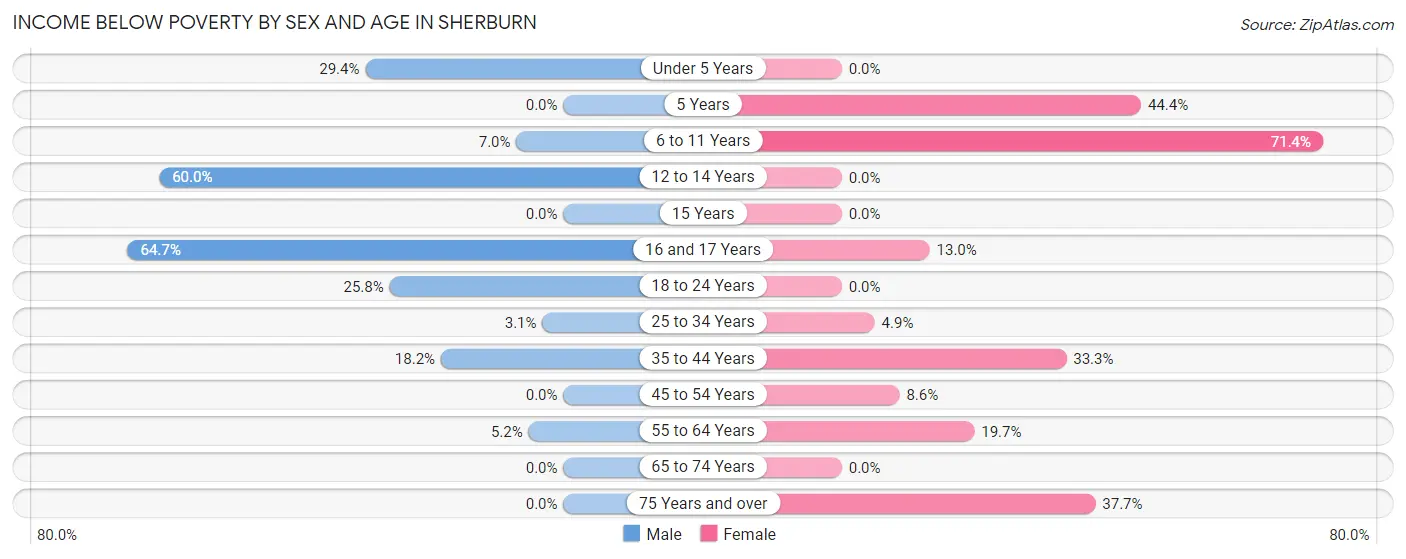
| Age Bracket | Male | Female |
| Under 5 Years | 10 (29.4%) | 0 (0.0%) |
| 5 Years | 0 (0.0%) | 4 (44.4%) |
| 6 to 11 Years | 3 (7.0%) | 40 (71.4%) |
| 12 to 14 Years | 6 (60.0%) | 0 (0.0%) |
| 15 Years | 0 (0.0%) | 0 (0.0%) |
| 16 and 17 Years | 11 (64.7%) | 3 (13.0%) |
| 18 to 24 Years | 8 (25.8%) | 0 (0.0%) |
| 25 to 34 Years | 1 (3.1%) | 2 (4.9%) |
| 35 to 44 Years | 14 (18.2%) | 15 (33.3%) |
| 45 to 54 Years | 0 (0.0%) | 3 (8.6%) |
| 55 to 64 Years | 3 (5.2%) | 12 (19.7%) |
| 65 to 74 Years | 0 (0.0%) | 0 (0.0%) |
| 75 Years and over | 0 (0.0%) | 32 (37.7%) |
| Total | 56 (11.6%) | 111 (21.2%) |
Income Above Poverty by Sex and Age in Sherburn
According to the poverty statistics in Sherburn, males aged 5 years and females aged under 5 years are the age groups that are most secure financially, with 100.0% of males and 100.0% of females in these age groups living above the poverty line.
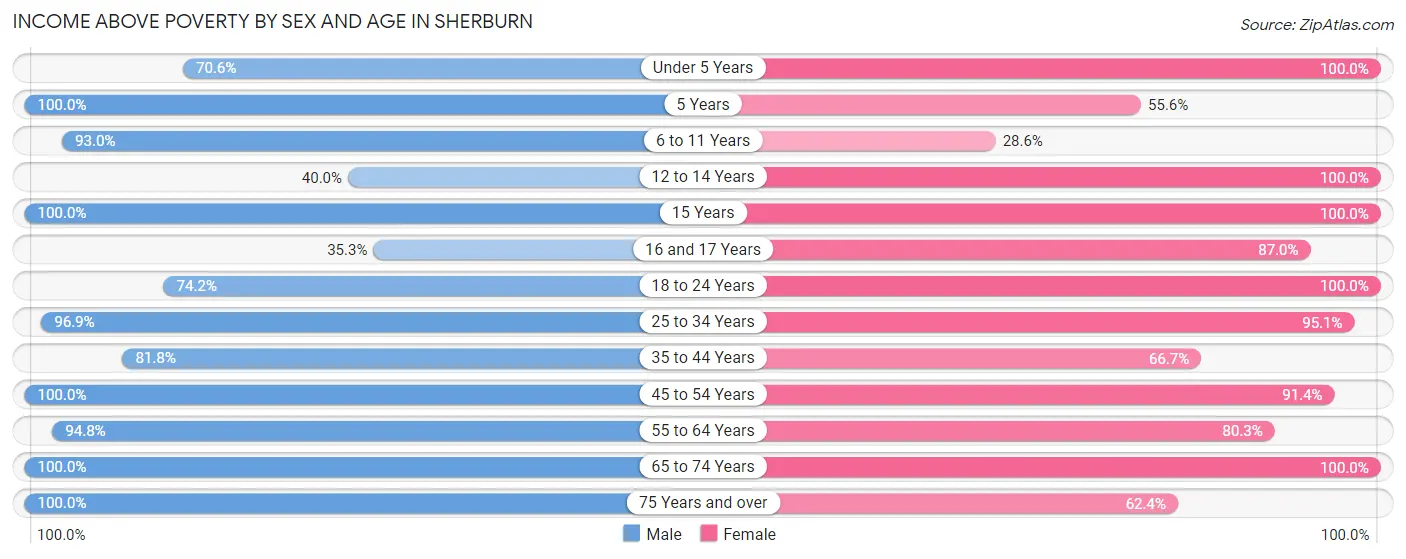
| Age Bracket | Male | Female |
| Under 5 Years | 24 (70.6%) | 31 (100.0%) |
| 5 Years | 2 (100.0%) | 5 (55.6%) |
| 6 to 11 Years | 40 (93.0%) | 16 (28.6%) |
| 12 to 14 Years | 4 (40.0%) | 14 (100.0%) |
| 15 Years | 14 (100.0%) | 5 (100.0%) |
| 16 and 17 Years | 6 (35.3%) | 20 (87.0%) |
| 18 to 24 Years | 23 (74.2%) | 40 (100.0%) |
| 25 to 34 Years | 31 (96.9%) | 39 (95.1%) |
| 35 to 44 Years | 63 (81.8%) | 30 (66.7%) |
| 45 to 54 Years | 48 (100.0%) | 32 (91.4%) |
| 55 to 64 Years | 55 (94.8%) | 49 (80.3%) |
| 65 to 74 Years | 86 (100.0%) | 78 (100.0%) |
| 75 Years and over | 30 (100.0%) | 53 (62.4%) |
| Total | 426 (88.4%) | 412 (78.8%) |
Income Below Poverty Among Married-Couple Families in Sherburn
The poverty statistics for married-couple families in Sherburn show that 0.8% or 2 of the total 237 families live below the poverty line. Families with no children have the highest poverty rate of 1.3%, comprising of 2 families. On the other hand, families with 1 or 2 children have the lowest poverty rate of 0.0%, which includes 0 families.
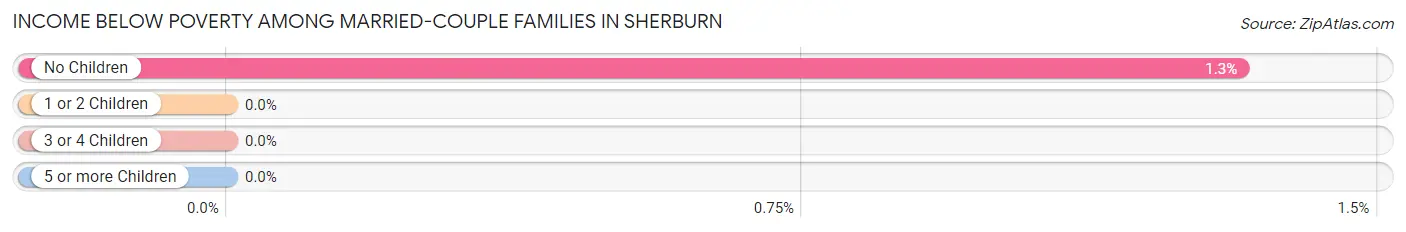
| Children | Above Poverty | Below Poverty |
| No Children | 150 (98.7%) | 2 (1.3%) |
| 1 or 2 Children | 68 (100.0%) | 0 (0.0%) |
| 3 or 4 Children | 17 (100.0%) | 0 (0.0%) |
| 5 or more Children | 0 (0.0%) | 0 (0.0%) |
| Total | 235 (99.2%) | 2 (0.8%) |
Income Below Poverty Among Single-Parent Households in Sherburn
According to the poverty data in Sherburn, 21.4% or 3 single-father households and 68.0% or 17 single-mother households are living below the poverty line. Among single-father households, those with 3 or 4 children have the highest poverty rate, with 3 households (60.0%) experiencing poverty. Likewise, among single-mother households, those with 3 or 4 children have the highest poverty rate, with 7 households (100.0%) falling below the poverty line.
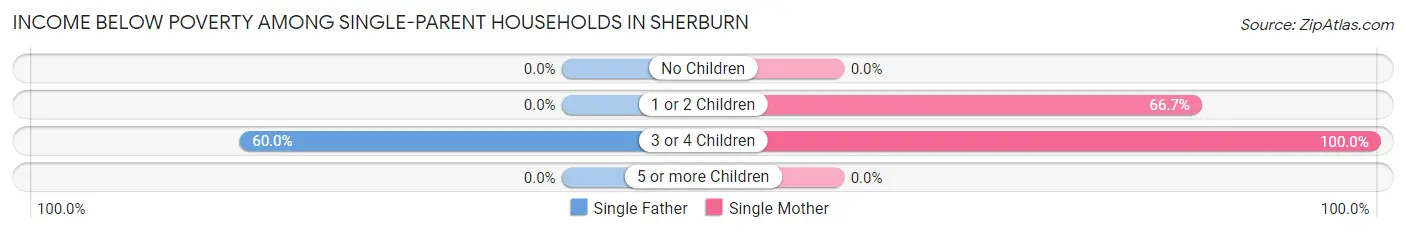
| Children | Single Father | Single Mother |
| No Children | 0 (0.0%) | 0 (0.0%) |
| 1 or 2 Children | 0 (0.0%) | 10 (66.7%) |
| 3 or 4 Children | 3 (60.0%) | 7 (100.0%) |
| 5 or more Children | 0 (0.0%) | 0 (0.0%) |
| Total | 3 (21.4%) | 17 (68.0%) |
Income Below Poverty Among Married-Couple vs Single-Parent Households in Sherburn
The poverty data for Sherburn shows that 2 of the married-couple family households (0.8%) and 20 of the single-parent households (51.3%) are living below the poverty level. Within the married-couple family households, those with no children have the highest poverty rate, with 2 households (1.3%) falling below the poverty line. Among the single-parent households, those with 3 or 4 children have the highest poverty rate, with 10 household (83.3%) living below poverty.
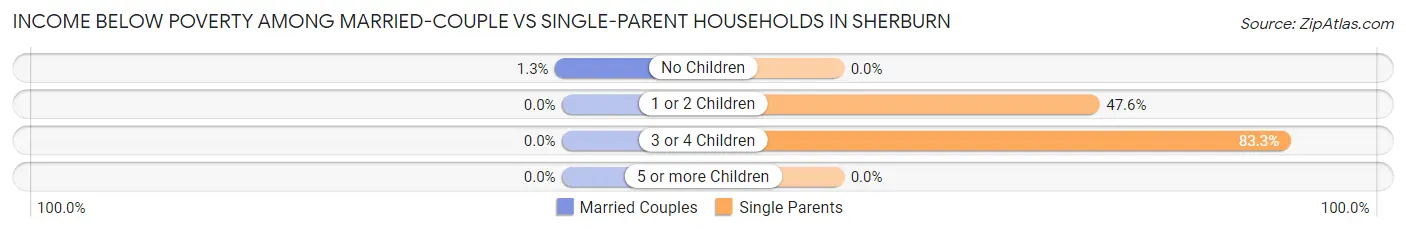
| Children | Married-Couple Families | Single-Parent Households |
| No Children | 2 (1.3%) | 0 (0.0%) |
| 1 or 2 Children | 0 (0.0%) | 10 (47.6%) |
| 3 or 4 Children | 0 (0.0%) | 10 (83.3%) |
| 5 or more Children | 0 (0.0%) | 0 (0.0%) |
| Total | 2 (0.8%) | 20 (51.3%) |
Race in Sherburn
The most populous races in Sherburn are White / Caucasian (992 | 95.9%), Two or more Races (31 | 3.0%), and Asian (8 | 0.8%).
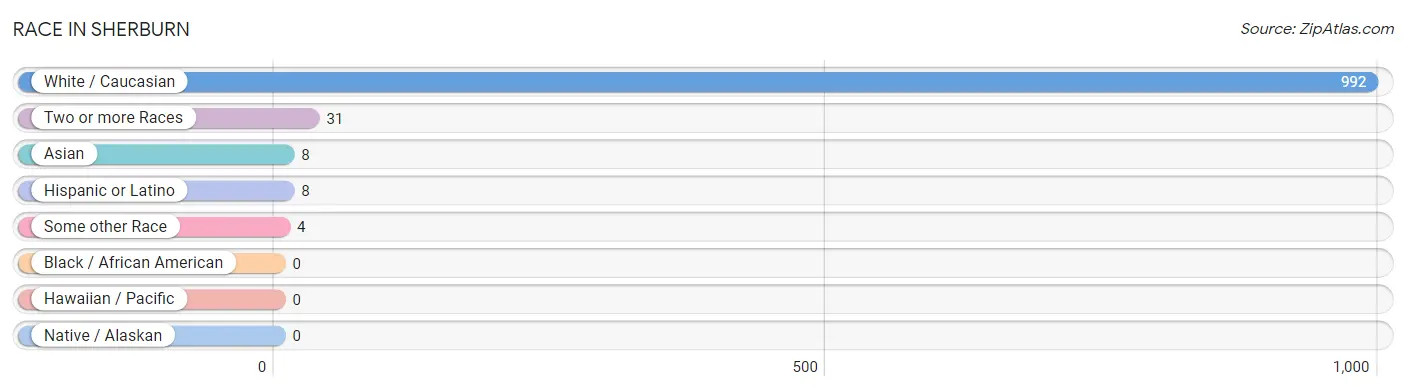
| Race | # Population | % Population |
| Asian | 8 | 0.8% |
| Black / African American | 0 | 0.0% |
| Hawaiian / Pacific | 0 | 0.0% |
| Hispanic or Latino | 8 | 0.8% |
| Native / Alaskan | 0 | 0.0% |
| White / Caucasian | 992 | 95.9% |
| Two or more Races | 31 | 3.0% |
| Some other Race | 4 | 0.4% |
| Total | 1,035 | 100.0% |
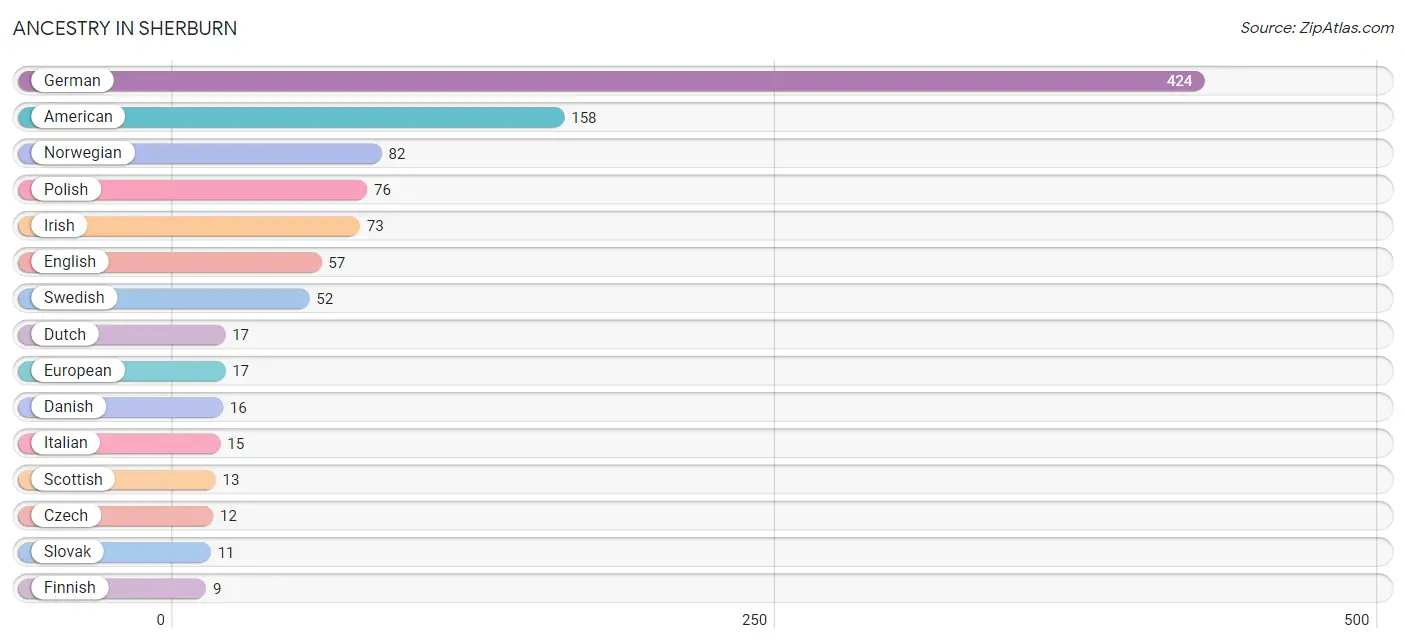
Ancestry in Sherburn
The most populous ancestries reported in Sherburn are German (424 | 41.0%), American (158 | 15.3%), Norwegian (82 | 7.9%), Polish (76 | 7.3%), and Irish (73 | 7.0%), together accounting for 78.6% of all Sherburn residents.
| Ancestry | # Population | % Population |
| African | 6 | 0.6% |
| American | 158 | 15.3% |
| Cuban | 3 | 0.3% |
| Czech | 12 | 1.2% |
| Czechoslovakian | 1 | 0.1% |
| Danish | 16 | 1.5% |
| Dutch | 17 | 1.6% |
| English | 57 | 5.5% |
| European | 17 | 1.6% |
| Finnish | 9 | 0.9% |
| French | 8 | 0.8% |
| German | 424 | 41.0% |
| Irish | 73 | 7.0% |
| Italian | 15 | 1.5% |
| Korean | 8 | 0.8% |
| Mexican | 2 | 0.2% |
| Norwegian | 82 | 7.9% |
| Polish | 76 | 7.3% |
| Romanian | 2 | 0.2% |
| Scandinavian | 3 | 0.3% |
| Scotch-Irish | 6 | 0.6% |
| Scottish | 13 | 1.3% |
| Slovak | 11 | 1.1% |
| Subsaharan African | 6 | 0.6% |
| Swedish | 52 | 5.0% |
| Swiss | 9 | 0.9% |
| Welsh | 4 | 0.4% | View All 27 Rows |
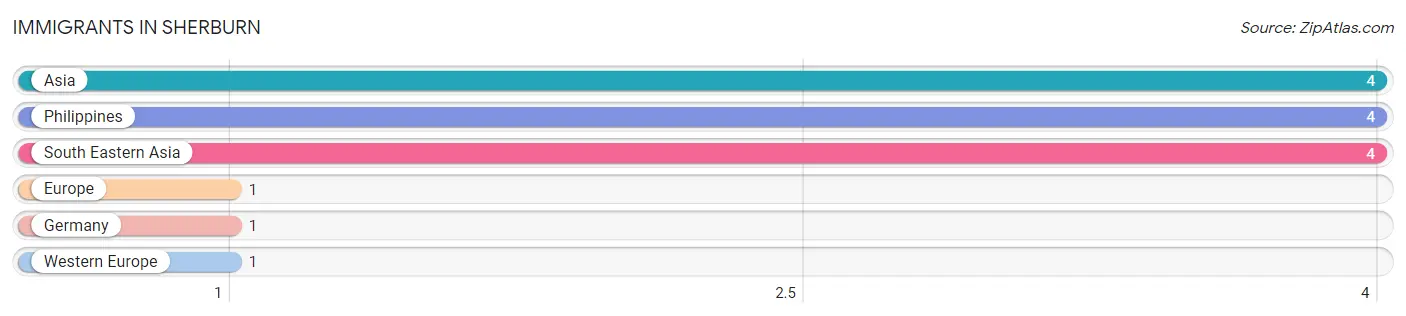
Immigrants in Sherburn
The most numerous immigrant groups reported in Sherburn came from Asia (4 | 0.4%), Philippines (4 | 0.4%), South Eastern Asia (4 | 0.4%), Europe (1 | 0.1%), and Germany (1 | 0.1%), together accounting for 1.4% of all Sherburn residents.
| Immigration Origin | # Population | % Population |
| Asia | 4 | 0.4% |
| Europe | 1 | 0.1% |
| Germany | 1 | 0.1% |
| Philippines | 4 | 0.4% |
| South Eastern Asia | 4 | 0.4% |
| Western Europe | 1 | 0.1% | View All 6 Rows |
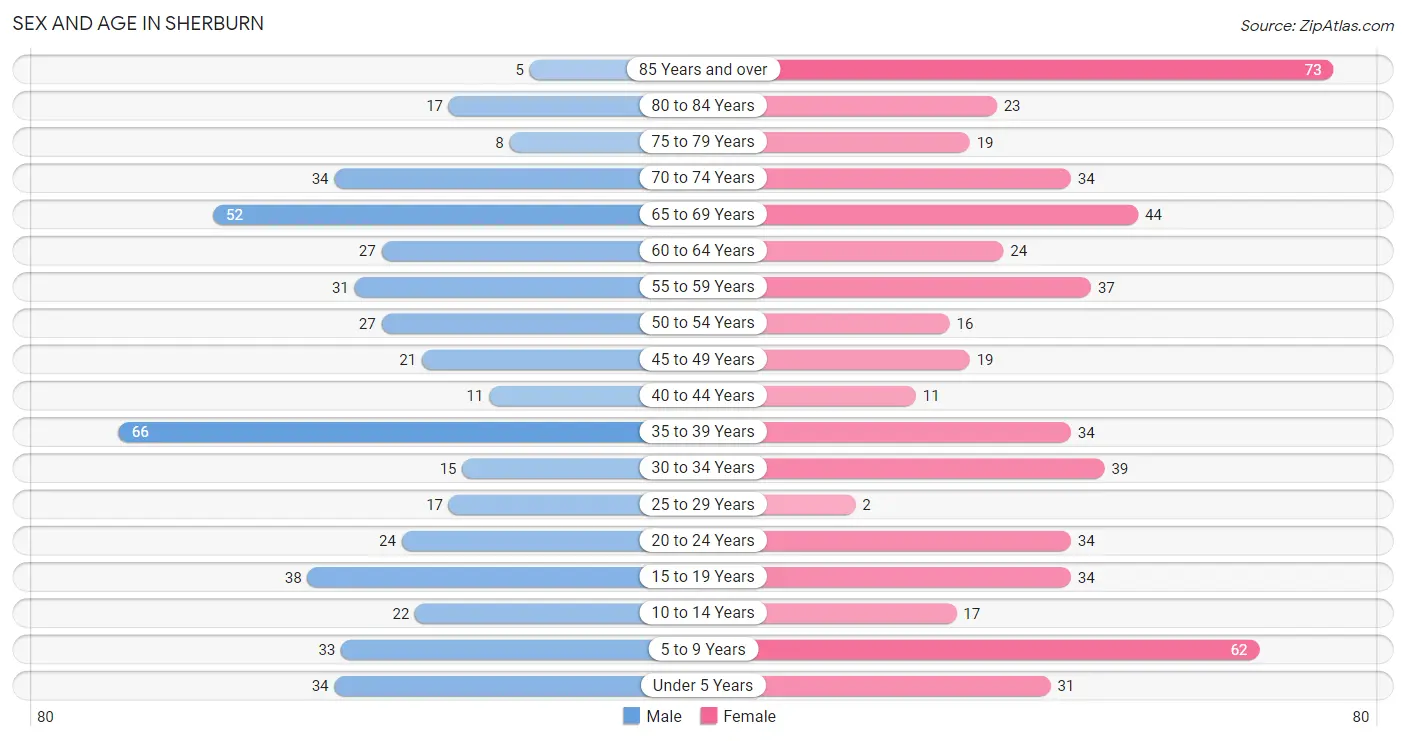
Sex and Age in Sherburn
Sex and Age in Sherburn
The most populous age groups in Sherburn are 35 to 39 Years (66 | 13.7%) for men and 85 Years and over (73 | 13.2%) for women.
| Age Bracket | Male | Female |
| Under 5 Years | 34 (7.0%) | 31 (5.6%) |
| 5 to 9 Years | 33 (6.9%) | 62 (11.2%) |
| 10 to 14 Years | 22 (4.6%) | 17 (3.1%) |
| 15 to 19 Years | 38 (7.9%) | 34 (6.1%) |
| 20 to 24 Years | 24 (5.0%) | 34 (6.1%) |
| 25 to 29 Years | 17 (3.5%) | 2 (0.4%) |
| 30 to 34 Years | 15 (3.1%) | 39 (7.0%) |
| 35 to 39 Years | 66 (13.7%) | 34 (6.1%) |
| 40 to 44 Years | 11 (2.3%) | 11 (2.0%) |
| 45 to 49 Years | 21 (4.4%) | 19 (3.4%) |
| 50 to 54 Years | 27 (5.6%) | 16 (2.9%) |
| 55 to 59 Years | 31 (6.4%) | 37 (6.7%) |
| 60 to 64 Years | 27 (5.6%) | 24 (4.3%) |
| 65 to 69 Years | 52 (10.8%) | 44 (8.0%) |
| 70 to 74 Years | 34 (7.0%) | 34 (6.1%) |
| 75 to 79 Years | 8 (1.7%) | 19 (3.4%) |
| 80 to 84 Years | 17 (3.5%) | 23 (4.2%) |
| 85 Years and over | 5 (1.0%) | 73 (13.2%) |
| Total | 482 (100.0%) | 553 (100.0%) |
Families and Households in Sherburn
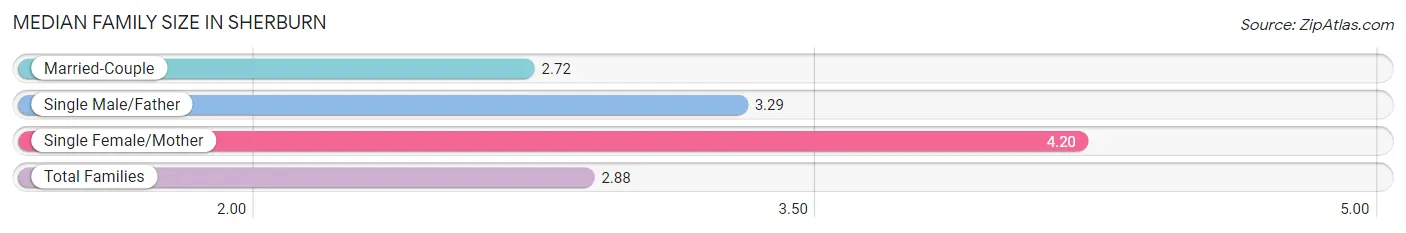
Median Family Size in Sherburn
The median family size in Sherburn is 2.88 persons per family, with single female/mother families (25 | 9.1%) accounting for the largest median family size of 4.2 persons per family. On the other hand, married-couple families (237 | 85.9%) represent the smallest median family size with 2.72 persons per family.
| Family Type | # Families | Family Size |
| Married-Couple | 237 (85.9%) | 2.72 |
| Single Male/Father | 14 (5.1%) | 3.29 |
| Single Female/Mother | 25 (9.1%) | 4.20 |
| Total Families | 276 (100.0%) | 2.88 |
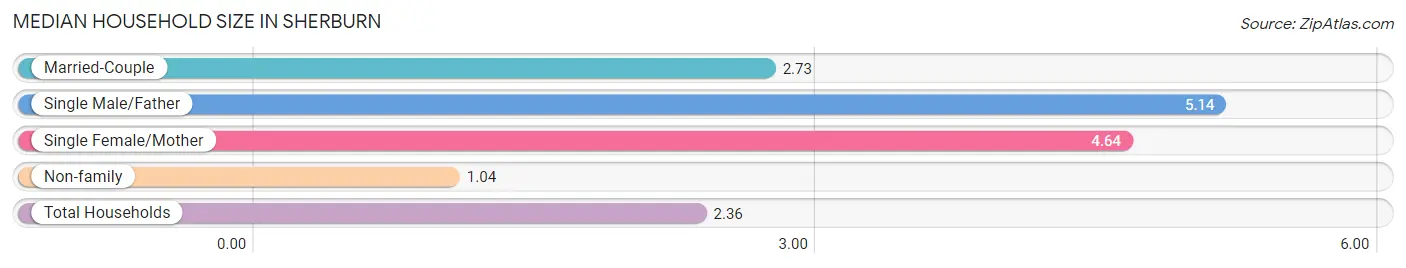
Median Household Size in Sherburn
The median household size in Sherburn is 2.36 persons per household, with single male/father households (14 | 3.4%) accounting for the largest median household size of 5.14 persons per household. non-family households (139 | 33.5%) represent the smallest median household size with 1.04 persons per household.
| Household Type | # Households | Household Size |
| Married-Couple | 237 (57.1%) | 2.73 |
| Single Male/Father | 14 (3.4%) | 5.14 |
| Single Female/Mother | 25 (6.0%) | 4.64 |
| Non-family | 139 (33.5%) | 1.04 |
| Total Households | 415 (100.0%) | 2.36 |
Household Size by Marriage Status in Sherburn
Out of a total of 415 households in Sherburn, 276 (66.5%) are family households, while 139 (33.5%) are nonfamily households. The most numerous type of family households are 2-person households, comprising 148, and the most common type of nonfamily households are 1-person households, comprising 131.
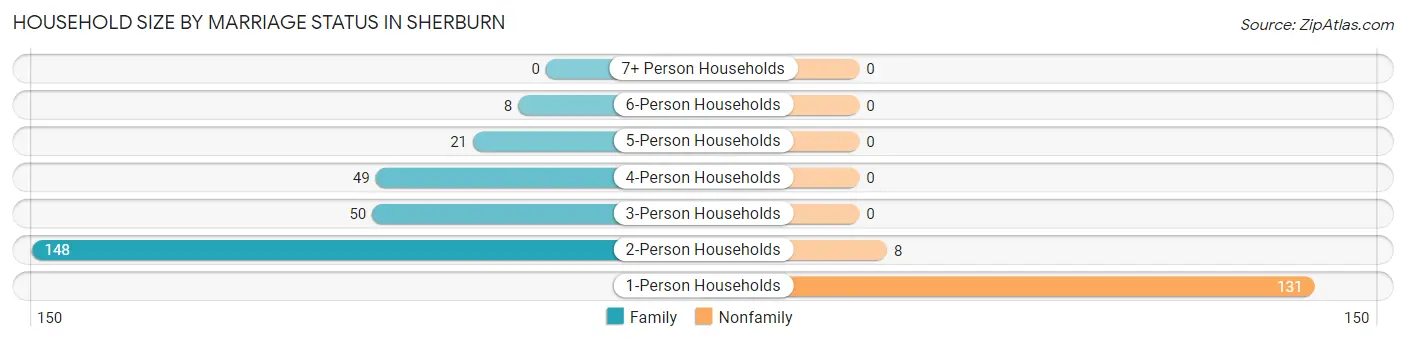
| Household Size | Family Households | Nonfamily Households |
| 1-Person Households | - | 131 (31.6%) |
| 2-Person Households | 148 (35.7%) | 8 (1.9%) |
| 3-Person Households | 50 (12.0%) | 0 (0.0%) |
| 4-Person Households | 49 (11.8%) | 0 (0.0%) |
| 5-Person Households | 21 (5.1%) | 0 (0.0%) |
| 6-Person Households | 8 (1.9%) | 0 (0.0%) |
| 7+ Person Households | 0 (0.0%) | 0 (0.0%) |
| Total | 276 (66.5%) | 139 (33.5%) |
Female Fertility in Sherburn
Fertility by Age in Sherburn
Average fertility rate in Sherburn is 61.0 births per 1,000 women. Women in the age bracket of 20 to 34 years have the highest fertility rate with 107.0 births per 1,000 women. Women in the age bracket of 20 to 34 years acount for 72.7% of all women with births.
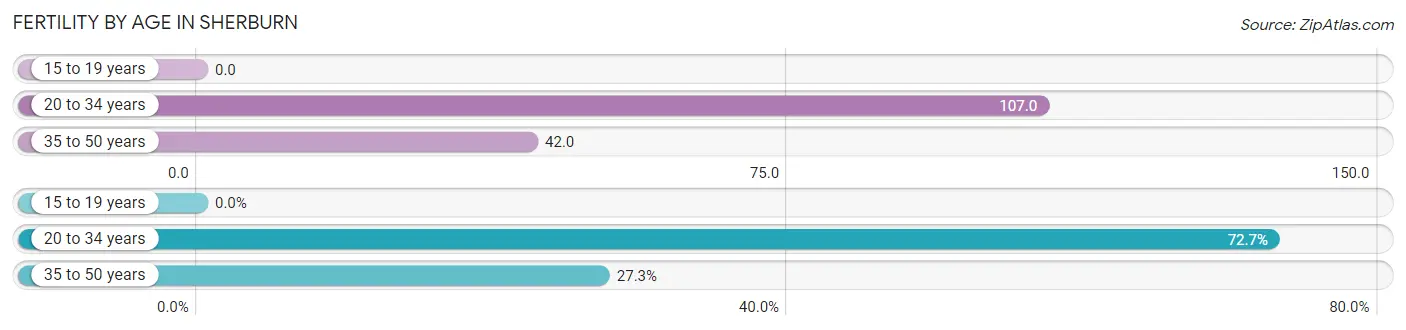
| Age Bracket | Women with Births | Births / 1,000 Women |
| 15 to 19 years | 0 (0.0%) | 0.0 |
| 20 to 34 years | 8 (72.7%) | 107.0 |
| 35 to 50 years | 3 (27.3%) | 42.0 |
| Total | 11 (100.0%) | 61.0 |
Fertility by Age by Marriage Status in Sherburn
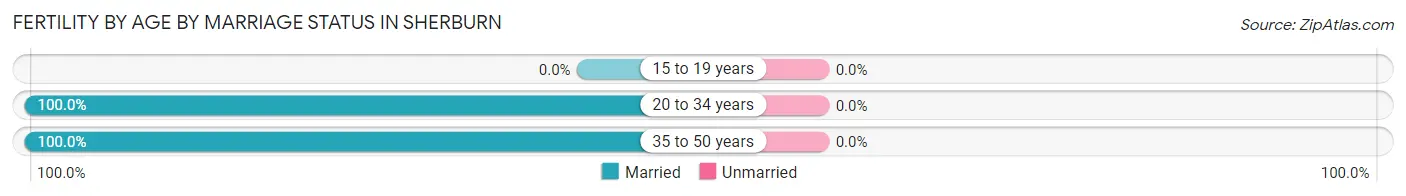
| Age Bracket | Married | Unmarried |
| 15 to 19 years | 0 (0.0%) | 0 (0.0%) |
| 20 to 34 years | 8 (100.0%) | 0 (0.0%) |
| 35 to 50 years | 3 (100.0%) | 0 (0.0%) |
| Total | 11 (100.0%) | 0 (0.0%) |
Fertility by Education in Sherburn
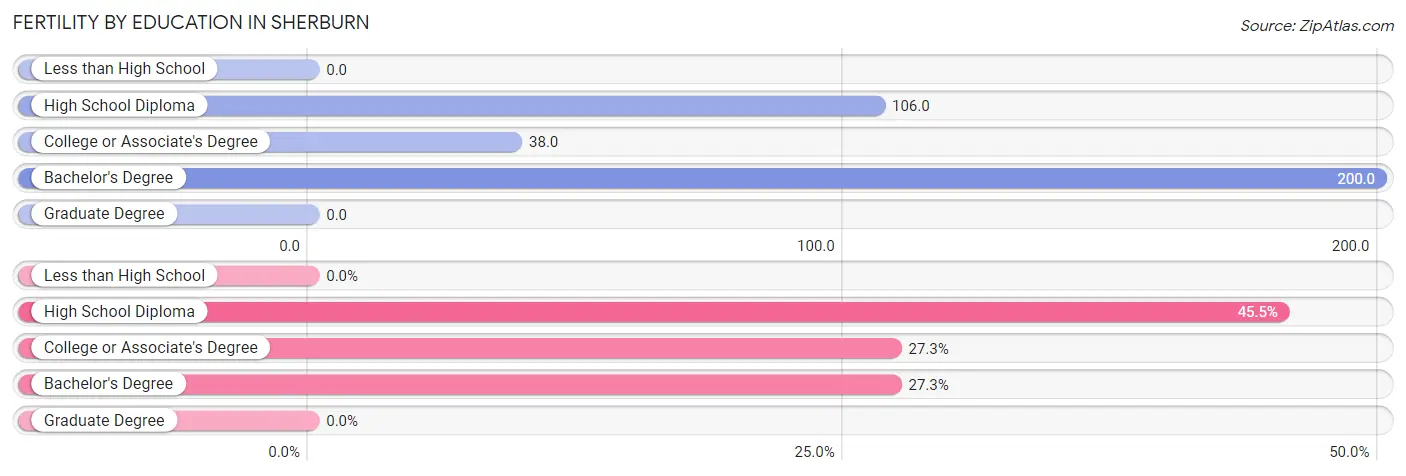
| Educational Attainment | Women with Births | Births / 1,000 Women |
| Less than High School | 0 (0.0%) | 0.0 |
| High School Diploma | 5 (45.5%) | 106.0 |
| College or Associate's Degree | 3 (27.3%) | 38.0 |
| Bachelor's Degree | 3 (27.3%) | 200.0 |
| Graduate Degree | 0 (0.0%) | 0.0 |
| Total | 11 (100.0%) | 61.0 |
Fertility by Education by Marriage Status in Sherburn
| Educational Attainment | Married | Unmarried |
| Less than High School | 0 (0.0%) | 0 (0.0%) |
| High School Diploma | 5 (100.0%) | 0 (0.0%) |
| College or Associate's Degree | 3 (100.0%) | 0 (0.0%) |
| Bachelor's Degree | 3 (100.0%) | 0 (0.0%) |
| Graduate Degree | 0 (0.0%) | 0 (0.0%) |
| Total | 11 (100.0%) | 0 (0.0%) |
Employment Characteristics in Sherburn
Employment by Class of Employer in Sherburn
Among the 456 employed individuals in Sherburn, private company employees (304 | 66.7%), self-employed (not incorporated) (60 | 13.2%), and not-for-profit organizations (50 | 11.0%) make up the most common classes of employment.
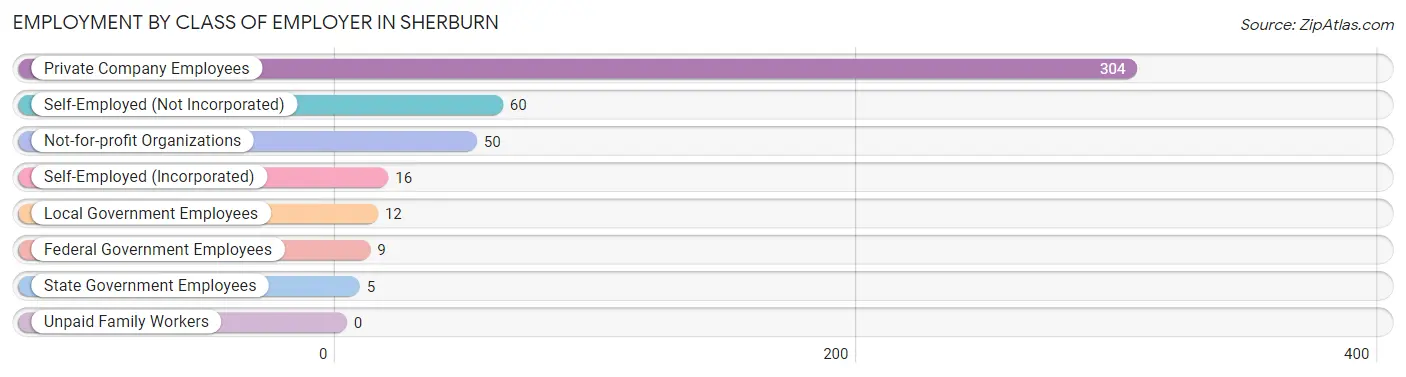
| Employer Class | # Employees | % Employees |
| Private Company Employees | 304 | 66.7% |
| Self-Employed (Incorporated) | 16 | 3.5% |
| Self-Employed (Not Incorporated) | 60 | 13.2% |
| Not-for-profit Organizations | 50 | 11.0% |
| Local Government Employees | 12 | 2.6% |
| State Government Employees | 5 | 1.1% |
| Federal Government Employees | 9 | 2.0% |
| Unpaid Family Workers | 0 | 0.0% |
| Total | 456 | 100.0% |
Employment Status by Age in Sherburn
According to the labor force statistics for Sherburn, out of the total population over 16 years of age (817), 61.1% or 499 individuals are in the labor force, with 7.0% or 35 of them unemployed. The age group with the highest labor force participation rate is 20 to 24 years, with 100.0% or 58 individuals in the labor force. Within the labor force, the 16 to 19 years age range has the highest percentage of unemployed individuals, with 26.5% or 13 of them being unemployed.
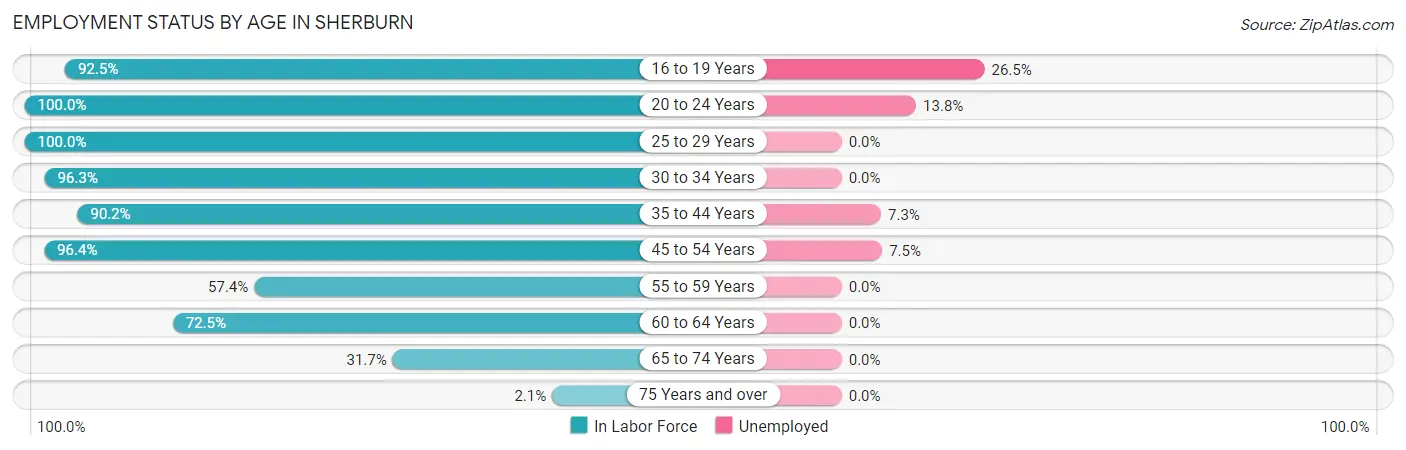
| Age Bracket | In Labor Force | Unemployed |
| 16 to 19 Years | 49 (92.5%) | 13 (26.5%) |
| 20 to 24 Years | 58 (100.0%) | 8 (13.8%) |
| 25 to 29 Years | 19 (100.0%) | 0 (0.0%) |
| 30 to 34 Years | 52 (96.3%) | 0 (0.0%) |
| 35 to 44 Years | 110 (90.2%) | 8 (7.3%) |
| 45 to 54 Years | 80 (96.4%) | 6 (7.5%) |
| 55 to 59 Years | 39 (57.4%) | 0 (0.0%) |
| 60 to 64 Years | 37 (72.5%) | 0 (0.0%) |
| 65 to 74 Years | 52 (31.7%) | 0 (0.0%) |
| 75 Years and over | 3 (2.1%) | 0 (0.0%) |
| Total | 499 (61.1%) | 35 (7.0%) |
Employment Status by Educational Attainment in Sherburn
According to labor force statistics for Sherburn, 84.9% of individuals (337) out of the total population between 25 and 64 years of age (397) are in the labor force, with 4.2% or 14 of them being unemployed. The group with the highest labor force participation rate are those with the educational attainment of college / associate degree, with 88.0% or 176 individuals in the labor force. Within the labor force, individuals with high school diploma education have the highest percentage of unemployment, with 8.2% or 8 of them being unemployed.
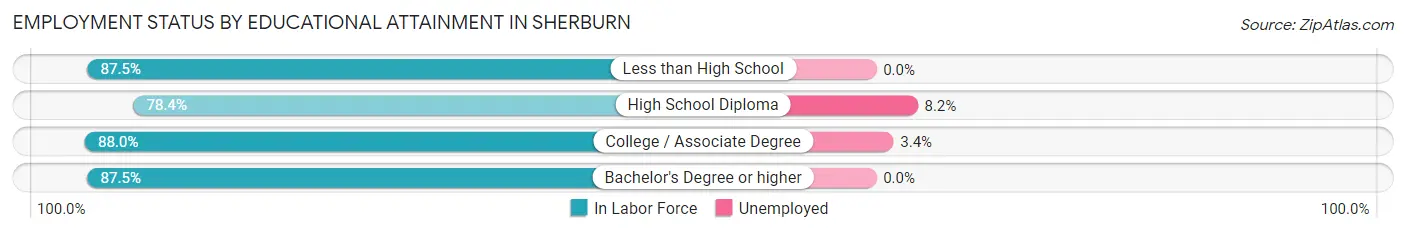
| Educational Attainment | In Labor Force | Unemployed |
| Less than High School | 14 (87.5%) | 0 (0.0%) |
| High School Diploma | 98 (78.4%) | 10 (8.2%) |
| College / Associate Degree | 176 (88.0%) | 7 (3.4%) |
| Bachelor's Degree or higher | 49 (87.5%) | 0 (0.0%) |
| Total | 337 (84.9%) | 17 (4.2%) |
Employment Occupations by Sex in Sherburn
Management, Business, Science and Arts Occupations
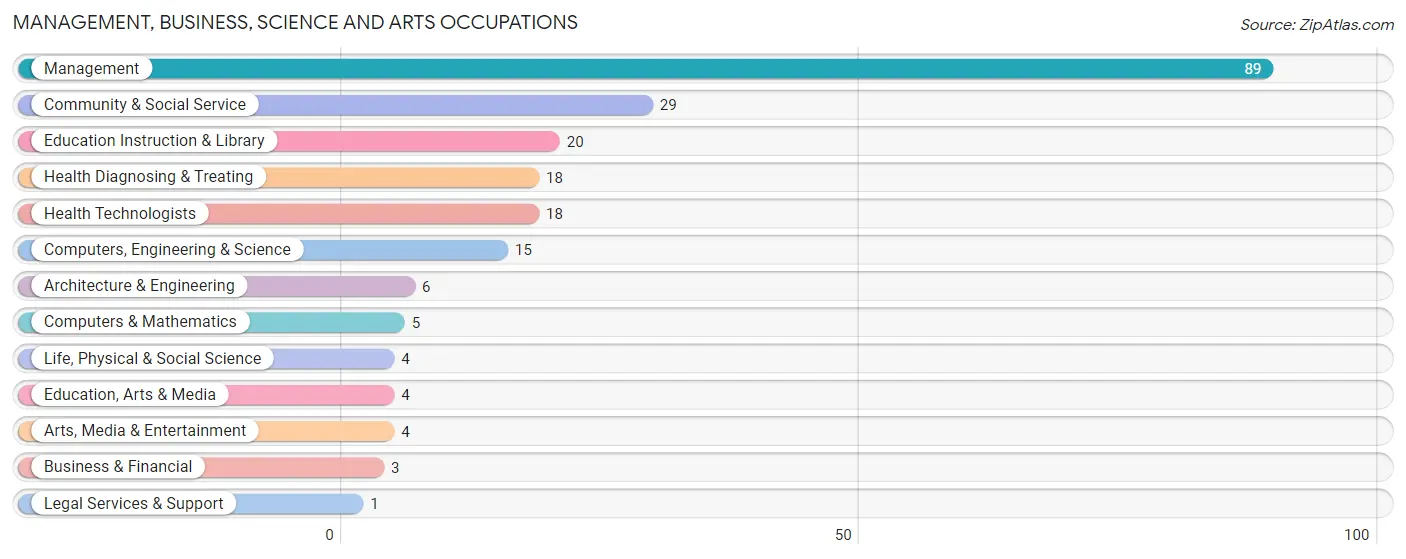
The most common Management, Business, Science and Arts occupations in Sherburn are Management (89 | 19.2%), Community & Social Service (29 | 6.2%), Education Instruction & Library (20 | 4.3%), Health Diagnosing & Treating (18 | 3.9%), and Health Technologists (18 | 3.9%).
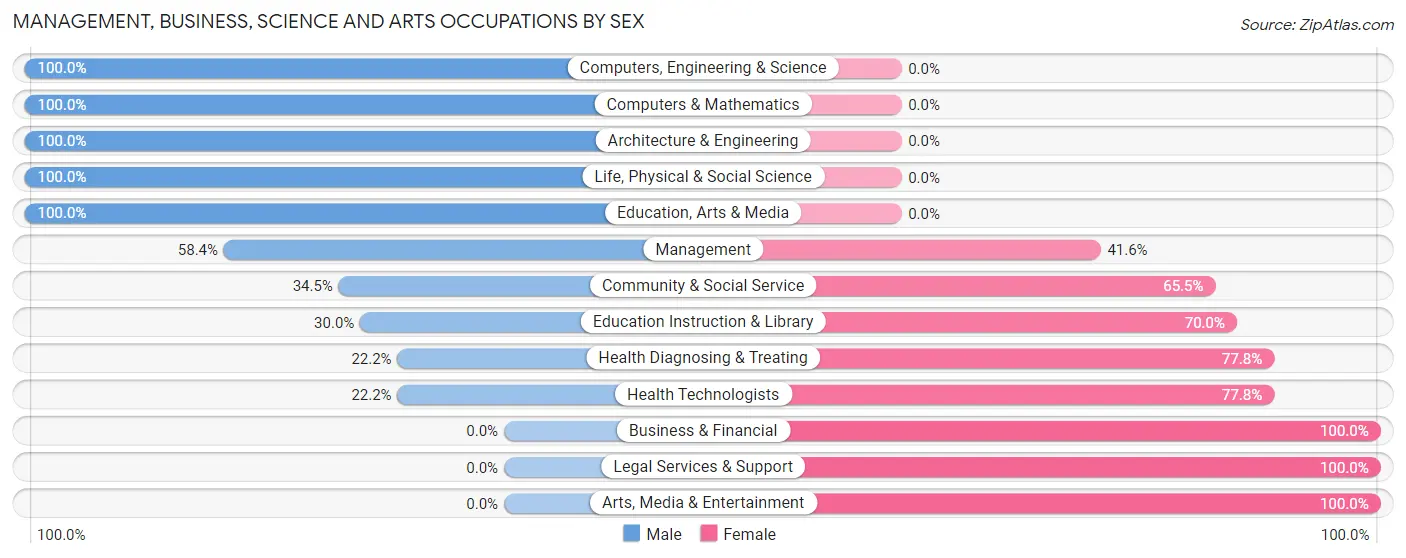
Management, Business, Science and Arts Occupations by Sex
Within the Management, Business, Science and Arts occupations in Sherburn, the most male-oriented occupations are Computers, Engineering & Science (100.0%), Computers & Mathematics (100.0%), and Architecture & Engineering (100.0%), while the most female-oriented occupations are Business & Financial (100.0%), Legal Services & Support (100.0%), and Arts, Media & Entertainment (100.0%).
| Occupation | Male | Female |
| Management | 52 (58.4%) | 37 (41.6%) |
| Business & Financial | 0 (0.0%) | 3 (100.0%) |
| Computers, Engineering & Science | 15 (100.0%) | 0 (0.0%) |
| Computers & Mathematics | 5 (100.0%) | 0 (0.0%) |
| Architecture & Engineering | 6 (100.0%) | 0 (0.0%) |
| Life, Physical & Social Science | 4 (100.0%) | 0 (0.0%) |
| Community & Social Service | 10 (34.5%) | 19 (65.5%) |
| Education, Arts & Media | 4 (100.0%) | 0 (0.0%) |
| Legal Services & Support | 0 (0.0%) | 1 (100.0%) |
| Education Instruction & Library | 6 (30.0%) | 14 (70.0%) |
| Arts, Media & Entertainment | 0 (0.0%) | 4 (100.0%) |
| Health Diagnosing & Treating | 4 (22.2%) | 14 (77.8%) |
| Health Technologists | 4 (22.2%) | 14 (77.8%) |
| Total (Category) | 81 (52.6%) | 73 (47.4%) |
| Total (Overall) | 243 (52.4%) | 221 (47.6%) |
Services Occupations
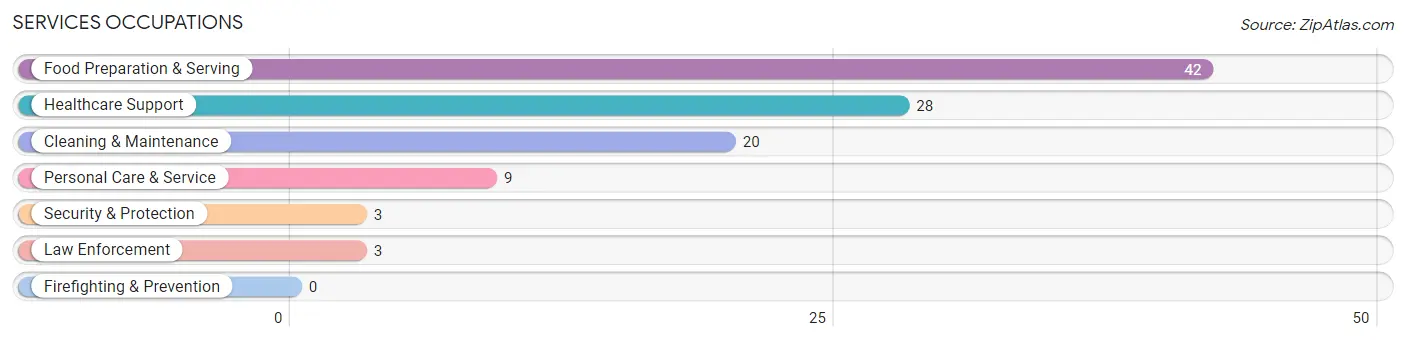
The most common Services occupations in Sherburn are Food Preparation & Serving (42 | 9.0%), Healthcare Support (28 | 6.0%), Cleaning & Maintenance (20 | 4.3%), Personal Care & Service (9 | 1.9%), and Security & Protection (3 | 0.6%).
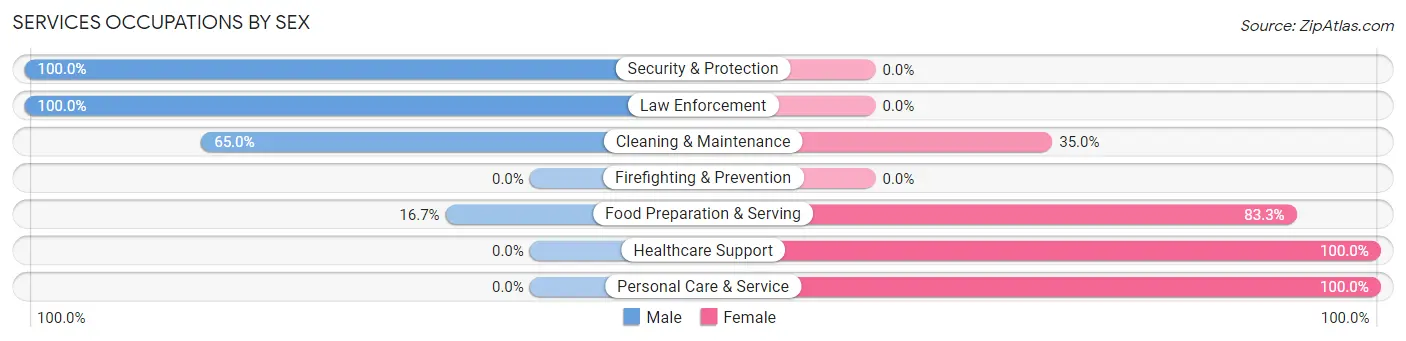
Services Occupations by Sex
Within the Services occupations in Sherburn, the most male-oriented occupations are Security & Protection (100.0%), Law Enforcement (100.0%), and Cleaning & Maintenance (65.0%), while the most female-oriented occupations are Healthcare Support (100.0%), Personal Care & Service (100.0%), and Food Preparation & Serving (83.3%).
| Occupation | Male | Female |
| Healthcare Support | 0 (0.0%) | 28 (100.0%) |
| Security & Protection | 3 (100.0%) | 0 (0.0%) |
| Firefighting & Prevention | 0 (0.0%) | 0 (0.0%) |
| Law Enforcement | 3 (100.0%) | 0 (0.0%) |
| Food Preparation & Serving | 7 (16.7%) | 35 (83.3%) |
| Cleaning & Maintenance | 13 (65.0%) | 7 (35.0%) |
| Personal Care & Service | 0 (0.0%) | 9 (100.0%) |
| Total (Category) | 23 (22.6%) | 79 (77.4%) |
| Total (Overall) | 243 (52.4%) | 221 (47.6%) |
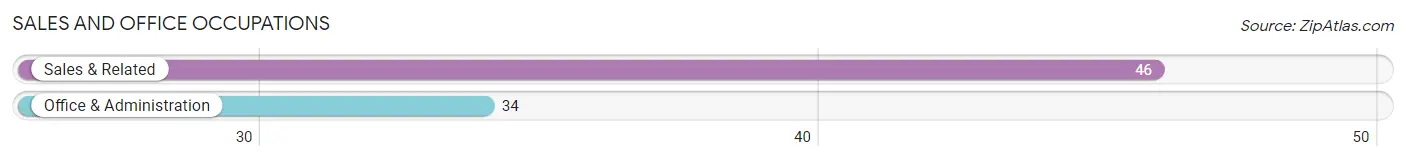
Sales and Office Occupations
The most common Sales and Office occupations in Sherburn are Sales & Related (46 | 9.9%), and Office & Administration (34 | 7.3%).
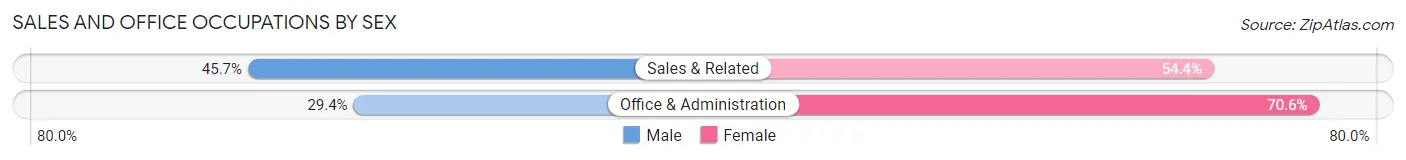
Sales and Office Occupations by Sex
| Occupation | Male | Female |
| Sales & Related | 21 (45.7%) | 25 (54.3%) |
| Office & Administration | 10 (29.4%) | 24 (70.6%) |
| Total (Category) | 31 (38.8%) | 49 (61.3%) |
| Total (Overall) | 243 (52.4%) | 221 (47.6%) |
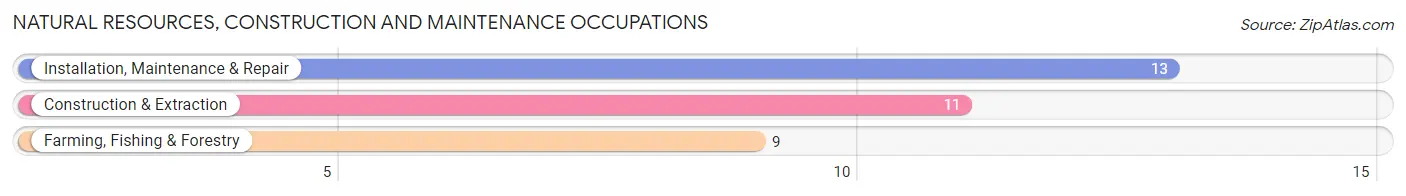
Natural Resources, Construction and Maintenance Occupations
The most common Natural Resources, Construction and Maintenance occupations in Sherburn are Installation, Maintenance & Repair (13 | 2.8%), Construction & Extraction (11 | 2.4%), and Farming, Fishing & Forestry (9 | 1.9%).
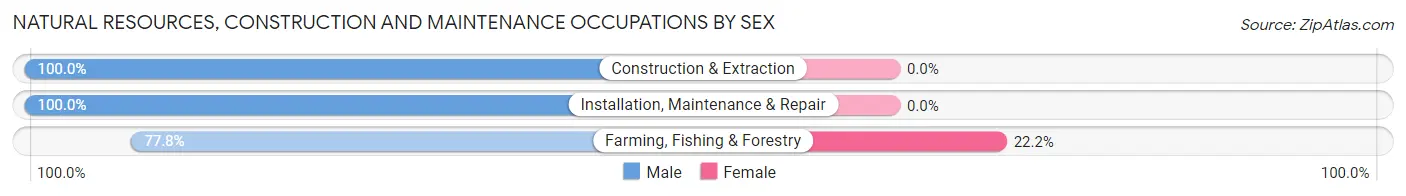
Natural Resources, Construction and Maintenance Occupations by Sex
| Occupation | Male | Female |
| Farming, Fishing & Forestry | 7 (77.8%) | 2 (22.2%) |
| Construction & Extraction | 11 (100.0%) | 0 (0.0%) |
| Installation, Maintenance & Repair | 13 (100.0%) | 0 (0.0%) |
| Total (Category) | 31 (93.9%) | 2 (6.1%) |
| Total (Overall) | 243 (52.4%) | 221 (47.6%) |
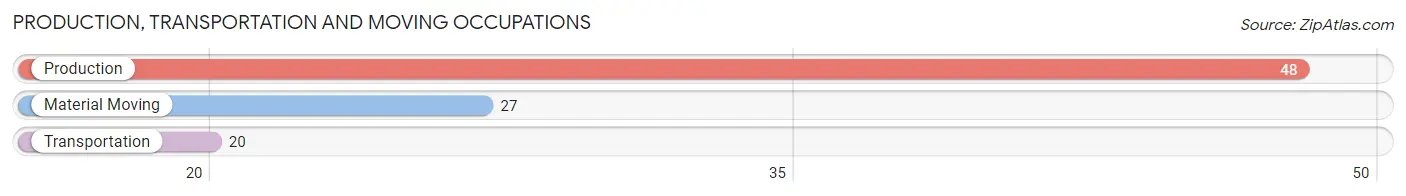
Production, Transportation and Moving Occupations
The most common Production, Transportation and Moving occupations in Sherburn are Production (48 | 10.3%), Material Moving (27 | 5.8%), and Transportation (20 | 4.3%).
Production, Transportation and Moving Occupations by Sex
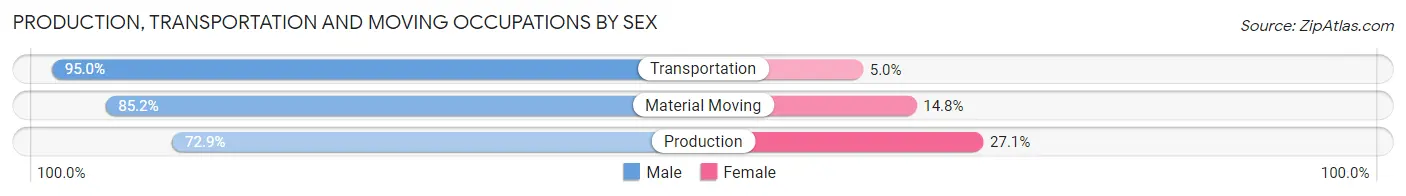
| Occupation | Male | Female |
| Production | 35 (72.9%) | 13 (27.1%) |
| Transportation | 19 (95.0%) | 1 (5.0%) |
| Material Moving | 23 (85.2%) | 4 (14.8%) |
| Total (Category) | 77 (81.0%) | 18 (19.0%) |
| Total (Overall) | 243 (52.4%) | 221 (47.6%) |
Employment Industries by Sex in Sherburn
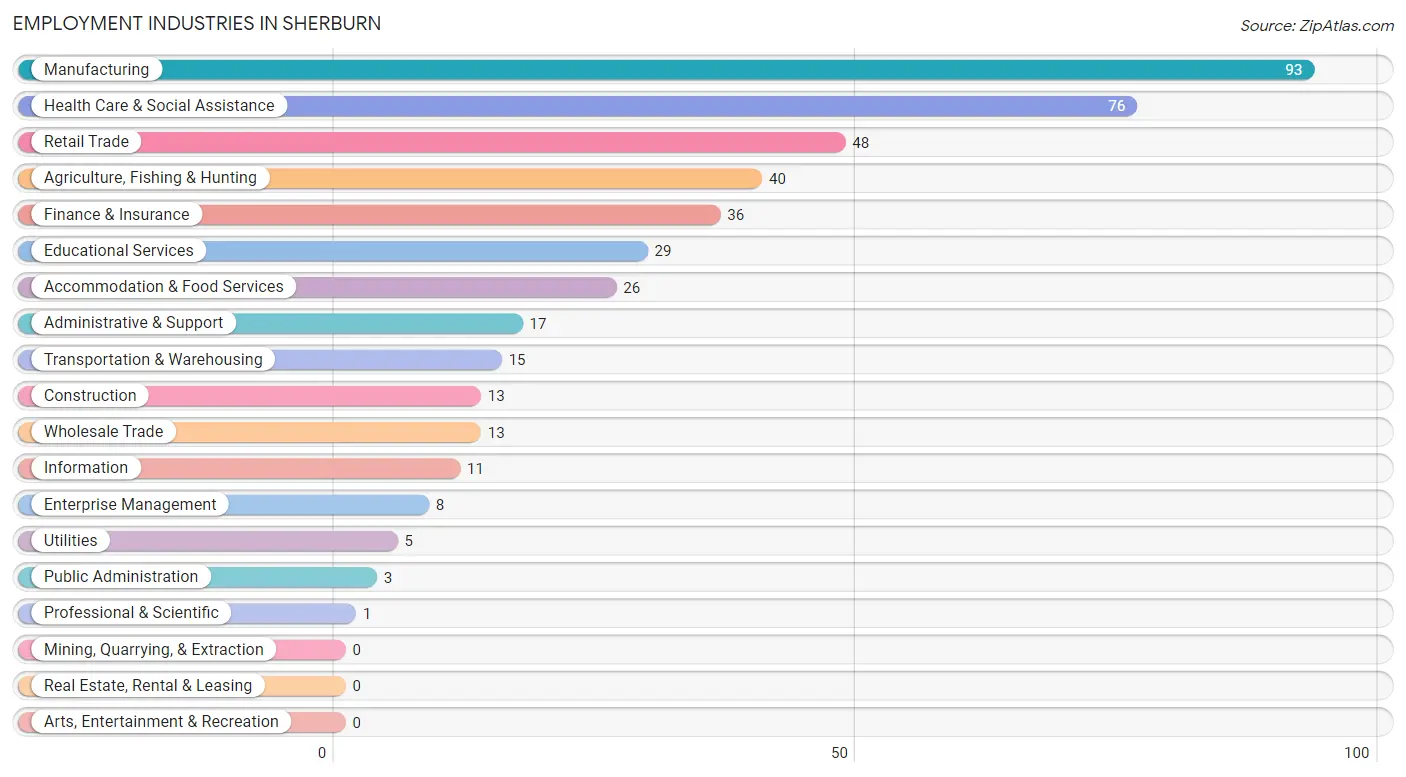
Employment Industries in Sherburn
The major employment industries in Sherburn include Manufacturing (93 | 20.0%), Health Care & Social Assistance (76 | 16.4%), Retail Trade (48 | 10.3%), Agriculture, Fishing & Hunting (40 | 8.6%), and Finance & Insurance (36 | 7.8%).
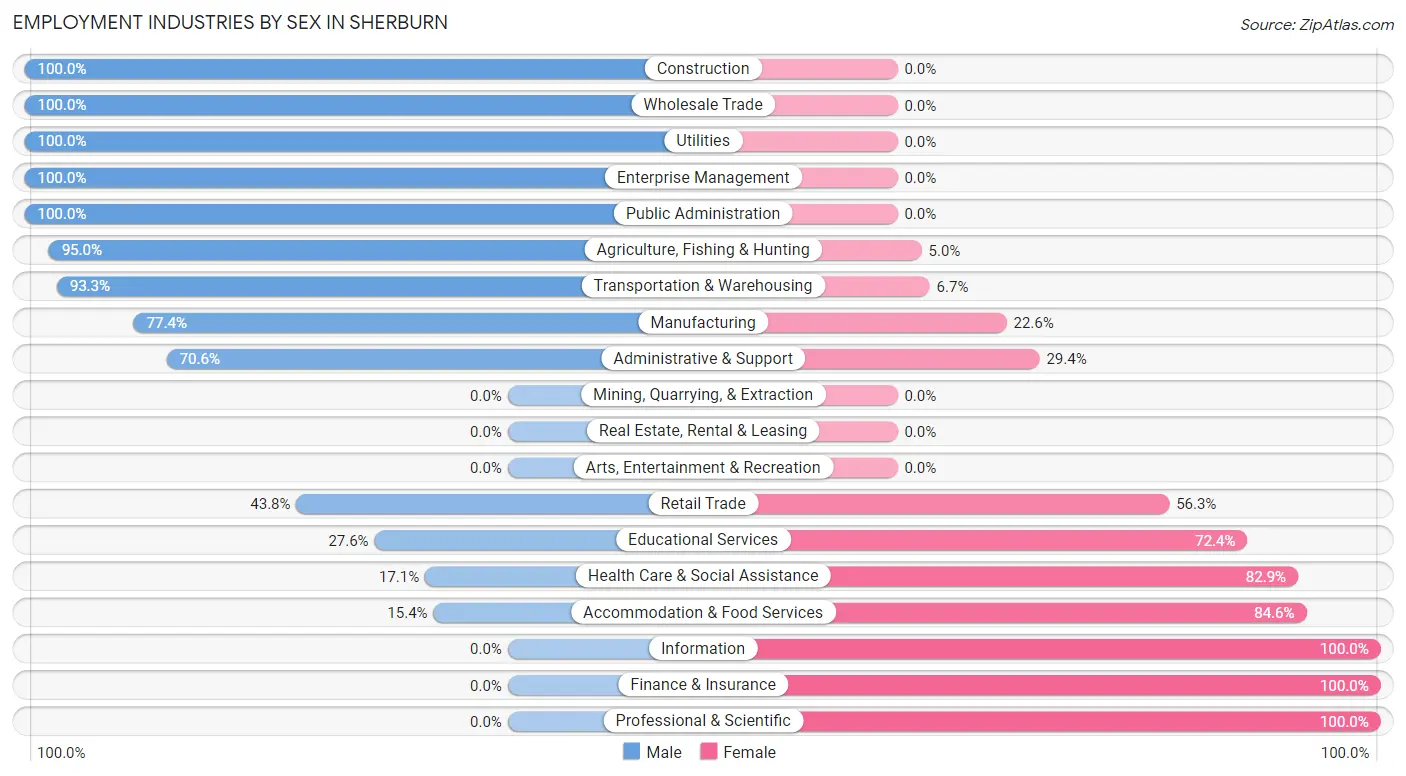
Employment Industries by Sex in Sherburn
The Sherburn industries that see more men than women are Construction (100.0%), Wholesale Trade (100.0%), and Utilities (100.0%), whereas the industries that tend to have a higher number of women are Information (100.0%), Finance & Insurance (100.0%), and Professional & Scientific (100.0%).
| Industry | Male | Female |
| Agriculture, Fishing & Hunting | 38 (95.0%) | 2 (5.0%) |
| Mining, Quarrying, & Extraction | 0 (0.0%) | 0 (0.0%) |
| Construction | 13 (100.0%) | 0 (0.0%) |
| Manufacturing | 72 (77.4%) | 21 (22.6%) |
| Wholesale Trade | 13 (100.0%) | 0 (0.0%) |
| Retail Trade | 21 (43.8%) | 27 (56.2%) |
| Transportation & Warehousing | 14 (93.3%) | 1 (6.7%) |
| Utilities | 5 (100.0%) | 0 (0.0%) |
| Information | 0 (0.0%) | 11 (100.0%) |
| Finance & Insurance | 0 (0.0%) | 36 (100.0%) |
| Real Estate, Rental & Leasing | 0 (0.0%) | 0 (0.0%) |
| Professional & Scientific | 0 (0.0%) | 1 (100.0%) |
| Enterprise Management | 8 (100.0%) | 0 (0.0%) |
| Administrative & Support | 12 (70.6%) | 5 (29.4%) |
| Educational Services | 8 (27.6%) | 21 (72.4%) |
| Health Care & Social Assistance | 13 (17.1%) | 63 (82.9%) |
| Arts, Entertainment & Recreation | 0 (0.0%) | 0 (0.0%) |
| Accommodation & Food Services | 4 (15.4%) | 22 (84.6%) |
| Public Administration | 3 (100.0%) | 0 (0.0%) |
| Total | 243 (52.4%) | 221 (47.6%) |
Education in Sherburn
School Enrollment in Sherburn
The most common levels of schooling among the 213 students in Sherburn are elementary school (80 | 37.6%), high school (53 | 24.9%), and middle school (32 | 15.0%).
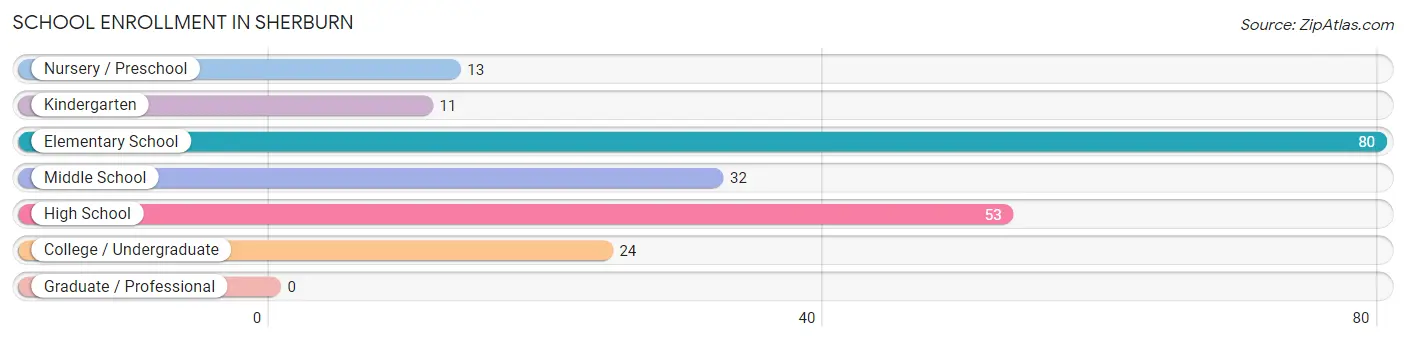
| School Level | # Students | % Students |
| Nursery / Preschool | 13 | 6.1% |
| Kindergarten | 11 | 5.2% |
| Elementary School | 80 | 37.6% |
| Middle School | 32 | 15.0% |
| High School | 53 | 24.9% |
| College / Undergraduate | 24 | 11.3% |
| Graduate / Professional | 0 | 0.0% |
| Total | 213 | 100.0% |
School Enrollment by Age by Funding Source in Sherburn
Out of a total of 213 students who are enrolled in schools in Sherburn, 19 (8.9%) attend a private institution, while the remaining 194 (91.1%) are enrolled in public schools. The age group of 25 to 34 year olds has the highest likelihood of being enrolled in private schools, with 10 (100.0% in the age bracket) enrolled. Conversely, the age group of 3 to 4 year olds has the lowest likelihood of being enrolled in a private school, with 13 (100.0% in the age bracket) attending a public institution.
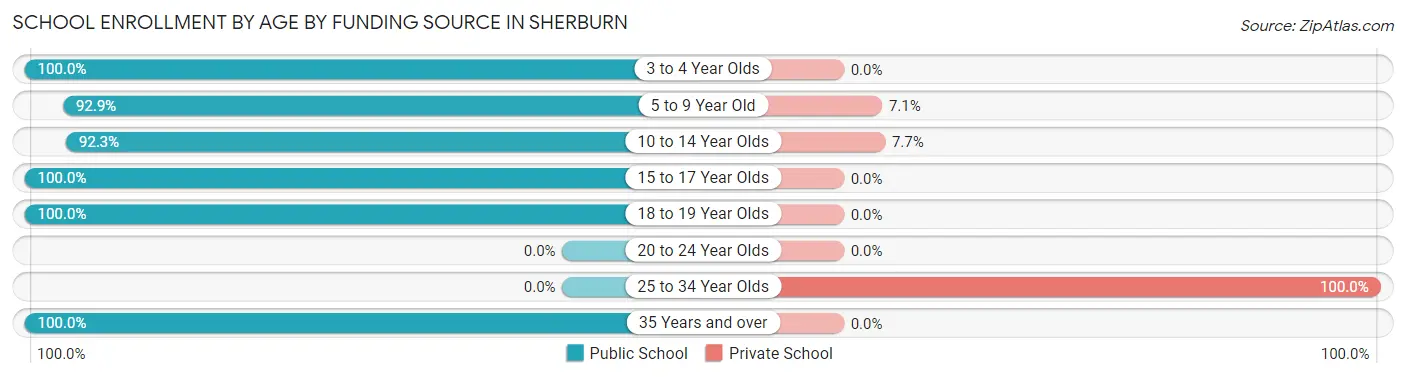
| Age Bracket | Public School | Private School |
| 3 to 4 Year Olds | 13 (100.0%) | 0 (0.0%) |
| 5 to 9 Year Old | 78 (92.9%) | 6 (7.1%) |
| 10 to 14 Year Olds | 36 (92.3%) | 3 (7.7%) |
| 15 to 17 Year Olds | 49 (100.0%) | 0 (0.0%) |
| 18 to 19 Year Olds | 13 (100.0%) | 0 (0.0%) |
| 20 to 24 Year Olds | 0 (0.0%) | 0 (0.0%) |
| 25 to 34 Year Olds | 0 (0.0%) | 10 (100.0%) |
| 35 Years and over | 5 (100.0%) | 0 (0.0%) |
| Total | 194 (91.1%) | 19 (8.9%) |
Educational Attainment by Field of Study in Sherburn
Education (59 | 52.2%), science & technology (21 | 18.6%), arts & humanities (9 | 8.0%), social sciences (7 | 6.2%), and engineering (7 | 6.2%) are the most common fields of study among 113 individuals in Sherburn who have obtained a bachelor's degree or higher.
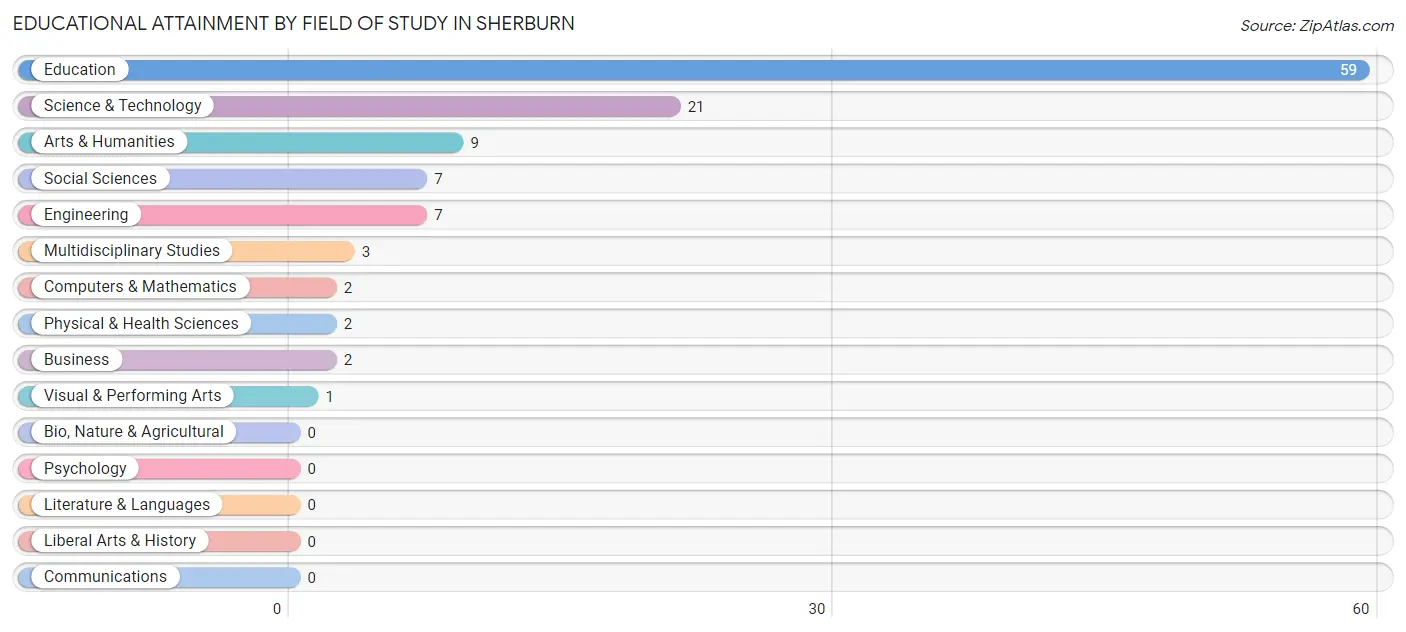
| Field of Study | # Graduates | % Graduates |
| Computers & Mathematics | 2 | 1.8% |
| Bio, Nature & Agricultural | 0 | 0.0% |
| Physical & Health Sciences | 2 | 1.8% |
| Psychology | 0 | 0.0% |
| Social Sciences | 7 | 6.2% |
| Engineering | 7 | 6.2% |
| Multidisciplinary Studies | 3 | 2.6% |
| Science & Technology | 21 | 18.6% |
| Business | 2 | 1.8% |
| Education | 59 | 52.2% |
| Literature & Languages | 0 | 0.0% |
| Liberal Arts & History | 0 | 0.0% |
| Visual & Performing Arts | 1 | 0.9% |
| Communications | 0 | 0.0% |
| Arts & Humanities | 9 | 8.0% |
| Total | 113 | 100.0% |
Transportation & Commute in Sherburn
Vehicle Availability by Sex in Sherburn
The most prevalent vehicle ownership categories in Sherburn are males with 2 vehicles (99, accounting for 41.9%) and females with 2 vehicles (84, making up 46.5%).
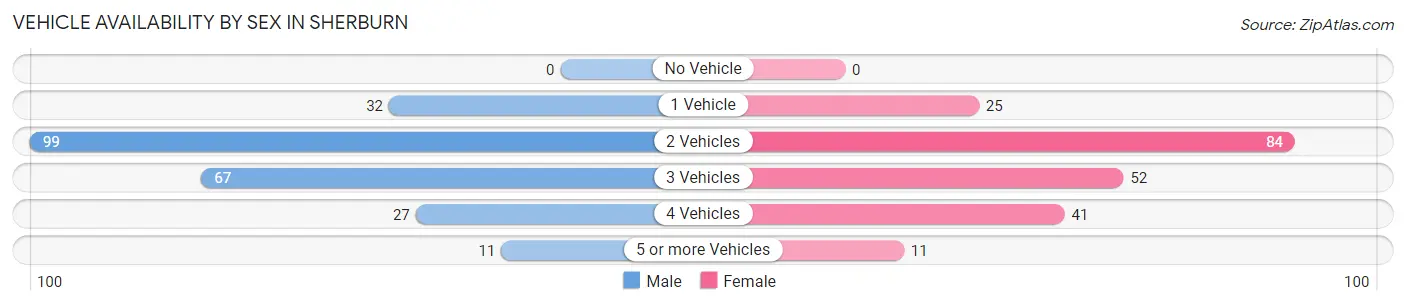
| Vehicles Available | Male | Female |
| No Vehicle | 0 (0.0%) | 0 (0.0%) |
| 1 Vehicle | 32 (13.6%) | 25 (11.7%) |
| 2 Vehicles | 99 (41.9%) | 84 (39.4%) |
| 3 Vehicles | 67 (28.4%) | 52 (24.4%) |
| 4 Vehicles | 27 (11.4%) | 41 (19.3%) |
| 5 or more Vehicles | 11 (4.7%) | 11 (5.2%) |
| Total | 236 (100.0%) | 213 (100.0%) |
Commute Time in Sherburn
The most frequently occuring commute durations in Sherburn are 20 to 24 minutes (96 commuters, 22.8%), 15 to 19 minutes (90 commuters, 21.4%), and 5 to 9 minutes (52 commuters, 12.3%).
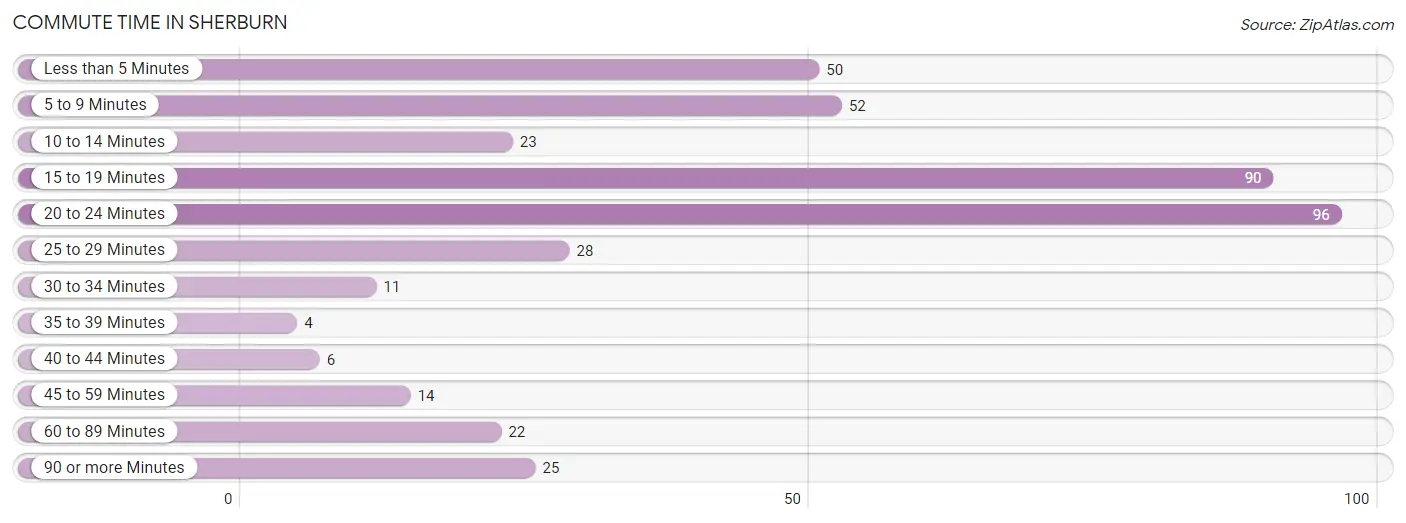
| Commute Time | # Commuters | % Commuters |
| Less than 5 Minutes | 50 | 11.9% |
| 5 to 9 Minutes | 52 | 12.3% |
| 10 to 14 Minutes | 23 | 5.5% |
| 15 to 19 Minutes | 90 | 21.4% |
| 20 to 24 Minutes | 96 | 22.8% |
| 25 to 29 Minutes | 28 | 6.7% |
| 30 to 34 Minutes | 11 | 2.6% |
| 35 to 39 Minutes | 4 | 0.9% |
| 40 to 44 Minutes | 6 | 1.4% |
| 45 to 59 Minutes | 14 | 3.3% |
| 60 to 89 Minutes | 22 | 5.2% |
| 90 or more Minutes | 25 | 5.9% |
Commute Time by Sex in Sherburn
The most common commute times in Sherburn are 20 to 24 minutes (49 commuters, 22.3%) for males and 15 to 19 minutes (48 commuters, 23.9%) for females.
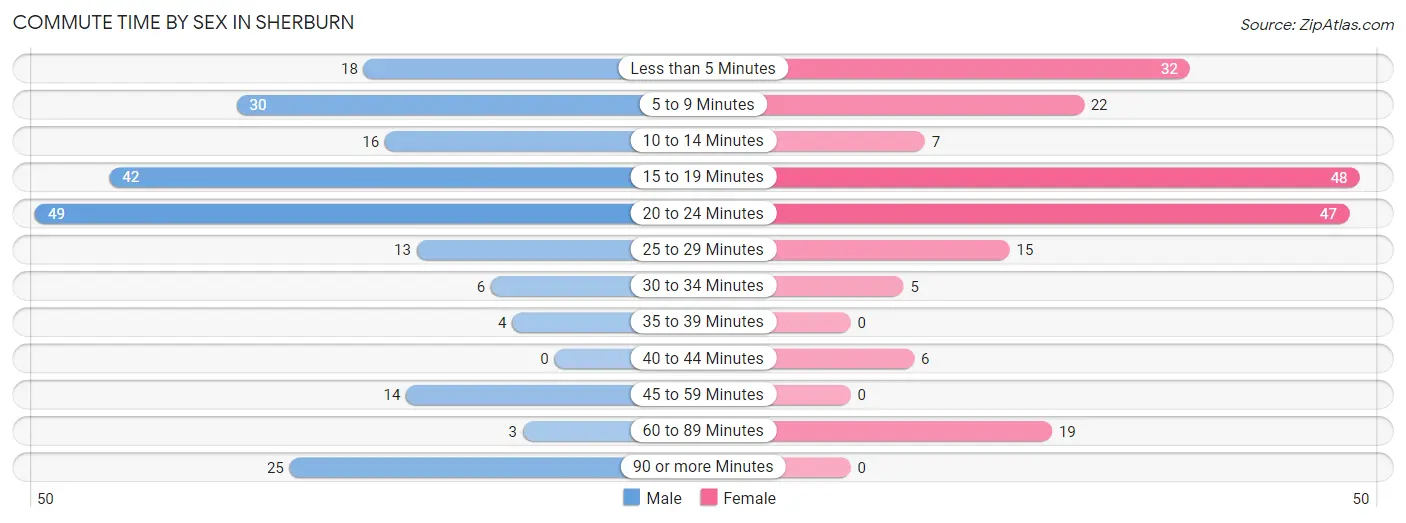
| Commute Time | Male | Female |
| Less than 5 Minutes | 18 (8.2%) | 32 (15.9%) |
| 5 to 9 Minutes | 30 (13.6%) | 22 (11.0%) |
| 10 to 14 Minutes | 16 (7.3%) | 7 (3.5%) |
| 15 to 19 Minutes | 42 (19.1%) | 48 (23.9%) |
| 20 to 24 Minutes | 49 (22.3%) | 47 (23.4%) |
| 25 to 29 Minutes | 13 (5.9%) | 15 (7.5%) |
| 30 to 34 Minutes | 6 (2.7%) | 5 (2.5%) |
| 35 to 39 Minutes | 4 (1.8%) | 0 (0.0%) |
| 40 to 44 Minutes | 0 (0.0%) | 6 (3.0%) |
| 45 to 59 Minutes | 14 (6.4%) | 0 (0.0%) |
| 60 to 89 Minutes | 3 (1.4%) | 19 (9.5%) |
| 90 or more Minutes | 25 (11.4%) | 0 (0.0%) |
Time of Departure to Work by Sex in Sherburn
The most frequent times of departure to work in Sherburn are 7:00 AM to 7:29 AM (59, 26.8%) for males and 7:30 AM to 7:59 AM (47, 23.4%) for females.
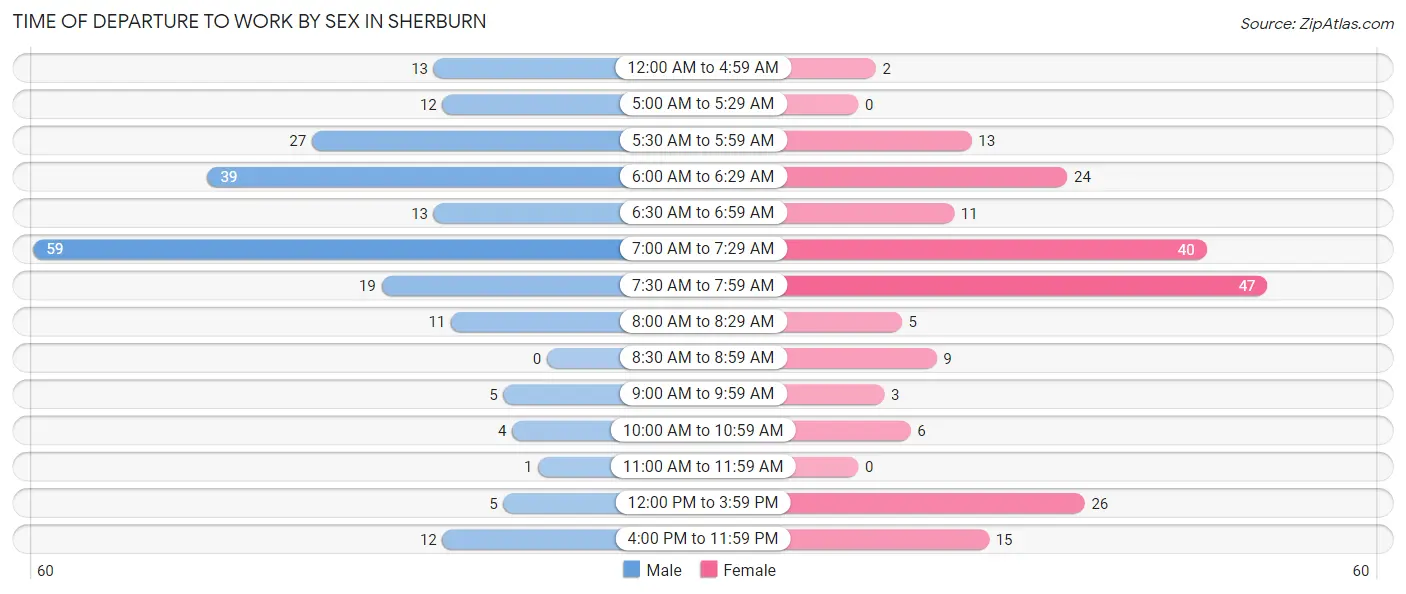
| Time of Departure | Male | Female |
| 12:00 AM to 4:59 AM | 13 (5.9%) | 2 (1.0%) |
| 5:00 AM to 5:29 AM | 12 (5.4%) | 0 (0.0%) |
| 5:30 AM to 5:59 AM | 27 (12.3%) | 13 (6.5%) |
| 6:00 AM to 6:29 AM | 39 (17.7%) | 24 (11.9%) |
| 6:30 AM to 6:59 AM | 13 (5.9%) | 11 (5.5%) |
| 7:00 AM to 7:29 AM | 59 (26.8%) | 40 (19.9%) |
| 7:30 AM to 7:59 AM | 19 (8.6%) | 47 (23.4%) |
| 8:00 AM to 8:29 AM | 11 (5.0%) | 5 (2.5%) |
| 8:30 AM to 8:59 AM | 0 (0.0%) | 9 (4.5%) |
| 9:00 AM to 9:59 AM | 5 (2.3%) | 3 (1.5%) |
| 10:00 AM to 10:59 AM | 4 (1.8%) | 6 (3.0%) |
| 11:00 AM to 11:59 AM | 1 (0.4%) | 0 (0.0%) |
| 12:00 PM to 3:59 PM | 5 (2.3%) | 26 (12.9%) |
| 4:00 PM to 11:59 PM | 12 (5.4%) | 15 (7.5%) |
| Total | 220 (100.0%) | 201 (100.0%) |
Housing Occupancy in Sherburn
Occupancy by Ownership in Sherburn
Of the total 415 dwellings in Sherburn, owner-occupied units account for 316 (76.1%), while renter-occupied units make up 99 (23.9%).
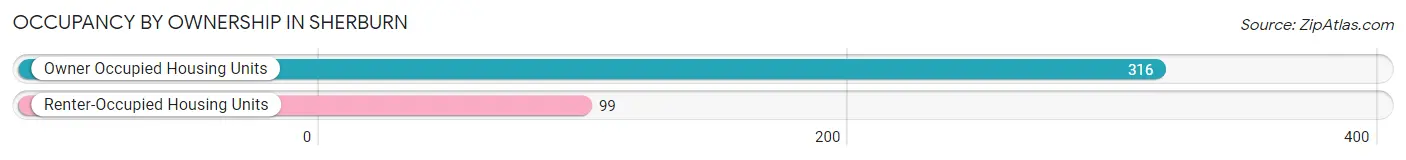
| Occupancy | # Housing Units | % Housing Units |
| Owner Occupied Housing Units | 316 | 76.1% |
| Renter-Occupied Housing Units | 99 | 23.9% |
| Total Occupied Housing Units | 415 | 100.0% |
Occupancy by Household Size in Sherburn
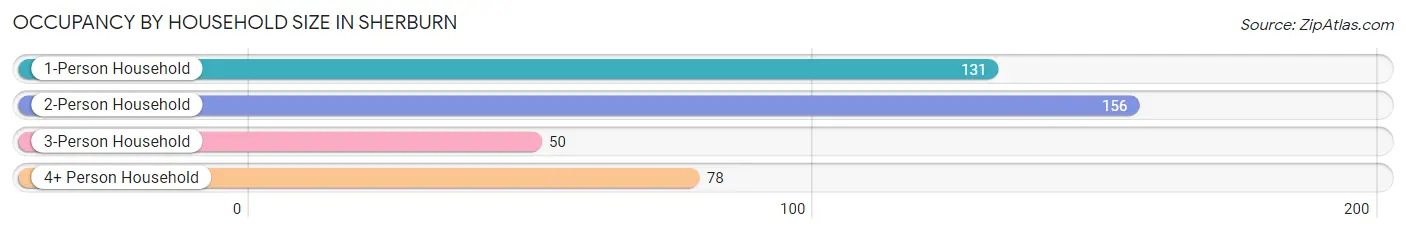
| Household Size | # Housing Units | % Housing Units |
| 1-Person Household | 131 | 31.6% |
| 2-Person Household | 156 | 37.6% |
| 3-Person Household | 50 | 12.0% |
| 4+ Person Household | 78 | 18.8% |
| Total Housing Units | 415 | 100.0% |
Occupancy by Ownership by Household Size in Sherburn
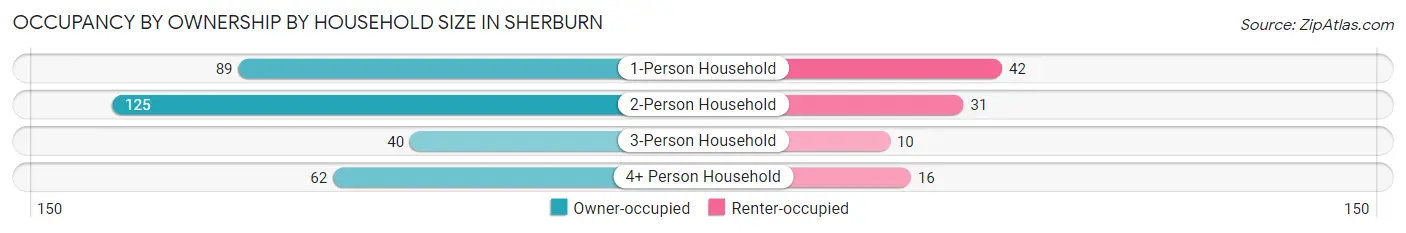
| Household Size | Owner-occupied | Renter-occupied |
| 1-Person Household | 89 (67.9%) | 42 (32.1%) |
| 2-Person Household | 125 (80.1%) | 31 (19.9%) |
| 3-Person Household | 40 (80.0%) | 10 (20.0%) |
| 4+ Person Household | 62 (79.5%) | 16 (20.5%) |
| Total Housing Units | 316 (76.1%) | 99 (23.9%) |
Occupancy by Educational Attainment in Sherburn
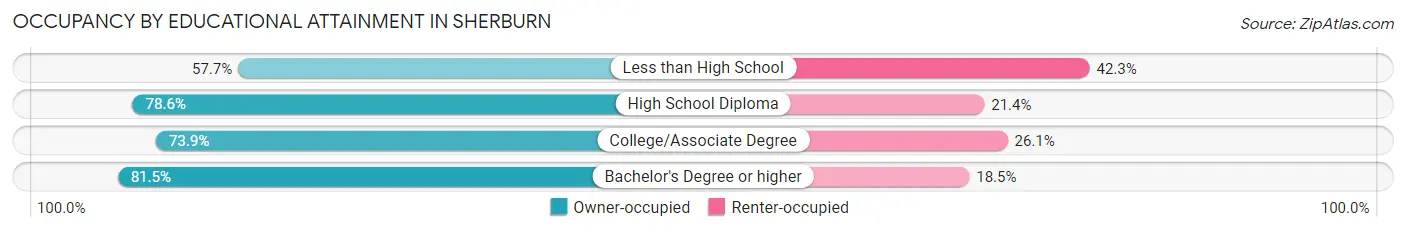
| Household Size | Owner-occupied | Renter-occupied |
| Less than High School | 15 (57.7%) | 11 (42.3%) |
| High School Diploma | 143 (78.6%) | 39 (21.4%) |
| College/Associate Degree | 105 (73.9%) | 37 (26.1%) |
| Bachelor's Degree or higher | 53 (81.5%) | 12 (18.5%) |
Occupancy by Age of Householder in Sherburn
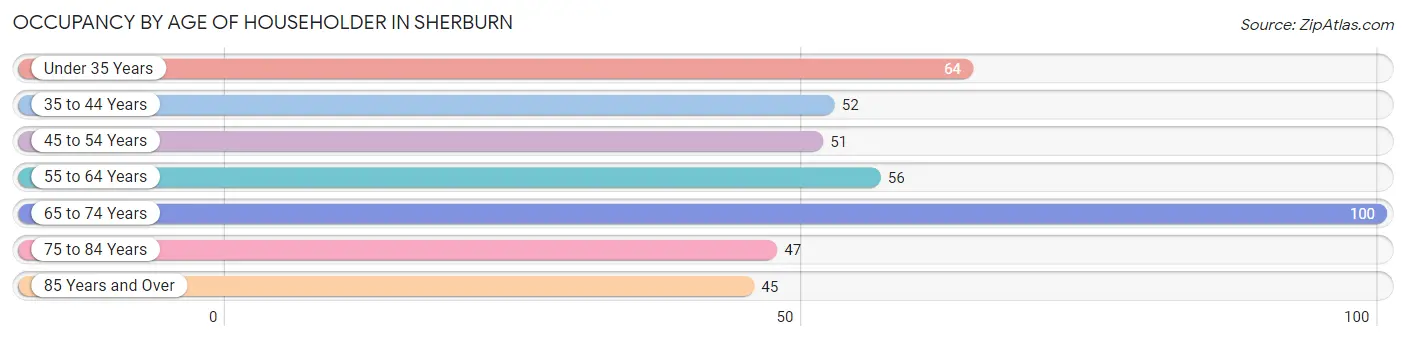
| Age Bracket | # Households | % Households |
| Under 35 Years | 64 | 15.4% |
| 35 to 44 Years | 52 | 12.5% |
| 45 to 54 Years | 51 | 12.3% |
| 55 to 64 Years | 56 | 13.5% |
| 65 to 74 Years | 100 | 24.1% |
| 75 to 84 Years | 47 | 11.3% |
| 85 Years and Over | 45 | 10.8% |
| Total | 415 | 100.0% |
Housing Finances in Sherburn
Median Income by Occupancy in Sherburn
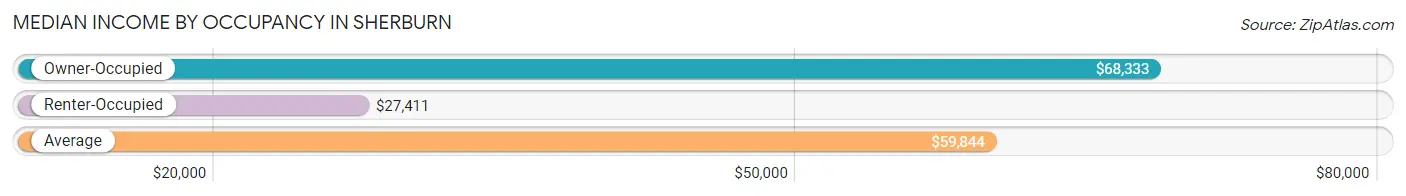
| Occupancy Type | # Households | Median Income |
| Owner-Occupied | 316 (76.1%) | $68,333 |
| Renter-Occupied | 99 (23.9%) | $27,411 |
| Average | 415 (100.0%) | $59,844 |
Occupancy by Householder Income Bracket in Sherburn
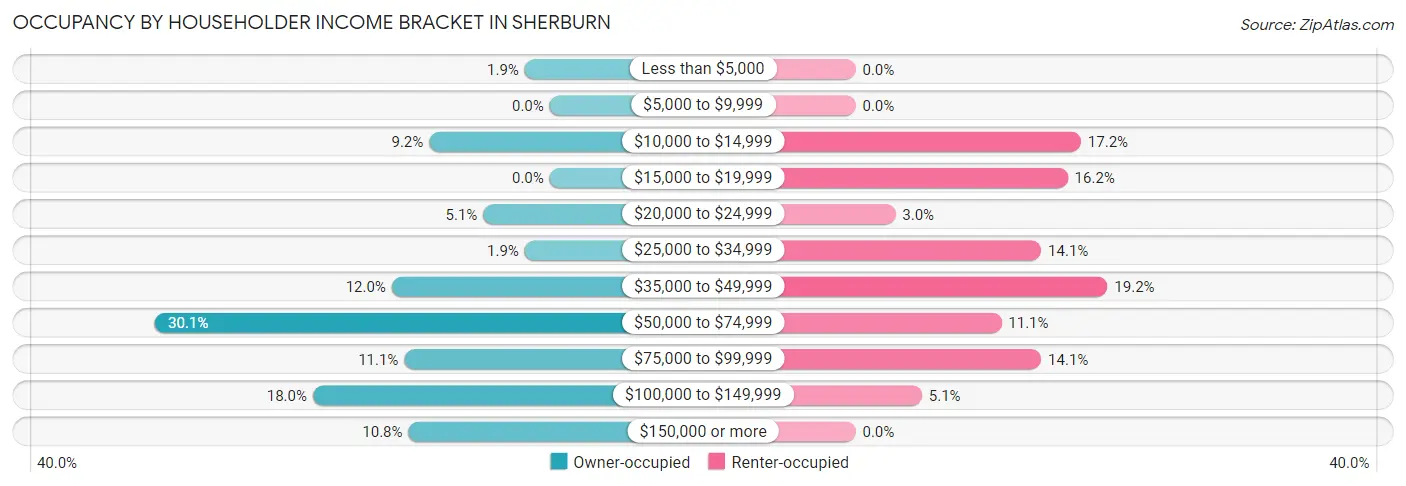
| Income Bracket | Owner-occupied | Renter-occupied |
| Less than $5,000 | 6 (1.9%) | 0 (0.0%) |
| $5,000 to $9,999 | 0 (0.0%) | 0 (0.0%) |
| $10,000 to $14,999 | 29 (9.2%) | 17 (17.2%) |
| $15,000 to $19,999 | 0 (0.0%) | 16 (16.2%) |
| $20,000 to $24,999 | 16 (5.1%) | 3 (3.0%) |
| $25,000 to $34,999 | 6 (1.9%) | 14 (14.1%) |
| $35,000 to $49,999 | 38 (12.0%) | 19 (19.2%) |
| $50,000 to $74,999 | 95 (30.1%) | 11 (11.1%) |
| $75,000 to $99,999 | 35 (11.1%) | 14 (14.1%) |
| $100,000 to $149,999 | 57 (18.0%) | 5 (5.1%) |
| $150,000 or more | 34 (10.8%) | 0 (0.0%) |
| Total | 316 (100.0%) | 99 (100.0%) |
Monthly Housing Cost Tiers in Sherburn
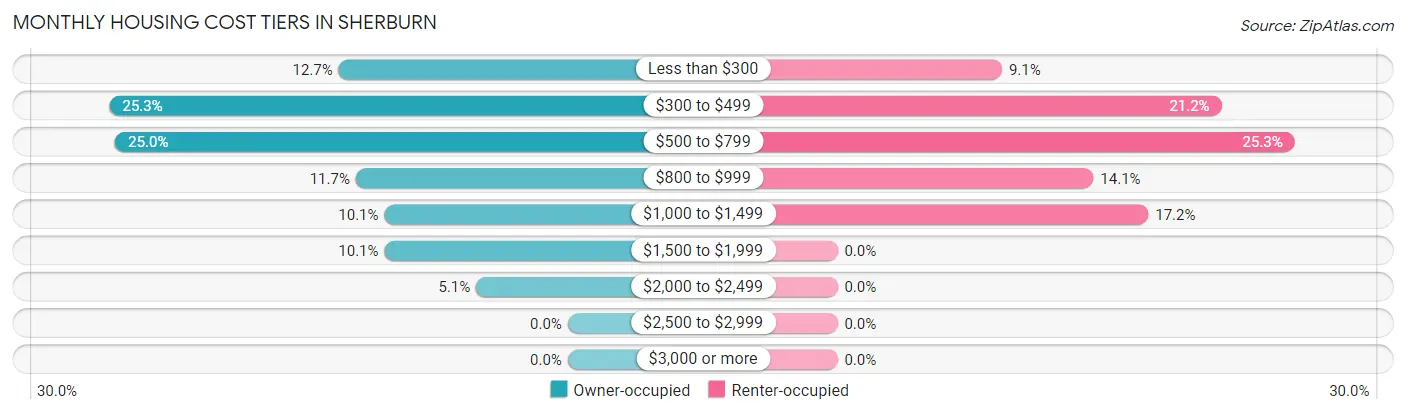
| Monthly Cost | Owner-occupied | Renter-occupied |
| Less than $300 | 40 (12.7%) | 9 (9.1%) |
| $300 to $499 | 80 (25.3%) | 21 (21.2%) |
| $500 to $799 | 79 (25.0%) | 25 (25.3%) |
| $800 to $999 | 37 (11.7%) | 14 (14.1%) |
| $1,000 to $1,499 | 32 (10.1%) | 17 (17.2%) |
| $1,500 to $1,999 | 32 (10.1%) | 0 (0.0%) |
| $2,000 to $2,499 | 16 (5.1%) | 0 (0.0%) |
| $2,500 to $2,999 | 0 (0.0%) | 0 (0.0%) |
| $3,000 or more | 0 (0.0%) | 0 (0.0%) |
| Total | 316 (100.0%) | 99 (100.0%) |
Physical Housing Characteristics in Sherburn
Housing Structures in Sherburn
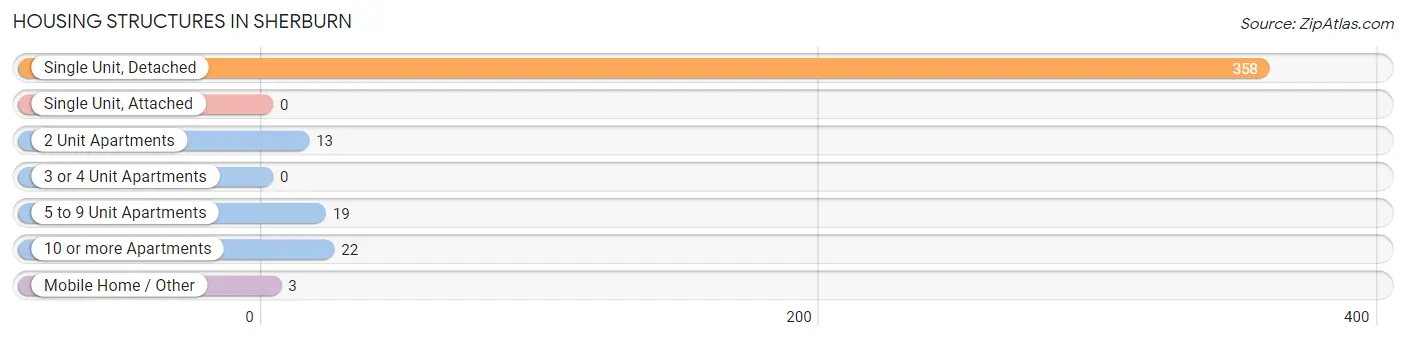
| Structure Type | # Housing Units | % Housing Units |
| Single Unit, Detached | 358 | 86.3% |
| Single Unit, Attached | 0 | 0.0% |
| 2 Unit Apartments | 13 | 3.1% |
| 3 or 4 Unit Apartments | 0 | 0.0% |
| 5 to 9 Unit Apartments | 19 | 4.6% |
| 10 or more Apartments | 22 | 5.3% |
| Mobile Home / Other | 3 | 0.7% |
| Total | 415 | 100.0% |
Housing Structures by Occupancy in Sherburn
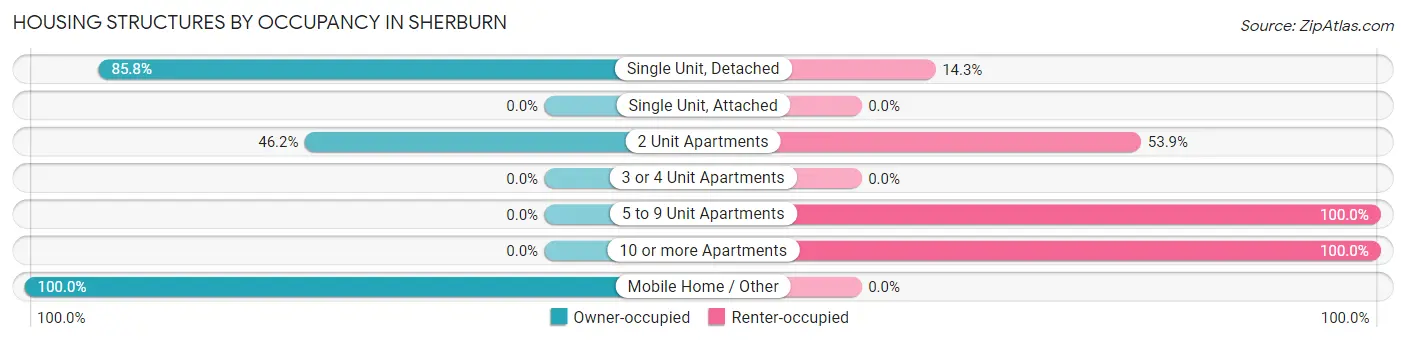
| Structure Type | Owner-occupied | Renter-occupied |
| Single Unit, Detached | 307 (85.8%) | 51 (14.2%) |
| Single Unit, Attached | 0 (0.0%) | 0 (0.0%) |
| 2 Unit Apartments | 6 (46.2%) | 7 (53.8%) |
| 3 or 4 Unit Apartments | 0 (0.0%) | 0 (0.0%) |
| 5 to 9 Unit Apartments | 0 (0.0%) | 19 (100.0%) |
| 10 or more Apartments | 0 (0.0%) | 22 (100.0%) |
| Mobile Home / Other | 3 (100.0%) | 0 (0.0%) |
| Total | 316 (76.1%) | 99 (23.9%) |
Housing Structures by Number of Rooms in Sherburn
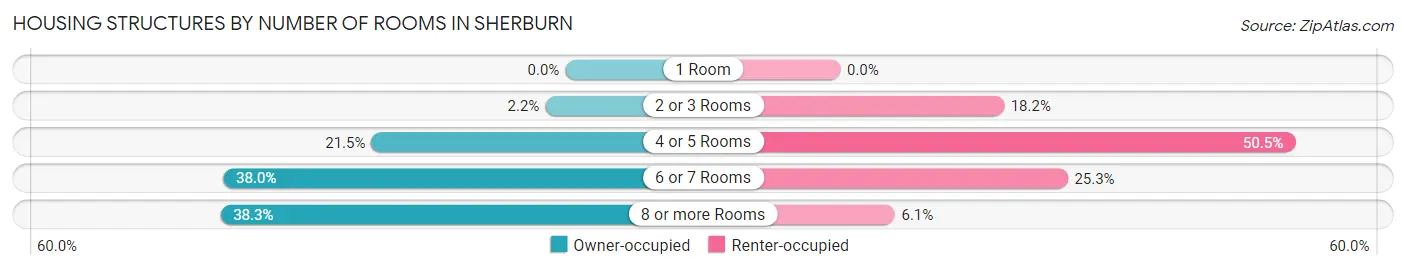
| Number of Rooms | Owner-occupied | Renter-occupied |
| 1 Room | 0 (0.0%) | 0 (0.0%) |
| 2 or 3 Rooms | 7 (2.2%) | 18 (18.2%) |
| 4 or 5 Rooms | 68 (21.5%) | 50 (50.5%) |
| 6 or 7 Rooms | 120 (38.0%) | 25 (25.3%) |
| 8 or more Rooms | 121 (38.3%) | 6 (6.1%) |
| Total | 316 (100.0%) | 99 (100.0%) |
Housing Structure by Heating Type in Sherburn
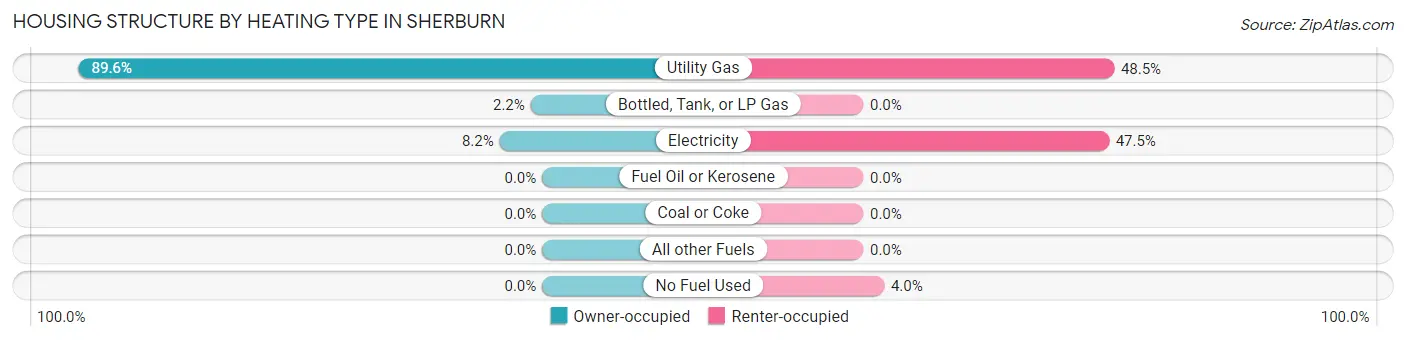
| Heating Type | Owner-occupied | Renter-occupied |
| Utility Gas | 283 (89.6%) | 48 (48.5%) |
| Bottled, Tank, or LP Gas | 7 (2.2%) | 0 (0.0%) |
| Electricity | 26 (8.2%) | 47 (47.5%) |
| Fuel Oil or Kerosene | 0 (0.0%) | 0 (0.0%) |
| Coal or Coke | 0 (0.0%) | 0 (0.0%) |
| All other Fuels | 0 (0.0%) | 0 (0.0%) |
| No Fuel Used | 0 (0.0%) | 4 (4.0%) |
| Total | 316 (100.0%) | 99 (100.0%) |
Household Vehicle Usage in Sherburn
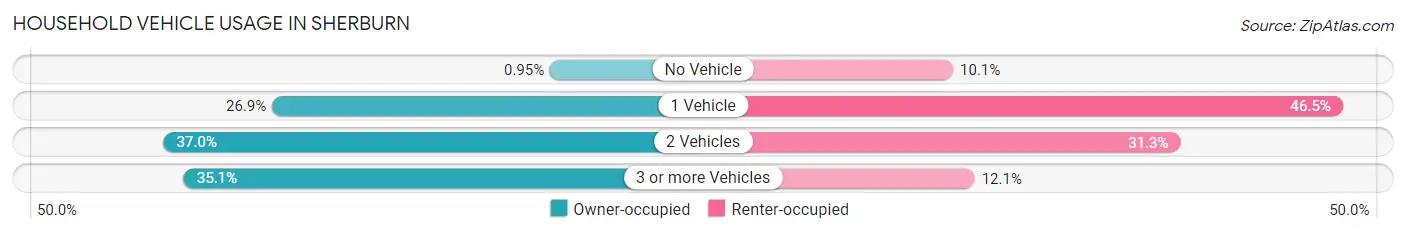
| Vehicles per Household | Owner-occupied | Renter-occupied |
| No Vehicle | 3 (0.9%) | 10 (10.1%) |
| 1 Vehicle | 85 (26.9%) | 46 (46.5%) |
| 2 Vehicles | 117 (37.0%) | 31 (31.3%) |
| 3 or more Vehicles | 111 (35.1%) | 12 (12.1%) |
| Total | 316 (100.0%) | 99 (100.0%) |
Real Estate & Mortgages in Sherburn
Real Estate and Mortgage Overview in Sherburn
| Characteristic | Without Mortgage | With Mortgage |
| Housing Units | 155 | 161 |
| Median Property Value | $68,100 | $96,400 |
| Median Household Income | $50,972 | $21 |
| Monthly Housing Costs | $346 | $0 |
| Real Estate Taxes | $951 | $0 |
Property Value by Mortgage Status in Sherburn
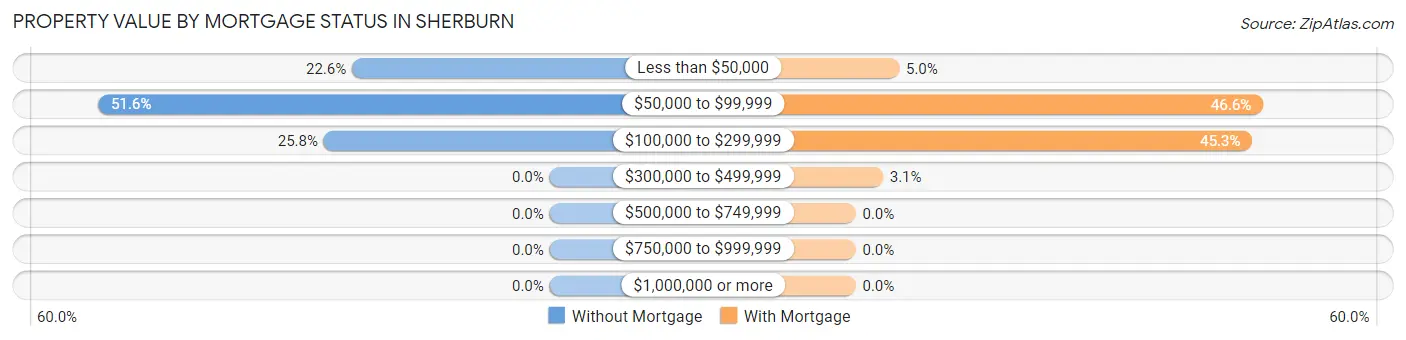
| Property Value | Without Mortgage | With Mortgage |
| Less than $50,000 | 35 (22.6%) | 8 (5.0%) |
| $50,000 to $99,999 | 80 (51.6%) | 75 (46.6%) |
| $100,000 to $299,999 | 40 (25.8%) | 73 (45.3%) |
| $300,000 to $499,999 | 0 (0.0%) | 5 (3.1%) |
| $500,000 to $749,999 | 0 (0.0%) | 0 (0.0%) |
| $750,000 to $999,999 | 0 (0.0%) | 0 (0.0%) |
| $1,000,000 or more | 0 (0.0%) | 0 (0.0%) |
| Total | 155 (100.0%) | 161 (100.0%) |
Household Income by Mortgage Status in Sherburn
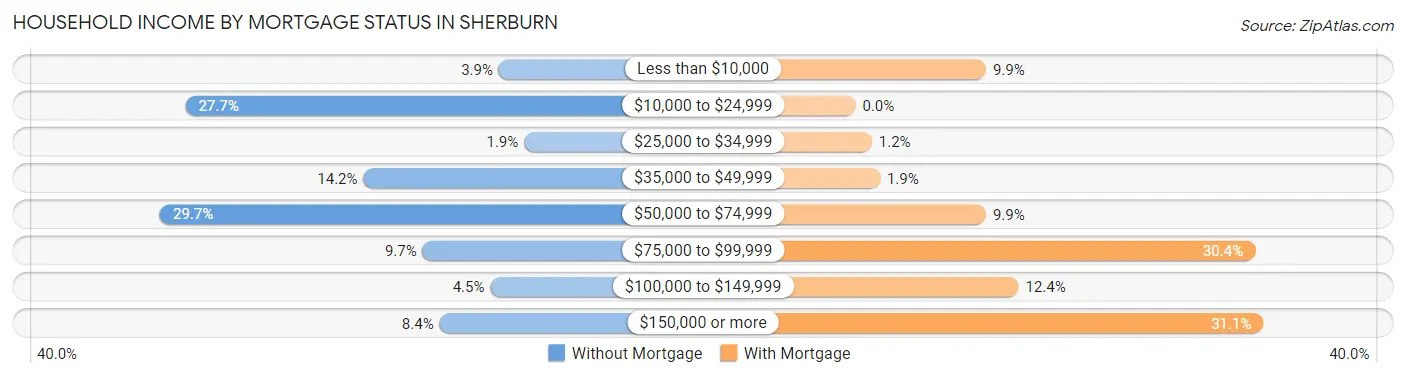
| Household Income | Without Mortgage | With Mortgage |
| Less than $10,000 | 6 (3.9%) | 16 (9.9%) |
| $10,000 to $24,999 | 43 (27.7%) | 0 (0.0%) |
| $25,000 to $34,999 | 3 (1.9%) | 2 (1.2%) |
| $35,000 to $49,999 | 22 (14.2%) | 3 (1.9%) |
| $50,000 to $74,999 | 46 (29.7%) | 16 (9.9%) |
| $75,000 to $99,999 | 15 (9.7%) | 49 (30.4%) |
| $100,000 to $149,999 | 7 (4.5%) | 20 (12.4%) |
| $150,000 or more | 13 (8.4%) | 50 (31.1%) |
| Total | 155 (100.0%) | 161 (100.0%) |
Property Value to Household Income Ratio in Sherburn
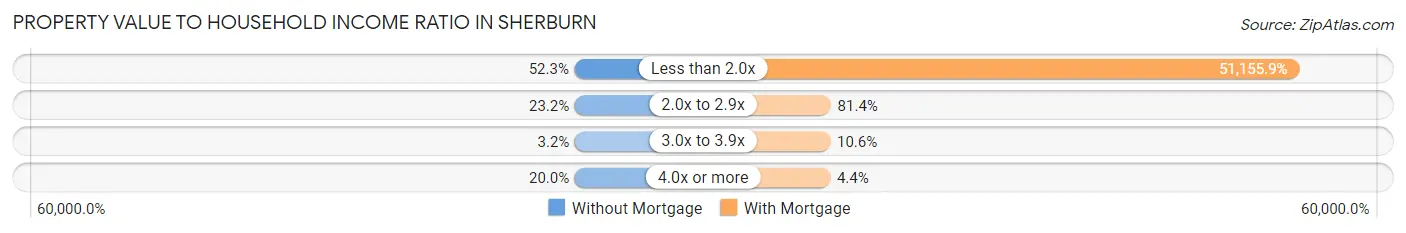
| Value-to-Income Ratio | Without Mortgage | With Mortgage |
| Less than 2.0x | 81 (52.3%) | 82,361 (51,155.9%) |
| 2.0x to 2.9x | 36 (23.2%) | 131 (81.4%) |
| 3.0x to 3.9x | 5 (3.2%) | 17 (10.6%) |
| 4.0x or more | 31 (20.0%) | 7 (4.3%) |
| Total | 155 (100.0%) | 161 (100.0%) |
Real Estate Taxes by Mortgage Status in Sherburn
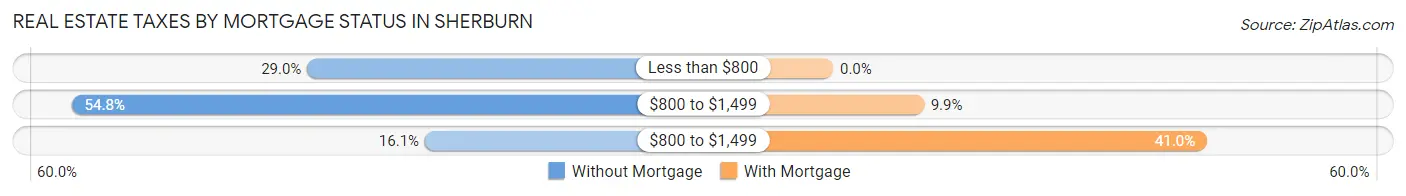
| Property Taxes | Without Mortgage | With Mortgage |
| Less than $800 | 45 (29.0%) | 0 (0.0%) |
| $800 to $1,499 | 85 (54.8%) | 16 (9.9%) |
| $800 to $1,499 | 25 (16.1%) | 66 (41.0%) |
| Total | 155 (100.0%) | 161 (100.0%) |
Health & Disability in Sherburn
Health Insurance Coverage by Age in Sherburn
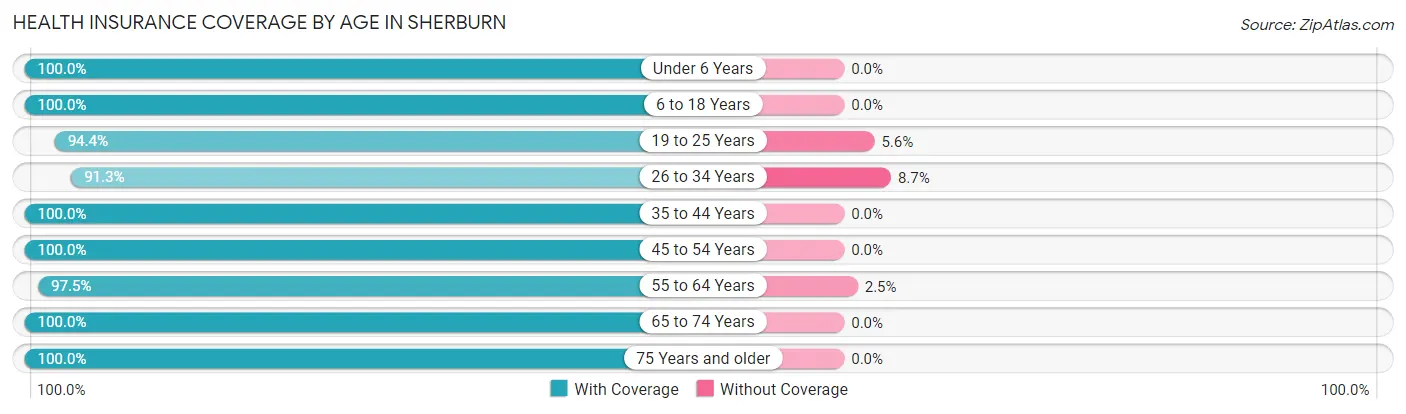
| Age Bracket | With Coverage | Without Coverage |
| Under 6 Years | 76 (100.0%) | 0 (0.0%) |
| 6 to 18 Years | 186 (100.0%) | 0 (0.0%) |
| 19 to 25 Years | 67 (94.4%) | 4 (5.6%) |
| 26 to 34 Years | 63 (91.3%) | 6 (8.7%) |
| 35 to 44 Years | 122 (100.0%) | 0 (0.0%) |
| 45 to 54 Years | 83 (100.0%) | 0 (0.0%) |
| 55 to 64 Years | 116 (97.5%) | 3 (2.5%) |
| 65 to 74 Years | 164 (100.0%) | 0 (0.0%) |
| 75 Years and older | 115 (100.0%) | 0 (0.0%) |
| Total | 992 (98.7%) | 13 (1.3%) |
Health Insurance Coverage by Citizenship Status in Sherburn
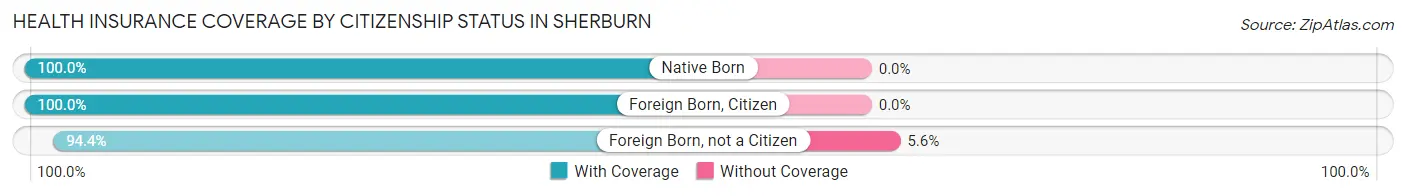
| Citizenship Status | With Coverage | Without Coverage |
| Native Born | 76 (100.0%) | 0 (0.0%) |
| Foreign Born, Citizen | 186 (100.0%) | 0 (0.0%) |
| Foreign Born, not a Citizen | 67 (94.4%) | 4 (5.6%) |
Health Insurance Coverage by Household Income in Sherburn
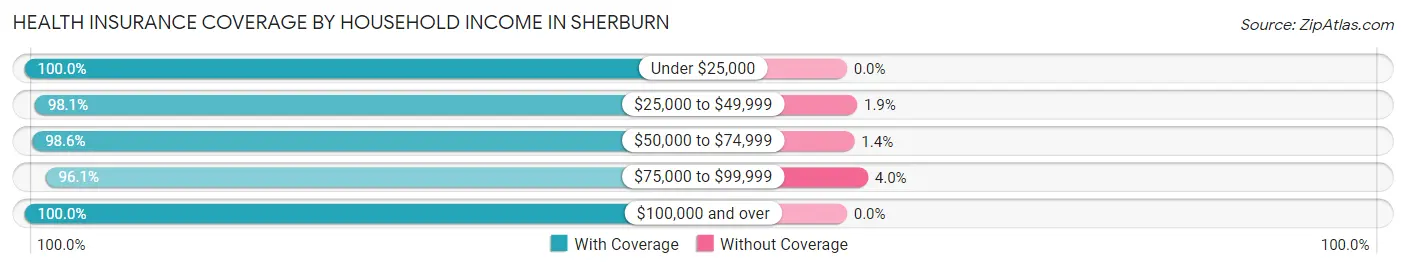
| Household Income | With Coverage | Without Coverage |
| Under $25,000 | 126 (100.0%) | 0 (0.0%) |
| $25,000 to $49,999 | 204 (98.1%) | 4 (1.9%) |
| $50,000 to $74,999 | 207 (98.6%) | 3 (1.4%) |
| $75,000 to $99,999 | 146 (96.1%) | 6 (4.0%) |
| $100,000 and over | 284 (100.0%) | 0 (0.0%) |
Public vs Private Health Insurance Coverage by Age in Sherburn
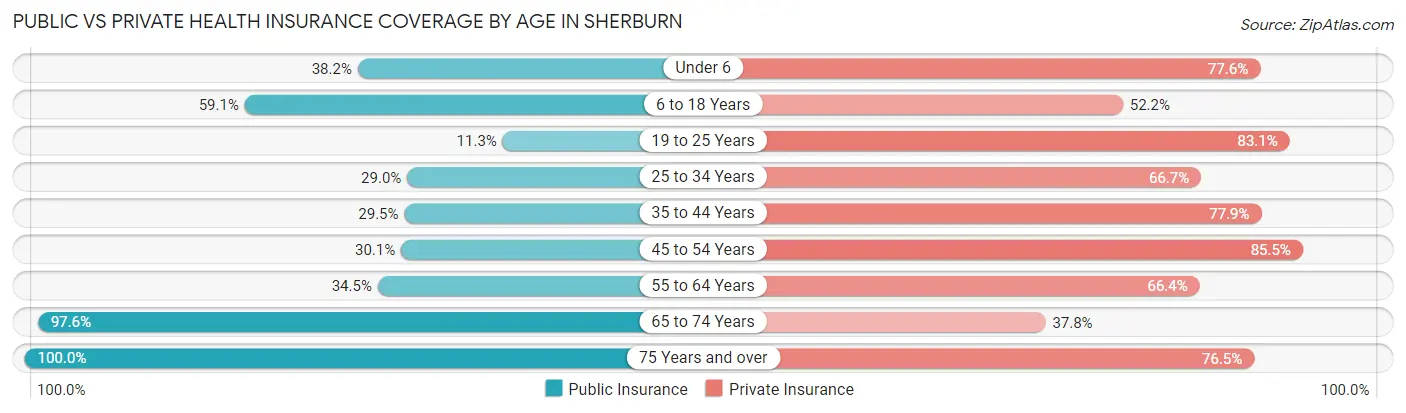
| Age Bracket | Public Insurance | Private Insurance |
| Under 6 | 29 (38.2%) | 59 (77.6%) |
| 6 to 18 Years | 110 (59.1%) | 97 (52.1%) |
| 19 to 25 Years | 8 (11.3%) | 59 (83.1%) |
| 25 to 34 Years | 20 (29.0%) | 46 (66.7%) |
| 35 to 44 Years | 36 (29.5%) | 95 (77.9%) |
| 45 to 54 Years | 25 (30.1%) | 71 (85.5%) |
| 55 to 64 Years | 41 (34.4%) | 79 (66.4%) |
| 65 to 74 Years | 160 (97.6%) | 62 (37.8%) |
| 75 Years and over | 115 (100.0%) | 88 (76.5%) |
| Total | 544 (54.1%) | 656 (65.3%) |
Disability Status by Sex by Age in Sherburn
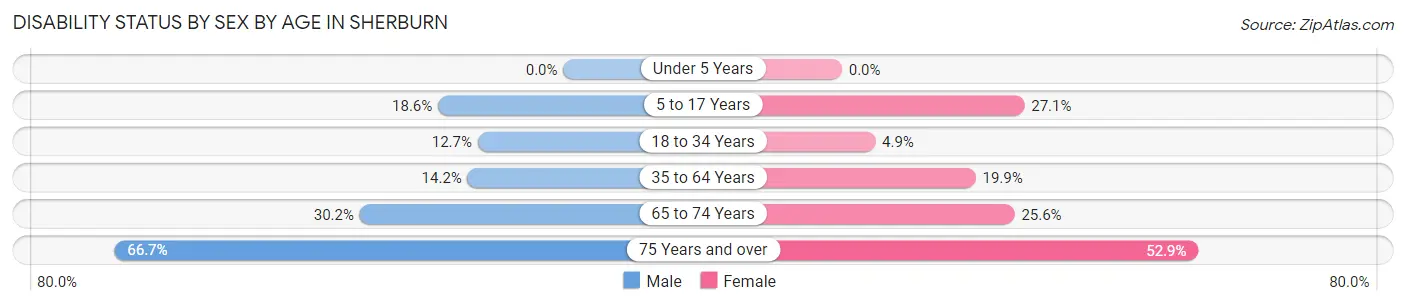
| Age Bracket | Male | Female |
| Under 5 Years | 0 (0.0%) | 0 (0.0%) |
| 5 to 17 Years | 16 (18.6%) | 29 (27.1%) |
| 18 to 34 Years | 8 (12.7%) | 4 (4.9%) |
| 35 to 64 Years | 26 (14.2%) | 28 (19.9%) |
| 65 to 74 Years | 26 (30.2%) | 20 (25.6%) |
| 75 Years and over | 20 (66.7%) | 45 (52.9%) |
Disability Class by Sex by Age in Sherburn
Disability Class: Hearing Difficulty
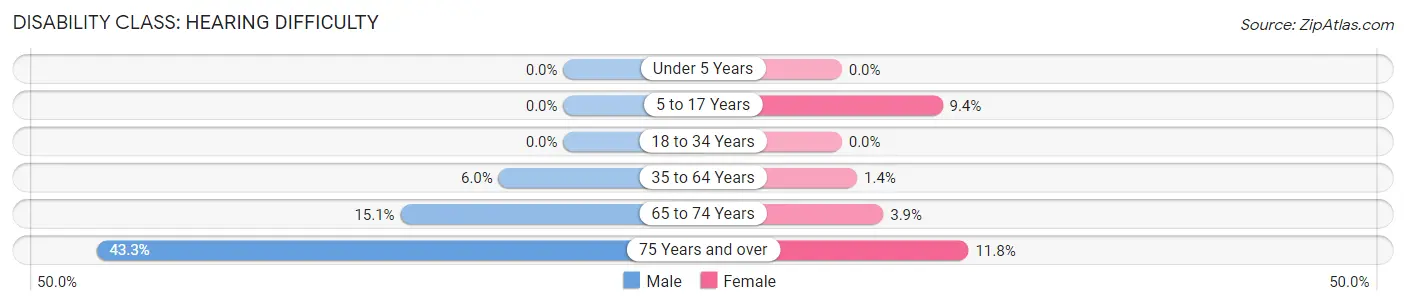
| Age Bracket | Male | Female |
| Under 5 Years | 0 (0.0%) | 0 (0.0%) |
| 5 to 17 Years | 0 (0.0%) | 10 (9.3%) |
| 18 to 34 Years | 0 (0.0%) | 0 (0.0%) |
| 35 to 64 Years | 11 (6.0%) | 2 (1.4%) |
| 65 to 74 Years | 13 (15.1%) | 3 (3.8%) |
| 75 Years and over | 13 (43.3%) | 10 (11.8%) |
Disability Class: Vision Difficulty
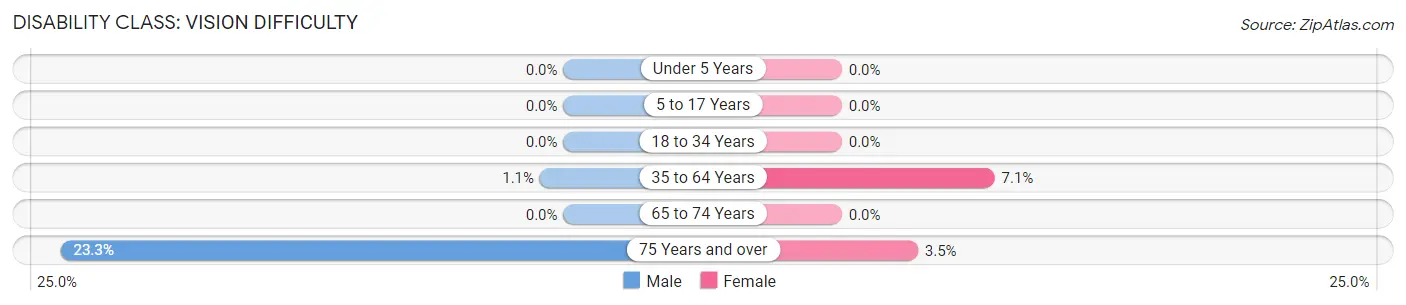
| Age Bracket | Male | Female |
| Under 5 Years | 0 (0.0%) | 0 (0.0%) |
| 5 to 17 Years | 0 (0.0%) | 0 (0.0%) |
| 18 to 34 Years | 0 (0.0%) | 0 (0.0%) |
| 35 to 64 Years | 2 (1.1%) | 10 (7.1%) |
| 65 to 74 Years | 0 (0.0%) | 0 (0.0%) |
| 75 Years and over | 7 (23.3%) | 3 (3.5%) |
Disability Class: Cognitive Difficulty
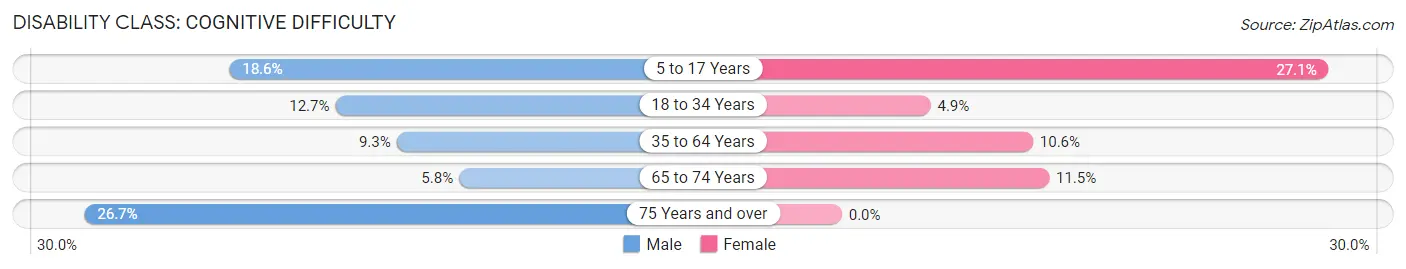
| Age Bracket | Male | Female |
| 5 to 17 Years | 16 (18.6%) | 29 (27.1%) |
| 18 to 34 Years | 8 (12.7%) | 4 (4.9%) |
| 35 to 64 Years | 17 (9.3%) | 15 (10.6%) |
| 65 to 74 Years | 5 (5.8%) | 9 (11.5%) |
| 75 Years and over | 8 (26.7%) | 0 (0.0%) |
Disability Class: Ambulatory Difficulty
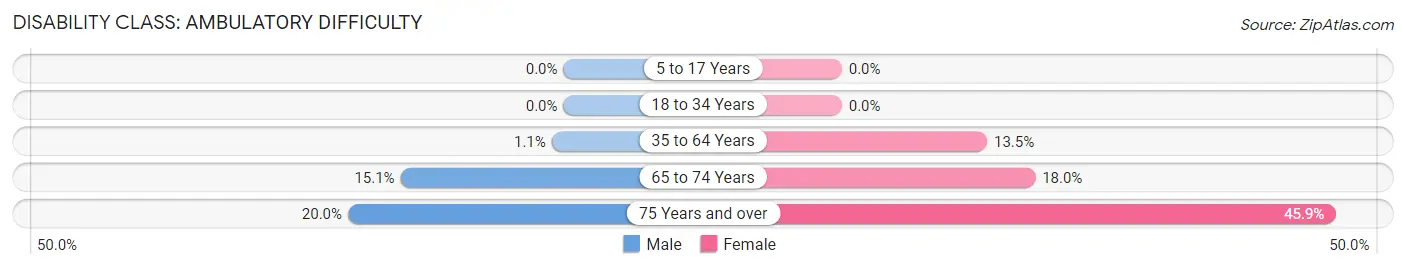
| Age Bracket | Male | Female |
| 5 to 17 Years | 0 (0.0%) | 0 (0.0%) |
| 18 to 34 Years | 0 (0.0%) | 0 (0.0%) |
| 35 to 64 Years | 2 (1.1%) | 19 (13.5%) |
| 65 to 74 Years | 13 (15.1%) | 14 (17.9%) |
| 75 Years and over | 6 (20.0%) | 39 (45.9%) |
Disability Class: Self-Care Difficulty
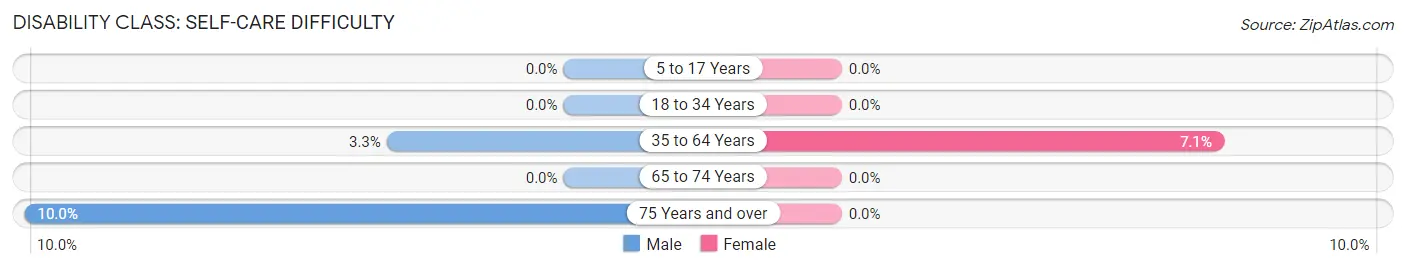
| Age Bracket | Male | Female |
| 5 to 17 Years | 0 (0.0%) | 0 (0.0%) |
| 18 to 34 Years | 0 (0.0%) | 0 (0.0%) |
| 35 to 64 Years | 6 (3.3%) | 10 (7.1%) |
| 65 to 74 Years | 0 (0.0%) | 0 (0.0%) |
| 75 Years and over | 3 (10.0%) | 0 (0.0%) |
Technology Access in Sherburn
Computing Device Access in Sherburn
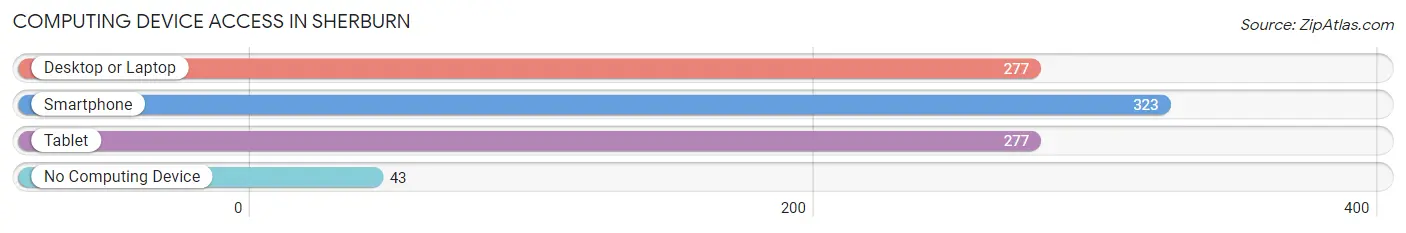
| Device Type | # Households | % Households |
| Desktop or Laptop | 277 | 66.7% |
| Smartphone | 323 | 77.8% |
| Tablet | 277 | 66.7% |
| No Computing Device | 43 | 10.4% |
| Total | 415 | 100.0% |
Internet Access in Sherburn
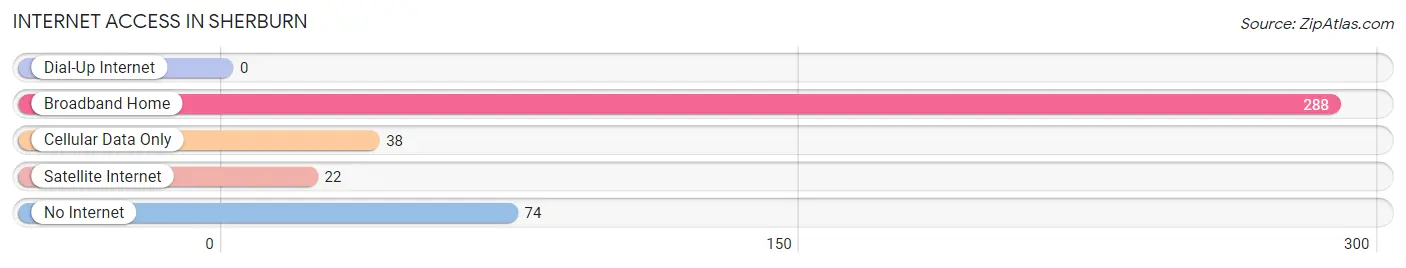
| Internet Type | # Households | % Households |
| Dial-Up Internet | 0 | 0.0% |
| Broadband Home | 288 | 69.4% |
| Cellular Data Only | 38 | 9.2% |
| Satellite Internet | 22 | 5.3% |
| No Internet | 74 | 17.8% |
| Total | 415 | 100.0% |
Sherburn Summary
Sherburn, Minnesota is a small city located in Martin County, in the south-central part of the state. It is situated on the banks of the Des Moines River, and is part of the Mankato-North Mankato Metropolitan Statistical Area. The city has a population of 1,541, according to the 2010 census.
History
Sherburn was founded in 1871 by a group of settlers from Wisconsin. The city was named after the nearby Sherburne County, which was named after General Isaac Sherburne, a Revolutionary War veteran. The city was incorporated in 1887.
In the early 1900s, Sherburn was a thriving agricultural community, with a population of over 1,000. The city was home to several businesses, including a flour mill, a creamery, a lumber yard, and a brickyard.
In the 1950s, the city began to decline as the population shifted to larger cities. The city's population dropped to just over 1,000 by the 1970s.
Geography
Sherburn is located in Martin County, in the south-central part of Minnesota. It is situated on the banks of the Des Moines River, and is part of the Mankato-North Mankato Metropolitan Statistical Area. The city has a total area of 1.2 square miles, all of which is land.
The city is located in a rural area, with rolling hills and farmland. The climate is humid continental, with cold winters and hot, humid summers.
Economy
The economy of Sherburn is largely based on agriculture. The city is home to several farms, which produce corn, soybeans, and other crops. The city also has a few small businesses, including a grocery store, a hardware store, and a restaurant.
The city is also home to a few manufacturing companies, including a plastics manufacturer and a metal fabrication company.
Demographics
According to the 2010 census, the population of Sherburn was 1,541. The racial makeup of the city was 97.3% White, 0.3% African American, 0.2% Native American, 0.2% Asian, 0.1% Pacific Islander, 0.7% from other races, and 1.2% from two or more races. Hispanic or Latino of any race were 1.7% of the population.
The median household income in the city was $41,250, and the median family income was $48,750. The per capita income was $19,945. About 8.3% of families and 10.2% of the population were below the poverty line, including 13.2% of those under age 18 and 8.2% of those age 65 or over.
Common Questions
What is Per Capita Income in Sherburn?
Per Capita income in Sherburn is $29,211.
What is the Median Family Income in Sherburn?
Median Family Income in Sherburn is $75,833.
What is the Median Household income in Sherburn?
Median Household Income in Sherburn is $59,844.
What is Income or Wage Gap in Sherburn?
Income or Wage Gap in Sherburn is 34.2%.
Women in Sherburn earn 65.8 cents for every dollar earned by a man.
What is Inequality or Gini Index in Sherburn?
Inequality or Gini Index in Sherburn is 0.39.
What is the Total Population of Sherburn?
Total Population of Sherburn is 1,035.
What is the Total Male Population of Sherburn?
Total Male Population of Sherburn is 482.
What is the Total Female Population of Sherburn?
Total Female Population of Sherburn is 553.
What is the Ratio of Males per 100 Females in Sherburn?
There are 87.16 Males per 100 Females in Sherburn.
What is the Ratio of Females per 100 Males in Sherburn?
There are 114.73 Females per 100 Males in Sherburn.
What is the Median Population Age in Sherburn?
Median Population Age in Sherburn is 44.5 Years.
What is the Average Family Size in Sherburn
Average Family Size in Sherburn is 2.9 People.
What is the Average Household Size in Sherburn
Average Household Size in Sherburn is 2.4 People.
How Large is the Labor Force in Sherburn?
There are 499 People in the Labor Forcein in Sherburn.
What is the Percentage of People in the Labor Force in Sherburn?
61.1% of People are in the Labor Force in Sherburn.
What is the Unemployment Rate in Sherburn?
Unemployment Rate in Sherburn is 7.0%.