Silver Bay, MN Map & Demographics
Silver Bay Map
Silver Bay Overview
$41,880
PER CAPITA INCOME
$94,318
AVG FAMILY INCOME
$65,882
AVG HOUSEHOLD INCOME
16.7%
WAGE / INCOME GAP [ % ]
83.3¢/ $1
WAGE / INCOME GAP [ $ ]
0.44
INEQUALITY / GINI INDEX
1,690
TOTAL POPULATION
799
MALE POPULATION
891
FEMALE POPULATION
89.67
MALES / 100 FEMALES
111.51
FEMALES / 100 MALES
48.7
MEDIAN AGE
2.5
AVG FAMILY SIZE
1.9
AVG HOUSEHOLD SIZE
736
LABOR FORCE [ PEOPLE ]
53.4%
PERCENT IN LABOR FORCE
3.9%
UNEMPLOYMENT RATE
Silver Bay Zip Codes
Silver Bay Area Codes
Income in Silver Bay
Income Overview in Silver Bay
Per Capita Income in Silver Bay is $41,880, while median incomes of families and households are $94,318 and $65,882 respectively.
| Characteristic | Number | Measure |
| Per Capita Income | 1,690 | $41,880 |
| Median Family Income | 480 | $94,318 |
| Mean Family Income | 480 | $100,099 |
| Median Household Income | 826 | $65,882 |
| Mean Household Income | 826 | $79,234 |
| Income Deficit | 480 | $0 |
| Wage / Income Gap (%) | 1,690 | 16.70% |
| Wage / Income Gap ($) | 1,690 | 83.30¢ per $1 |
| Gini / Inequality Index | 1,690 | 0.44 |
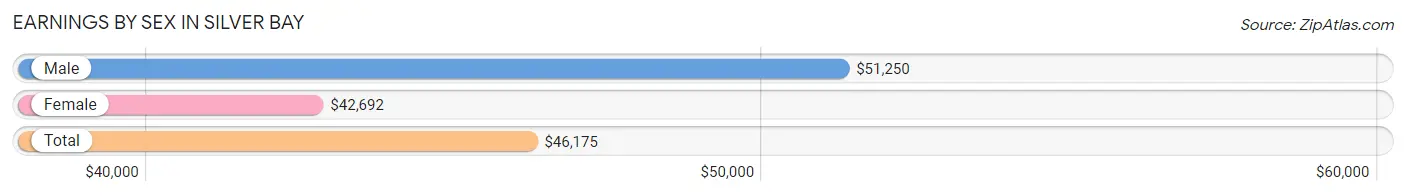
Earnings by Sex in Silver Bay
Average Earnings in Silver Bay are $46,175, $51,250 for men and $42,692 for women, a difference of 16.7%.
| Sex | Number | Average Earnings |
| Male | 411 (50.1%) | $51,250 |
| Female | 410 (49.9%) | $42,692 |
| Total | 821 (100.0%) | $46,175 |
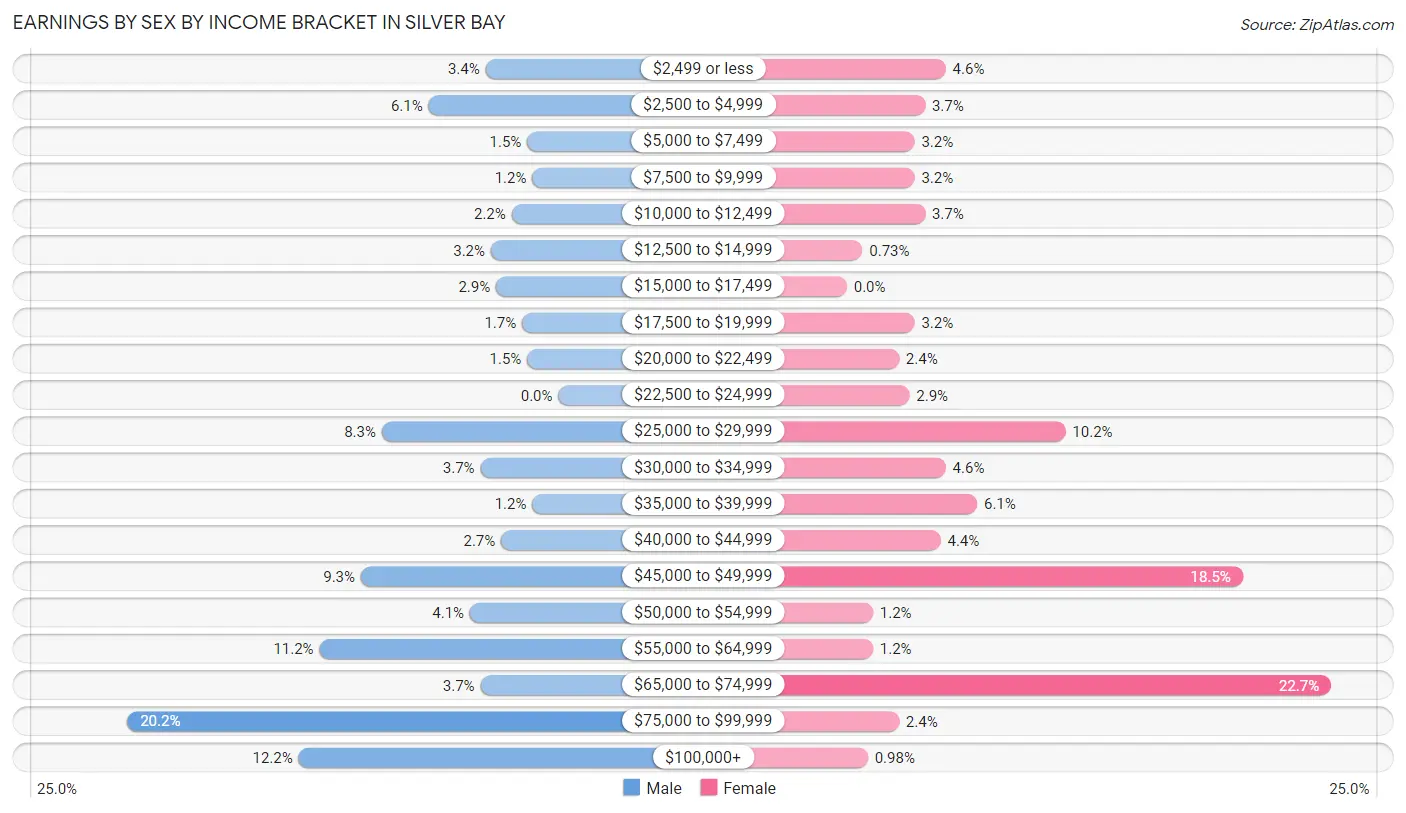
Earnings by Sex by Income Bracket in Silver Bay
The most common earnings brackets in Silver Bay are $75,000 to $99,999 for men (83 | 20.2%) and $65,000 to $74,999 for women (93 | 22.7%).
| Income | Male | Female |
| $2,499 or less | 14 (3.4%) | 19 (4.6%) |
| $2,500 to $4,999 | 25 (6.1%) | 15 (3.7%) |
| $5,000 to $7,499 | 6 (1.5%) | 13 (3.2%) |
| $7,500 to $9,999 | 5 (1.2%) | 13 (3.2%) |
| $10,000 to $12,499 | 9 (2.2%) | 15 (3.7%) |
| $12,500 to $14,999 | 13 (3.2%) | 3 (0.7%) |
| $15,000 to $17,499 | 12 (2.9%) | 0 (0.0%) |
| $17,500 to $19,999 | 7 (1.7%) | 13 (3.2%) |
| $20,000 to $22,499 | 6 (1.5%) | 10 (2.4%) |
| $22,500 to $24,999 | 0 (0.0%) | 12 (2.9%) |
| $25,000 to $29,999 | 34 (8.3%) | 42 (10.2%) |
| $30,000 to $34,999 | 15 (3.6%) | 19 (4.6%) |
| $35,000 to $39,999 | 5 (1.2%) | 25 (6.1%) |
| $40,000 to $44,999 | 11 (2.7%) | 18 (4.4%) |
| $45,000 to $49,999 | 38 (9.2%) | 76 (18.5%) |
| $50,000 to $54,999 | 17 (4.1%) | 5 (1.2%) |
| $55,000 to $64,999 | 46 (11.2%) | 5 (1.2%) |
| $65,000 to $74,999 | 15 (3.6%) | 93 (22.7%) |
| $75,000 to $99,999 | 83 (20.2%) | 10 (2.4%) |
| $100,000+ | 50 (12.2%) | 4 (1.0%) |
| Total | 411 (100.0%) | 410 (100.0%) |
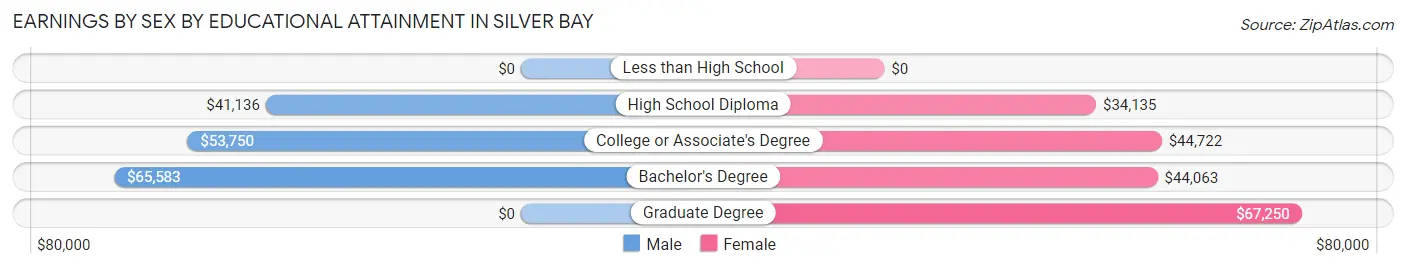
Earnings by Sex by Educational Attainment in Silver Bay
Average earnings in Silver Bay are $59,167 for men and $39,205 for women, a difference of 33.7%. Men with an educational attainment of bachelor's degree enjoy the highest average annual earnings of $65,583, while those with high school diploma education earn the least with $41,136. Women with an educational attainment of graduate degree earn the most with the average annual earnings of $67,250, while those with high school diploma education have the smallest earnings of $34,135.
| Educational Attainment | Male Income | Female Income |
| Less than High School | - | - |
| High School Diploma | $41,136 | $34,135 |
| College or Associate's Degree | $53,750 | $44,722 |
| Bachelor's Degree | $65,583 | $44,063 |
| Graduate Degree | - | - |
| Total | $59,167 | $39,205 |
Family Income in Silver Bay
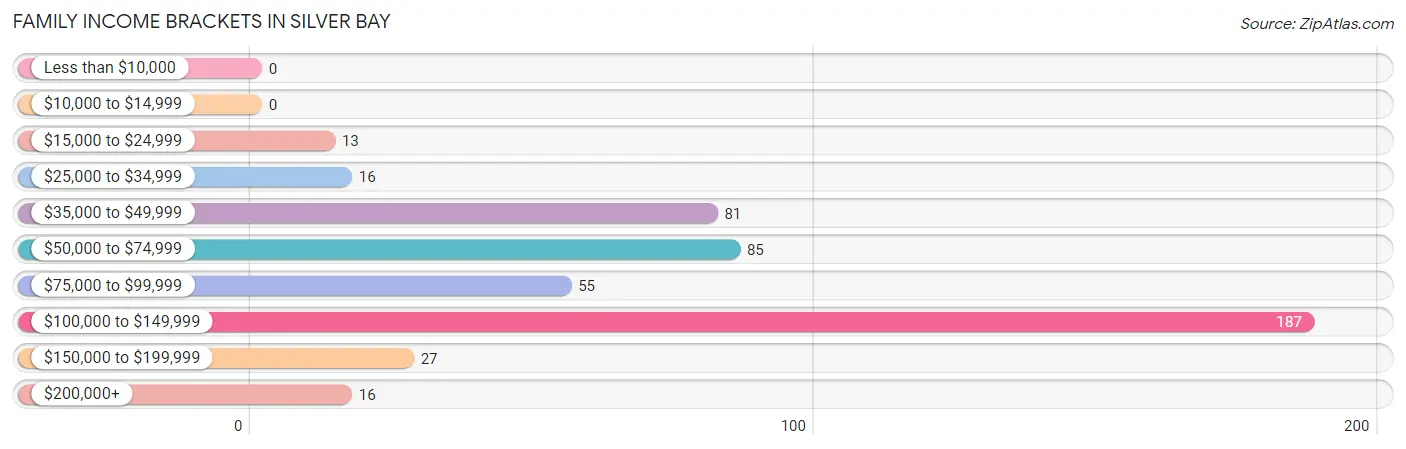
Family Income Brackets in Silver Bay
According to the Silver Bay family income data, there are 187 families falling into the $100,000 to $149,999 income range, which is the most common income bracket and makes up 39.0% of all families.
| Income Bracket | # Families | % Families |
| Less than $10,000 | 0 | 0.0% |
| $10,000 to $14,999 | 0 | 0.0% |
| $15,000 to $24,999 | 13 | 2.7% |
| $25,000 to $34,999 | 16 | 3.3% |
| $35,000 to $49,999 | 81 | 16.9% |
| $50,000 to $74,999 | 85 | 17.7% |
| $75,000 to $99,999 | 55 | 11.5% |
| $100,000 to $149,999 | 187 | 39.0% |
| $150,000 to $199,999 | 27 | 5.6% |
| $200,000+ | 16 | 3.3% |
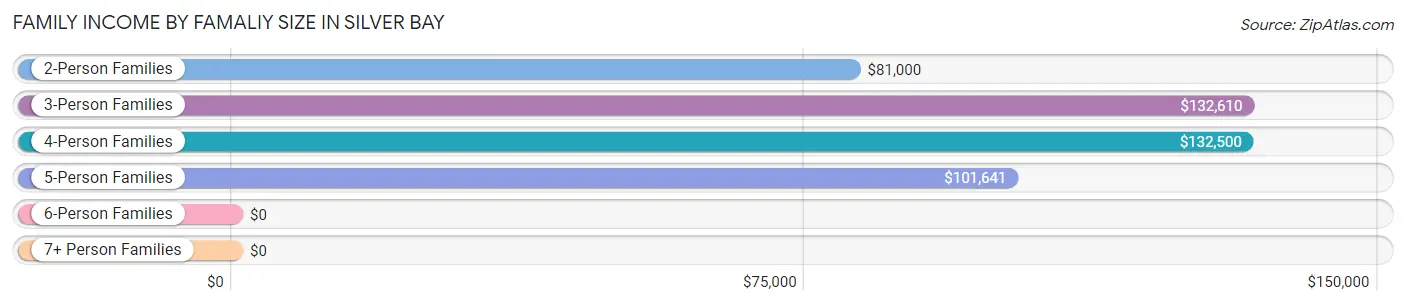
Family Income by Famaliy Size in Silver Bay
3-person families (99 | 20.6%) account for the highest median family income in Silver Bay with $132,610 per family, while 3-person families (99 | 20.6%) have the highest median income of $44,203 per family member.
| Income Bracket | # Families | Median Income |
| 2-Person Families | 298 (62.1%) | $81,000 |
| 3-Person Families | 99 (20.6%) | $132,610 |
| 4-Person Families | 46 (9.6%) | $132,500 |
| 5-Person Families | 27 (5.6%) | $101,641 |
| 6-Person Families | 10 (2.1%) | $0 |
| 7+ Person Families | 0 (0.0%) | $0 |
| Total | 480 (100.0%) | $94,318 |
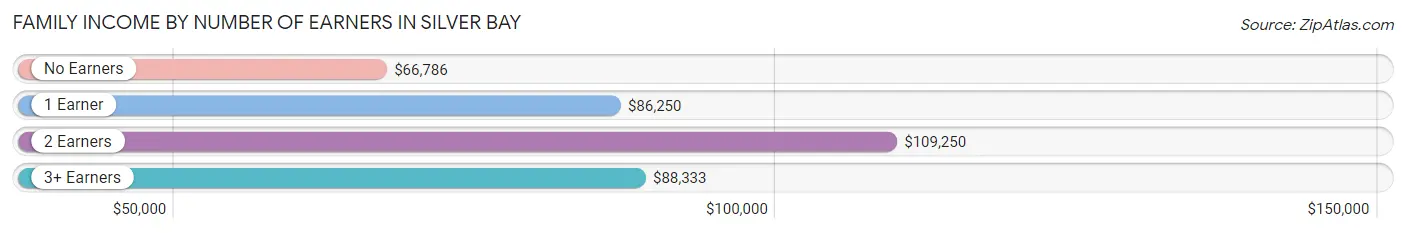
Family Income by Number of Earners in Silver Bay
The median family income in Silver Bay is $94,318, with families comprising 2 earners (170) having the highest median family income of $109,250, while families with no earners (92) have the lowest median family income of $66,786, accounting for 35.4% and 19.2% of families, respectively.
| Number of Earners | # Families | Median Income |
| No Earners | 92 (19.2%) | $66,786 |
| 1 Earner | 182 (37.9%) | $86,250 |
| 2 Earners | 170 (35.4%) | $109,250 |
| 3+ Earners | 36 (7.5%) | $88,333 |
| Total | 480 (100.0%) | $94,318 |
Household Income in Silver Bay
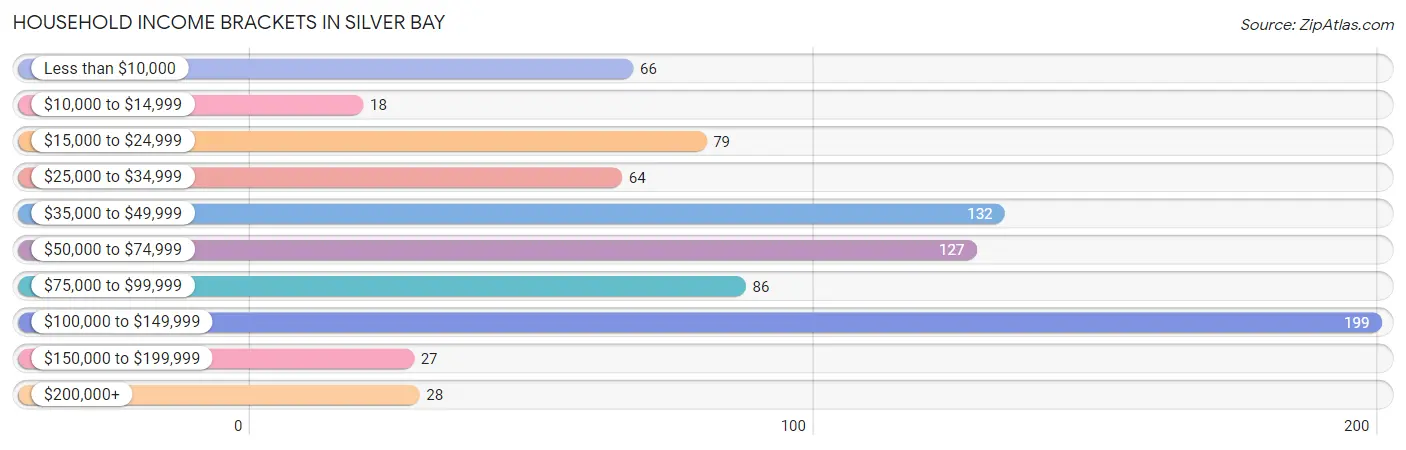
Household Income Brackets in Silver Bay
With 199 households falling in the category, the $100,000 to $149,999 income range is the most frequent in Silver Bay, accounting for 24.1% of all households. In contrast, only 18 households (2.2%) fall into the $10,000 to $14,999 income bracket, making it the least populous group.
| Income Bracket | # Households | % Households |
| Less than $10,000 | 66 | 8.0% |
| $10,000 to $14,999 | 18 | 2.2% |
| $15,000 to $24,999 | 79 | 9.6% |
| $25,000 to $34,999 | 64 | 7.7% |
| $35,000 to $49,999 | 132 | 16.0% |
| $50,000 to $74,999 | 127 | 15.4% |
| $75,000 to $99,999 | 86 | 10.4% |
| $100,000 to $149,999 | 199 | 24.1% |
| $150,000 to $199,999 | 27 | 3.3% |
| $200,000+ | 28 | 3.4% |
Household Income by Householder Age in Silver Bay
The median household income in Silver Bay is $65,882, with the highest median household income of $101,172 found in the 25 to 44 years age bracket for the primary householder. A total of 183 households (22.2%) fall into this category. Meanwhile, the 15 to 24 years age bracket for the primary householder has the lowest median household income of $0, with 45 households (5.4%) in this group.
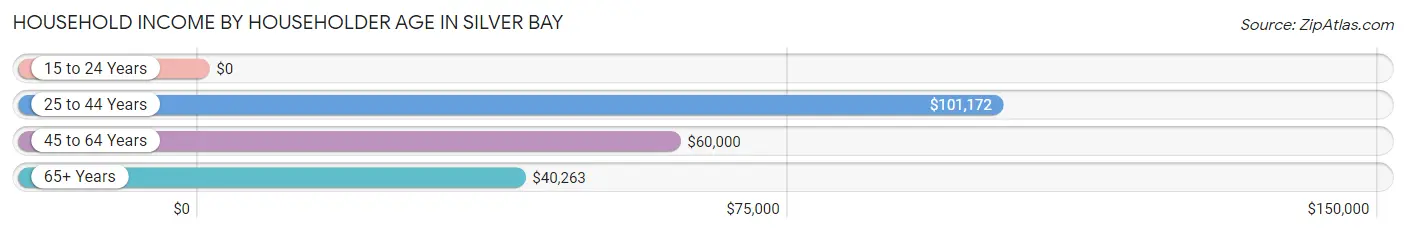
| Income Bracket | # Households | Median Income |
| 15 to 24 Years | 45 (5.4%) | $0 |
| 25 to 44 Years | 183 (22.2%) | $101,172 |
| 45 to 64 Years | 280 (33.9%) | $60,000 |
| 65+ Years | 318 (38.5%) | $40,263 |
| Total | 826 (100.0%) | $65,882 |
Poverty in Silver Bay
Income Below Poverty by Sex and Age in Silver Bay
With 7.3% poverty level for males and 10.0% for females among the residents of Silver Bay, 25 to 34 year old males and 75 year old and over females are the most vulnerable to poverty, with 23 males (21.5%) and 30 females (21.9%) in their respective age groups living below the poverty level.
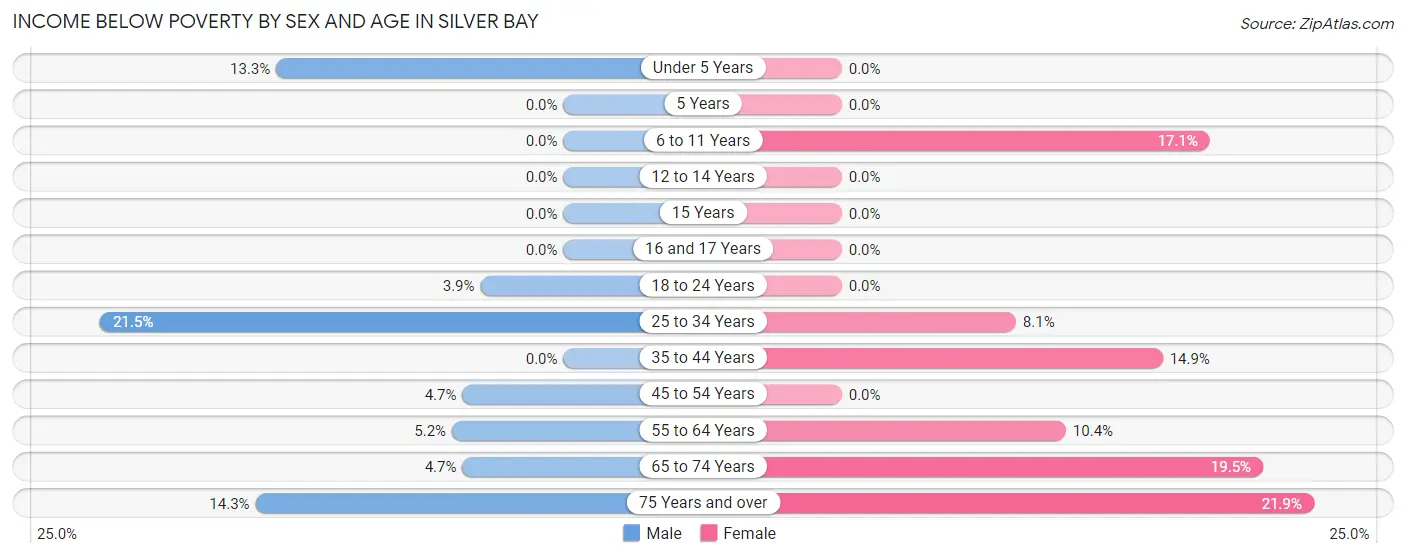
| Age Bracket | Male | Female |
| Under 5 Years | 8 (13.3%) | 0 (0.0%) |
| 5 Years | 0 (0.0%) | 0 (0.0%) |
| 6 to 11 Years | 0 (0.0%) | 7 (17.1%) |
| 12 to 14 Years | 0 (0.0%) | 0 (0.0%) |
| 15 Years | 0 (0.0%) | 0 (0.0%) |
| 16 and 17 Years | 0 (0.0%) | 0 (0.0%) |
| 18 to 24 Years | 2 (3.8%) | 0 (0.0%) |
| 25 to 34 Years | 23 (21.5%) | 8 (8.1%) |
| 35 to 44 Years | 0 (0.0%) | 7 (14.9%) |
| 45 to 54 Years | 3 (4.7%) | 0 (0.0%) |
| 55 to 64 Years | 6 (5.2%) | 13 (10.4%) |
| 65 to 74 Years | 6 (4.7%) | 17 (19.5%) |
| 75 Years and over | 9 (14.3%) | 30 (21.9%) |
| Total | 57 (7.3%) | 82 (10.0%) |
Income Above Poverty by Sex and Age in Silver Bay
According to the poverty statistics in Silver Bay, males aged 6 to 11 years and females aged under 5 years are the age groups that are most secure financially, with 100.0% of males and 100.0% of females in these age groups living above the poverty line.
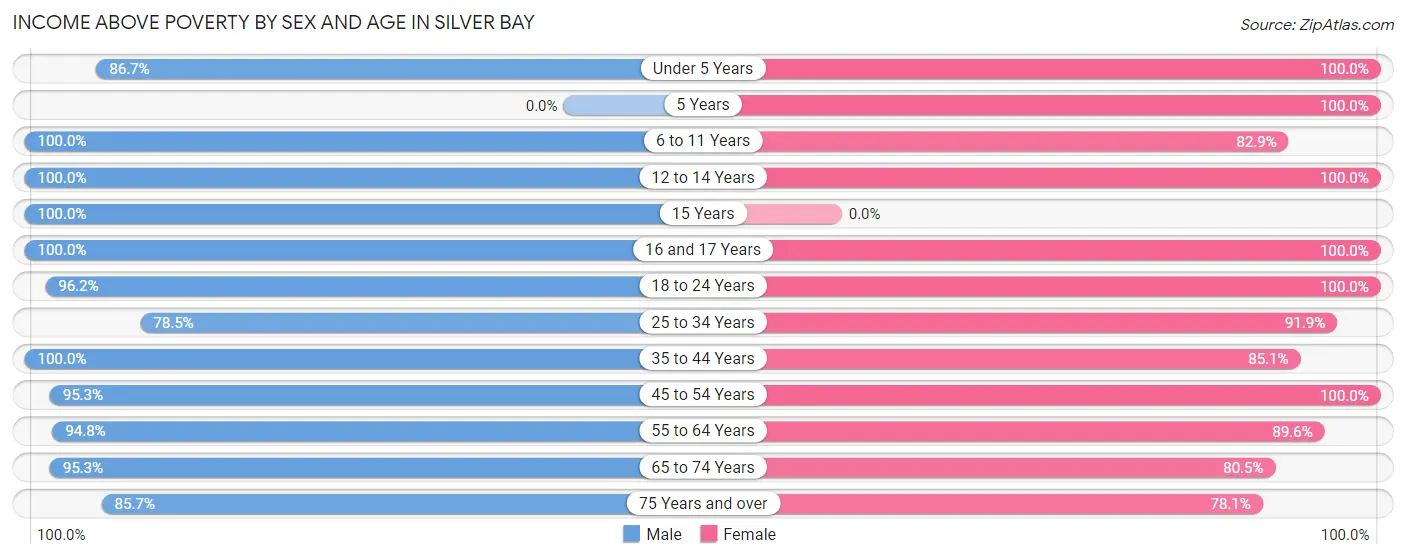
| Age Bracket | Male | Female |
| Under 5 Years | 52 (86.7%) | 49 (100.0%) |
| 5 Years | 0 (0.0%) | 17 (100.0%) |
| 6 to 11 Years | 61 (100.0%) | 34 (82.9%) |
| 12 to 14 Years | 25 (100.0%) | 48 (100.0%) |
| 15 Years | 10 (100.0%) | 0 (0.0%) |
| 16 and 17 Years | 25 (100.0%) | 6 (100.0%) |
| 18 to 24 Years | 50 (96.2%) | 43 (100.0%) |
| 25 to 34 Years | 84 (78.5%) | 91 (91.9%) |
| 35 to 44 Years | 74 (100.0%) | 40 (85.1%) |
| 45 to 54 Years | 61 (95.3%) | 120 (100.0%) |
| 55 to 64 Years | 110 (94.8%) | 112 (89.6%) |
| 65 to 74 Years | 122 (95.3%) | 70 (80.5%) |
| 75 Years and over | 54 (85.7%) | 107 (78.1%) |
| Total | 728 (92.7%) | 737 (90.0%) |
Income Below Poverty Among Married-Couple Families in Silver Bay
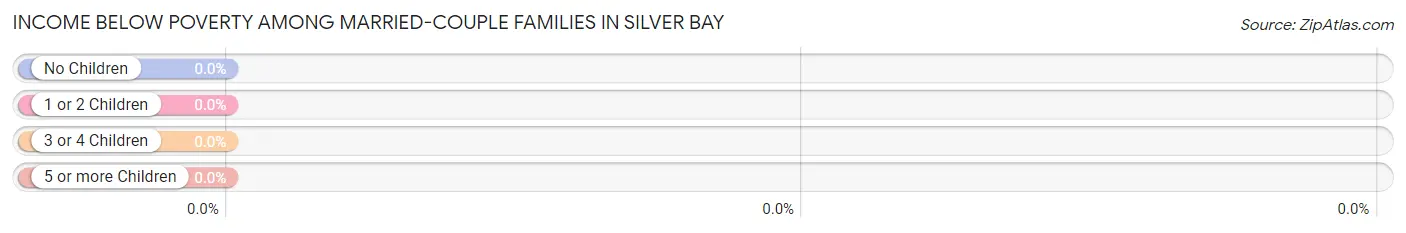
| Children | Above Poverty | Below Poverty |
| No Children | 252 (100.0%) | 0 (0.0%) |
| 1 or 2 Children | 59 (100.0%) | 0 (0.0%) |
| 3 or 4 Children | 29 (100.0%) | 0 (0.0%) |
| 5 or more Children | 0 (0.0%) | 0 (0.0%) |
| Total | 340 (100.0%) | 0 (0.0%) |
Income Below Poverty Among Single-Parent Households in Silver Bay
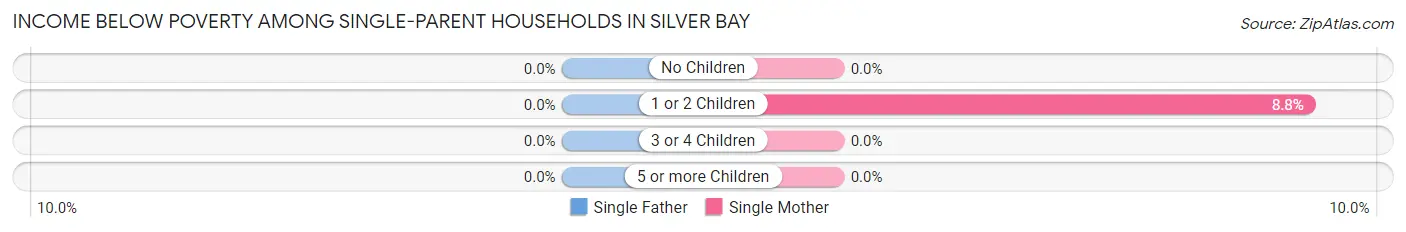
| Children | Single Father | Single Mother |
| No Children | 0 (0.0%) | 0 (0.0%) |
| 1 or 2 Children | 0 (0.0%) | 8 (8.8%) |
| 3 or 4 Children | 0 (0.0%) | 0 (0.0%) |
| 5 or more Children | 0 (0.0%) | 0 (0.0%) |
| Total | 0 (0.0%) | 8 (6.4%) |
Income Below Poverty Among Married-Couple vs Single-Parent Households in Silver Bay
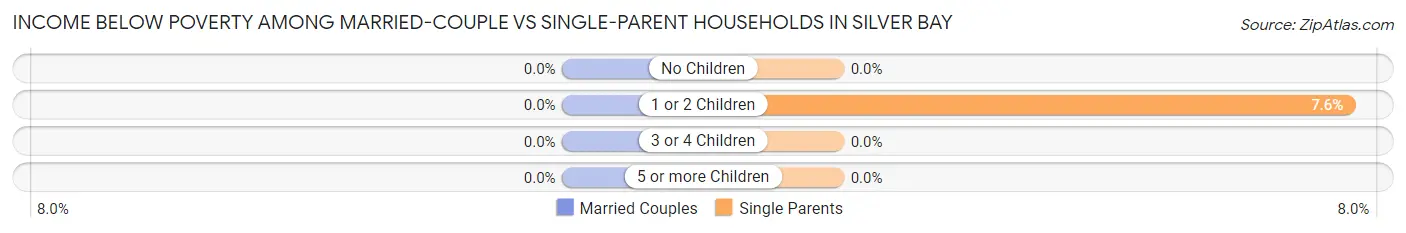
| Children | Married-Couple Families | Single-Parent Households |
| No Children | 0 (0.0%) | 0 (0.0%) |
| 1 or 2 Children | 0 (0.0%) | 8 (7.6%) |
| 3 or 4 Children | 0 (0.0%) | 0 (0.0%) |
| 5 or more Children | 0 (0.0%) | 0 (0.0%) |
| Total | 0 (0.0%) | 8 (5.7%) |
Race in Silver Bay
The most populous races in Silver Bay are White / Caucasian (1,571 | 93.0%), Two or more Races (107 | 6.3%), and Hispanic or Latino (29 | 1.7%).
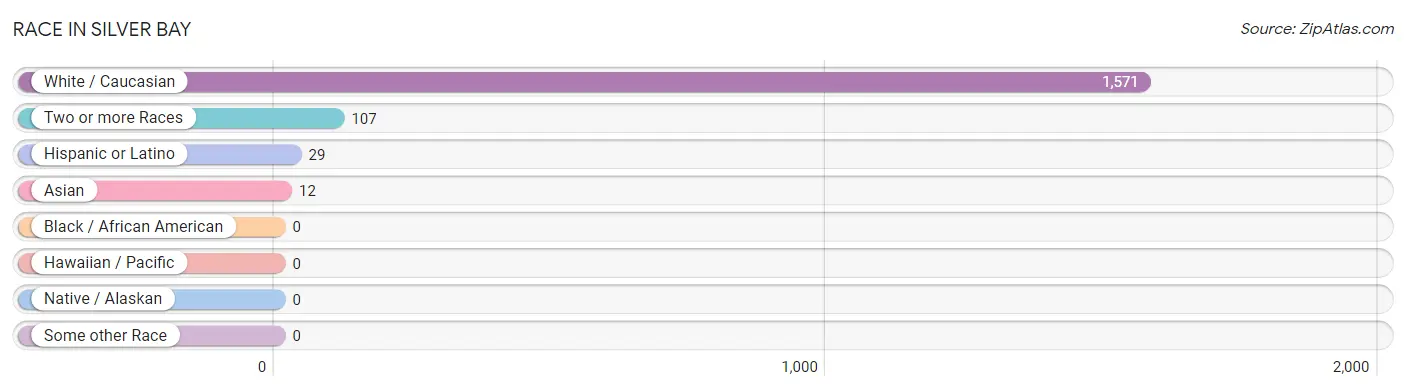
| Race | # Population | % Population |
| Asian | 12 | 0.7% |
| Black / African American | 0 | 0.0% |
| Hawaiian / Pacific | 0 | 0.0% |
| Hispanic or Latino | 29 | 1.7% |
| Native / Alaskan | 0 | 0.0% |
| White / Caucasian | 1,571 | 93.0% |
| Two or more Races | 107 | 6.3% |
| Some other Race | 0 | 0.0% |
| Total | 1,690 | 100.0% |
Ancestry in Silver Bay
The most populous ancestries reported in Silver Bay are German (458 | 27.1%), Norwegian (345 | 20.4%), Irish (256 | 15.1%), Finnish (158 | 9.3%), and Swedish (157 | 9.3%), together accounting for 81.3% of all Silver Bay residents.
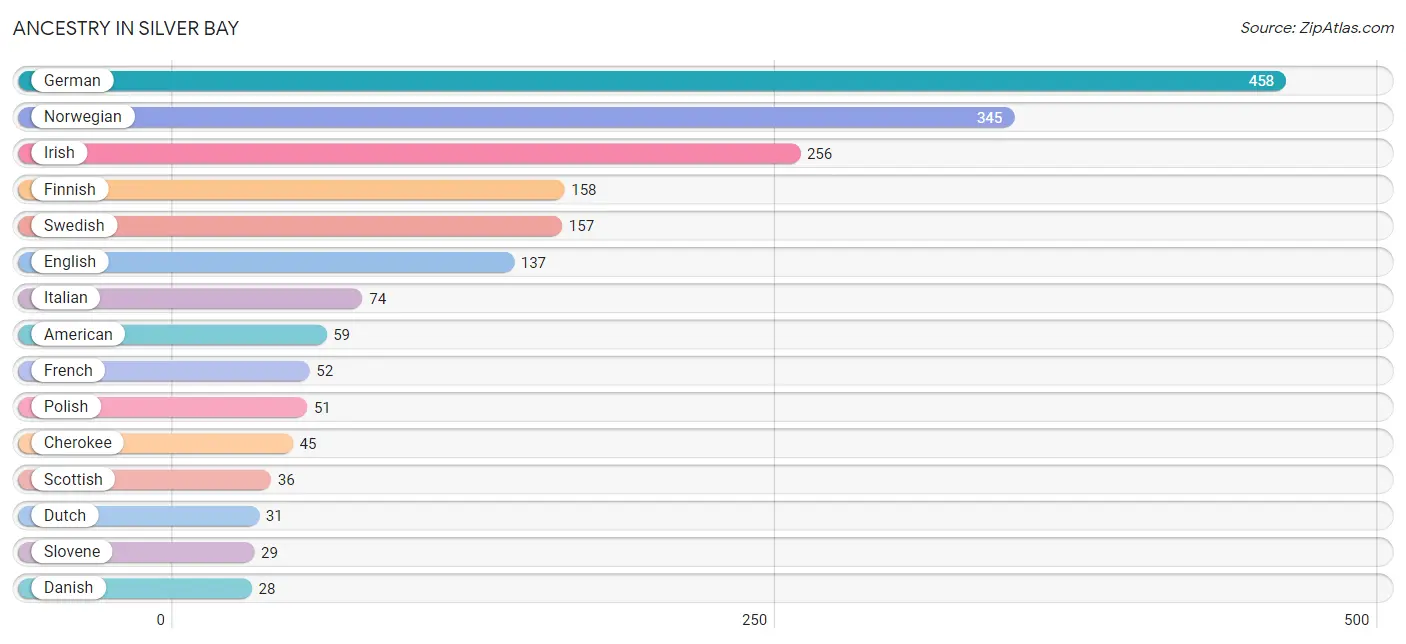
| Ancestry | # Population | % Population |
| African | 23 | 1.4% |
| American | 59 | 3.5% |
| Arab | 6 | 0.4% |
| Austrian | 16 | 0.9% |
| Cherokee | 45 | 2.7% |
| Chippewa | 6 | 0.4% |
| Croatian | 10 | 0.6% |
| Czech | 9 | 0.5% |
| Danish | 28 | 1.7% |
| Dutch | 31 | 1.8% |
| English | 137 | 8.1% |
| Finnish | 158 | 9.3% |
| French | 52 | 3.1% |
| French Canadian | 18 | 1.1% |
| German | 458 | 27.1% |
| Hungarian | 4 | 0.2% |
| Irish | 256 | 15.1% |
| Italian | 74 | 4.4% |
| Korean | 19 | 1.1% |
| Lebanese | 6 | 0.4% |
| Mexican | 19 | 1.1% |
| Norwegian | 345 | 20.4% |
| Polish | 51 | 3.0% |
| Romanian | 3 | 0.2% |
| Scandinavian | 19 | 1.1% |
| Scotch-Irish | 5 | 0.3% |
| Scottish | 36 | 2.1% |
| Slavic | 5 | 0.3% |
| Slovene | 29 | 1.7% |
| Spaniard | 10 | 0.6% |
| Sri Lankan | 7 | 0.4% |
| Subsaharan African | 23 | 1.4% |
| Swedish | 157 | 9.3% |
| Swiss | 8 | 0.5% |
| Ukrainian | 5 | 0.3% |
| Welsh | 18 | 1.1% | View All 36 Rows |
Immigrants in Silver Bay
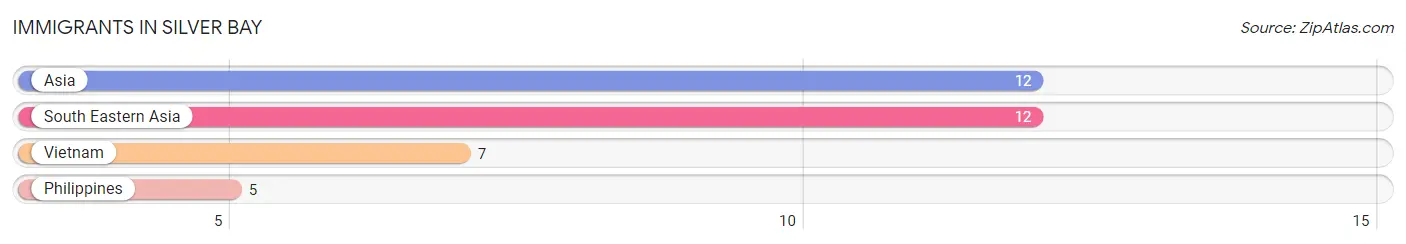
The most numerous immigrant groups reported in Silver Bay came from Asia (12 | 0.7%), South Eastern Asia (12 | 0.7%), Vietnam (7 | 0.4%), and Philippines (5 | 0.3%), together accounting for 2.1% of all Silver Bay residents.
| Immigration Origin | # Population | % Population |
| Asia | 12 | 0.7% |
| Philippines | 5 | 0.3% |
| South Eastern Asia | 12 | 0.7% |
| Vietnam | 7 | 0.4% | View All 4 Rows |
Sex and Age in Silver Bay
Sex and Age in Silver Bay
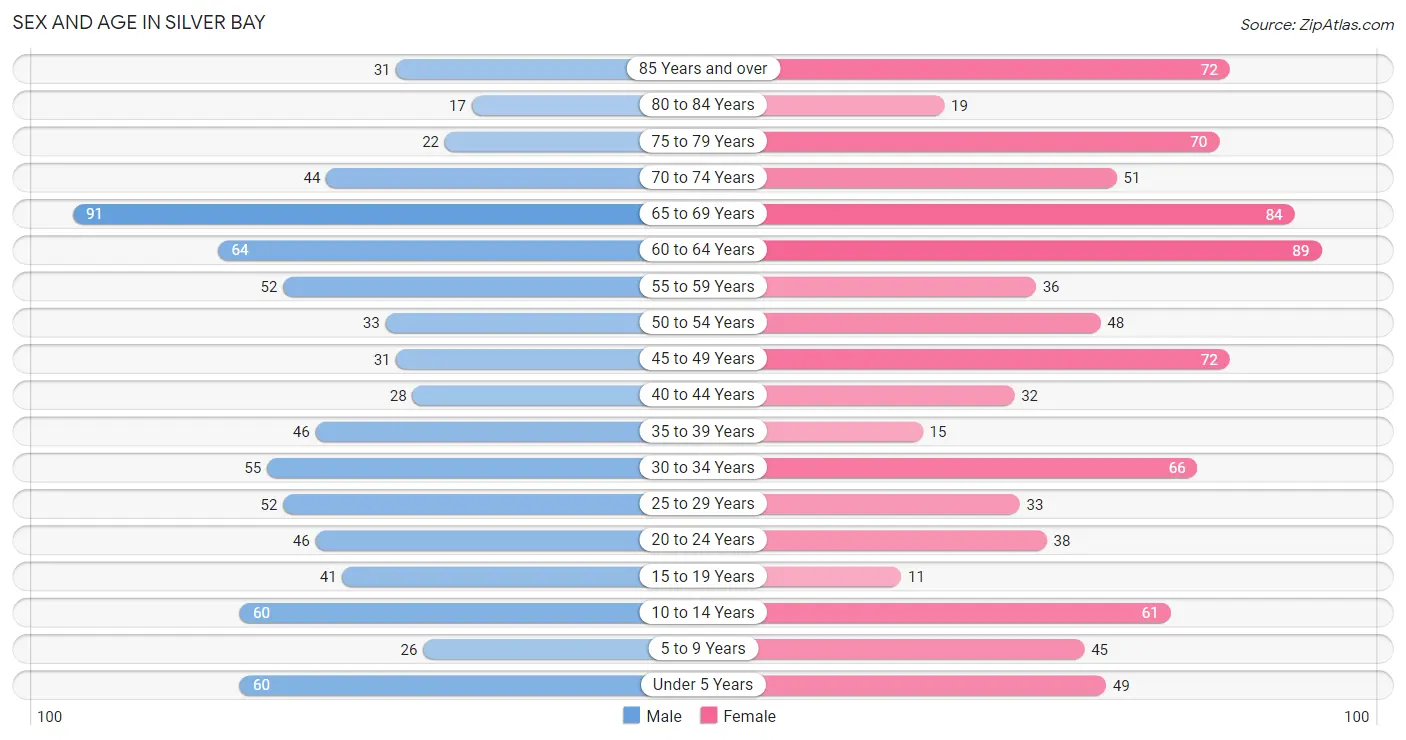
The most populous age groups in Silver Bay are 65 to 69 Years (91 | 11.4%) for men and 60 to 64 Years (89 | 10.0%) for women.
| Age Bracket | Male | Female |
| Under 5 Years | 60 (7.5%) | 49 (5.5%) |
| 5 to 9 Years | 26 (3.3%) | 45 (5.1%) |
| 10 to 14 Years | 60 (7.5%) | 61 (6.9%) |
| 15 to 19 Years | 41 (5.1%) | 11 (1.2%) |
| 20 to 24 Years | 46 (5.8%) | 38 (4.3%) |
| 25 to 29 Years | 52 (6.5%) | 33 (3.7%) |
| 30 to 34 Years | 55 (6.9%) | 66 (7.4%) |
| 35 to 39 Years | 46 (5.8%) | 15 (1.7%) |
| 40 to 44 Years | 28 (3.5%) | 32 (3.6%) |
| 45 to 49 Years | 31 (3.9%) | 72 (8.1%) |
| 50 to 54 Years | 33 (4.1%) | 48 (5.4%) |
| 55 to 59 Years | 52 (6.5%) | 36 (4.0%) |
| 60 to 64 Years | 64 (8.0%) | 89 (10.0%) |
| 65 to 69 Years | 91 (11.4%) | 84 (9.4%) |
| 70 to 74 Years | 44 (5.5%) | 51 (5.7%) |
| 75 to 79 Years | 22 (2.8%) | 70 (7.9%) |
| 80 to 84 Years | 17 (2.1%) | 19 (2.1%) |
| 85 Years and over | 31 (3.9%) | 72 (8.1%) |
| Total | 799 (100.0%) | 891 (100.0%) |
Families and Households in Silver Bay
Median Family Size in Silver Bay
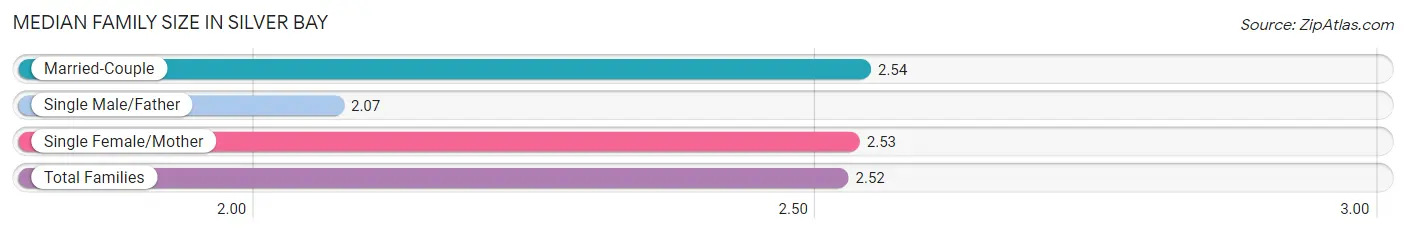
The median family size in Silver Bay is 2.52 persons per family, with married-couple families (340 | 70.8%) accounting for the largest median family size of 2.54 persons per family. On the other hand, single male/father families (14 | 2.9%) represent the smallest median family size with 2.07 persons per family.
| Family Type | # Families | Family Size |
| Married-Couple | 340 (70.8%) | 2.54 |
| Single Male/Father | 14 (2.9%) | 2.07 |
| Single Female/Mother | 126 (26.3%) | 2.53 |
| Total Families | 480 (100.0%) | 2.52 |
Median Household Size in Silver Bay
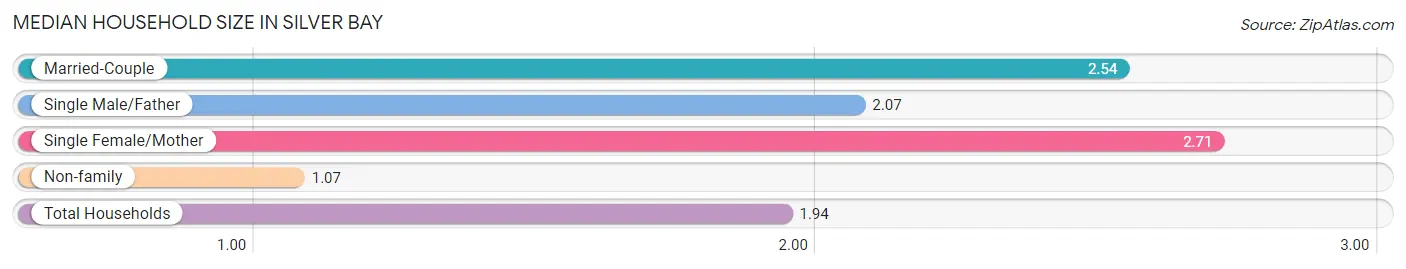
The median household size in Silver Bay is 1.94 persons per household, with single female/mother households (126 | 15.2%) accounting for the largest median household size of 2.71 persons per household. non-family households (346 | 41.9%) represent the smallest median household size with 1.07 persons per household.
| Household Type | # Households | Household Size |
| Married-Couple | 340 (41.2%) | 2.54 |
| Single Male/Father | 14 (1.7%) | 2.07 |
| Single Female/Mother | 126 (15.2%) | 2.71 |
| Non-family | 346 (41.9%) | 1.07 |
| Total Households | 826 (100.0%) | 1.94 |
Household Size by Marriage Status in Silver Bay
Out of a total of 826 households in Silver Bay, 480 (58.1%) are family households, while 346 (41.9%) are nonfamily households. The most numerous type of family households are 2-person households, comprising 298, and the most common type of nonfamily households are 1-person households, comprising 309.
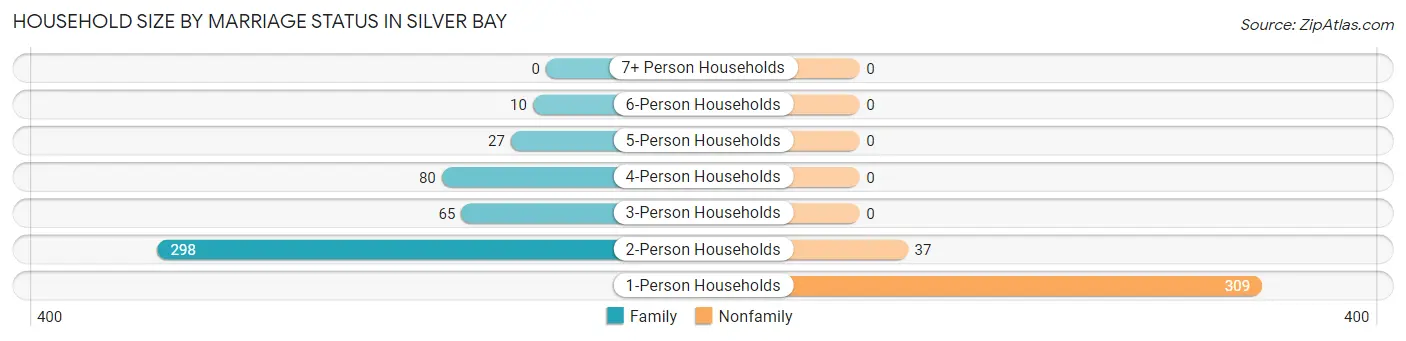
| Household Size | Family Households | Nonfamily Households |
| 1-Person Households | - | 309 (37.4%) |
| 2-Person Households | 298 (36.1%) | 37 (4.5%) |
| 3-Person Households | 65 (7.9%) | 0 (0.0%) |
| 4-Person Households | 80 (9.7%) | 0 (0.0%) |
| 5-Person Households | 27 (3.3%) | 0 (0.0%) |
| 6-Person Households | 10 (1.2%) | 0 (0.0%) |
| 7+ Person Households | 0 (0.0%) | 0 (0.0%) |
| Total | 480 (58.1%) | 346 (41.9%) |
Female Fertility in Silver Bay
Fertility by Age in Silver Bay
Average fertility rate in Silver Bay is 18.0 births per 1,000 women. Women in the age bracket of 20 to 34 years have the highest fertility rate with 36.0 births per 1,000 women. Women in the age bracket of 20 to 34 years acount for 100.0% of all women with births.
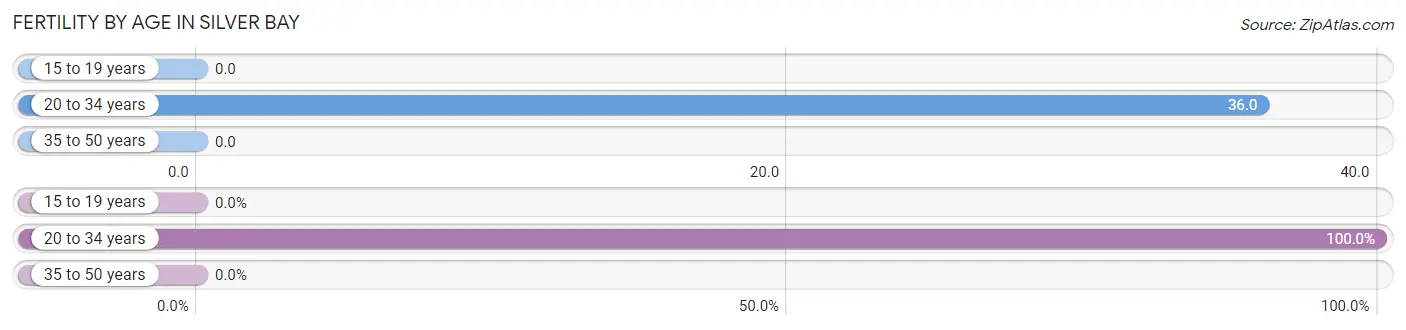
| Age Bracket | Women with Births | Births / 1,000 Women |
| 15 to 19 years | 0 (0.0%) | 0.0 |
| 20 to 34 years | 5 (100.0%) | 36.0 |
| 35 to 50 years | 0 (0.0%) | 0.0 |
| Total | 5 (100.0%) | 18.0 |
Fertility by Age by Marriage Status in Silver Bay
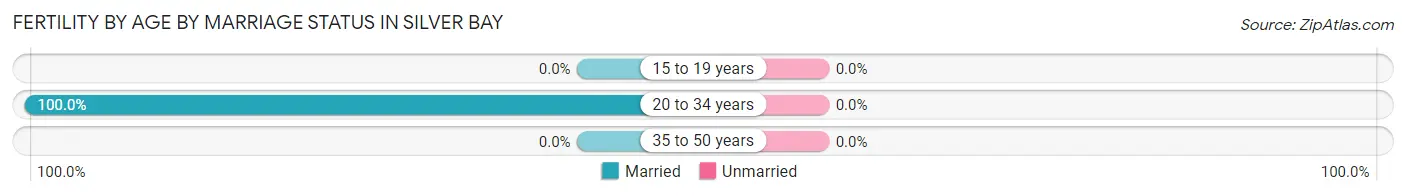
| Age Bracket | Married | Unmarried |
| 15 to 19 years | 0 (0.0%) | 0 (0.0%) |
| 20 to 34 years | 5 (100.0%) | 0 (0.0%) |
| 35 to 50 years | 0 (0.0%) | 0 (0.0%) |
| Total | 5 (100.0%) | 0 (0.0%) |
Fertility by Education in Silver Bay
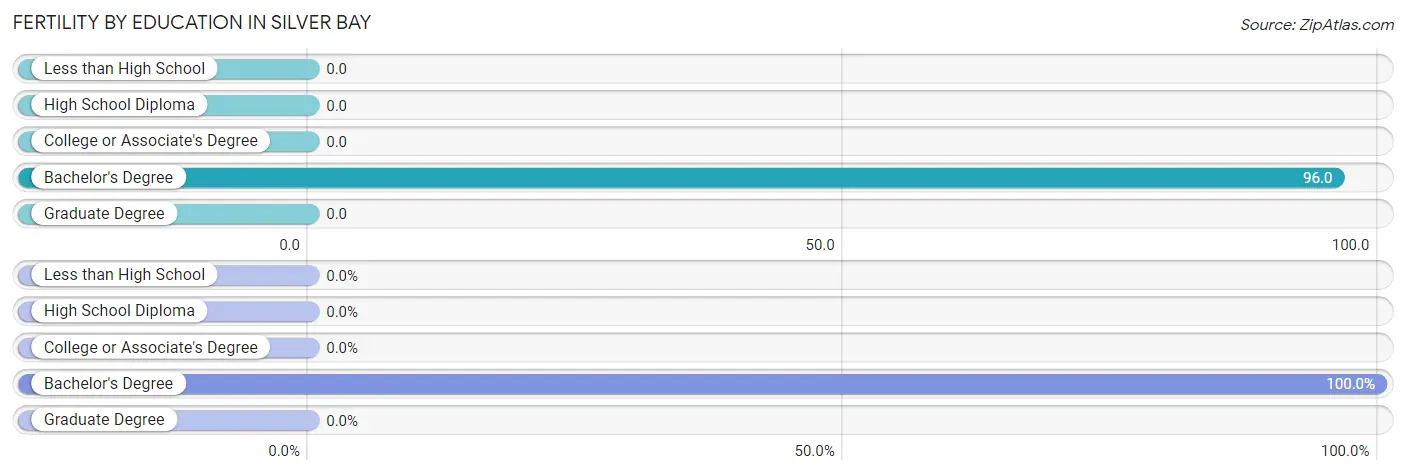
| Educational Attainment | Women with Births | Births / 1,000 Women |
| Less than High School | 0 (0.0%) | 0.0 |
| High School Diploma | 0 (0.0%) | 0.0 |
| College or Associate's Degree | 0 (0.0%) | 0.0 |
| Bachelor's Degree | 5 (100.0%) | 96.0 |
| Graduate Degree | 0 (0.0%) | 0.0 |
| Total | 5 (100.0%) | 18.0 |
Fertility by Education by Marriage Status in Silver Bay
| Educational Attainment | Married | Unmarried |
| Less than High School | 0 (0.0%) | 0 (0.0%) |
| High School Diploma | 0 (0.0%) | 0 (0.0%) |
| College or Associate's Degree | 0 (0.0%) | 0 (0.0%) |
| Bachelor's Degree | 5 (100.0%) | 0 (0.0%) |
| Graduate Degree | 0 (0.0%) | 0 (0.0%) |
| Total | 5 (100.0%) | 0 (0.0%) |
Employment Characteristics in Silver Bay
Employment by Class of Employer in Silver Bay
Among the 702 employed individuals in Silver Bay, private company employees (366 | 52.1%), state government employees (111 | 15.8%), and local government employees (79 | 11.3%) make up the most common classes of employment.
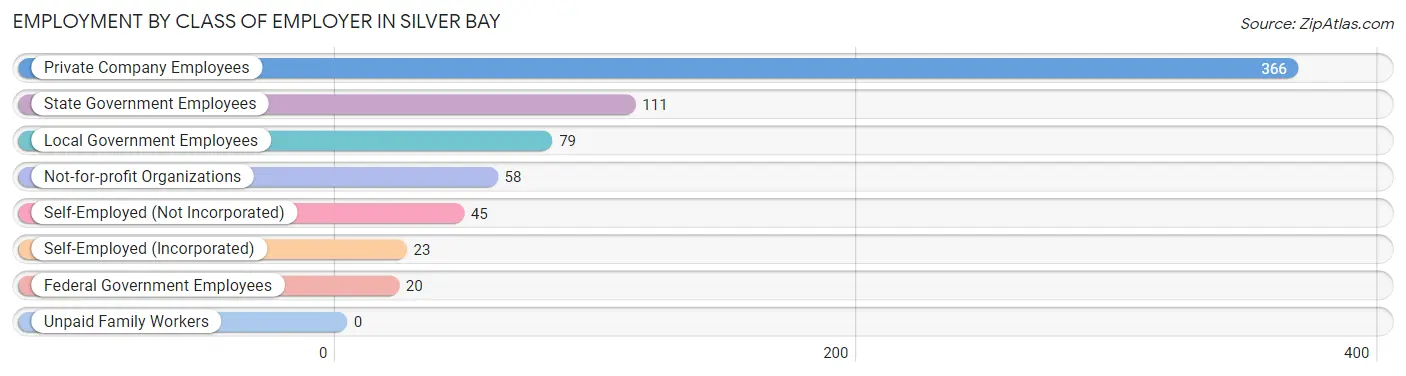
| Employer Class | # Employees | % Employees |
| Private Company Employees | 366 | 52.1% |
| Self-Employed (Incorporated) | 23 | 3.3% |
| Self-Employed (Not Incorporated) | 45 | 6.4% |
| Not-for-profit Organizations | 58 | 8.3% |
| Local Government Employees | 79 | 11.3% |
| State Government Employees | 111 | 15.8% |
| Federal Government Employees | 20 | 2.9% |
| Unpaid Family Workers | 0 | 0.0% |
| Total | 702 | 100.0% |
Employment Status by Age in Silver Bay
According to the labor force statistics for Silver Bay, out of the total population over 16 years of age (1,379), 53.4% or 736 individuals are in the labor force, with 3.9% or 29 of them unemployed. The age group with the highest labor force participation rate is 20 to 24 years, with 100.0% or 84 individuals in the labor force. Within the labor force, the 25 to 29 years age range has the highest percentage of unemployed individuals, with 17.5% or 10 of them being unemployed.
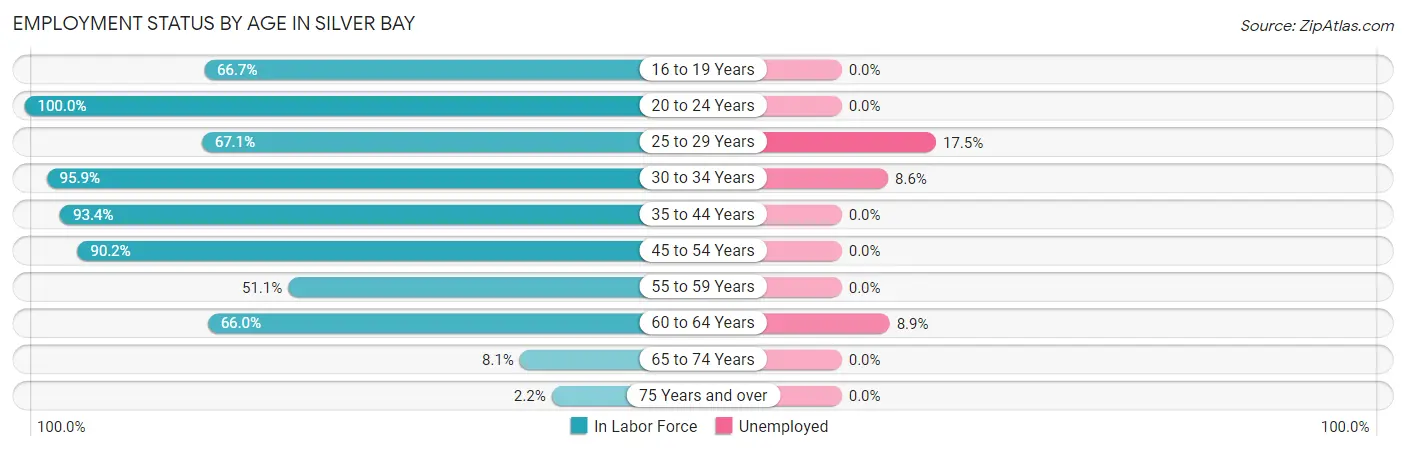
| Age Bracket | In Labor Force | Unemployed |
| 16 to 19 Years | 28 (66.7%) | 0 (0.0%) |
| 20 to 24 Years | 84 (100.0%) | 0 (0.0%) |
| 25 to 29 Years | 57 (67.1%) | 10 (17.5%) |
| 30 to 34 Years | 116 (95.9%) | 10 (8.6%) |
| 35 to 44 Years | 113 (93.4%) | 0 (0.0%) |
| 45 to 54 Years | 166 (90.2%) | 0 (0.0%) |
| 55 to 59 Years | 45 (51.1%) | 0 (0.0%) |
| 60 to 64 Years | 101 (66.0%) | 9 (8.9%) |
| 65 to 74 Years | 22 (8.1%) | 0 (0.0%) |
| 75 Years and over | 5 (2.2%) | 0 (0.0%) |
| Total | 736 (53.4%) | 29 (3.9%) |
Employment Status by Educational Attainment in Silver Bay
According to labor force statistics for Silver Bay, 79.5% of individuals (598) out of the total population between 25 and 64 years of age (752) are in the labor force, with 4.8% or 29 of them being unemployed. The group with the highest labor force participation rate are those with the educational attainment of less than high school, with 100.0% or 25 individuals in the labor force. Within the labor force, individuals with college / associate degree education have the highest percentage of unemployment, with 6.5% or 17 of them being unemployed.
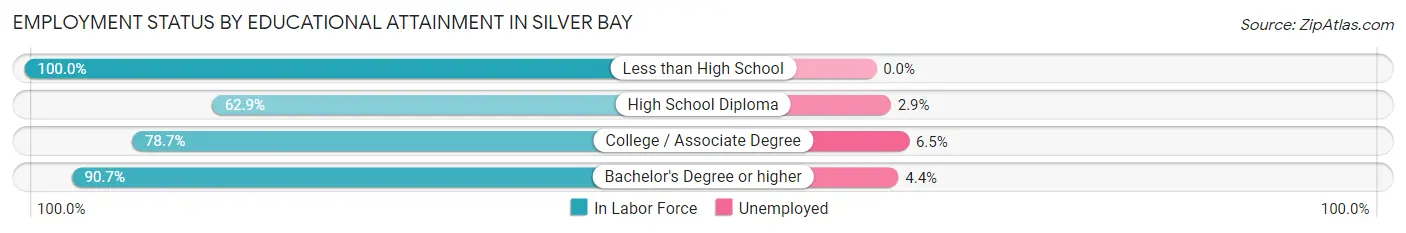
| Educational Attainment | In Labor Force | Unemployed |
| Less than High School | 25 (100.0%) | 0 (0.0%) |
| High School Diploma | 105 (62.9%) | 5 (2.9%) |
| College / Associate Degree | 263 (78.7%) | 22 (6.5%) |
| Bachelor's Degree or higher | 205 (90.7%) | 10 (4.4%) |
| Total | 598 (79.5%) | 36 (4.8%) |
Employment Occupations by Sex in Silver Bay
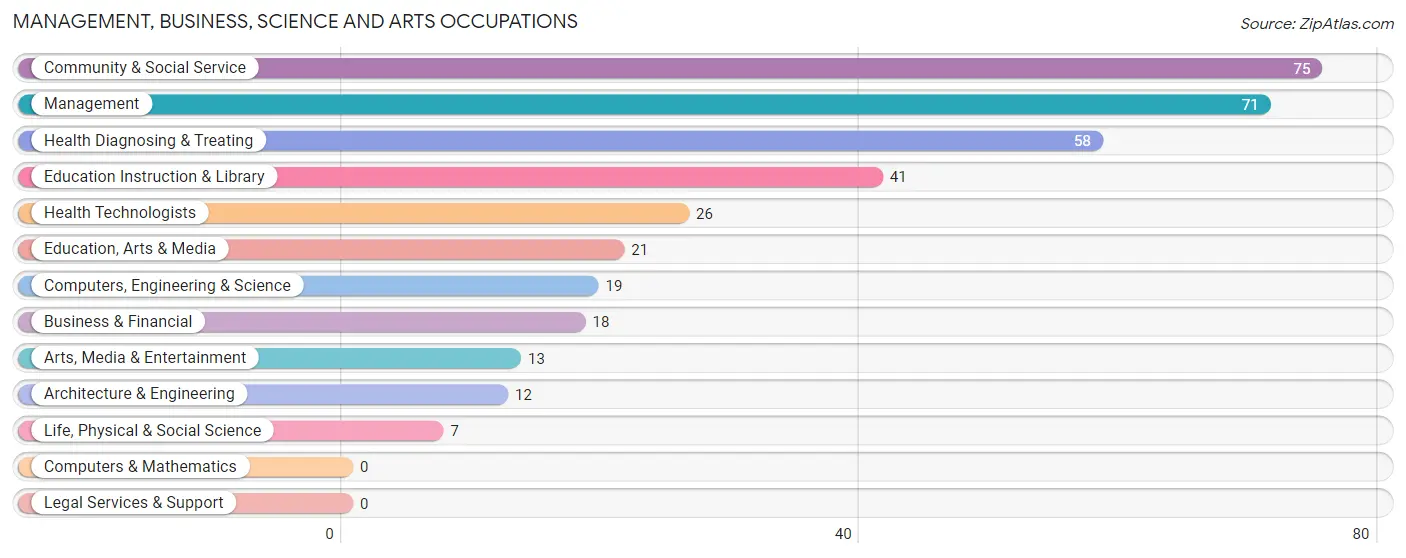
Management, Business, Science and Arts Occupations
The most common Management, Business, Science and Arts occupations in Silver Bay are Community & Social Service (75 | 10.6%), Management (71 | 10.0%), Health Diagnosing & Treating (58 | 8.2%), Education Instruction & Library (41 | 5.8%), and Health Technologists (26 | 3.7%).
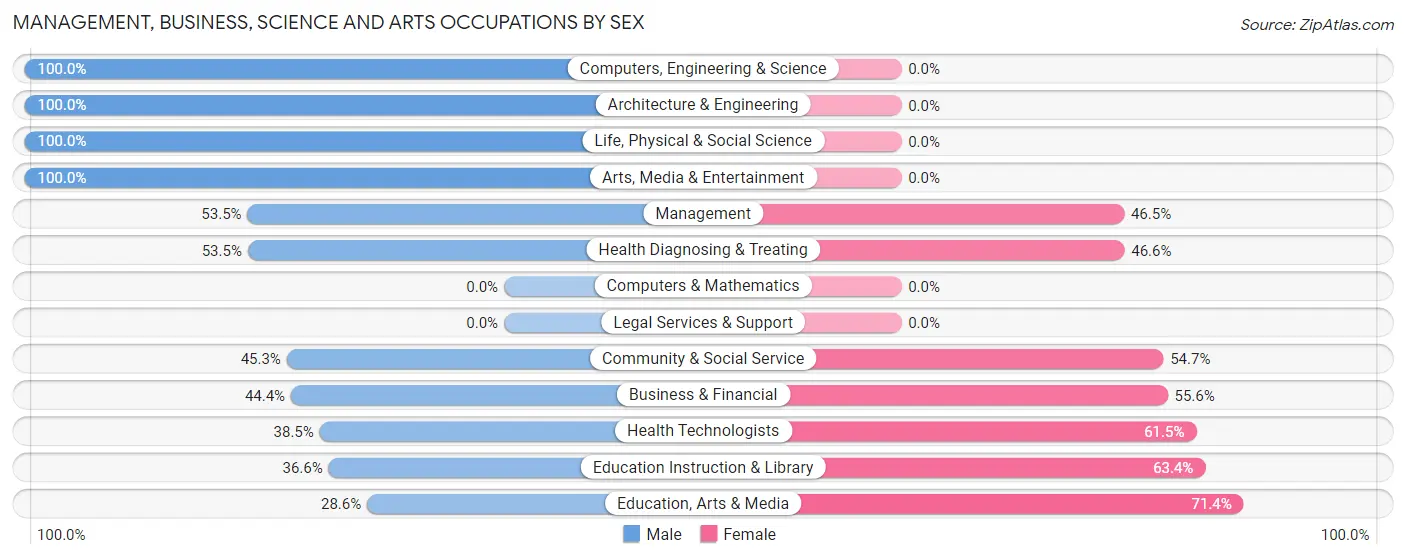
Management, Business, Science and Arts Occupations by Sex
Within the Management, Business, Science and Arts occupations in Silver Bay, the most male-oriented occupations are Computers, Engineering & Science (100.0%), Architecture & Engineering (100.0%), and Life, Physical & Social Science (100.0%), while the most female-oriented occupations are Education, Arts & Media (71.4%), Education Instruction & Library (63.4%), and Health Technologists (61.5%).
| Occupation | Male | Female |
| Management | 38 (53.5%) | 33 (46.5%) |
| Business & Financial | 8 (44.4%) | 10 (55.6%) |
| Computers, Engineering & Science | 19 (100.0%) | 0 (0.0%) |
| Computers & Mathematics | 0 (0.0%) | 0 (0.0%) |
| Architecture & Engineering | 12 (100.0%) | 0 (0.0%) |
| Life, Physical & Social Science | 7 (100.0%) | 0 (0.0%) |
| Community & Social Service | 34 (45.3%) | 41 (54.7%) |
| Education, Arts & Media | 6 (28.6%) | 15 (71.4%) |
| Legal Services & Support | 0 (0.0%) | 0 (0.0%) |
| Education Instruction & Library | 15 (36.6%) | 26 (63.4%) |
| Arts, Media & Entertainment | 13 (100.0%) | 0 (0.0%) |
| Health Diagnosing & Treating | 31 (53.4%) | 27 (46.6%) |
| Health Technologists | 10 (38.5%) | 16 (61.5%) |
| Total (Category) | 130 (53.9%) | 111 (46.1%) |
| Total (Overall) | 342 (48.3%) | 366 (51.7%) |
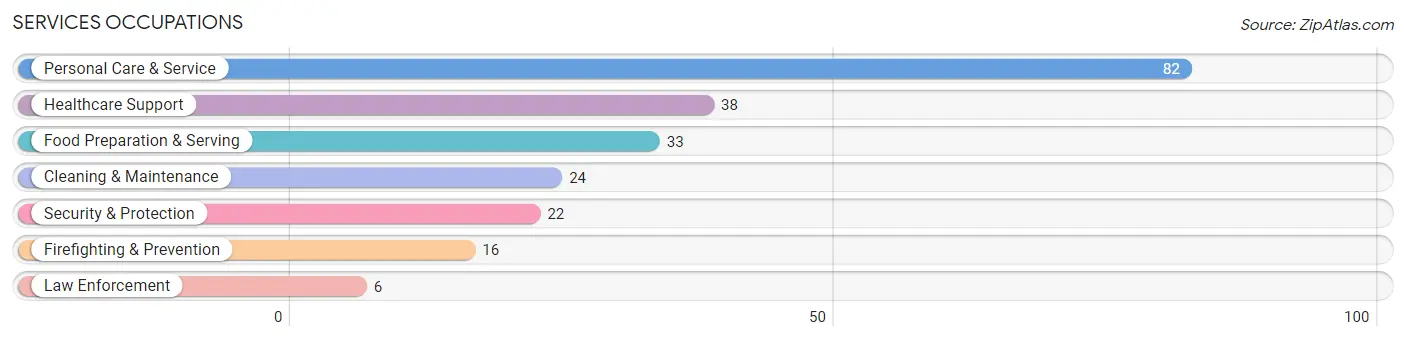
Services Occupations
The most common Services occupations in Silver Bay are Personal Care & Service (82 | 11.6%), Healthcare Support (38 | 5.4%), Food Preparation & Serving (33 | 4.7%), Cleaning & Maintenance (24 | 3.4%), and Security & Protection (22 | 3.1%).
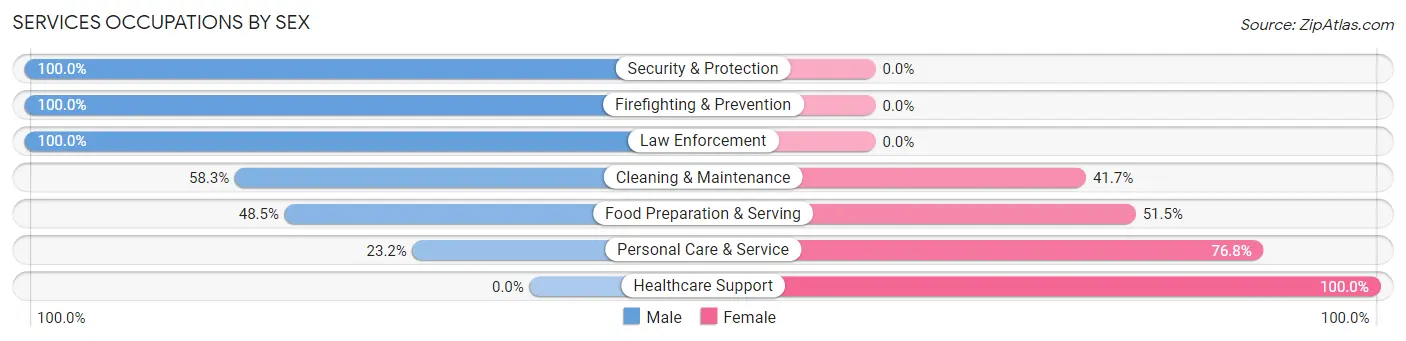
Services Occupations by Sex
Within the Services occupations in Silver Bay, the most male-oriented occupations are Security & Protection (100.0%), Firefighting & Prevention (100.0%), and Law Enforcement (100.0%), while the most female-oriented occupations are Healthcare Support (100.0%), Personal Care & Service (76.8%), and Food Preparation & Serving (51.5%).
| Occupation | Male | Female |
| Healthcare Support | 0 (0.0%) | 38 (100.0%) |
| Security & Protection | 22 (100.0%) | 0 (0.0%) |
| Firefighting & Prevention | 16 (100.0%) | 0 (0.0%) |
| Law Enforcement | 6 (100.0%) | 0 (0.0%) |
| Food Preparation & Serving | 16 (48.5%) | 17 (51.5%) |
| Cleaning & Maintenance | 14 (58.3%) | 10 (41.7%) |
| Personal Care & Service | 19 (23.2%) | 63 (76.8%) |
| Total (Category) | 71 (35.7%) | 128 (64.3%) |
| Total (Overall) | 342 (48.3%) | 366 (51.7%) |
Sales and Office Occupations
The most common Sales and Office occupations in Silver Bay are Office & Administration (86 | 12.1%), and Sales & Related (59 | 8.3%).
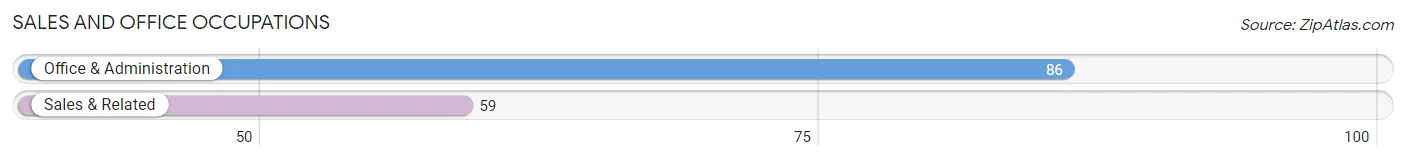
Sales and Office Occupations by Sex
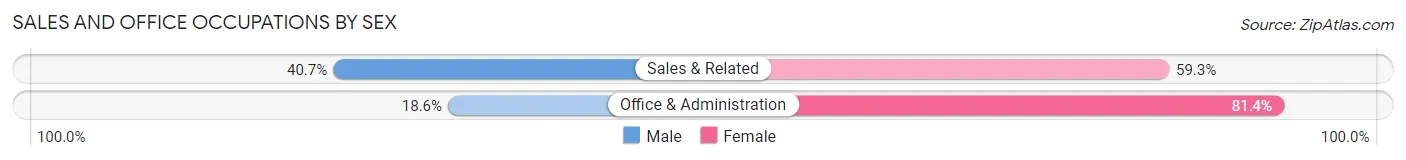
| Occupation | Male | Female |
| Sales & Related | 24 (40.7%) | 35 (59.3%) |
| Office & Administration | 16 (18.6%) | 70 (81.4%) |
| Total (Category) | 40 (27.6%) | 105 (72.4%) |
| Total (Overall) | 342 (48.3%) | 366 (51.7%) |
Natural Resources, Construction and Maintenance Occupations
The most common Natural Resources, Construction and Maintenance occupations in Silver Bay are Construction & Extraction (25 | 3.5%), and Farming, Fishing & Forestry (6 | 0.9%).
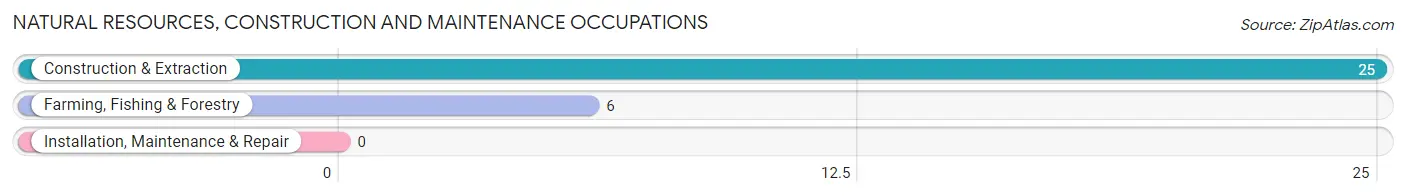
Natural Resources, Construction and Maintenance Occupations by Sex
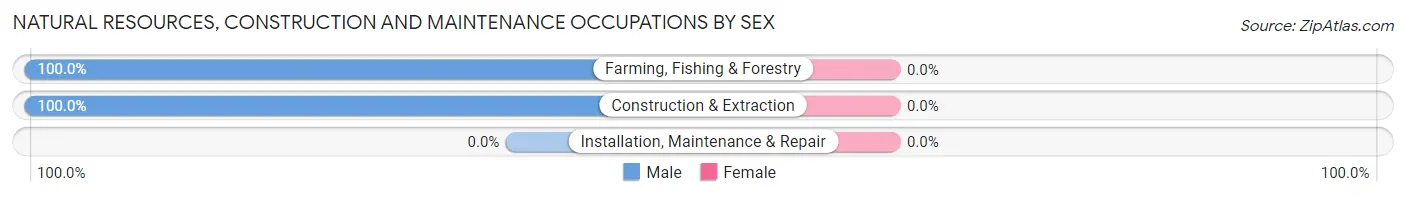
| Occupation | Male | Female |
| Farming, Fishing & Forestry | 6 (100.0%) | 0 (0.0%) |
| Construction & Extraction | 25 (100.0%) | 0 (0.0%) |
| Installation, Maintenance & Repair | 0 (0.0%) | 0 (0.0%) |
| Total (Category) | 31 (100.0%) | 0 (0.0%) |
| Total (Overall) | 342 (48.3%) | 366 (51.7%) |
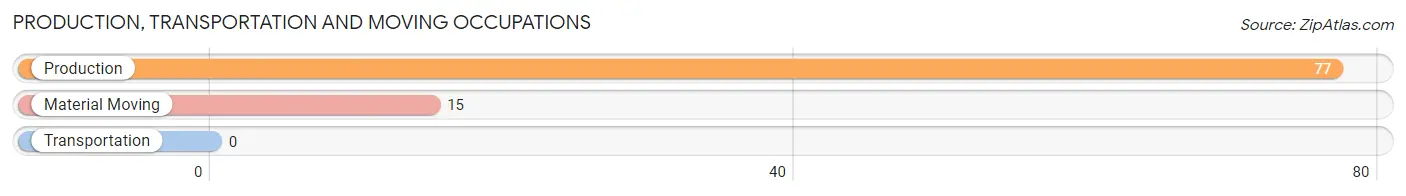
Production, Transportation and Moving Occupations
The most common Production, Transportation and Moving occupations in Silver Bay are Production (77 | 10.9%), and Material Moving (15 | 2.1%).
Production, Transportation and Moving Occupations by Sex
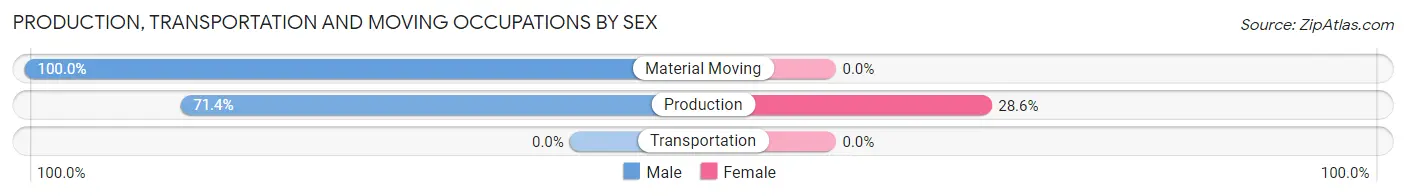
| Occupation | Male | Female |
| Production | 55 (71.4%) | 22 (28.6%) |
| Transportation | 0 (0.0%) | 0 (0.0%) |
| Material Moving | 15 (100.0%) | 0 (0.0%) |
| Total (Category) | 70 (76.1%) | 22 (23.9%) |
| Total (Overall) | 342 (48.3%) | 366 (51.7%) |
Employment Industries by Sex in Silver Bay
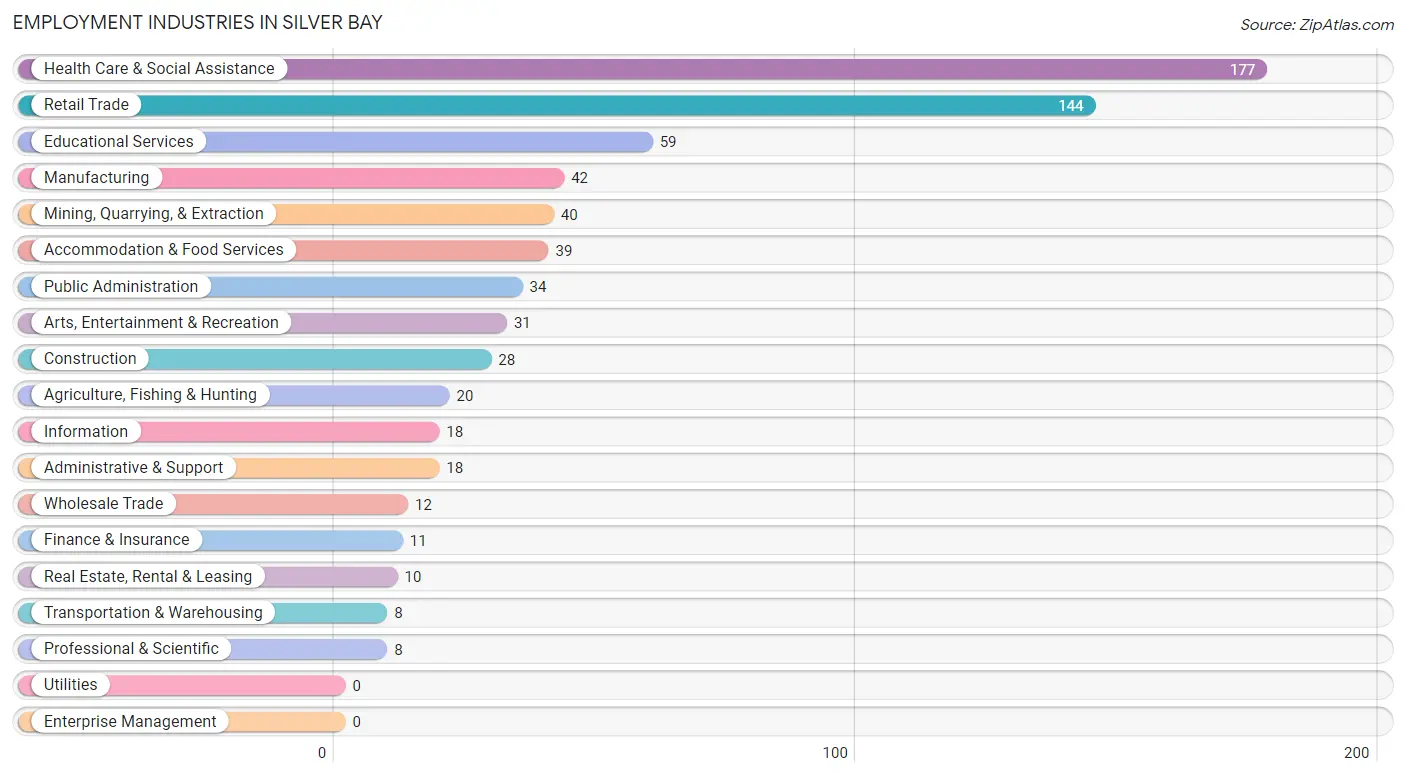
Employment Industries in Silver Bay
The major employment industries in Silver Bay include Health Care & Social Assistance (177 | 25.0%), Retail Trade (144 | 20.3%), Educational Services (59 | 8.3%), Manufacturing (42 | 5.9%), and Mining, Quarrying, & Extraction (40 | 5.7%).
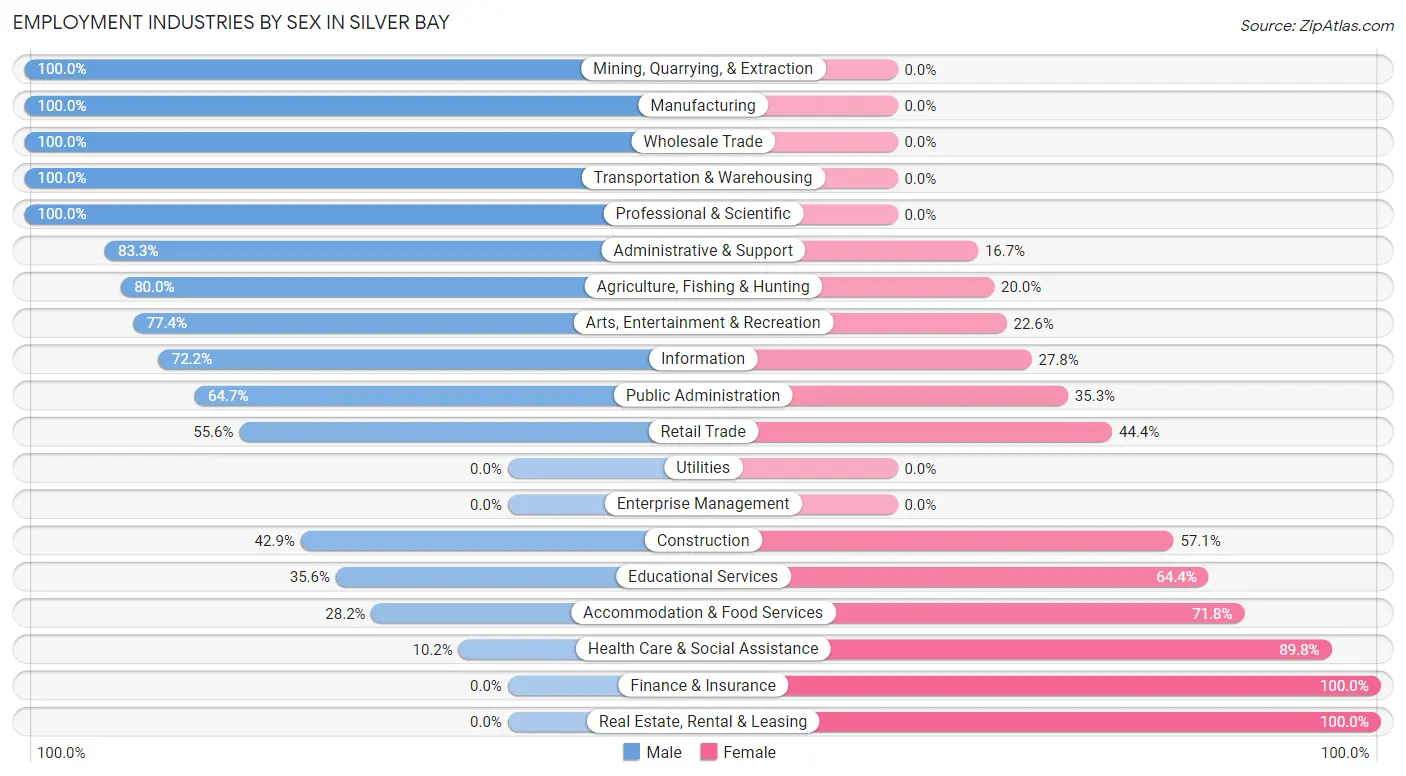
Employment Industries by Sex in Silver Bay
The Silver Bay industries that see more men than women are Mining, Quarrying, & Extraction (100.0%), Manufacturing (100.0%), and Wholesale Trade (100.0%), whereas the industries that tend to have a higher number of women are Finance & Insurance (100.0%), Real Estate, Rental & Leasing (100.0%), and Health Care & Social Assistance (89.8%).
| Industry | Male | Female |
| Agriculture, Fishing & Hunting | 16 (80.0%) | 4 (20.0%) |
| Mining, Quarrying, & Extraction | 40 (100.0%) | 0 (0.0%) |
| Construction | 12 (42.9%) | 16 (57.1%) |
| Manufacturing | 42 (100.0%) | 0 (0.0%) |
| Wholesale Trade | 12 (100.0%) | 0 (0.0%) |
| Retail Trade | 80 (55.6%) | 64 (44.4%) |
| Transportation & Warehousing | 8 (100.0%) | 0 (0.0%) |
| Utilities | 0 (0.0%) | 0 (0.0%) |
| Information | 13 (72.2%) | 5 (27.8%) |
| Finance & Insurance | 0 (0.0%) | 11 (100.0%) |
| Real Estate, Rental & Leasing | 0 (0.0%) | 10 (100.0%) |
| Professional & Scientific | 8 (100.0%) | 0 (0.0%) |
| Enterprise Management | 0 (0.0%) | 0 (0.0%) |
| Administrative & Support | 15 (83.3%) | 3 (16.7%) |
| Educational Services | 21 (35.6%) | 38 (64.4%) |
| Health Care & Social Assistance | 18 (10.2%) | 159 (89.8%) |
| Arts, Entertainment & Recreation | 24 (77.4%) | 7 (22.6%) |
| Accommodation & Food Services | 11 (28.2%) | 28 (71.8%) |
| Public Administration | 22 (64.7%) | 12 (35.3%) |
| Total | 342 (48.3%) | 366 (51.7%) |
Education in Silver Bay
School Enrollment in Silver Bay
The most common levels of schooling among the 264 students in Silver Bay are middle school (100 | 37.9%), elementary school (61 | 23.1%), and high school (50 | 18.9%).
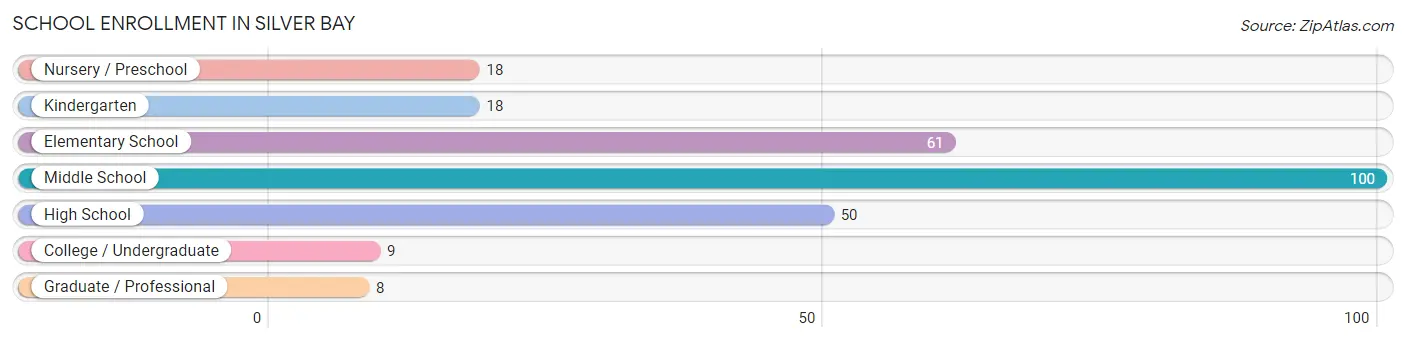
| School Level | # Students | % Students |
| Nursery / Preschool | 18 | 6.8% |
| Kindergarten | 18 | 6.8% |
| Elementary School | 61 | 23.1% |
| Middle School | 100 | 37.9% |
| High School | 50 | 18.9% |
| College / Undergraduate | 9 | 3.4% |
| Graduate / Professional | 8 | 3.0% |
| Total | 264 | 100.0% |
School Enrollment by Age by Funding Source in Silver Bay
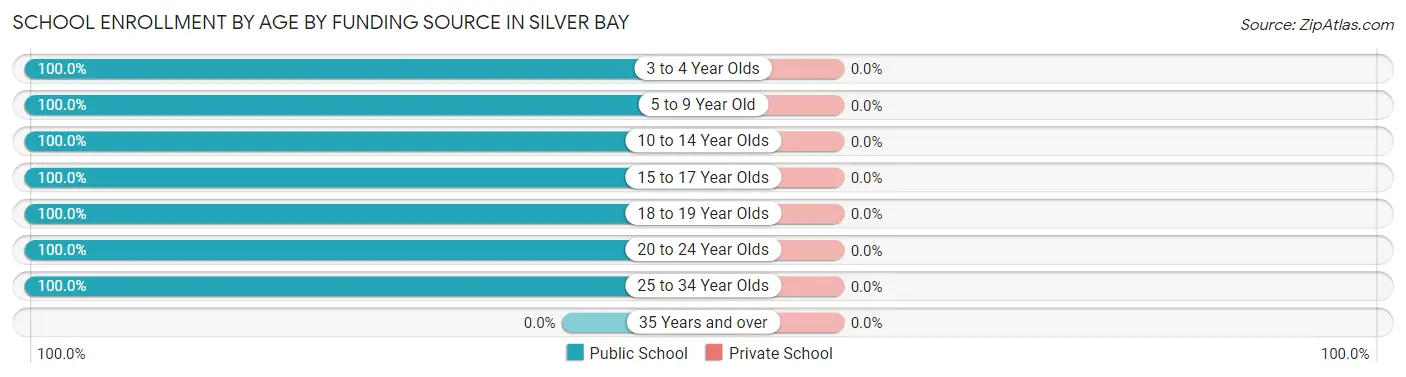
| Age Bracket | Public School | Private School |
| 3 to 4 Year Olds | 8 (100.0%) | 0 (0.0%) |
| 5 to 9 Year Old | 71 (100.0%) | 0 (0.0%) |
| 10 to 14 Year Olds | 121 (100.0%) | 0 (0.0%) |
| 15 to 17 Year Olds | 41 (100.0%) | 0 (0.0%) |
| 18 to 19 Year Olds | 6 (100.0%) | 0 (0.0%) |
| 20 to 24 Year Olds | 4 (100.0%) | 0 (0.0%) |
| 25 to 34 Year Olds | 13 (100.0%) | 0 (0.0%) |
| 35 Years and over | 0 (0.0%) | 0 (0.0%) |
| Total | 264 (100.0%) | 0 (0.0%) |
Educational Attainment by Field of Study in Silver Bay
Education (72 | 19.9%), social sciences (52 | 14.4%), science & technology (52 | 14.4%), arts & humanities (50 | 13.9%), and business (42 | 11.6%) are the most common fields of study among 361 individuals in Silver Bay who have obtained a bachelor's degree or higher.
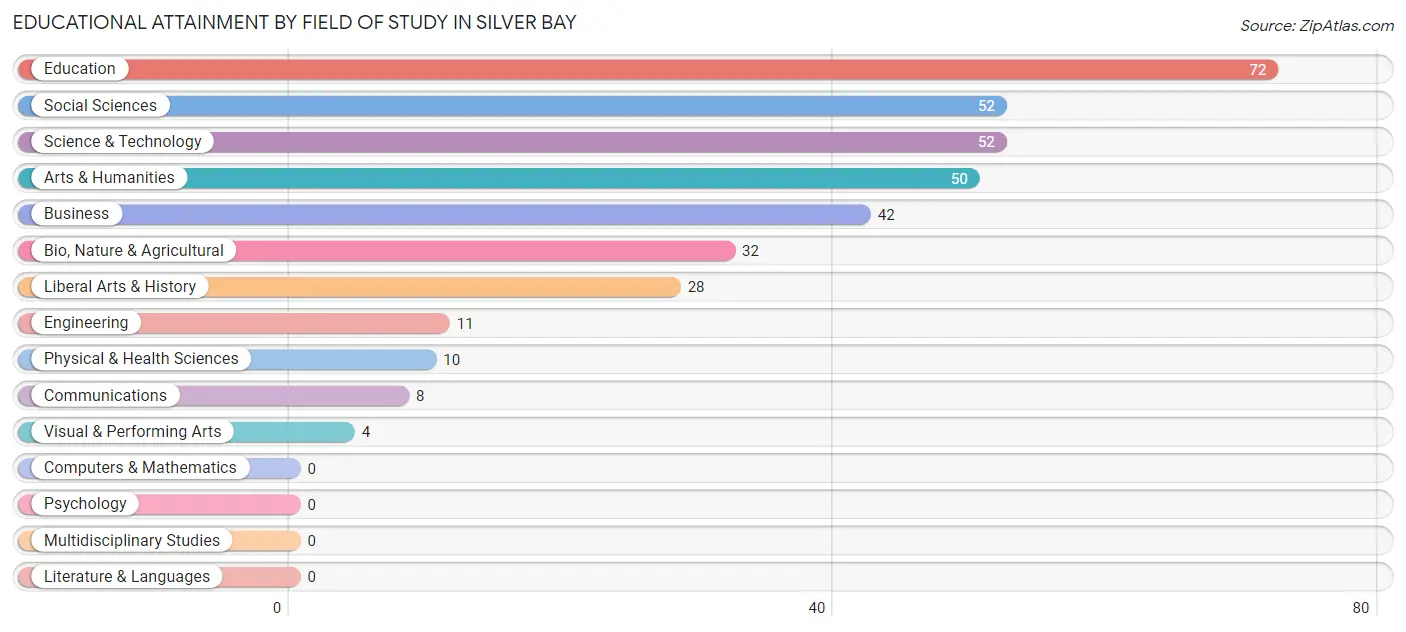
| Field of Study | # Graduates | % Graduates |
| Computers & Mathematics | 0 | 0.0% |
| Bio, Nature & Agricultural | 32 | 8.9% |
| Physical & Health Sciences | 10 | 2.8% |
| Psychology | 0 | 0.0% |
| Social Sciences | 52 | 14.4% |
| Engineering | 11 | 3.0% |
| Multidisciplinary Studies | 0 | 0.0% |
| Science & Technology | 52 | 14.4% |
| Business | 42 | 11.6% |
| Education | 72 | 19.9% |
| Literature & Languages | 0 | 0.0% |
| Liberal Arts & History | 28 | 7.8% |
| Visual & Performing Arts | 4 | 1.1% |
| Communications | 8 | 2.2% |
| Arts & Humanities | 50 | 13.9% |
| Total | 361 | 100.0% |
Transportation & Commute in Silver Bay
Vehicle Availability by Sex in Silver Bay
The most prevalent vehicle ownership categories in Silver Bay are males with 2 vehicles (192, accounting for 56.1%) and females with 2 vehicles (145, making up 53.3%).
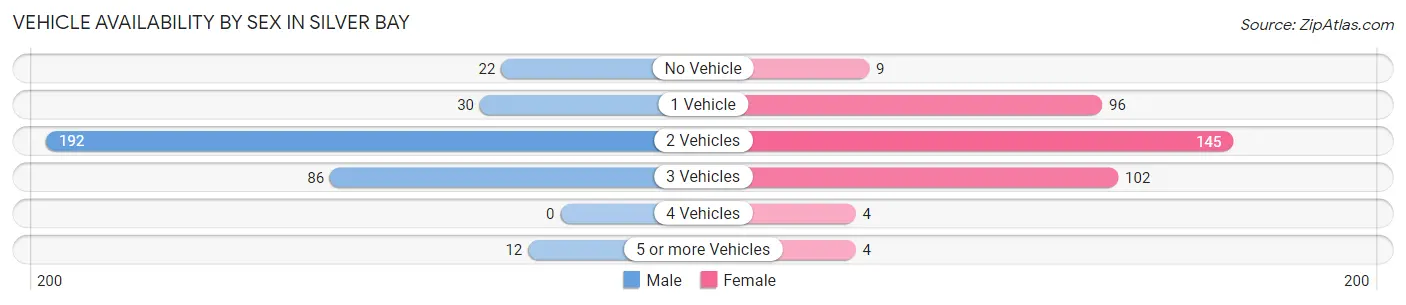
| Vehicles Available | Male | Female |
| No Vehicle | 22 (6.4%) | 9 (2.5%) |
| 1 Vehicle | 30 (8.8%) | 96 (26.7%) |
| 2 Vehicles | 192 (56.1%) | 145 (40.3%) |
| 3 Vehicles | 86 (25.2%) | 102 (28.3%) |
| 4 Vehicles | 0 (0.0%) | 4 (1.1%) |
| 5 or more Vehicles | 12 (3.5%) | 4 (1.1%) |
| Total | 342 (100.0%) | 360 (100.0%) |
Commute Time in Silver Bay
The most frequently occuring commute durations in Silver Bay are 5 to 9 minutes (224 commuters, 35.3%), less than 5 minutes (97 commuters, 15.3%), and 60 to 89 minutes (88 commuters, 13.9%).
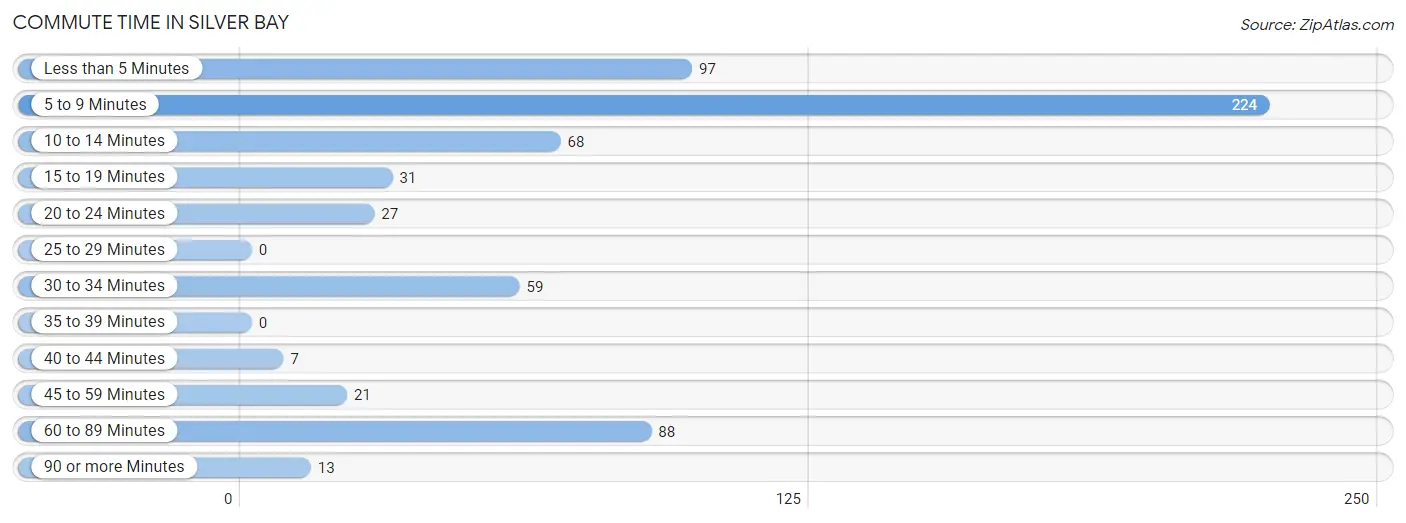
| Commute Time | # Commuters | % Commuters |
| Less than 5 Minutes | 97 | 15.3% |
| 5 to 9 Minutes | 224 | 35.3% |
| 10 to 14 Minutes | 68 | 10.7% |
| 15 to 19 Minutes | 31 | 4.9% |
| 20 to 24 Minutes | 27 | 4.3% |
| 25 to 29 Minutes | 0 | 0.0% |
| 30 to 34 Minutes | 59 | 9.3% |
| 35 to 39 Minutes | 0 | 0.0% |
| 40 to 44 Minutes | 7 | 1.1% |
| 45 to 59 Minutes | 21 | 3.3% |
| 60 to 89 Minutes | 88 | 13.9% |
| 90 or more Minutes | 13 | 2.1% |
Commute Time by Sex in Silver Bay
The most common commute times in Silver Bay are 5 to 9 minutes (104 commuters, 31.8%) for males and 5 to 9 minutes (120 commuters, 39.0%) for females.
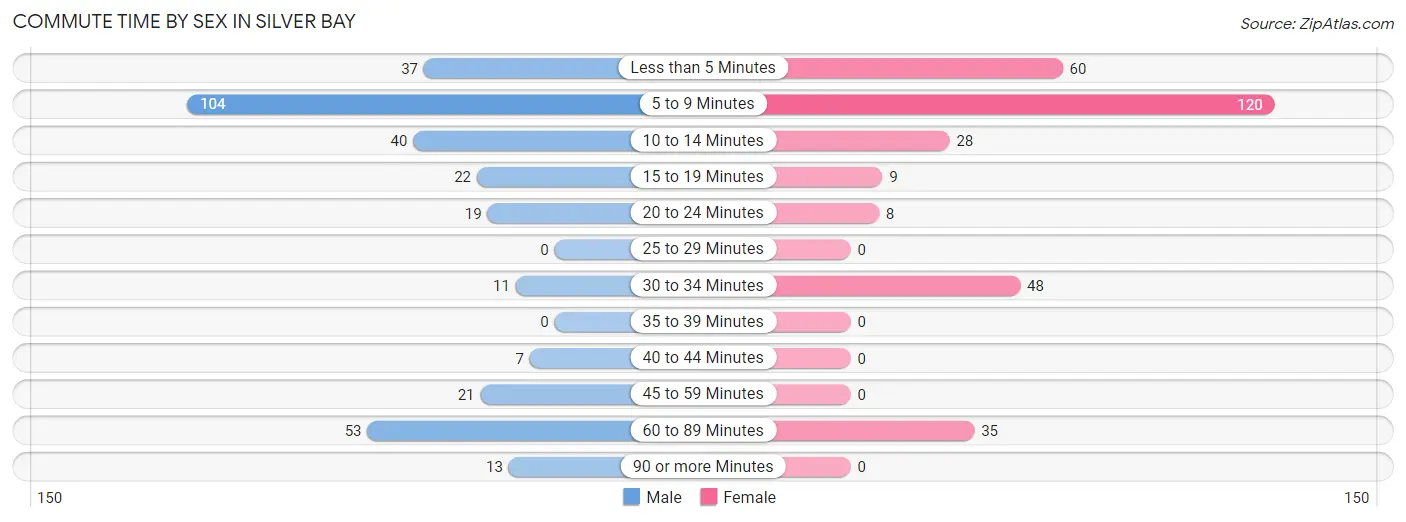
| Commute Time | Male | Female |
| Less than 5 Minutes | 37 (11.3%) | 60 (19.5%) |
| 5 to 9 Minutes | 104 (31.8%) | 120 (39.0%) |
| 10 to 14 Minutes | 40 (12.2%) | 28 (9.1%) |
| 15 to 19 Minutes | 22 (6.7%) | 9 (2.9%) |
| 20 to 24 Minutes | 19 (5.8%) | 8 (2.6%) |
| 25 to 29 Minutes | 0 (0.0%) | 0 (0.0%) |
| 30 to 34 Minutes | 11 (3.4%) | 48 (15.6%) |
| 35 to 39 Minutes | 0 (0.0%) | 0 (0.0%) |
| 40 to 44 Minutes | 7 (2.1%) | 0 (0.0%) |
| 45 to 59 Minutes | 21 (6.4%) | 0 (0.0%) |
| 60 to 89 Minutes | 53 (16.2%) | 35 (11.4%) |
| 90 or more Minutes | 13 (4.0%) | 0 (0.0%) |
Time of Departure to Work by Sex in Silver Bay
The most frequent times of departure to work in Silver Bay are 12:00 AM to 4:59 AM (43, 13.2%) for males and 7:30 AM to 7:59 AM (106, 34.4%) for females.
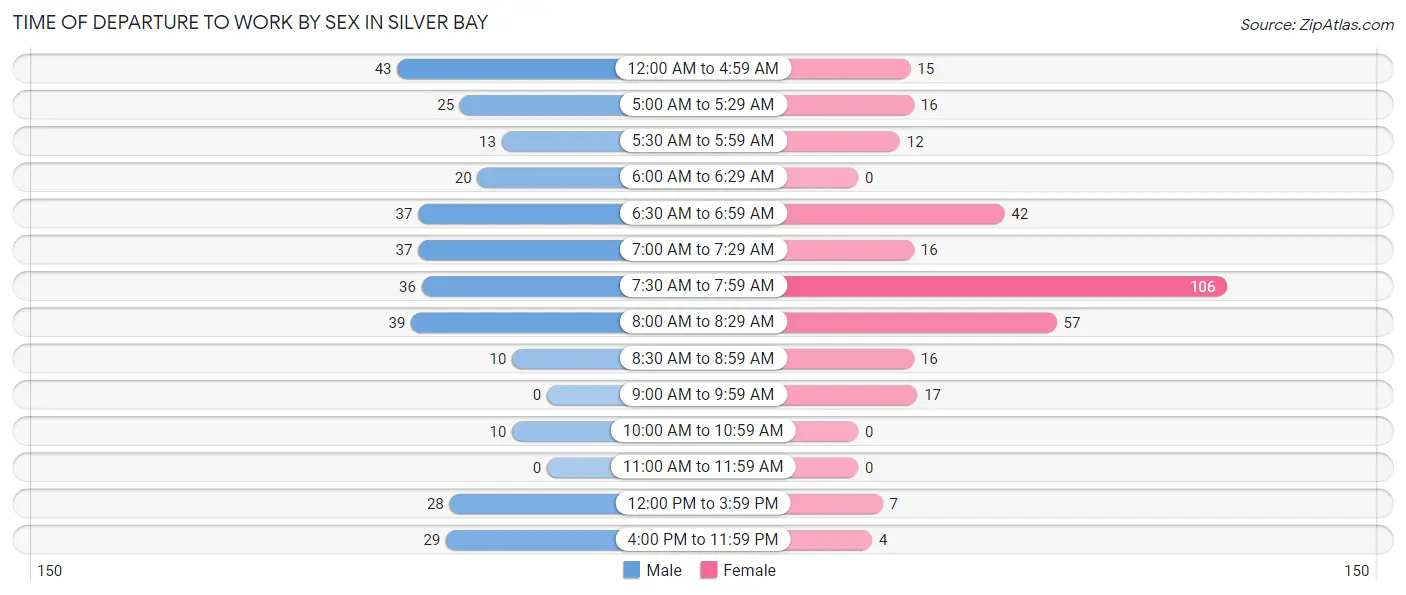
| Time of Departure | Male | Female |
| 12:00 AM to 4:59 AM | 43 (13.2%) | 15 (4.9%) |
| 5:00 AM to 5:29 AM | 25 (7.6%) | 16 (5.2%) |
| 5:30 AM to 5:59 AM | 13 (4.0%) | 12 (3.9%) |
| 6:00 AM to 6:29 AM | 20 (6.1%) | 0 (0.0%) |
| 6:30 AM to 6:59 AM | 37 (11.3%) | 42 (13.6%) |
| 7:00 AM to 7:29 AM | 37 (11.3%) | 16 (5.2%) |
| 7:30 AM to 7:59 AM | 36 (11.0%) | 106 (34.4%) |
| 8:00 AM to 8:29 AM | 39 (11.9%) | 57 (18.5%) |
| 8:30 AM to 8:59 AM | 10 (3.1%) | 16 (5.2%) |
| 9:00 AM to 9:59 AM | 0 (0.0%) | 17 (5.5%) |
| 10:00 AM to 10:59 AM | 10 (3.1%) | 0 (0.0%) |
| 11:00 AM to 11:59 AM | 0 (0.0%) | 0 (0.0%) |
| 12:00 PM to 3:59 PM | 28 (8.6%) | 7 (2.3%) |
| 4:00 PM to 11:59 PM | 29 (8.9%) | 4 (1.3%) |
| Total | 327 (100.0%) | 308 (100.0%) |
Housing Occupancy in Silver Bay
Occupancy by Ownership in Silver Bay
Of the total 826 dwellings in Silver Bay, owner-occupied units account for 674 (81.6%), while renter-occupied units make up 152 (18.4%).
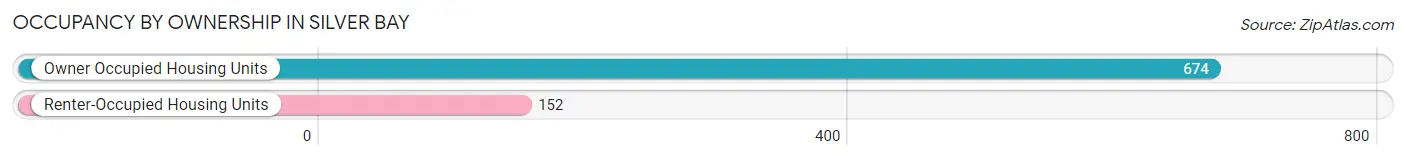
| Occupancy | # Housing Units | % Housing Units |
| Owner Occupied Housing Units | 674 | 81.6% |
| Renter-Occupied Housing Units | 152 | 18.4% |
| Total Occupied Housing Units | 826 | 100.0% |
Occupancy by Household Size in Silver Bay
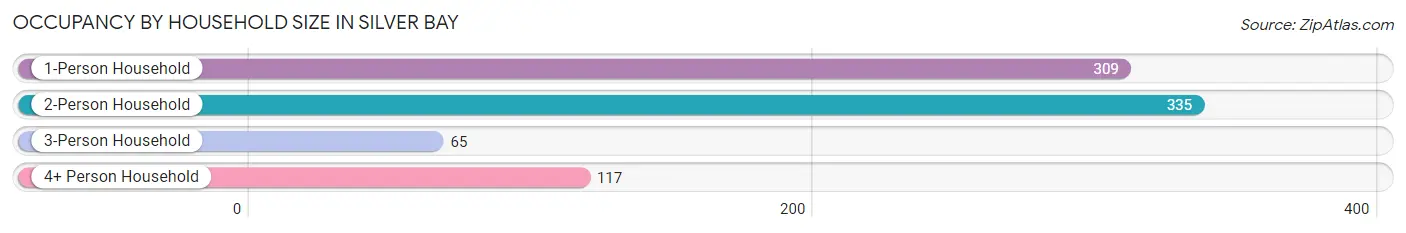
| Household Size | # Housing Units | % Housing Units |
| 1-Person Household | 309 | 37.4% |
| 2-Person Household | 335 | 40.6% |
| 3-Person Household | 65 | 7.9% |
| 4+ Person Household | 117 | 14.2% |
| Total Housing Units | 826 | 100.0% |
Occupancy by Ownership by Household Size in Silver Bay
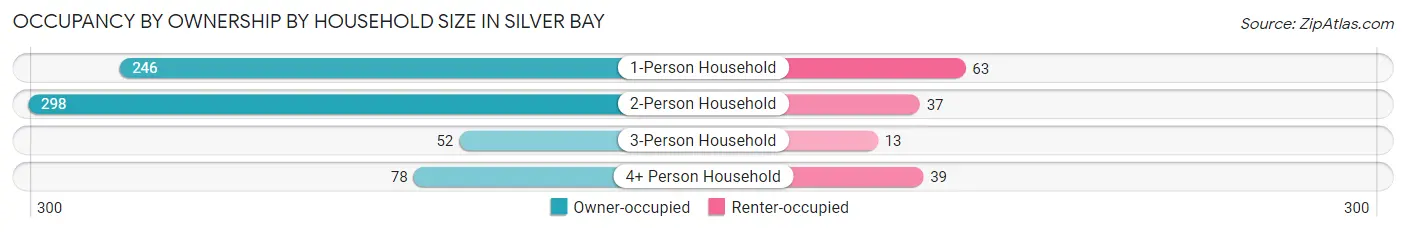
| Household Size | Owner-occupied | Renter-occupied |
| 1-Person Household | 246 (79.6%) | 63 (20.4%) |
| 2-Person Household | 298 (89.0%) | 37 (11.0%) |
| 3-Person Household | 52 (80.0%) | 13 (20.0%) |
| 4+ Person Household | 78 (66.7%) | 39 (33.3%) |
| Total Housing Units | 674 (81.6%) | 152 (18.4%) |
Occupancy by Educational Attainment in Silver Bay
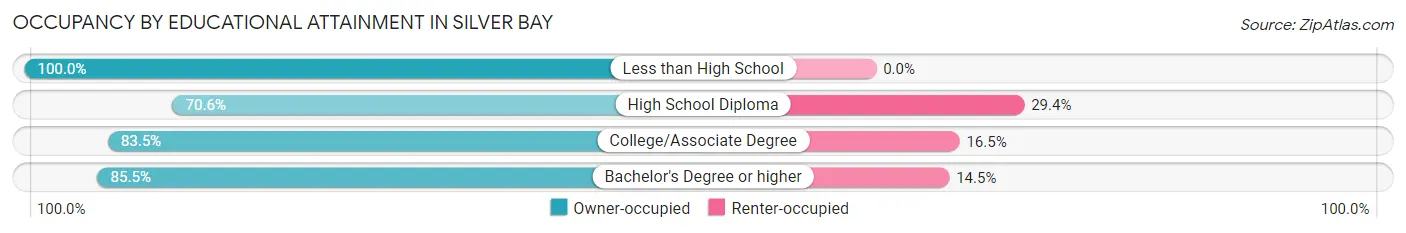
| Household Size | Owner-occupied | Renter-occupied |
| Less than High School | 49 (100.0%) | 0 (0.0%) |
| High School Diploma | 154 (70.6%) | 64 (29.4%) |
| College/Associate Degree | 288 (83.5%) | 57 (16.5%) |
| Bachelor's Degree or higher | 183 (85.5%) | 31 (14.5%) |
Occupancy by Age of Householder in Silver Bay
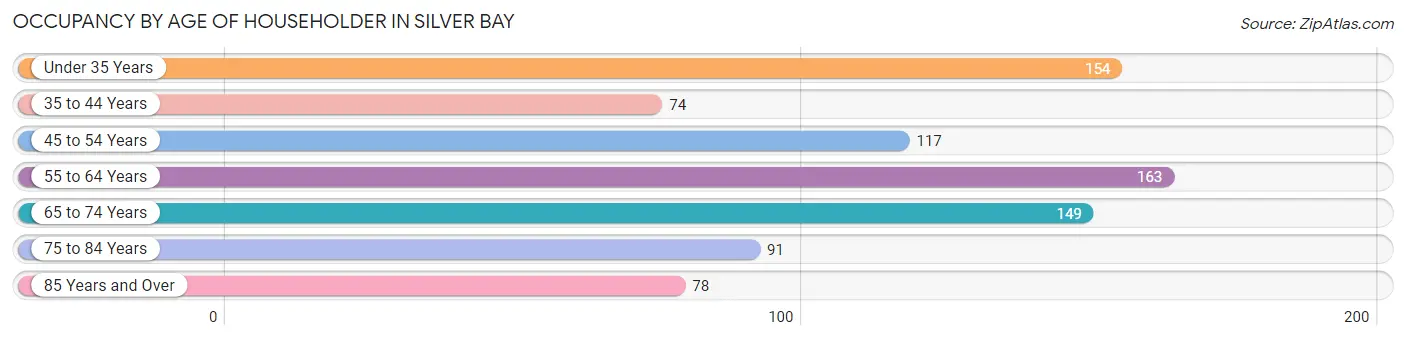
| Age Bracket | # Households | % Households |
| Under 35 Years | 154 | 18.6% |
| 35 to 44 Years | 74 | 9.0% |
| 45 to 54 Years | 117 | 14.2% |
| 55 to 64 Years | 163 | 19.7% |
| 65 to 74 Years | 149 | 18.0% |
| 75 to 84 Years | 91 | 11.0% |
| 85 Years and Over | 78 | 9.4% |
| Total | 826 | 100.0% |
Housing Finances in Silver Bay
Median Income by Occupancy in Silver Bay
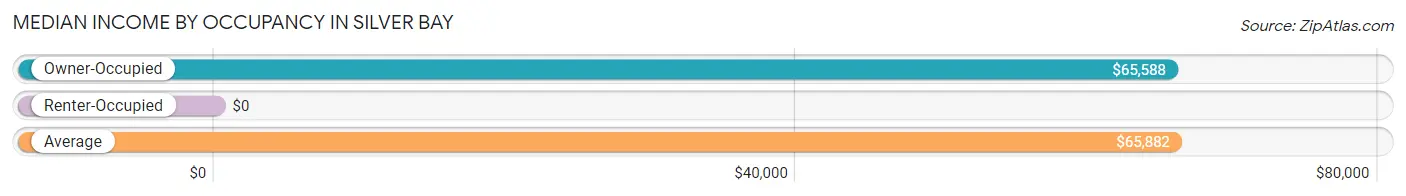
| Occupancy Type | # Households | Median Income |
| Owner-Occupied | 674 (81.6%) | $65,588 |
| Renter-Occupied | 152 (18.4%) | $0 |
| Average | 826 (100.0%) | $65,882 |
Occupancy by Householder Income Bracket in Silver Bay
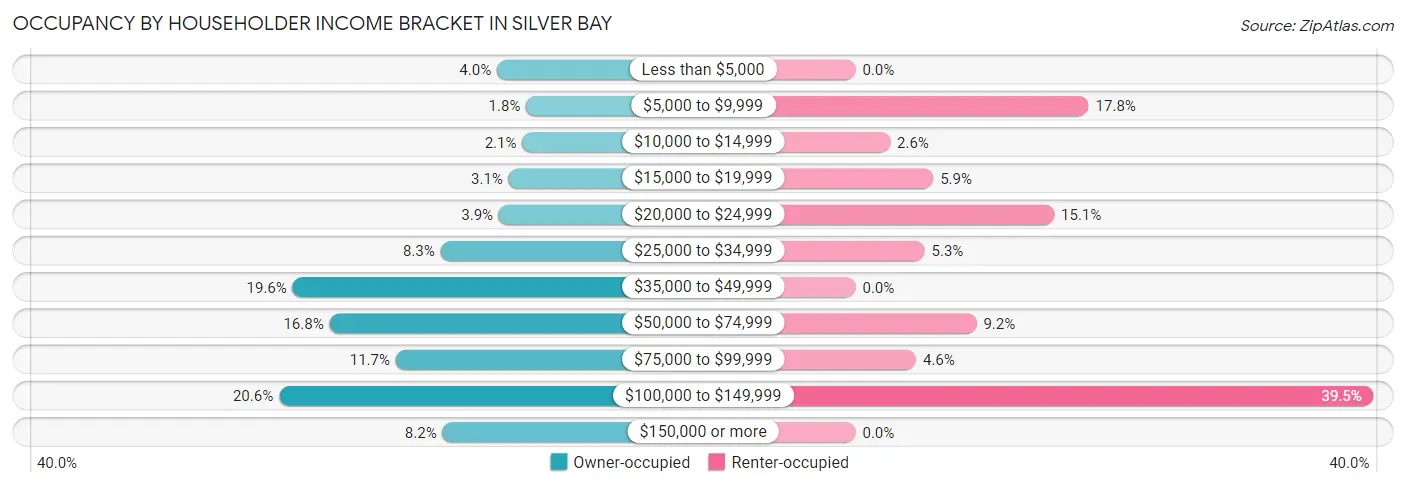
| Income Bracket | Owner-occupied | Renter-occupied |
| Less than $5,000 | 27 (4.0%) | 0 (0.0%) |
| $5,000 to $9,999 | 12 (1.8%) | 27 (17.8%) |
| $10,000 to $14,999 | 14 (2.1%) | 4 (2.6%) |
| $15,000 to $19,999 | 21 (3.1%) | 9 (5.9%) |
| $20,000 to $24,999 | 26 (3.9%) | 23 (15.1%) |
| $25,000 to $34,999 | 56 (8.3%) | 8 (5.3%) |
| $35,000 to $49,999 | 132 (19.6%) | 0 (0.0%) |
| $50,000 to $74,999 | 113 (16.8%) | 14 (9.2%) |
| $75,000 to $99,999 | 79 (11.7%) | 7 (4.6%) |
| $100,000 to $149,999 | 139 (20.6%) | 60 (39.5%) |
| $150,000 or more | 55 (8.2%) | 0 (0.0%) |
| Total | 674 (100.0%) | 152 (100.0%) |
Monthly Housing Cost Tiers in Silver Bay
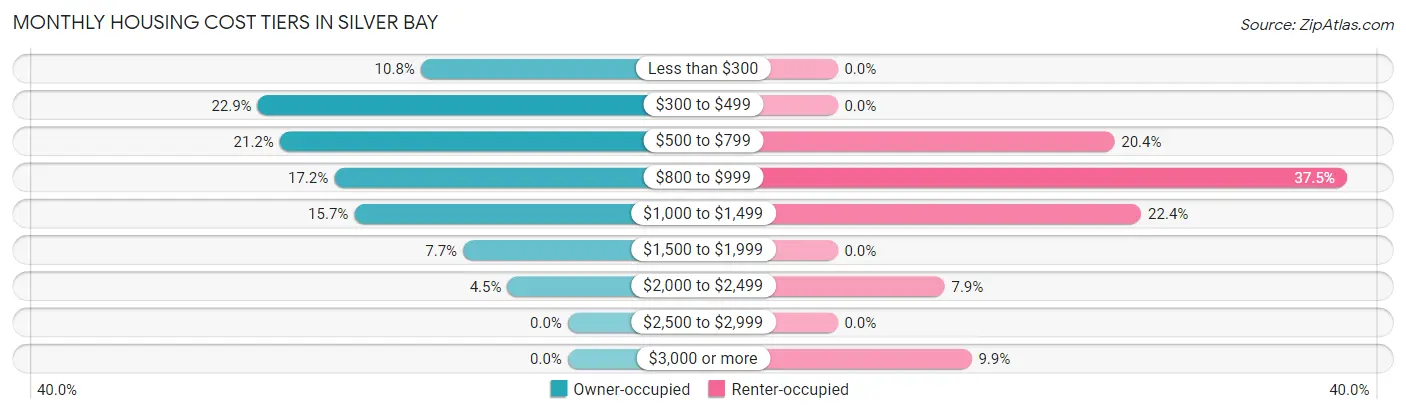
| Monthly Cost | Owner-occupied | Renter-occupied |
| Less than $300 | 73 (10.8%) | 0 (0.0%) |
| $300 to $499 | 154 (22.9%) | 0 (0.0%) |
| $500 to $799 | 143 (21.2%) | 31 (20.4%) |
| $800 to $999 | 116 (17.2%) | 57 (37.5%) |
| $1,000 to $1,499 | 106 (15.7%) | 34 (22.4%) |
| $1,500 to $1,999 | 52 (7.7%) | 0 (0.0%) |
| $2,000 to $2,499 | 30 (4.4%) | 12 (7.9%) |
| $2,500 to $2,999 | 0 (0.0%) | 0 (0.0%) |
| $3,000 or more | 0 (0.0%) | 15 (9.9%) |
| Total | 674 (100.0%) | 152 (100.0%) |
Physical Housing Characteristics in Silver Bay
Housing Structures in Silver Bay
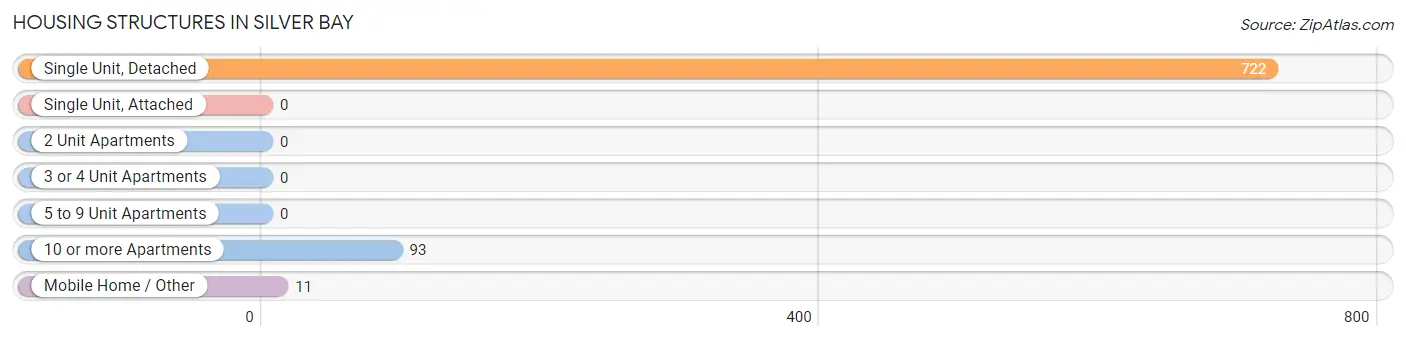
| Structure Type | # Housing Units | % Housing Units |
| Single Unit, Detached | 722 | 87.4% |
| Single Unit, Attached | 0 | 0.0% |
| 2 Unit Apartments | 0 | 0.0% |
| 3 or 4 Unit Apartments | 0 | 0.0% |
| 5 to 9 Unit Apartments | 0 | 0.0% |
| 10 or more Apartments | 93 | 11.3% |
| Mobile Home / Other | 11 | 1.3% |
| Total | 826 | 100.0% |
Housing Structures by Occupancy in Silver Bay
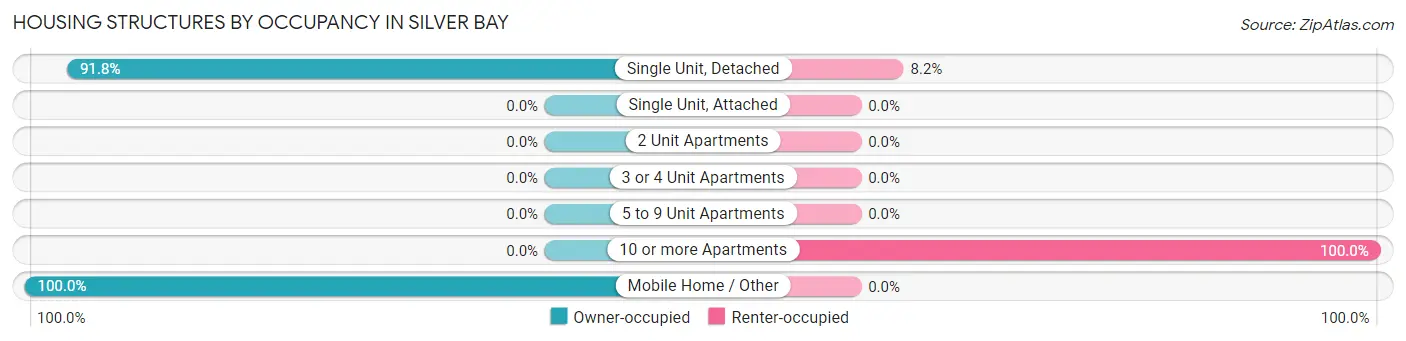
| Structure Type | Owner-occupied | Renter-occupied |
| Single Unit, Detached | 663 (91.8%) | 59 (8.2%) |
| Single Unit, Attached | 0 (0.0%) | 0 (0.0%) |
| 2 Unit Apartments | 0 (0.0%) | 0 (0.0%) |
| 3 or 4 Unit Apartments | 0 (0.0%) | 0 (0.0%) |
| 5 to 9 Unit Apartments | 0 (0.0%) | 0 (0.0%) |
| 10 or more Apartments | 0 (0.0%) | 93 (100.0%) |
| Mobile Home / Other | 11 (100.0%) | 0 (0.0%) |
| Total | 674 (81.6%) | 152 (18.4%) |
Housing Structures by Number of Rooms in Silver Bay
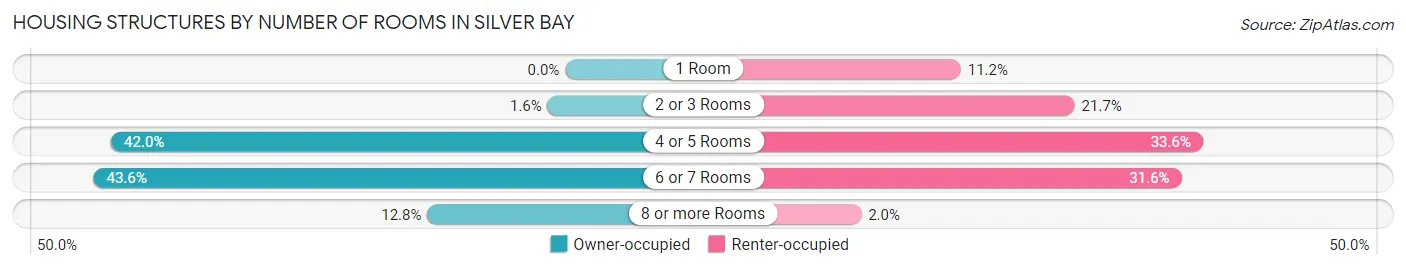
| Number of Rooms | Owner-occupied | Renter-occupied |
| 1 Room | 0 (0.0%) | 17 (11.2%) |
| 2 or 3 Rooms | 11 (1.6%) | 33 (21.7%) |
| 4 or 5 Rooms | 283 (42.0%) | 51 (33.6%) |
| 6 or 7 Rooms | 294 (43.6%) | 48 (31.6%) |
| 8 or more Rooms | 86 (12.8%) | 3 (2.0%) |
| Total | 674 (100.0%) | 152 (100.0%) |
Housing Structure by Heating Type in Silver Bay
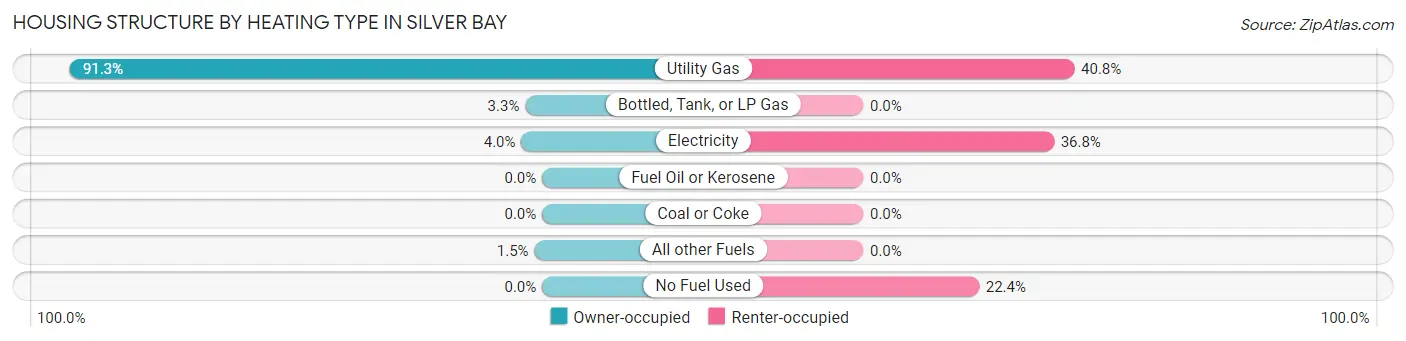
| Heating Type | Owner-occupied | Renter-occupied |
| Utility Gas | 615 (91.2%) | 62 (40.8%) |
| Bottled, Tank, or LP Gas | 22 (3.3%) | 0 (0.0%) |
| Electricity | 27 (4.0%) | 56 (36.8%) |
| Fuel Oil or Kerosene | 0 (0.0%) | 0 (0.0%) |
| Coal or Coke | 0 (0.0%) | 0 (0.0%) |
| All other Fuels | 10 (1.5%) | 0 (0.0%) |
| No Fuel Used | 0 (0.0%) | 34 (22.4%) |
| Total | 674 (100.0%) | 152 (100.0%) |
Household Vehicle Usage in Silver Bay
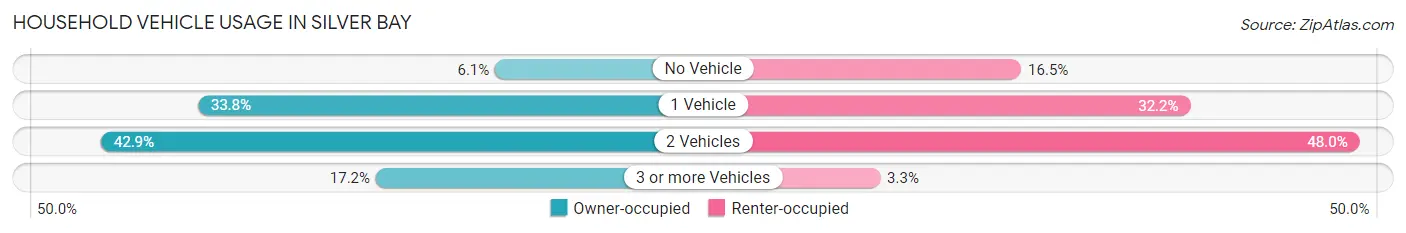
| Vehicles per Household | Owner-occupied | Renter-occupied |
| No Vehicle | 41 (6.1%) | 25 (16.5%) |
| 1 Vehicle | 228 (33.8%) | 49 (32.2%) |
| 2 Vehicles | 289 (42.9%) | 73 (48.0%) |
| 3 or more Vehicles | 116 (17.2%) | 5 (3.3%) |
| Total | 674 (100.0%) | 152 (100.0%) |
Real Estate & Mortgages in Silver Bay
Real Estate and Mortgage Overview in Silver Bay
| Characteristic | Without Mortgage | With Mortgage |
| Housing Units | 309 | 365 |
| Median Property Value | $124,800 | $135,800 |
| Median Household Income | $65,104 | $30 |
| Monthly Housing Costs | $404 | $0 |
| Real Estate Taxes | $946 | $3 |
Property Value by Mortgage Status in Silver Bay
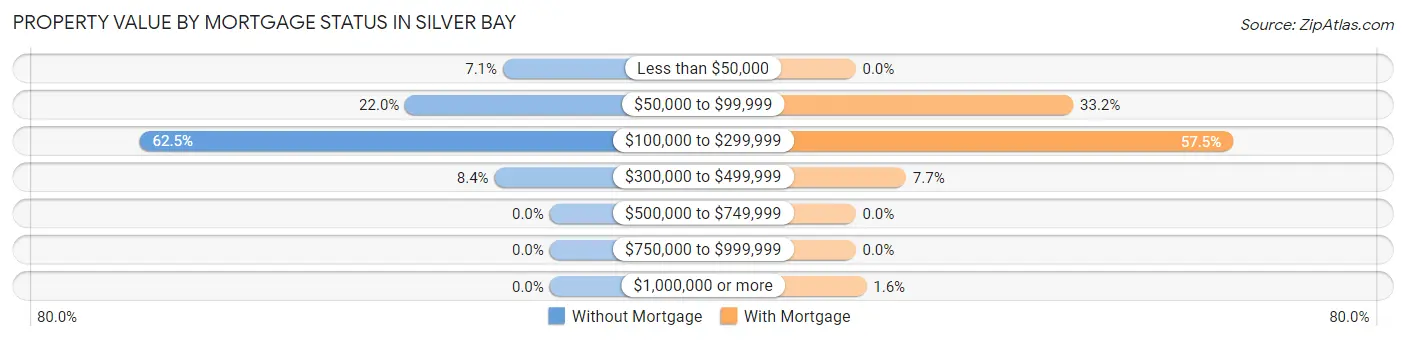
| Property Value | Without Mortgage | With Mortgage |
| Less than $50,000 | 22 (7.1%) | 0 (0.0%) |
| $50,000 to $99,999 | 68 (22.0%) | 121 (33.2%) |
| $100,000 to $299,999 | 193 (62.5%) | 210 (57.5%) |
| $300,000 to $499,999 | 26 (8.4%) | 28 (7.7%) |
| $500,000 to $749,999 | 0 (0.0%) | 0 (0.0%) |
| $750,000 to $999,999 | 0 (0.0%) | 0 (0.0%) |
| $1,000,000 or more | 0 (0.0%) | 6 (1.6%) |
| Total | 309 (100.0%) | 365 (100.0%) |
Household Income by Mortgage Status in Silver Bay
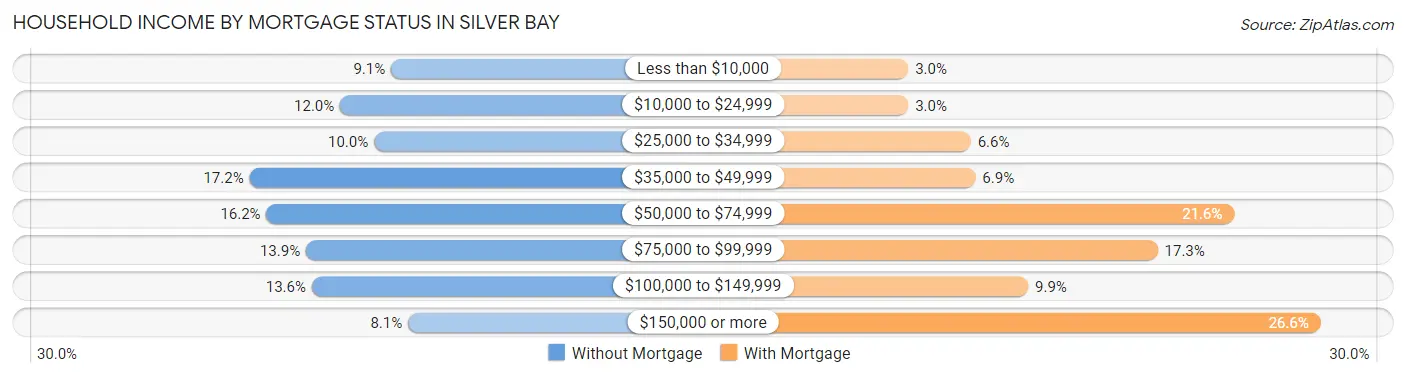
| Household Income | Without Mortgage | With Mortgage |
| Less than $10,000 | 28 (9.1%) | 11 (3.0%) |
| $10,000 to $24,999 | 37 (12.0%) | 11 (3.0%) |
| $25,000 to $34,999 | 31 (10.0%) | 24 (6.6%) |
| $35,000 to $49,999 | 53 (17.2%) | 25 (6.9%) |
| $50,000 to $74,999 | 50 (16.2%) | 79 (21.6%) |
| $75,000 to $99,999 | 43 (13.9%) | 63 (17.3%) |
| $100,000 to $149,999 | 42 (13.6%) | 36 (9.9%) |
| $150,000 or more | 25 (8.1%) | 97 (26.6%) |
| Total | 309 (100.0%) | 365 (100.0%) |
Property Value to Household Income Ratio in Silver Bay
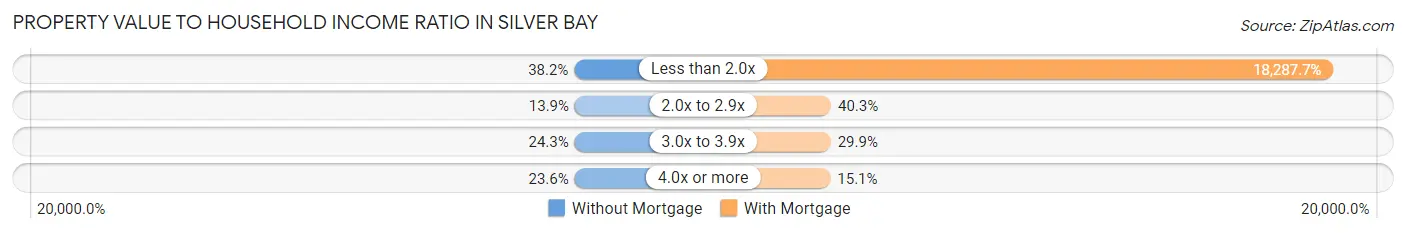
| Value-to-Income Ratio | Without Mortgage | With Mortgage |
| Less than 2.0x | 118 (38.2%) | 66,750 (18,287.7%) |
| 2.0x to 2.9x | 43 (13.9%) | 147 (40.3%) |
| 3.0x to 3.9x | 75 (24.3%) | 109 (29.9%) |
| 4.0x or more | 73 (23.6%) | 55 (15.1%) |
| Total | 309 (100.0%) | 365 (100.0%) |
Real Estate Taxes by Mortgage Status in Silver Bay
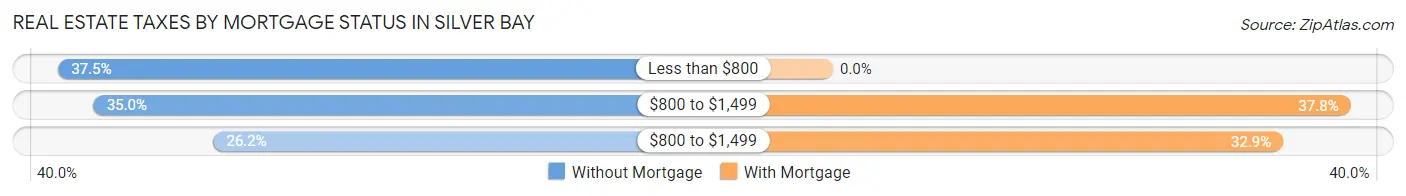
| Property Taxes | Without Mortgage | With Mortgage |
| Less than $800 | 116 (37.5%) | 0 (0.0%) |
| $800 to $1,499 | 108 (34.9%) | 138 (37.8%) |
| $800 to $1,499 | 81 (26.2%) | 120 (32.9%) |
| Total | 309 (100.0%) | 365 (100.0%) |
Health & Disability in Silver Bay
Health Insurance Coverage by Age in Silver Bay
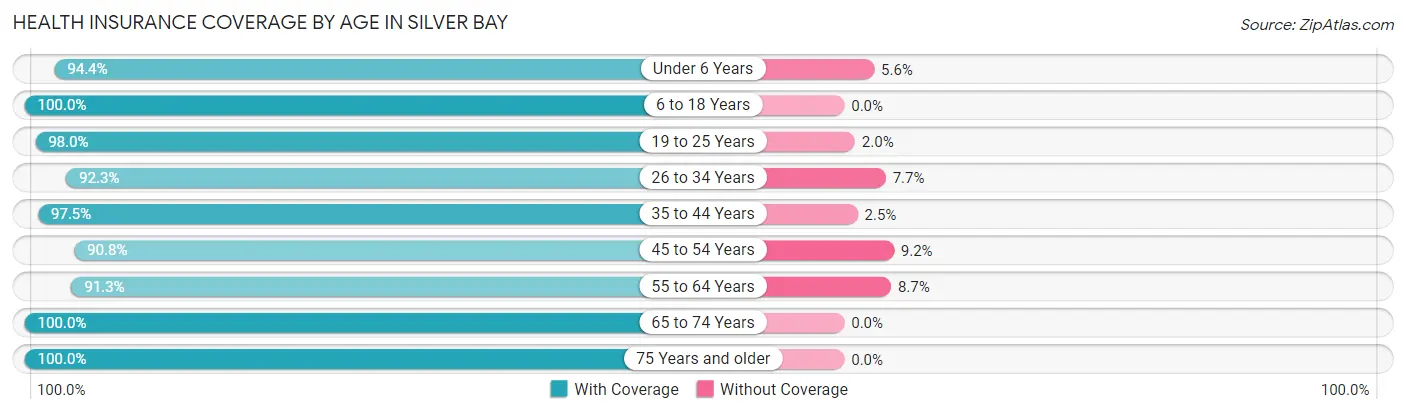
| Age Bracket | With Coverage | Without Coverage |
| Under 6 Years | 119 (94.4%) | 7 (5.6%) |
| 6 to 18 Years | 222 (100.0%) | 0 (0.0%) |
| 19 to 25 Years | 99 (98.0%) | 2 (2.0%) |
| 26 to 34 Years | 179 (92.3%) | 15 (7.7%) |
| 35 to 44 Years | 118 (97.5%) | 3 (2.5%) |
| 45 to 54 Years | 167 (90.8%) | 17 (9.2%) |
| 55 to 64 Years | 220 (91.3%) | 21 (8.7%) |
| 65 to 74 Years | 215 (100.0%) | 0 (0.0%) |
| 75 Years and older | 200 (100.0%) | 0 (0.0%) |
| Total | 1,539 (96.0%) | 65 (4.1%) |
Health Insurance Coverage by Citizenship Status in Silver Bay
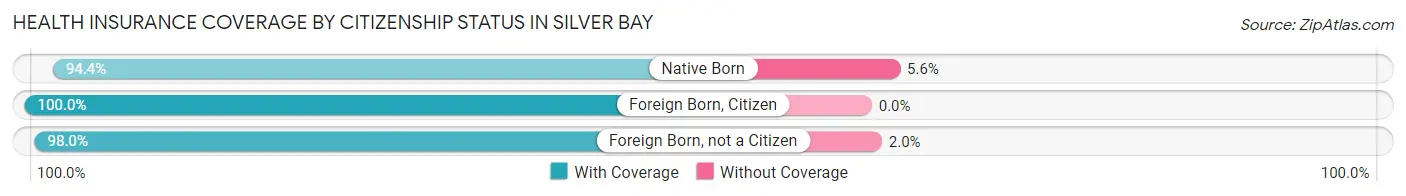
| Citizenship Status | With Coverage | Without Coverage |
| Native Born | 119 (94.4%) | 7 (5.6%) |
| Foreign Born, Citizen | 222 (100.0%) | 0 (0.0%) |
| Foreign Born, not a Citizen | 99 (98.0%) | 2 (2.0%) |
Health Insurance Coverage by Household Income in Silver Bay
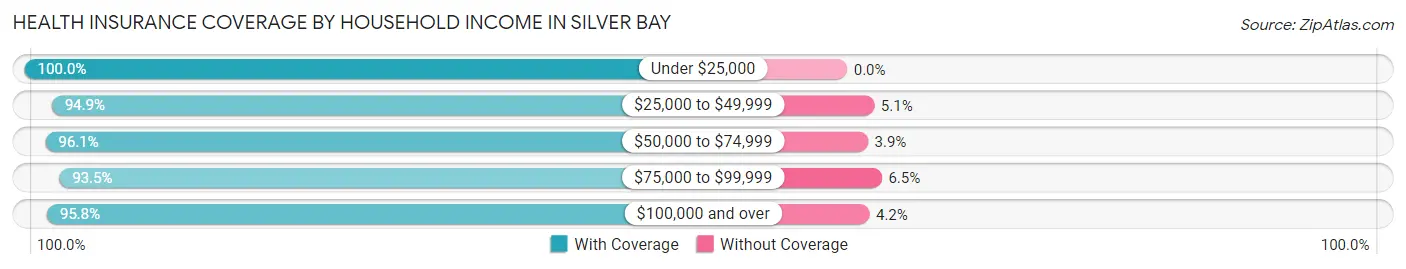
| Household Income | With Coverage | Without Coverage |
| Under $25,000 | 196 (100.0%) | 0 (0.0%) |
| $25,000 to $49,999 | 280 (94.9%) | 15 (5.1%) |
| $50,000 to $74,999 | 247 (96.1%) | 10 (3.9%) |
| $75,000 to $99,999 | 173 (93.5%) | 12 (6.5%) |
| $100,000 and over | 643 (95.8%) | 28 (4.2%) |
Public vs Private Health Insurance Coverage by Age in Silver Bay
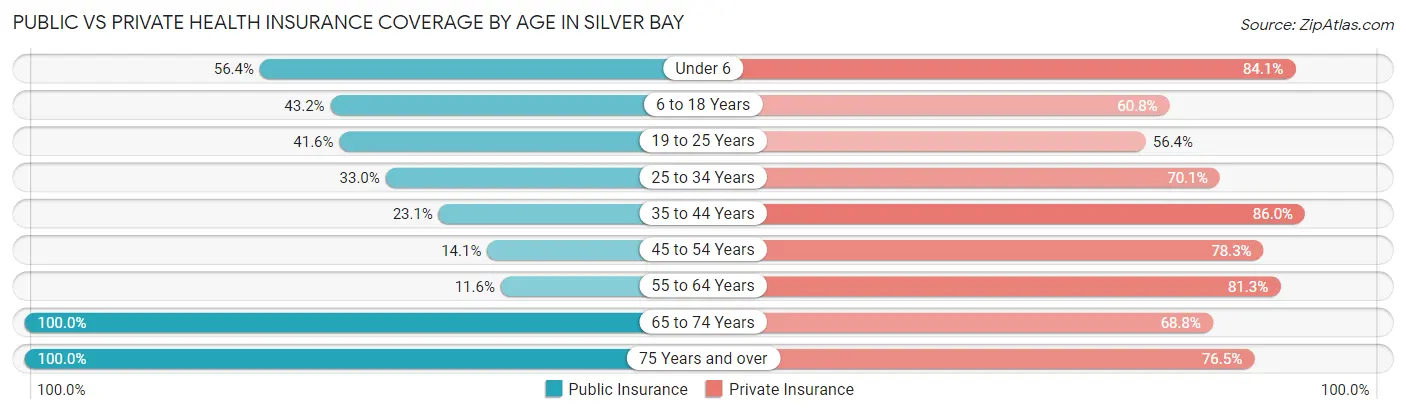
| Age Bracket | Public Insurance | Private Insurance |
| Under 6 | 71 (56.4%) | 106 (84.1%) |
| 6 to 18 Years | 96 (43.2%) | 135 (60.8%) |
| 19 to 25 Years | 42 (41.6%) | 57 (56.4%) |
| 25 to 34 Years | 64 (33.0%) | 136 (70.1%) |
| 35 to 44 Years | 28 (23.1%) | 104 (86.0%) |
| 45 to 54 Years | 26 (14.1%) | 144 (78.3%) |
| 55 to 64 Years | 28 (11.6%) | 196 (81.3%) |
| 65 to 74 Years | 215 (100.0%) | 148 (68.8%) |
| 75 Years and over | 200 (100.0%) | 153 (76.5%) |
| Total | 770 (48.0%) | 1,179 (73.5%) |
Disability Status by Sex by Age in Silver Bay
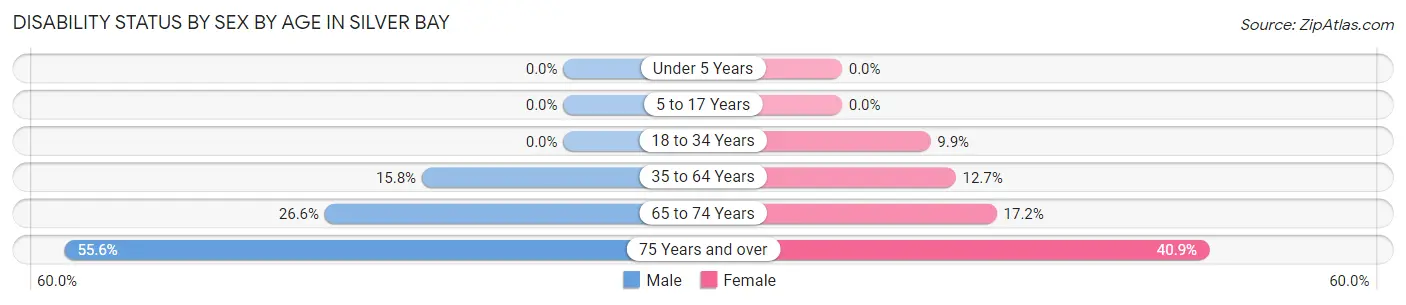
| Age Bracket | Male | Female |
| Under 5 Years | 0 (0.0%) | 0 (0.0%) |
| 5 to 17 Years | 0 (0.0%) | 0 (0.0%) |
| 18 to 34 Years | 0 (0.0%) | 14 (9.9%) |
| 35 to 64 Years | 40 (15.8%) | 37 (12.7%) |
| 65 to 74 Years | 34 (26.6%) | 15 (17.2%) |
| 75 Years and over | 35 (55.6%) | 56 (40.9%) |
Disability Class by Sex by Age in Silver Bay
Disability Class: Hearing Difficulty
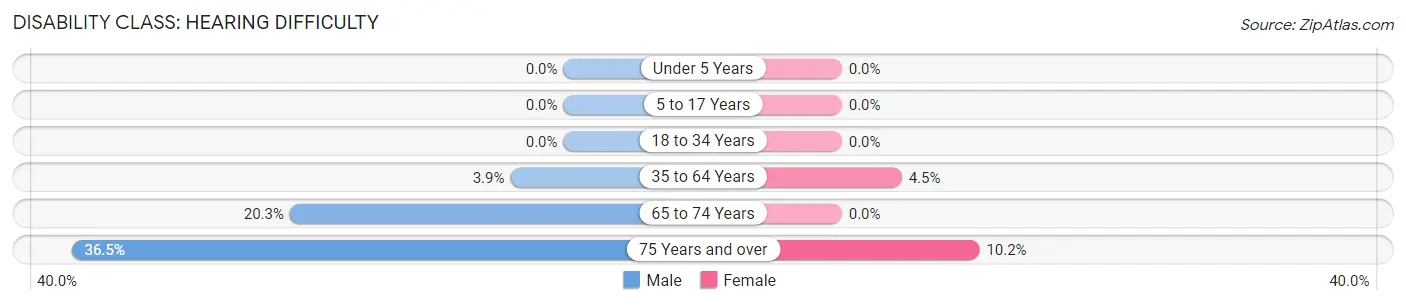
| Age Bracket | Male | Female |
| Under 5 Years | 0 (0.0%) | 0 (0.0%) |
| 5 to 17 Years | 0 (0.0%) | 0 (0.0%) |
| 18 to 34 Years | 0 (0.0%) | 0 (0.0%) |
| 35 to 64 Years | 10 (3.9%) | 13 (4.4%) |
| 65 to 74 Years | 26 (20.3%) | 0 (0.0%) |
| 75 Years and over | 23 (36.5%) | 14 (10.2%) |
Disability Class: Vision Difficulty
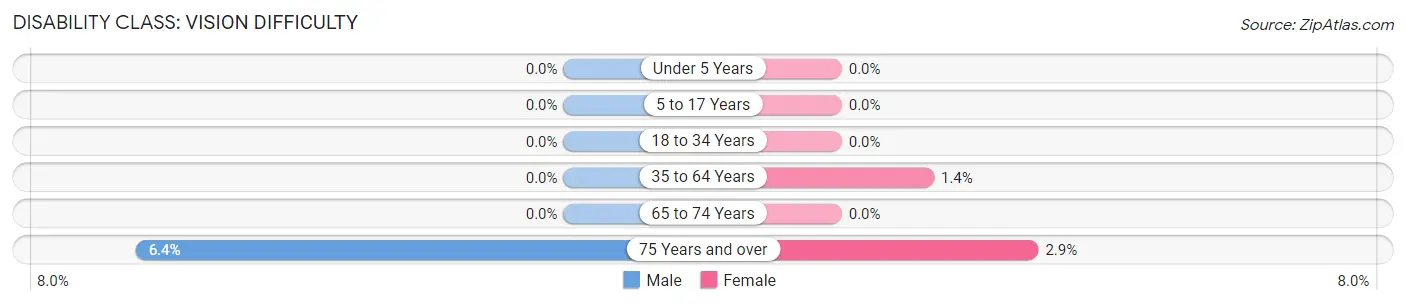
| Age Bracket | Male | Female |
| Under 5 Years | 0 (0.0%) | 0 (0.0%) |
| 5 to 17 Years | 0 (0.0%) | 0 (0.0%) |
| 18 to 34 Years | 0 (0.0%) | 0 (0.0%) |
| 35 to 64 Years | 0 (0.0%) | 4 (1.4%) |
| 65 to 74 Years | 0 (0.0%) | 0 (0.0%) |
| 75 Years and over | 4 (6.4%) | 4 (2.9%) |
Disability Class: Cognitive Difficulty
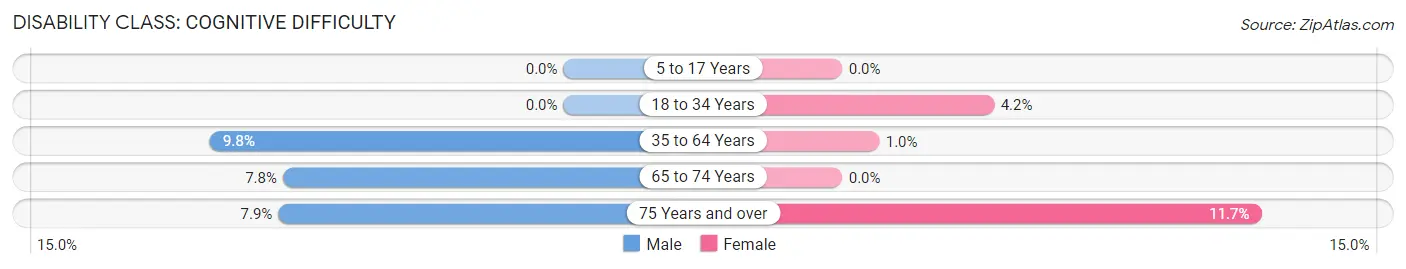
| Age Bracket | Male | Female |
| 5 to 17 Years | 0 (0.0%) | 0 (0.0%) |
| 18 to 34 Years | 0 (0.0%) | 6 (4.2%) |
| 35 to 64 Years | 25 (9.8%) | 3 (1.0%) |
| 65 to 74 Years | 10 (7.8%) | 0 (0.0%) |
| 75 Years and over | 5 (7.9%) | 16 (11.7%) |
Disability Class: Ambulatory Difficulty
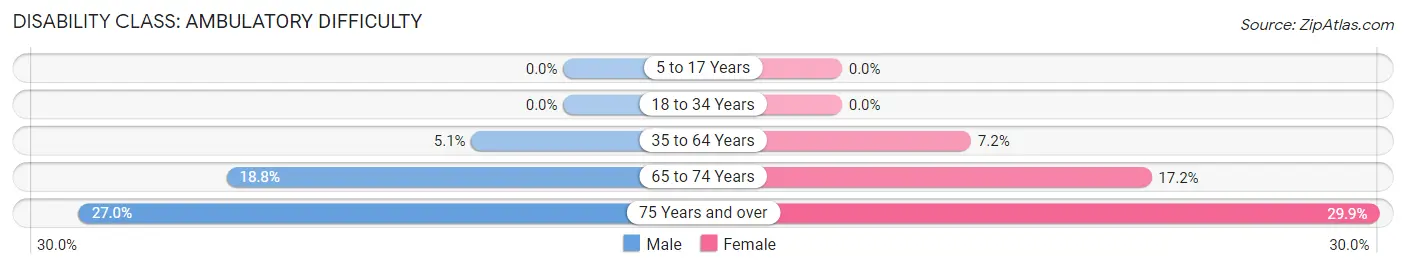
| Age Bracket | Male | Female |
| 5 to 17 Years | 0 (0.0%) | 0 (0.0%) |
| 18 to 34 Years | 0 (0.0%) | 0 (0.0%) |
| 35 to 64 Years | 13 (5.1%) | 21 (7.2%) |
| 65 to 74 Years | 24 (18.8%) | 15 (17.2%) |
| 75 Years and over | 17 (27.0%) | 41 (29.9%) |
Disability Class: Self-Care Difficulty
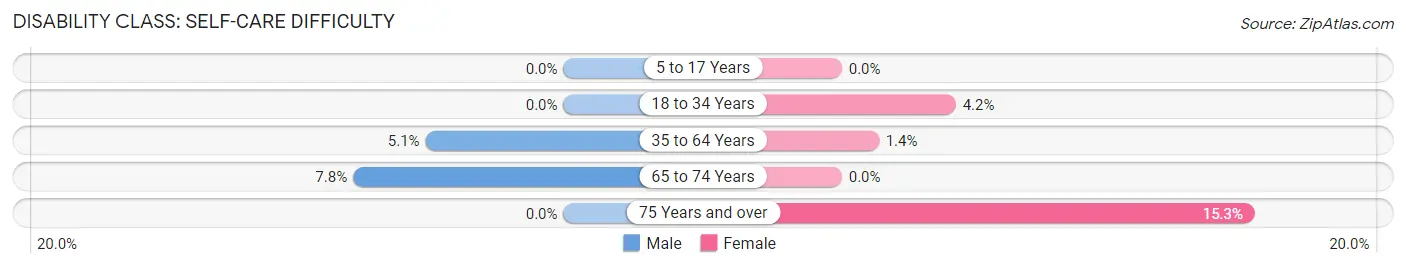
| Age Bracket | Male | Female |
| 5 to 17 Years | 0 (0.0%) | 0 (0.0%) |
| 18 to 34 Years | 0 (0.0%) | 6 (4.2%) |
| 35 to 64 Years | 13 (5.1%) | 4 (1.4%) |
| 65 to 74 Years | 10 (7.8%) | 0 (0.0%) |
| 75 Years and over | 0 (0.0%) | 21 (15.3%) |
Technology Access in Silver Bay
Computing Device Access in Silver Bay
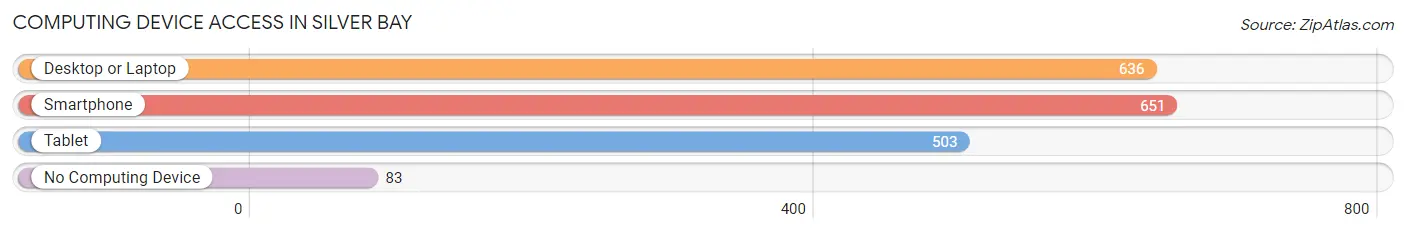
| Device Type | # Households | % Households |
| Desktop or Laptop | 636 | 77.0% |
| Smartphone | 651 | 78.8% |
| Tablet | 503 | 60.9% |
| No Computing Device | 83 | 10.1% |
| Total | 826 | 100.0% |
Internet Access in Silver Bay
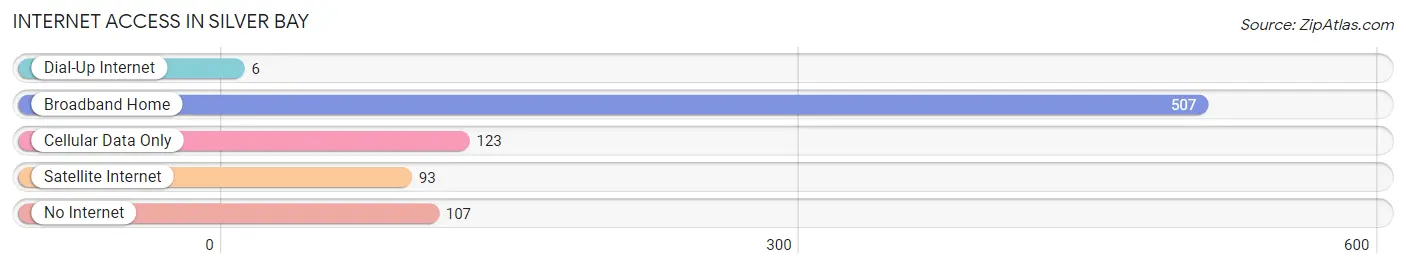
| Internet Type | # Households | % Households |
| Dial-Up Internet | 6 | 0.7% |
| Broadband Home | 507 | 61.4% |
| Cellular Data Only | 123 | 14.9% |
| Satellite Internet | 93 | 11.3% |
| No Internet | 107 | 13.0% |
| Total | 826 | 100.0% |
Silver Bay Summary
Bay History
Silver Bay is a city located in Lake County, Minnesota, United States. It is located on the north shore of Lake Superior, about 25 miles northeast of Duluth. The city was founded in 1883 by the Silver Bay Land Company, which was formed to develop the area for iron ore mining. The city was named after the bay on which it is located, which was named for the silver-colored sandstone found in the area.
The first settlers in the area were the Ojibwe people, who had lived in the area for centuries before the arrival of Europeans. The first Europeans to explore the area were French fur traders, who arrived in the late 1600s. The first permanent settlement in the area was established in 1854 by a group of Finnish settlers.
The area was first explored for iron ore in the late 1800s, and the first mine was opened in 1884. The mine was operated by the Silver Bay Iron Company, which was formed by the Silver Bay Land Company. The mine was a success, and the city of Silver Bay was incorporated in 1887.
The city grew rapidly in the late 1800s and early 1900s, as the iron ore industry flourished. The city was home to several large iron ore mines, as well as a number of smaller mines. The city also had a number of other industries, including logging, fishing, and tourism.
The iron ore industry declined in the mid-1900s, and the city’s population began to decline as well. The last iron ore mine in the area closed in the 1970s, and the city’s population has continued to decline since then.
Geography
Silver Bay is located in Lake County, Minnesota, on the north shore of Lake Superior. The city is located about 25 miles northeast of Duluth. The city is situated on the shore of Silver Bay, which is a large bay on the north shore of Lake Superior. The bay is named for the silver-colored sandstone found in the area.
The city is surrounded by a number of lakes, including Silver Lake, Lake Superior, and Lake Vermilion. The city is also located near the Boundary Waters Canoe Area Wilderness, which is a popular destination for outdoor recreation.
The city has a total area of 4.2 square miles, all of which is land. The city is located at an elevation of 602 feet above sea level.
Economy
The economy of Silver Bay is largely based on tourism and outdoor recreation. The city is home to a number of resorts and lodges, as well as a number of outdoor recreation activities. The city is also home to a number of small businesses, including restaurants, shops, and other services.
The city is also home to a number of manufacturing companies, including a paper mill and a steel mill. The city is also home to a number of mining companies, which are involved in the extraction of iron ore, copper, and other minerals.
Demographics
As of the 2010 census, the city of Silver Bay had a population of 1,868. The population density was 441.7 people per square mile. The racial makeup of the city was 97.2% White, 0.3% African American, 0.3% Native American, 0.3% Asian, 0.1% Pacific Islander, 0.7% from other races, and 1.2% from two or more races. Hispanic or Latino of any race were 1.7% of the population.
The median income for a household in the city was $37,917, and the median income for a family was $45,000. The per capita income for the city was $20,845. About 11.2% of families and 14.2% of the population were below the poverty line, including 19.2% of those under age 18 and 8.2% of those age 65 or over.
Common Questions
What is Per Capita Income in Silver Bay?
Per Capita income in Silver Bay is $41,880.
What is the Median Family Income in Silver Bay?
Median Family Income in Silver Bay is $94,318.
What is the Median Household income in Silver Bay?
Median Household Income in Silver Bay is $65,882.
What is Income or Wage Gap in Silver Bay?
Income or Wage Gap in Silver Bay is 16.7%.
Women in Silver Bay earn 83.3 cents for every dollar earned by a man.
What is Inequality or Gini Index in Silver Bay?
Inequality or Gini Index in Silver Bay is 0.44.
What is the Total Population of Silver Bay?
Total Population of Silver Bay is 1,690.
What is the Total Male Population of Silver Bay?
Total Male Population of Silver Bay is 799.
What is the Total Female Population of Silver Bay?
Total Female Population of Silver Bay is 891.
What is the Ratio of Males per 100 Females in Silver Bay?
There are 89.67 Males per 100 Females in Silver Bay.
What is the Ratio of Females per 100 Males in Silver Bay?
There are 111.51 Females per 100 Males in Silver Bay.
What is the Median Population Age in Silver Bay?
Median Population Age in Silver Bay is 48.7 Years.
What is the Average Family Size in Silver Bay
Average Family Size in Silver Bay is 2.5 People.
What is the Average Household Size in Silver Bay
Average Household Size in Silver Bay is 1.9 People.
How Large is the Labor Force in Silver Bay?
There are 736 People in the Labor Forcein in Silver Bay.
What is the Percentage of People in the Labor Force in Silver Bay?
53.4% of People are in the Labor Force in Silver Bay.
What is the Unemployment Rate in Silver Bay?
Unemployment Rate in Silver Bay is 3.9%.