Cannon Falls, MN Map & Demographics
Cannon Falls Map
Cannon Falls Overview
$37,551
PER CAPITA INCOME
$100,750
AVG FAMILY INCOME
$76,442
AVG HOUSEHOLD INCOME
28.6%
WAGE / INCOME GAP [ % ]
71.4¢/ $1
WAGE / INCOME GAP [ $ ]
0.39
INEQUALITY / GINI INDEX
4,214
TOTAL POPULATION
2,078
MALE POPULATION
2,136
FEMALE POPULATION
97.28
MALES / 100 FEMALES
102.79
FEMALES / 100 MALES
41.6
MEDIAN AGE
3.0
AVG FAMILY SIZE
2.3
AVG HOUSEHOLD SIZE
2,353
LABOR FORCE [ PEOPLE ]
67.7%
PERCENT IN LABOR FORCE
1.6%
UNEMPLOYMENT RATE
Cannon Falls Zip Codes
Income in Cannon Falls
Income Overview in Cannon Falls
Per Capita Income in Cannon Falls is $37,551, while median incomes of families and households are $100,750 and $76,442 respectively.
| Characteristic | Number | Measure |
| Per Capita Income | 4,214 | $37,551 |
| Median Family Income | 1,093 | $100,750 |
| Mean Family Income | 1,093 | $108,112 |
| Median Household Income | 1,775 | $76,442 |
| Mean Household Income | 1,775 | $86,310 |
| Income Deficit | 1,093 | $0 |
| Wage / Income Gap (%) | 4,214 | 28.62% |
| Wage / Income Gap ($) | 4,214 | 71.38¢ per $1 |
| Gini / Inequality Index | 4,214 | 0.39 |
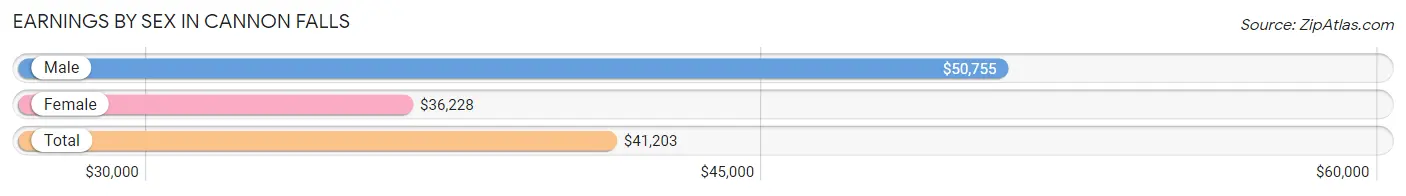
Earnings by Sex in Cannon Falls
Average Earnings in Cannon Falls are $41,203, $50,755 for men and $36,228 for women, a difference of 28.6%.
| Sex | Number | Average Earnings |
| Male | 1,237 (50.3%) | $50,755 |
| Female | 1,221 (49.7%) | $36,228 |
| Total | 2,458 (100.0%) | $41,203 |
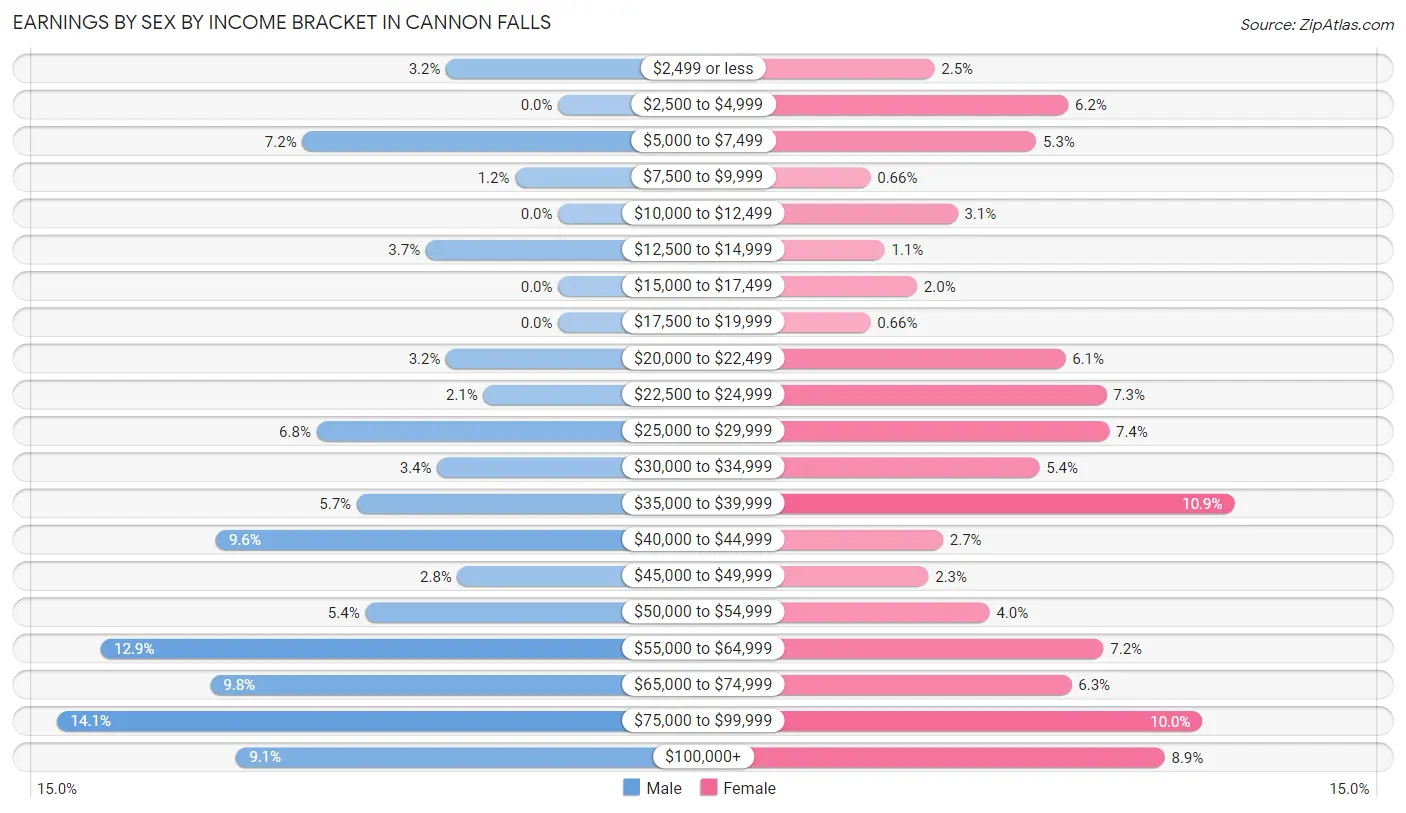
Earnings by Sex by Income Bracket in Cannon Falls
The most common earnings brackets in Cannon Falls are $75,000 to $99,999 for men (174 | 14.1%) and $35,000 to $39,999 for women (133 | 10.9%).
| Income | Male | Female |
| $2,499 or less | 39 (3.2%) | 30 (2.5%) |
| $2,500 to $4,999 | 0 (0.0%) | 76 (6.2%) |
| $5,000 to $7,499 | 89 (7.2%) | 65 (5.3%) |
| $7,500 to $9,999 | 15 (1.2%) | 8 (0.7%) |
| $10,000 to $12,499 | 0 (0.0%) | 38 (3.1%) |
| $12,500 to $14,999 | 46 (3.7%) | 13 (1.1%) |
| $15,000 to $17,499 | 0 (0.0%) | 24 (2.0%) |
| $17,500 to $19,999 | 0 (0.0%) | 8 (0.7%) |
| $20,000 to $22,499 | 39 (3.2%) | 75 (6.1%) |
| $22,500 to $24,999 | 26 (2.1%) | 89 (7.3%) |
| $25,000 to $29,999 | 84 (6.8%) | 90 (7.4%) |
| $30,000 to $34,999 | 42 (3.4%) | 66 (5.4%) |
| $35,000 to $39,999 | 70 (5.7%) | 133 (10.9%) |
| $40,000 to $44,999 | 119 (9.6%) | 33 (2.7%) |
| $45,000 to $49,999 | 35 (2.8%) | 28 (2.3%) |
| $50,000 to $54,999 | 67 (5.4%) | 49 (4.0%) |
| $55,000 to $64,999 | 159 (12.9%) | 88 (7.2%) |
| $65,000 to $74,999 | 121 (9.8%) | 77 (6.3%) |
| $75,000 to $99,999 | 174 (14.1%) | 122 (10.0%) |
| $100,000+ | 112 (9.0%) | 109 (8.9%) |
| Total | 1,237 (100.0%) | 1,221 (100.0%) |
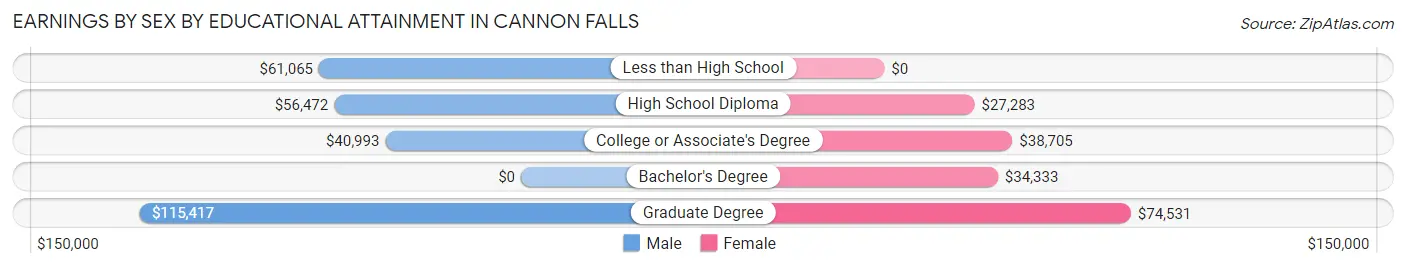
Earnings by Sex by Educational Attainment in Cannon Falls
Average earnings in Cannon Falls are $53,224 for men and $38,583 for women, a difference of 27.5%. Men with an educational attainment of graduate degree enjoy the highest average annual earnings of $115,417, while those with college or associate's degree education earn the least with $40,993. Women with an educational attainment of graduate degree earn the most with the average annual earnings of $74,531, while those with high school diploma education have the smallest earnings of $27,283.
| Educational Attainment | Male Income | Female Income |
| Less than High School | $61,065 | $0 |
| High School Diploma | $56,472 | $27,283 |
| College or Associate's Degree | $40,993 | $38,705 |
| Bachelor's Degree | - | - |
| Graduate Degree | $115,417 | $74,531 |
| Total | $53,224 | $38,583 |
Family Income in Cannon Falls
Family Income Brackets in Cannon Falls
According to the Cannon Falls family income data, there are 290 families falling into the $100,000 to $149,999 income range, which is the most common income bracket and makes up 26.5% of all families.
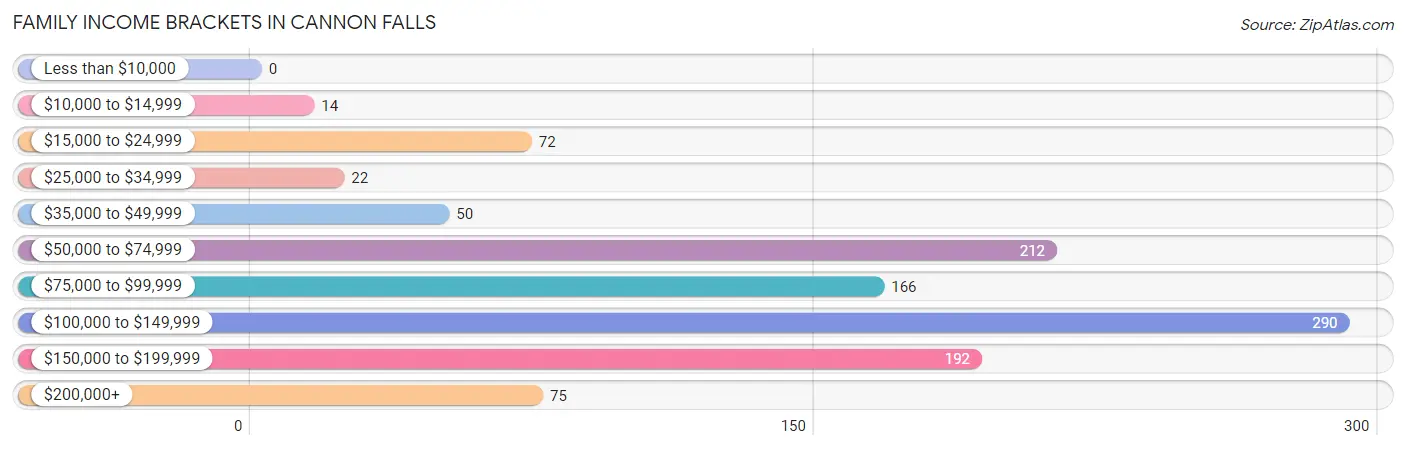
| Income Bracket | # Families | % Families |
| Less than $10,000 | 0 | 0.0% |
| $10,000 to $14,999 | 14 | 1.3% |
| $15,000 to $24,999 | 72 | 6.6% |
| $25,000 to $34,999 | 22 | 2.0% |
| $35,000 to $49,999 | 50 | 4.6% |
| $50,000 to $74,999 | 212 | 19.4% |
| $75,000 to $99,999 | 166 | 15.2% |
| $100,000 to $149,999 | 290 | 26.5% |
| $150,000 to $199,999 | 192 | 17.6% |
| $200,000+ | 75 | 6.9% |
Family Income by Famaliy Size in Cannon Falls
4-person families (231 | 21.1%) account for the highest median family income in Cannon Falls with $121,950 per family, while 2-person families (515 | 47.1%) have the highest median income of $48,812 per family member.
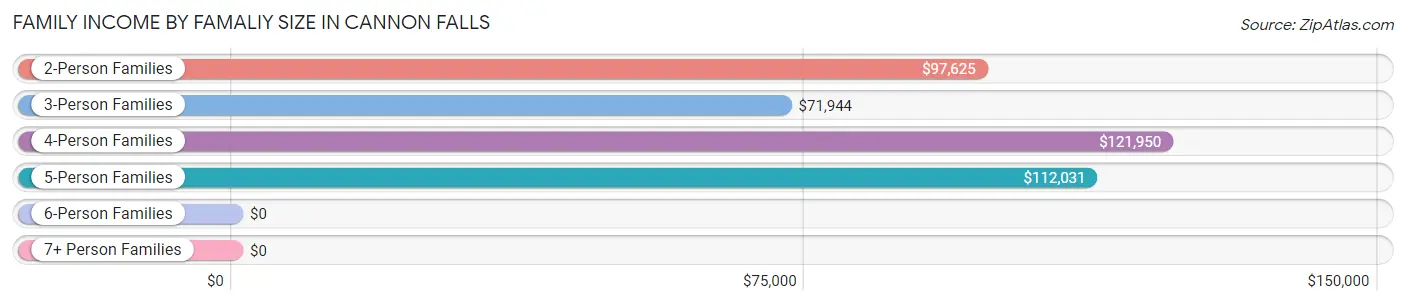
| Income Bracket | # Families | Median Income |
| 2-Person Families | 515 (47.1%) | $97,625 |
| 3-Person Families | 284 (26.0%) | $71,944 |
| 4-Person Families | 231 (21.1%) | $121,950 |
| 5-Person Families | 45 (4.1%) | $112,031 |
| 6-Person Families | 18 (1.7%) | $0 |
| 7+ Person Families | 0 (0.0%) | $0 |
| Total | 1,093 (100.0%) | $100,750 |
Family Income by Number of Earners in Cannon Falls
The median family income in Cannon Falls is $100,750, with families comprising 3+ earners (186) having the highest median family income of $158,750, while families with no earners (172) have the lowest median family income of $60,139, accounting for 17.0% and 15.7% of families, respectively.
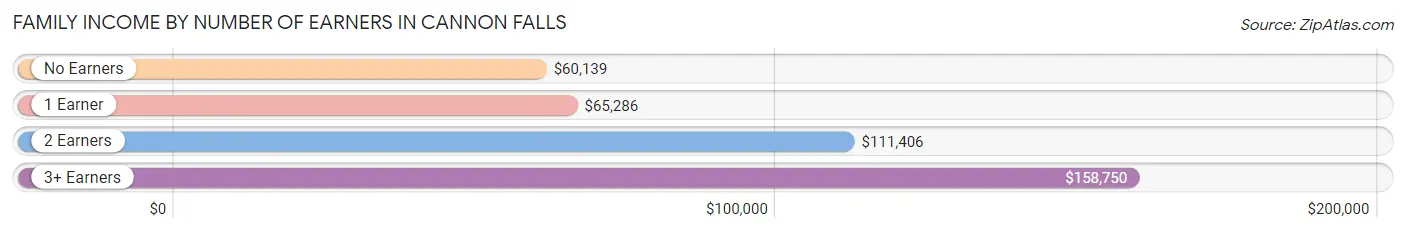
| Number of Earners | # Families | Median Income |
| No Earners | 172 (15.7%) | $60,139 |
| 1 Earner | 238 (21.8%) | $65,286 |
| 2 Earners | 497 (45.5%) | $111,406 |
| 3+ Earners | 186 (17.0%) | $158,750 |
| Total | 1,093 (100.0%) | $100,750 |
Household Income in Cannon Falls
Household Income Brackets in Cannon Falls
With 364 households falling in the category, the $100,000 to $149,999 income range is the most frequent in Cannon Falls, accounting for 20.5% of all households. In contrast, only 53 households (3.0%) fall into the less than $10,000 income bracket, making it the least populous group.
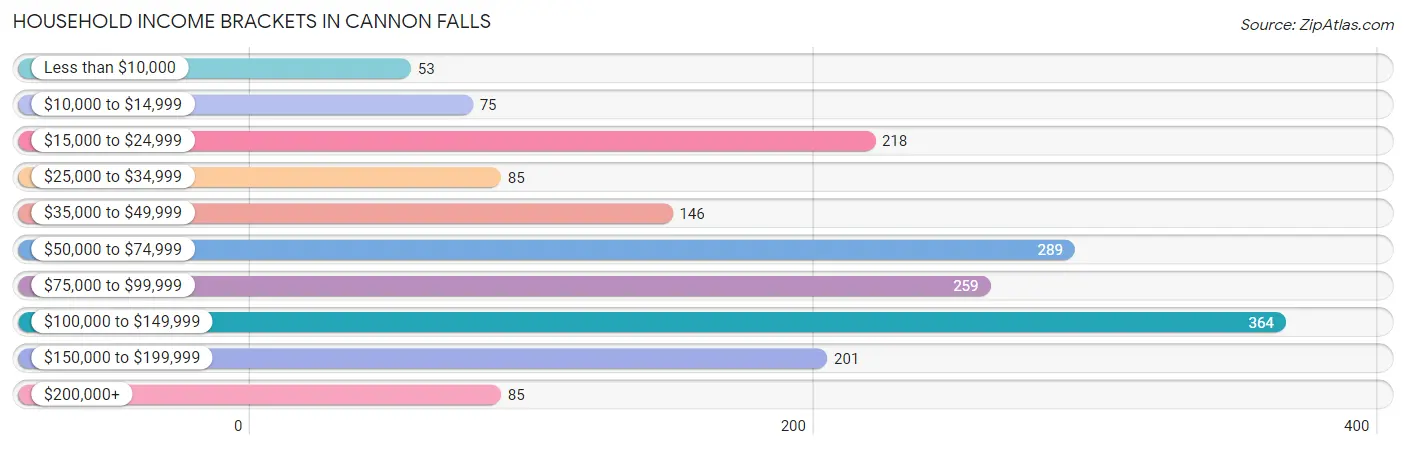
| Income Bracket | # Households | % Households |
| Less than $10,000 | 53 | 3.0% |
| $10,000 to $14,999 | 75 | 4.2% |
| $15,000 to $24,999 | 218 | 12.3% |
| $25,000 to $34,999 | 85 | 4.8% |
| $35,000 to $49,999 | 146 | 8.2% |
| $50,000 to $74,999 | 289 | 16.3% |
| $75,000 to $99,999 | 259 | 14.6% |
| $100,000 to $149,999 | 364 | 20.5% |
| $150,000 to $199,999 | 201 | 11.3% |
| $200,000+ | 85 | 4.8% |
Household Income by Householder Age in Cannon Falls
The median household income in Cannon Falls is $76,442, with the highest median household income of $94,028 found in the 45 to 64 years age bracket for the primary householder. A total of 656 households (37.0%) fall into this category. Meanwhile, the 15 to 24 years age bracket for the primary householder has the lowest median household income of $0, with 24 households (1.3%) in this group.
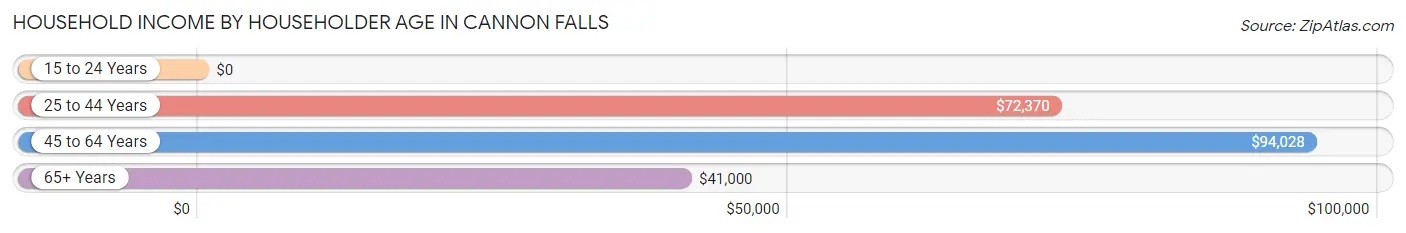
| Income Bracket | # Households | Median Income |
| 15 to 24 Years | 24 (1.3%) | $0 |
| 25 to 44 Years | 571 (32.2%) | $72,370 |
| 45 to 64 Years | 656 (37.0%) | $94,028 |
| 65+ Years | 524 (29.5%) | $41,000 |
| Total | 1,775 (100.0%) | $76,442 |
Poverty in Cannon Falls
Income Below Poverty by Sex and Age in Cannon Falls
With 3.0% poverty level for males and 7.6% for females among the residents of Cannon Falls, 45 to 54 year old males and 6 to 11 year old females are the most vulnerable to poverty, with 14 males (7.6%) and 8 females (15.7%) in their respective age groups living below the poverty level.
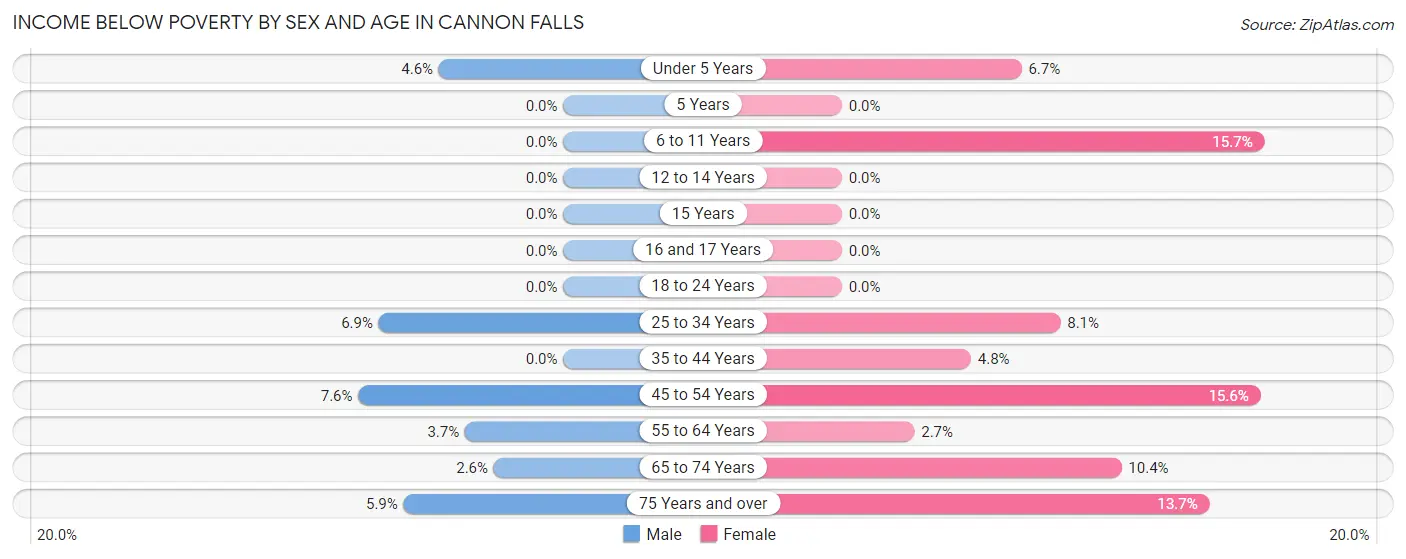
| Age Bracket | Male | Female |
| Under 5 Years | 6 (4.6%) | 7 (6.7%) |
| 5 Years | 0 (0.0%) | 0 (0.0%) |
| 6 to 11 Years | 0 (0.0%) | 8 (15.7%) |
| 12 to 14 Years | 0 (0.0%) | 0 (0.0%) |
| 15 Years | 0 (0.0%) | 0 (0.0%) |
| 16 and 17 Years | 0 (0.0%) | 0 (0.0%) |
| 18 to 24 Years | 0 (0.0%) | 0 (0.0%) |
| 25 to 34 Years | 17 (6.9%) | 27 (8.1%) |
| 35 to 44 Years | 0 (0.0%) | 14 (4.8%) |
| 45 to 54 Years | 14 (7.6%) | 37 (15.5%) |
| 55 to 64 Years | 14 (3.6%) | 9 (2.7%) |
| 65 to 74 Years | 4 (2.6%) | 19 (10.4%) |
| 75 Years and over | 7 (5.9%) | 37 (13.7%) |
| Total | 62 (3.0%) | 158 (7.6%) |
Income Above Poverty by Sex and Age in Cannon Falls
According to the poverty statistics in Cannon Falls, males aged 5 years and females aged 5 years are the age groups that are most secure financially, with 100.0% of males and 100.0% of females in these age groups living above the poverty line.
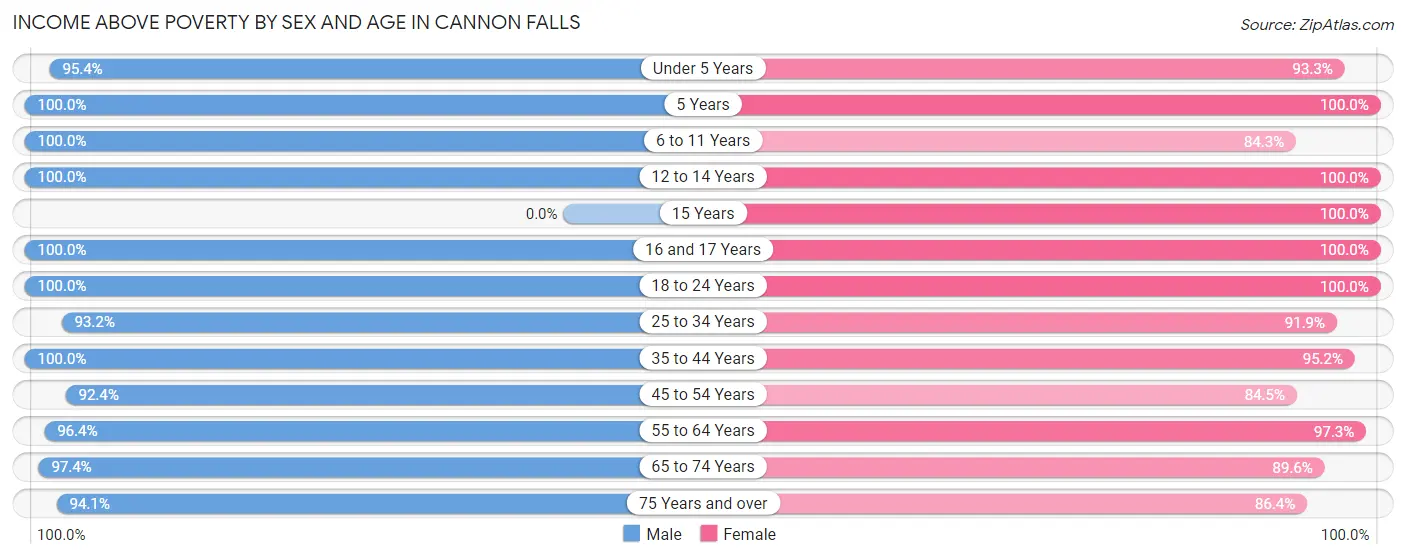
| Age Bracket | Male | Female |
| Under 5 Years | 124 (95.4%) | 98 (93.3%) |
| 5 Years | 8 (100.0%) | 25 (100.0%) |
| 6 to 11 Years | 262 (100.0%) | 43 (84.3%) |
| 12 to 14 Years | 66 (100.0%) | 54 (100.0%) |
| 15 Years | 0 (0.0%) | 28 (100.0%) |
| 16 and 17 Years | 44 (100.0%) | 41 (100.0%) |
| 18 to 24 Years | 141 (100.0%) | 119 (100.0%) |
| 25 to 34 Years | 231 (93.1%) | 306 (91.9%) |
| 35 to 44 Years | 302 (100.0%) | 278 (95.2%) |
| 45 to 54 Years | 170 (92.4%) | 201 (84.5%) |
| 55 to 64 Years | 370 (96.4%) | 325 (97.3%) |
| 65 to 74 Years | 151 (97.4%) | 164 (89.6%) |
| 75 Years and over | 111 (94.1%) | 234 (86.4%) |
| Total | 1,980 (97.0%) | 1,916 (92.4%) |
Income Below Poverty Among Married-Couple Families in Cannon Falls
The poverty statistics for married-couple families in Cannon Falls show that 1.7% or 15 of the total 872 families live below the poverty line. Families with 1 or 2 children have the highest poverty rate of 2.5%, comprising of 8 families. On the other hand, families with 3 or 4 children have the lowest poverty rate of 0.0%, which includes 0 families.
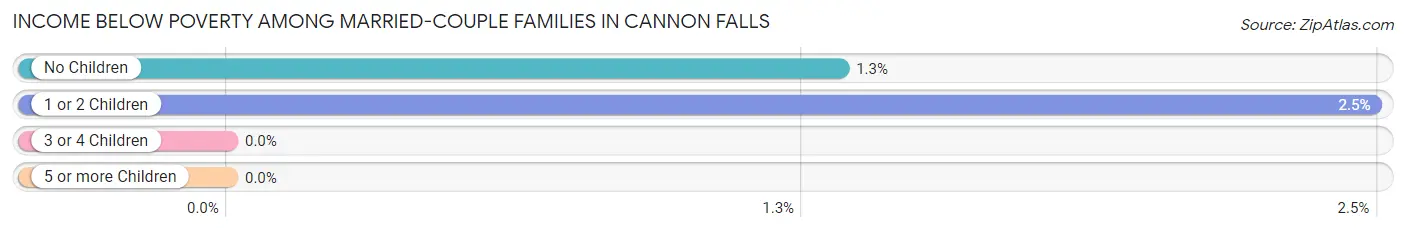
| Children | Above Poverty | Below Poverty |
| No Children | 518 (98.7%) | 7 (1.3%) |
| 1 or 2 Children | 313 (97.5%) | 8 (2.5%) |
| 3 or 4 Children | 26 (100.0%) | 0 (0.0%) |
| 5 or more Children | 0 (0.0%) | 0 (0.0%) |
| Total | 857 (98.3%) | 15 (1.7%) |
Income Below Poverty Among Single-Parent Households in Cannon Falls
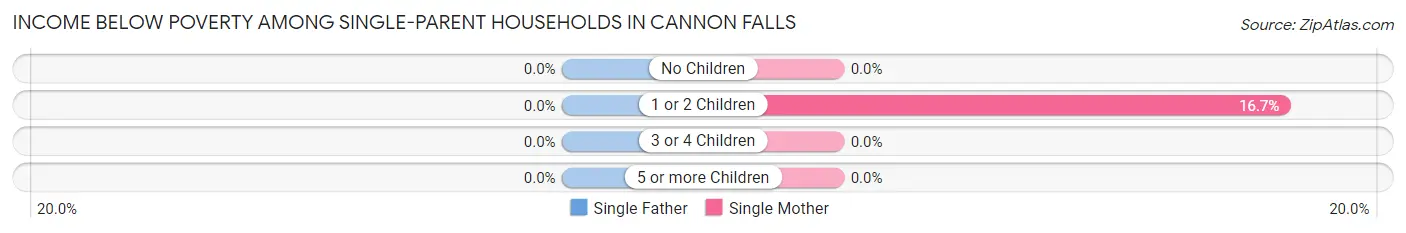
| Children | Single Father | Single Mother |
| No Children | 0 (0.0%) | 0 (0.0%) |
| 1 or 2 Children | 0 (0.0%) | 14 (16.7%) |
| 3 or 4 Children | 0 (0.0%) | 0 (0.0%) |
| 5 or more Children | 0 (0.0%) | 0 (0.0%) |
| Total | 0 (0.0%) | 14 (9.7%) |
Income Below Poverty Among Married-Couple vs Single-Parent Households in Cannon Falls
The poverty data for Cannon Falls shows that 15 of the married-couple family households (1.7%) and 14 of the single-parent households (6.3%) are living below the poverty level. Within the married-couple family households, those with 1 or 2 children have the highest poverty rate, with 8 households (2.5%) falling below the poverty line. Among the single-parent households, those with 1 or 2 children have the highest poverty rate, with 14 household (11.2%) living below poverty.
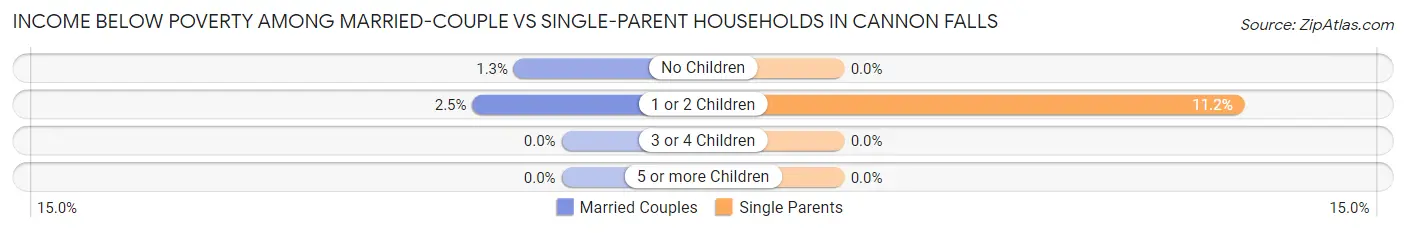
| Children | Married-Couple Families | Single-Parent Households |
| No Children | 7 (1.3%) | 0 (0.0%) |
| 1 or 2 Children | 8 (2.5%) | 14 (11.2%) |
| 3 or 4 Children | 0 (0.0%) | 0 (0.0%) |
| 5 or more Children | 0 (0.0%) | 0 (0.0%) |
| Total | 15 (1.7%) | 14 (6.3%) |
Race in Cannon Falls
The most populous races in Cannon Falls are White / Caucasian (3,894 | 92.4%), Two or more Races (172 | 4.1%), and Some other Race (123 | 2.9%).
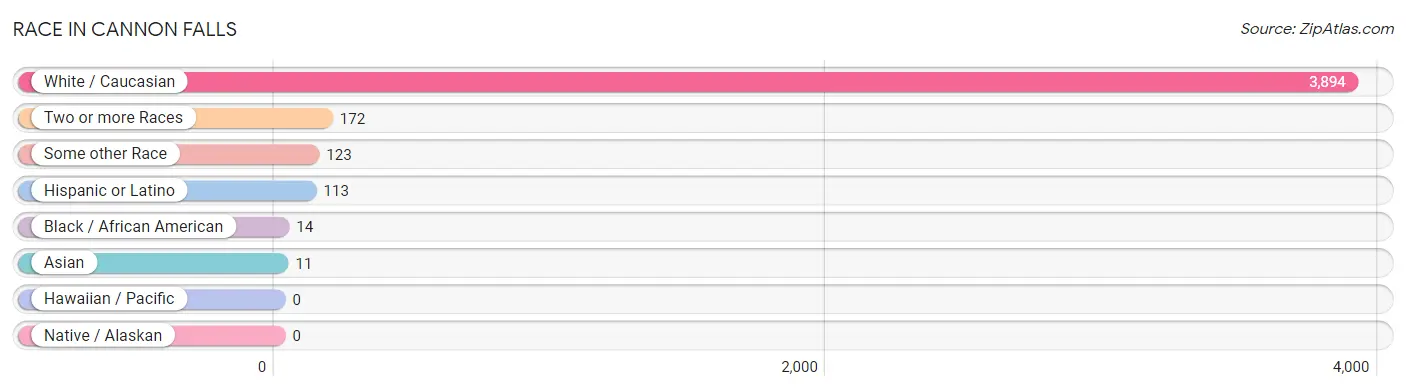
| Race | # Population | % Population |
| Asian | 11 | 0.3% |
| Black / African American | 14 | 0.3% |
| Hawaiian / Pacific | 0 | 0.0% |
| Hispanic or Latino | 113 | 2.7% |
| Native / Alaskan | 0 | 0.0% |
| White / Caucasian | 3,894 | 92.4% |
| Two or more Races | 172 | 4.1% |
| Some other Race | 123 | 2.9% |
| Total | 4,214 | 100.0% |
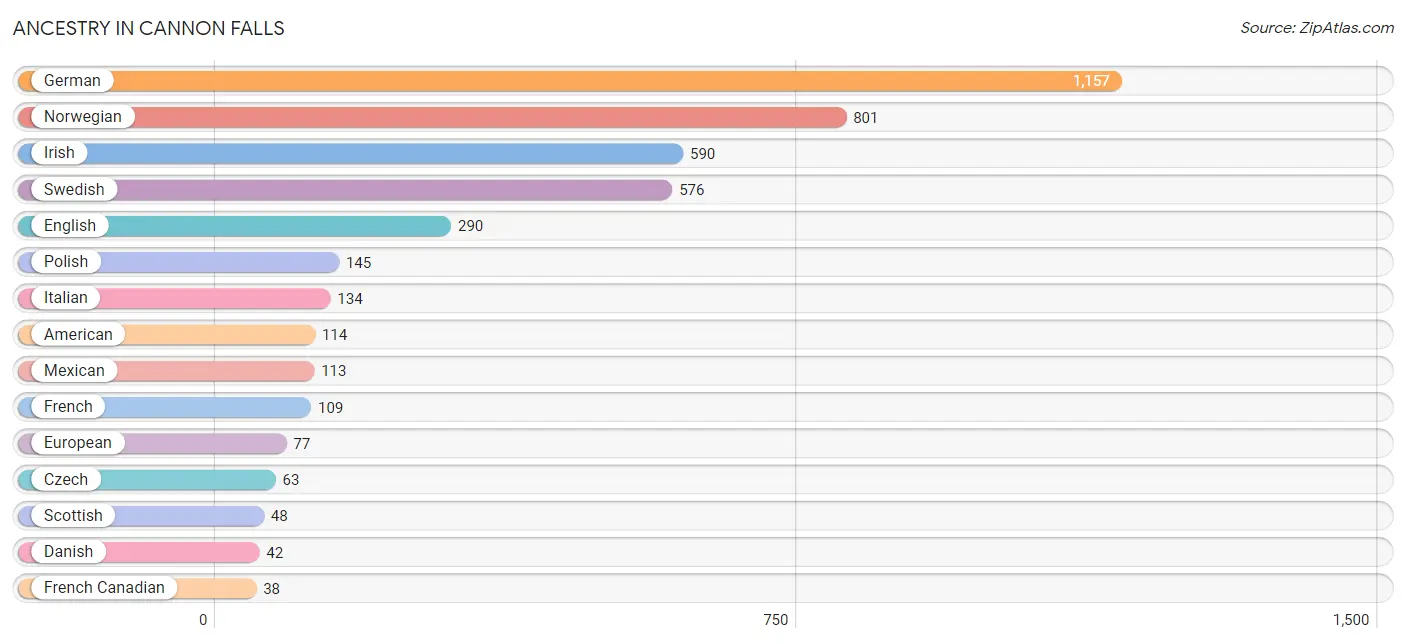
Ancestry in Cannon Falls
The most populous ancestries reported in Cannon Falls are German (1,157 | 27.5%), Norwegian (801 | 19.0%), Irish (590 | 14.0%), Swedish (576 | 13.7%), and English (290 | 6.9%), together accounting for 81.0% of all Cannon Falls residents.
| Ancestry | # Population | % Population |
| African | 14 | 0.3% |
| American | 114 | 2.7% |
| Arab | 9 | 0.2% |
| Austrian | 12 | 0.3% |
| Belgian | 10 | 0.2% |
| Bhutanese | 14 | 0.3% |
| Burmese | 29 | 0.7% |
| Canadian | 12 | 0.3% |
| Cape Verdean | 7 | 0.2% |
| Croatian | 13 | 0.3% |
| Czech | 63 | 1.5% |
| Czechoslovakian | 12 | 0.3% |
| Danish | 42 | 1.0% |
| Dutch | 25 | 0.6% |
| English | 290 | 6.9% |
| European | 77 | 1.8% |
| Finnish | 32 | 0.8% |
| French | 109 | 2.6% |
| French Canadian | 38 | 0.9% |
| German | 1,157 | 27.5% |
| Greek | 22 | 0.5% |
| Irish | 590 | 14.0% |
| Italian | 134 | 3.2% |
| Lebanese | 9 | 0.2% |
| Luxembourger | 31 | 0.7% |
| Mexican | 113 | 2.7% |
| Northern European | 23 | 0.5% |
| Norwegian | 801 | 19.0% |
| Polish | 145 | 3.4% |
| Russian | 10 | 0.2% |
| Scandinavian | 21 | 0.5% |
| Scotch-Irish | 19 | 0.4% |
| Scottish | 48 | 1.1% |
| Sioux | 15 | 0.4% |
| Subsaharan African | 21 | 0.5% |
| Swedish | 576 | 13.7% |
| Swiss | 9 | 0.2% |
| Thai | 5 | 0.1% |
| Welsh | 9 | 0.2% | View All 39 Rows |
Immigrants in Cannon Falls
The most numerous immigrant groups reported in Cannon Falls came from Central America (17 | 0.4%), Latin America (17 | 0.4%), Mexico (17 | 0.4%), Canada (12 | 0.3%), and Asia (6 | 0.1%), together accounting for 1.6% of all Cannon Falls residents.
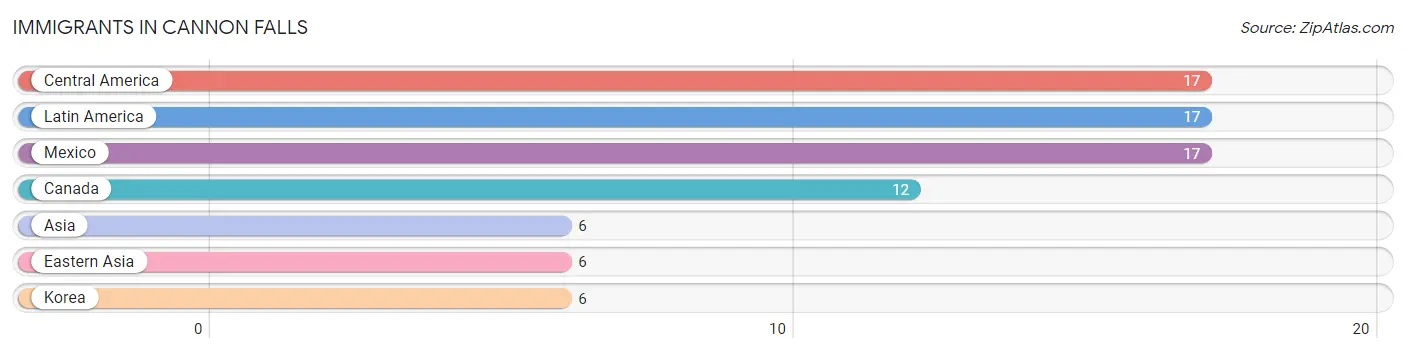
| Immigration Origin | # Population | % Population |
| Asia | 6 | 0.1% |
| Canada | 12 | 0.3% |
| Central America | 17 | 0.4% |
| Eastern Asia | 6 | 0.1% |
| Korea | 6 | 0.1% |
| Latin America | 17 | 0.4% |
| Mexico | 17 | 0.4% | View All 7 Rows |
Sex and Age in Cannon Falls
Sex and Age in Cannon Falls
The most populous age groups in Cannon Falls are 5 to 9 Years (205 | 9.9%) for men and 30 to 34 Years (227 | 10.6%) for women.
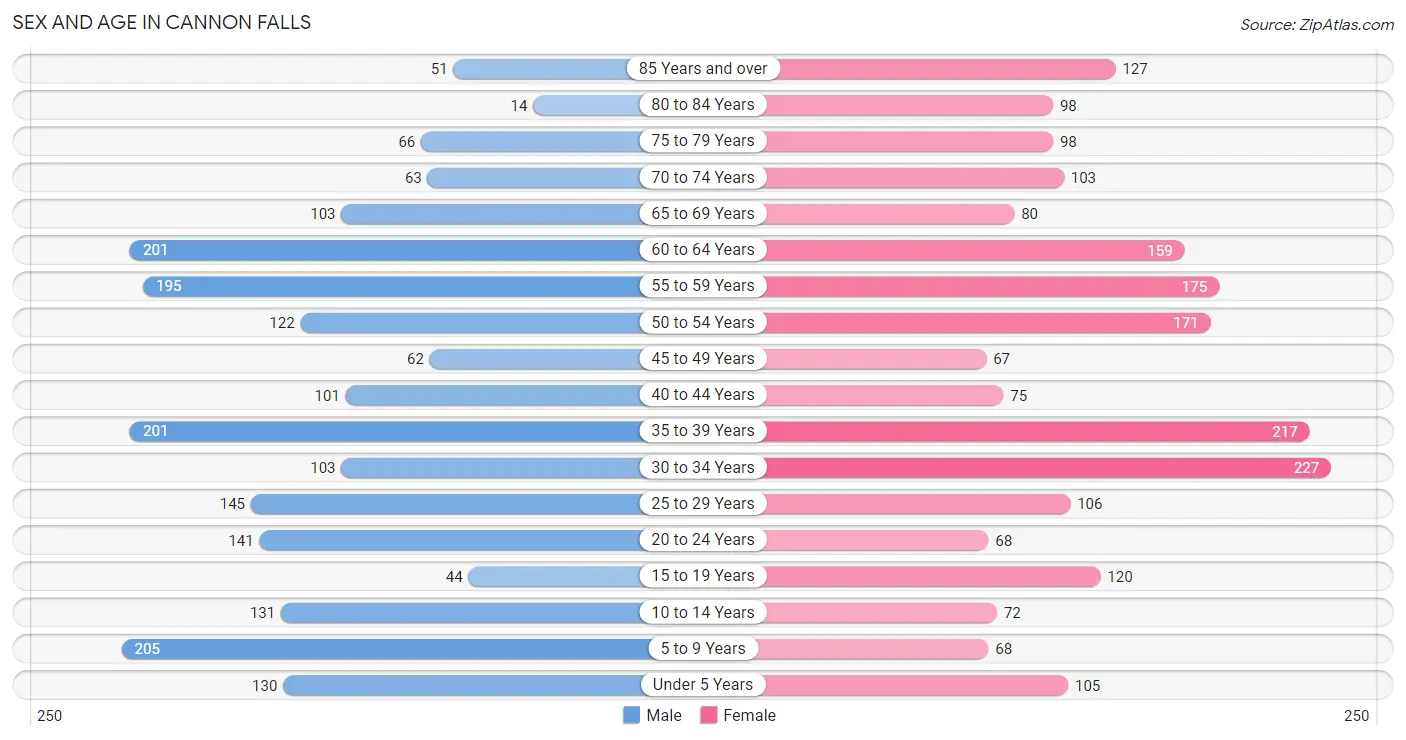
| Age Bracket | Male | Female |
| Under 5 Years | 130 (6.3%) | 105 (4.9%) |
| 5 to 9 Years | 205 (9.9%) | 68 (3.2%) |
| 10 to 14 Years | 131 (6.3%) | 72 (3.4%) |
| 15 to 19 Years | 44 (2.1%) | 120 (5.6%) |
| 20 to 24 Years | 141 (6.8%) | 68 (3.2%) |
| 25 to 29 Years | 145 (7.0%) | 106 (5.0%) |
| 30 to 34 Years | 103 (5.0%) | 227 (10.6%) |
| 35 to 39 Years | 201 (9.7%) | 217 (10.2%) |
| 40 to 44 Years | 101 (4.9%) | 75 (3.5%) |
| 45 to 49 Years | 62 (3.0%) | 67 (3.1%) |
| 50 to 54 Years | 122 (5.9%) | 171 (8.0%) |
| 55 to 59 Years | 195 (9.4%) | 175 (8.2%) |
| 60 to 64 Years | 201 (9.7%) | 159 (7.4%) |
| 65 to 69 Years | 103 (5.0%) | 80 (3.7%) |
| 70 to 74 Years | 63 (3.0%) | 103 (4.8%) |
| 75 to 79 Years | 66 (3.2%) | 98 (4.6%) |
| 80 to 84 Years | 14 (0.7%) | 98 (4.6%) |
| 85 Years and over | 51 (2.5%) | 127 (5.9%) |
| Total | 2,078 (100.0%) | 2,136 (100.0%) |
Families and Households in Cannon Falls
Median Family Size in Cannon Falls
The median family size in Cannon Falls is 2.99 persons per family, with married-couple families (872 | 79.8%) accounting for the largest median family size of 3.08 persons per family. On the other hand, single female/mother families (144 | 13.2%) represent the smallest median family size with 2.43 persons per family.
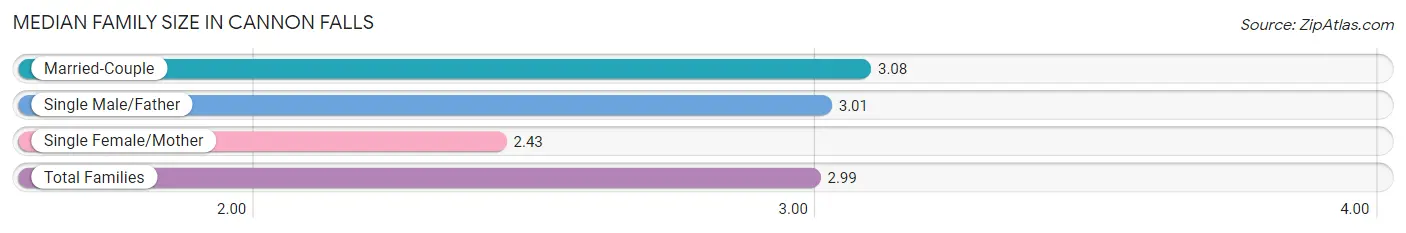
| Family Type | # Families | Family Size |
| Married-Couple | 872 (79.8%) | 3.08 |
| Single Male/Father | 77 (7.0%) | 3.01 |
| Single Female/Mother | 144 (13.2%) | 2.43 |
| Total Families | 1,093 (100.0%) | 2.99 |
Median Household Size in Cannon Falls
The median household size in Cannon Falls is 2.31 persons per household, with single male/father households (77 | 4.3%) accounting for the largest median household size of 3.53 persons per household. non-family households (682 | 38.4%) represent the smallest median household size with 1.14 persons per household.
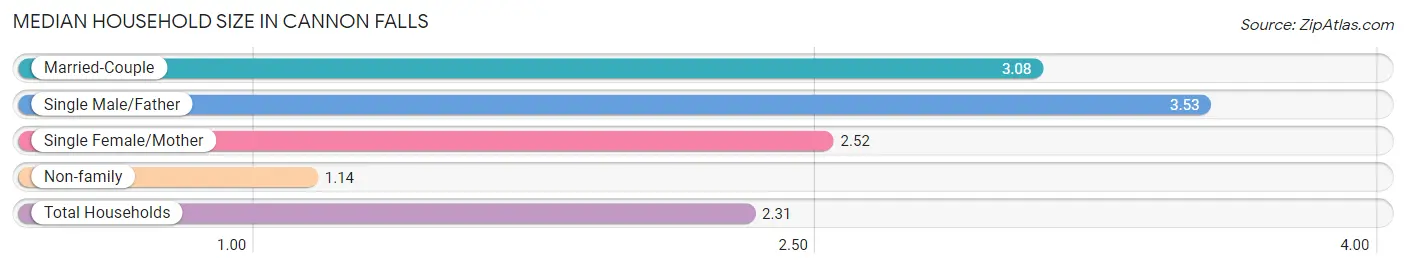
| Household Type | # Households | Household Size |
| Married-Couple | 872 (49.1%) | 3.08 |
| Single Male/Father | 77 (4.3%) | 3.53 |
| Single Female/Mother | 144 (8.1%) | 2.52 |
| Non-family | 682 (38.4%) | 1.14 |
| Total Households | 1,775 (100.0%) | 2.31 |
Household Size by Marriage Status in Cannon Falls
Out of a total of 1,775 households in Cannon Falls, 1,093 (61.6%) are family households, while 682 (38.4%) are nonfamily households. The most numerous type of family households are 2-person households, comprising 507, and the most common type of nonfamily households are 1-person households, comprising 587.
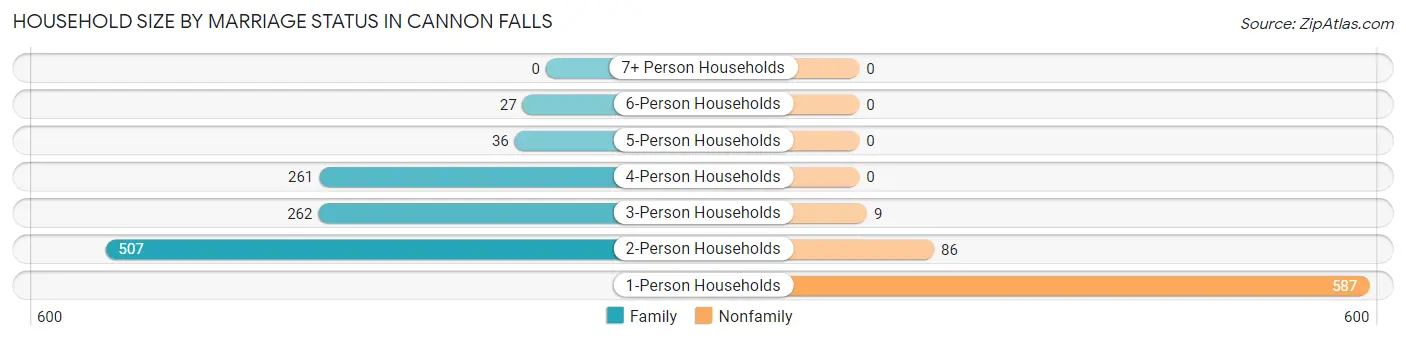
| Household Size | Family Households | Nonfamily Households |
| 1-Person Households | - | 587 (33.1%) |
| 2-Person Households | 507 (28.6%) | 86 (4.9%) |
| 3-Person Households | 262 (14.8%) | 9 (0.5%) |
| 4-Person Households | 261 (14.7%) | 0 (0.0%) |
| 5-Person Households | 36 (2.0%) | 0 (0.0%) |
| 6-Person Households | 27 (1.5%) | 0 (0.0%) |
| 7+ Person Households | 0 (0.0%) | 0 (0.0%) |
| Total | 1,093 (61.6%) | 682 (38.4%) |
Female Fertility in Cannon Falls
Fertility by Age in Cannon Falls
Average fertility rate in Cannon Falls is 56.0 births per 1,000 women. Women in the age bracket of 20 to 34 years have the highest fertility rate with 127.0 births per 1,000 women. Women in the age bracket of 20 to 34 years acount for 100.0% of all women with births.
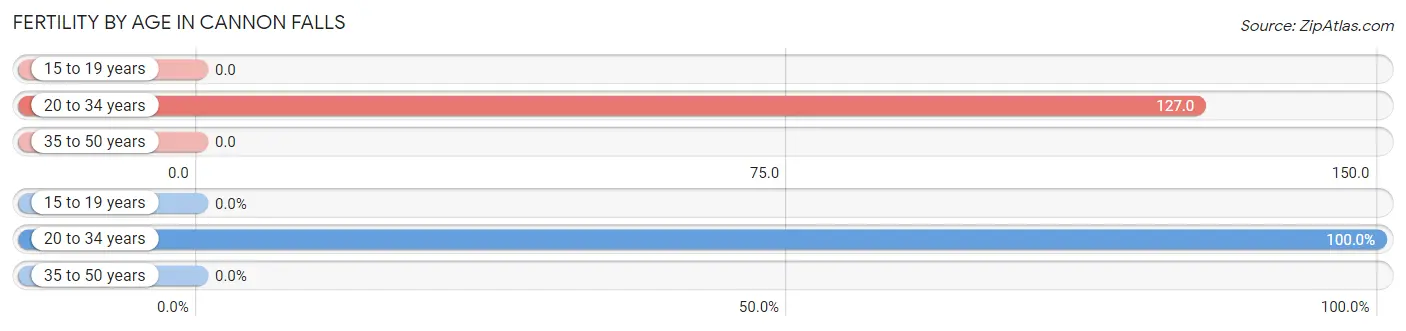
| Age Bracket | Women with Births | Births / 1,000 Women |
| 15 to 19 years | 0 (0.0%) | 0.0 |
| 20 to 34 years | 51 (100.0%) | 127.0 |
| 35 to 50 years | 0 (0.0%) | 0.0 |
| Total | 51 (100.0%) | 56.0 |
Fertility by Age by Marriage Status in Cannon Falls
70.6% of women with births (51) in Cannon Falls are married. The highest percentage of unmarried women with births falls into 20 to 34 years age bracket with 29.4% of them unmarried at the time of birth, while the lowest percentage of unmarried women with births belong to 20 to 34 years age bracket with 29.4% of them unmarried.
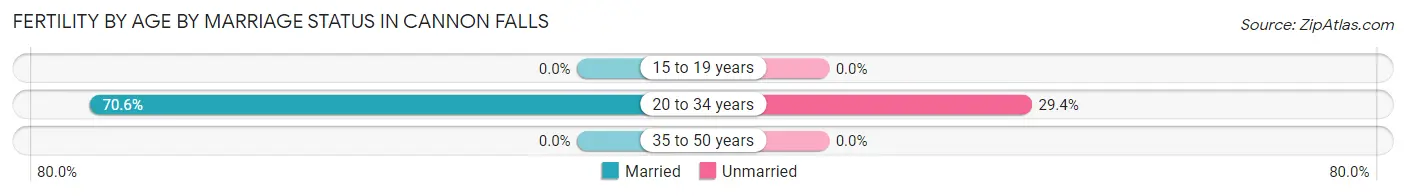
| Age Bracket | Married | Unmarried |
| 15 to 19 years | 0 (0.0%) | 0 (0.0%) |
| 20 to 34 years | 36 (70.6%) | 15 (29.4%) |
| 35 to 50 years | 0 (0.0%) | 0 (0.0%) |
| Total | 36 (70.6%) | 15 (29.4%) |
Fertility by Education in Cannon Falls
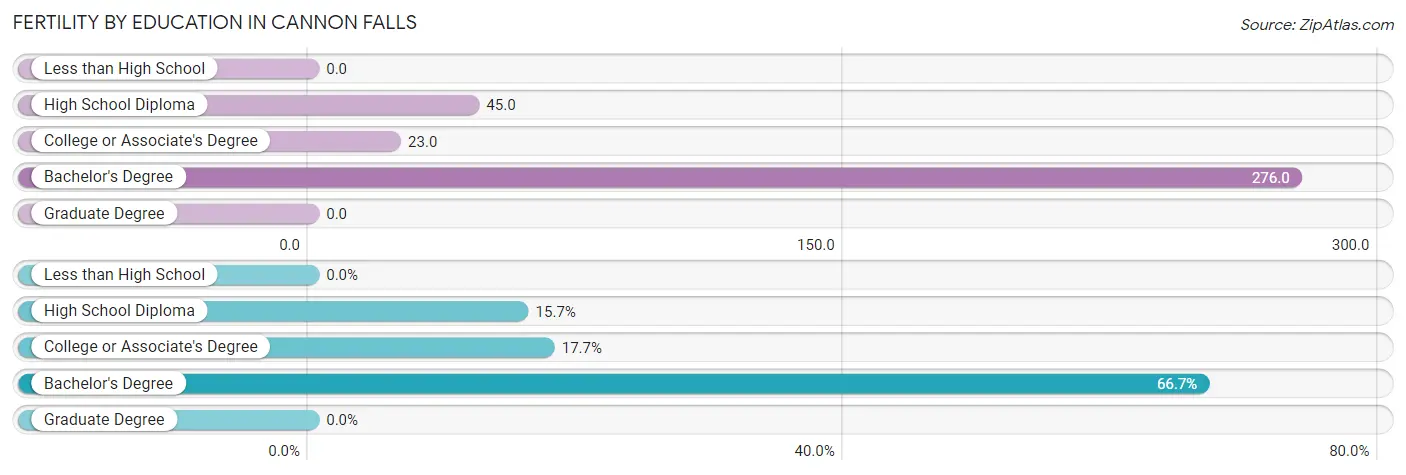
| Educational Attainment | Women with Births | Births / 1,000 Women |
| Less than High School | 0 (0.0%) | 0.0 |
| High School Diploma | 8 (15.7%) | 45.0 |
| College or Associate's Degree | 9 (17.6%) | 23.0 |
| Bachelor's Degree | 34 (66.7%) | 276.0 |
| Graduate Degree | 0 (0.0%) | 0.0 |
| Total | 51 (100.0%) | 56.0 |
Fertility by Education by Marriage Status in Cannon Falls
29.4% of women with births in Cannon Falls are unmarried. Women with the educational attainment of high school diploma are most likely to be married with 100.0% of them married at childbirth, while women with the educational attainment of bachelor's degree are least likely to be married with 44.1% of them unmarried at childbirth.
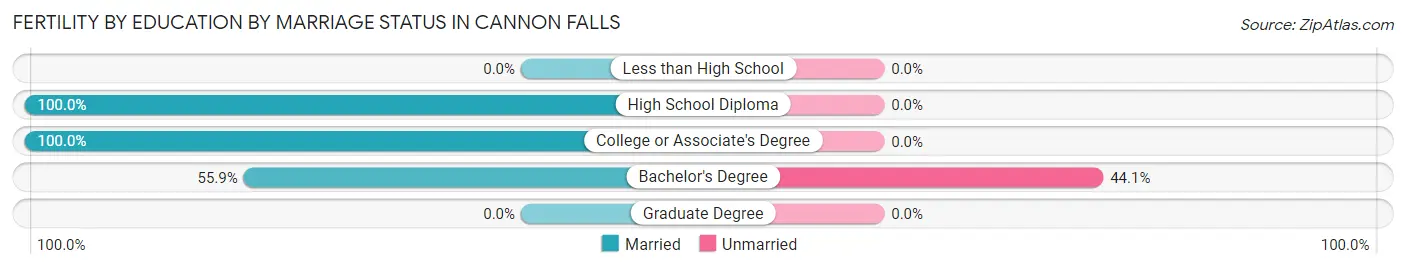
| Educational Attainment | Married | Unmarried |
| Less than High School | 0 (0.0%) | 0 (0.0%) |
| High School Diploma | 8 (100.0%) | 0 (0.0%) |
| College or Associate's Degree | 9 (100.0%) | 0 (0.0%) |
| Bachelor's Degree | 19 (55.9%) | 15 (44.1%) |
| Graduate Degree | 0 (0.0%) | 0 (0.0%) |
| Total | 36 (70.6%) | 15 (29.4%) |
Employment Characteristics in Cannon Falls
Employment by Class of Employer in Cannon Falls
Among the 2,311 employed individuals in Cannon Falls, private company employees (1,594 | 69.0%), not-for-profit organizations (348 | 15.1%), and local government employees (182 | 7.9%) make up the most common classes of employment.
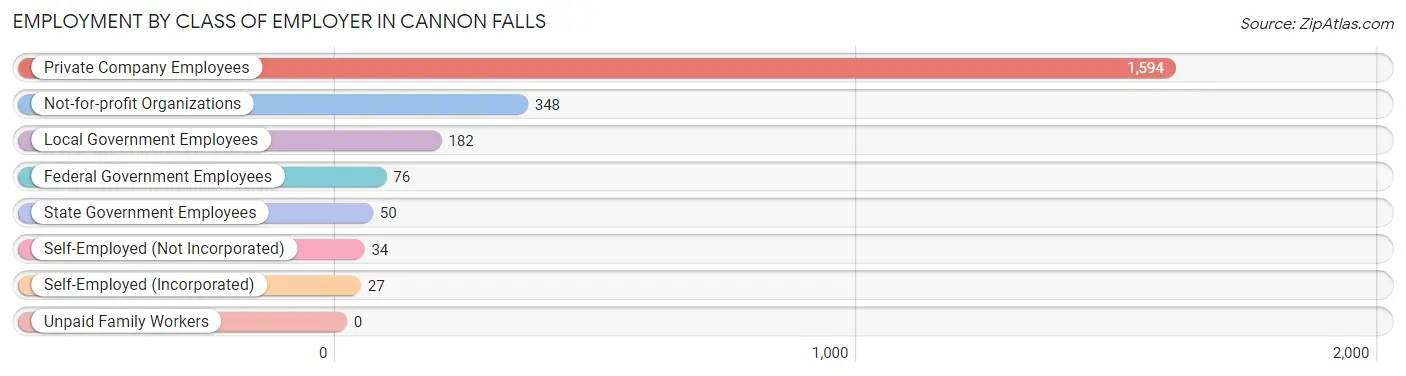
| Employer Class | # Employees | % Employees |
| Private Company Employees | 1,594 | 69.0% |
| Self-Employed (Incorporated) | 27 | 1.2% |
| Self-Employed (Not Incorporated) | 34 | 1.5% |
| Not-for-profit Organizations | 348 | 15.1% |
| Local Government Employees | 182 | 7.9% |
| State Government Employees | 50 | 2.2% |
| Federal Government Employees | 76 | 3.3% |
| Unpaid Family Workers | 0 | 0.0% |
| Total | 2,311 | 100.0% |
Employment Status by Age in Cannon Falls
According to the labor force statistics for Cannon Falls, out of the total population over 16 years of age (3,475), 67.7% or 2,353 individuals are in the labor force, with 1.6% or 38 of them unemployed. The age group with the highest labor force participation rate is 35 to 44 years, with 94.8% or 563 individuals in the labor force. Within the labor force, the 20 to 24 years age range has the highest percentage of unemployed individuals, with 8.3% or 12 of them being unemployed.
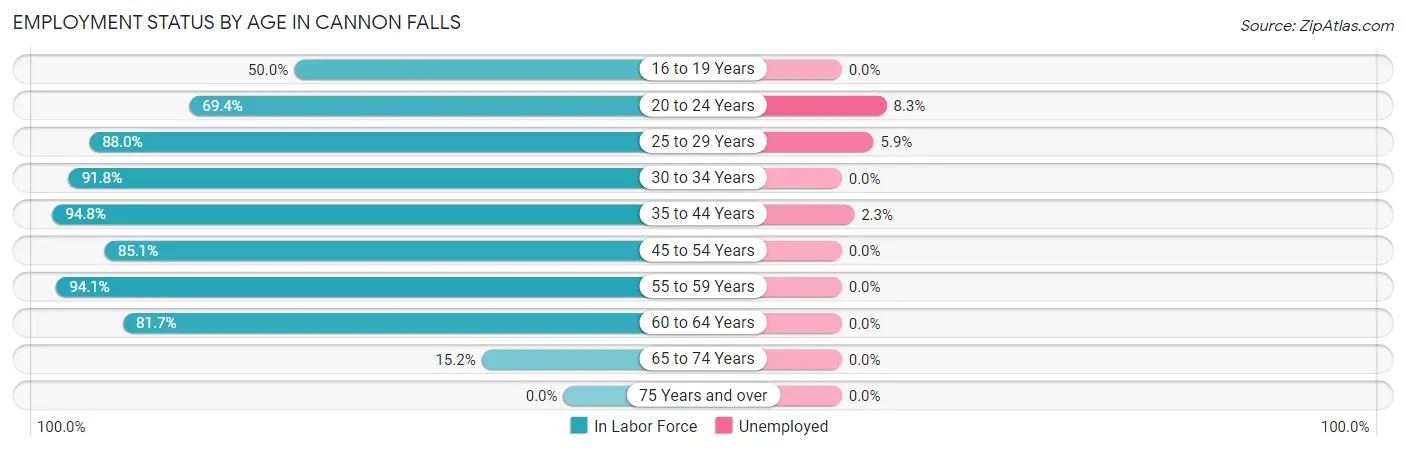
| Age Bracket | In Labor Force | Unemployed |
| 16 to 19 Years | 68 (50.0%) | 0 (0.0%) |
| 20 to 24 Years | 145 (69.4%) | 12 (8.3%) |
| 25 to 29 Years | 221 (88.0%) | 13 (5.9%) |
| 30 to 34 Years | 303 (91.8%) | 0 (0.0%) |
| 35 to 44 Years | 563 (94.8%) | 13 (2.3%) |
| 45 to 54 Years | 359 (85.1%) | 0 (0.0%) |
| 55 to 59 Years | 348 (94.1%) | 0 (0.0%) |
| 60 to 64 Years | 294 (81.7%) | 0 (0.0%) |
| 65 to 74 Years | 53 (15.2%) | 0 (0.0%) |
| 75 Years and over | 0 (0.0%) | 0 (0.0%) |
| Total | 2,353 (67.7%) | 38 (1.6%) |
Employment Status by Educational Attainment in Cannon Falls
According to labor force statistics for Cannon Falls, 89.7% of individuals (2,087) out of the total population between 25 and 64 years of age (2,327) are in the labor force, with 1.2% or 25 of them being unemployed. The group with the highest labor force participation rate are those with the educational attainment of bachelor's degree or higher, with 96.3% or 438 individuals in the labor force. Within the labor force, individuals with high school diploma education have the highest percentage of unemployment, with 1.8% or 13 of them being unemployed.
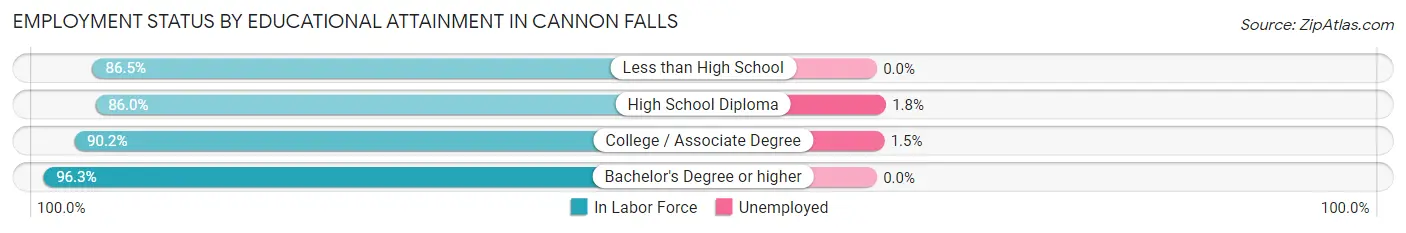
| Educational Attainment | In Labor Force | Unemployed |
| Less than High School | 90 (86.5%) | 0 (0.0%) |
| High School Diploma | 715 (86.0%) | 15 (1.8%) |
| College / Associate Degree | 845 (90.2%) | 14 (1.5%) |
| Bachelor's Degree or higher | 438 (96.3%) | 0 (0.0%) |
| Total | 2,087 (89.7%) | 28 (1.2%) |
Employment Occupations by Sex in Cannon Falls
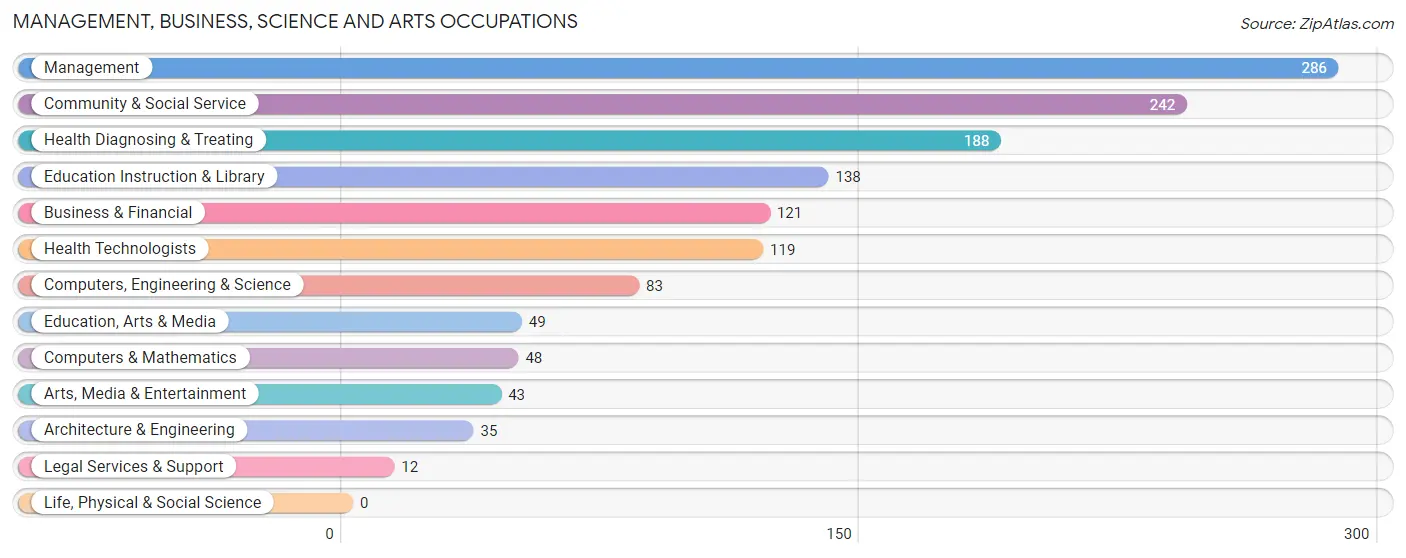
Management, Business, Science and Arts Occupations
The most common Management, Business, Science and Arts occupations in Cannon Falls are Management (286 | 12.3%), Community & Social Service (242 | 10.4%), Health Diagnosing & Treating (188 | 8.1%), Education Instruction & Library (138 | 6.0%), and Business & Financial (121 | 5.2%).
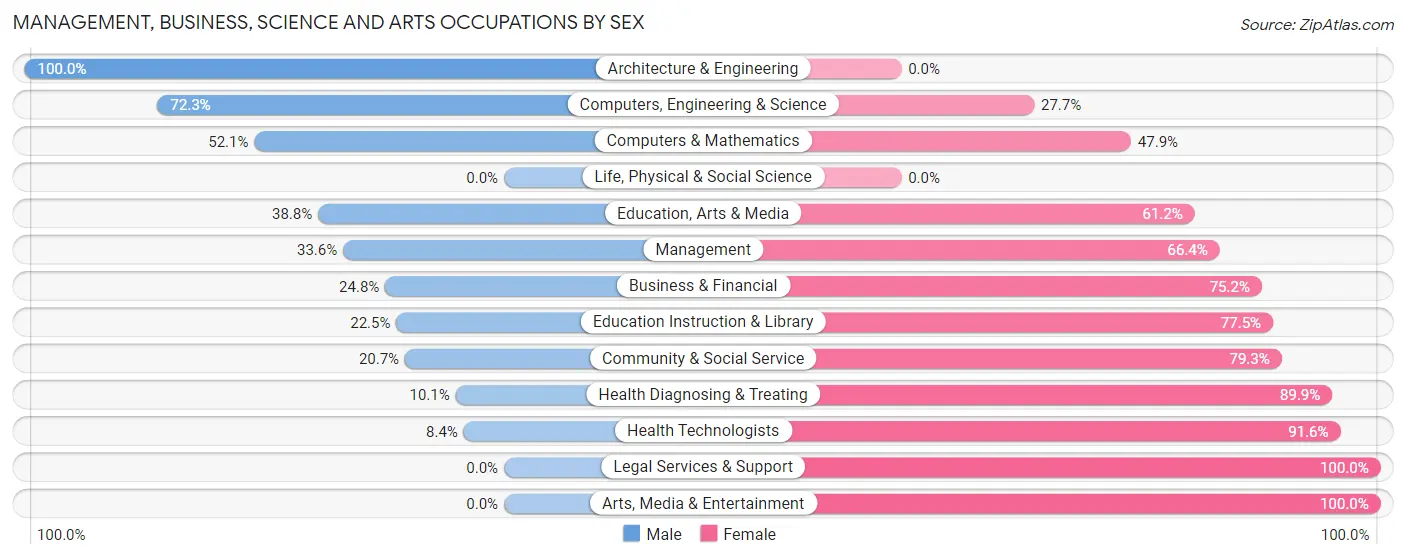
Management, Business, Science and Arts Occupations by Sex
Within the Management, Business, Science and Arts occupations in Cannon Falls, the most male-oriented occupations are Architecture & Engineering (100.0%), Computers, Engineering & Science (72.3%), and Computers & Mathematics (52.1%), while the most female-oriented occupations are Legal Services & Support (100.0%), Arts, Media & Entertainment (100.0%), and Health Technologists (91.6%).
| Occupation | Male | Female |
| Management | 96 (33.6%) | 190 (66.4%) |
| Business & Financial | 30 (24.8%) | 91 (75.2%) |
| Computers, Engineering & Science | 60 (72.3%) | 23 (27.7%) |
| Computers & Mathematics | 25 (52.1%) | 23 (47.9%) |
| Architecture & Engineering | 35 (100.0%) | 0 (0.0%) |
| Life, Physical & Social Science | 0 (0.0%) | 0 (0.0%) |
| Community & Social Service | 50 (20.7%) | 192 (79.3%) |
| Education, Arts & Media | 19 (38.8%) | 30 (61.2%) |
| Legal Services & Support | 0 (0.0%) | 12 (100.0%) |
| Education Instruction & Library | 31 (22.5%) | 107 (77.5%) |
| Arts, Media & Entertainment | 0 (0.0%) | 43 (100.0%) |
| Health Diagnosing & Treating | 19 (10.1%) | 169 (89.9%) |
| Health Technologists | 10 (8.4%) | 109 (91.6%) |
| Total (Category) | 255 (27.7%) | 665 (72.3%) |
| Total (Overall) | 1,136 (49.0%) | 1,180 (50.9%) |
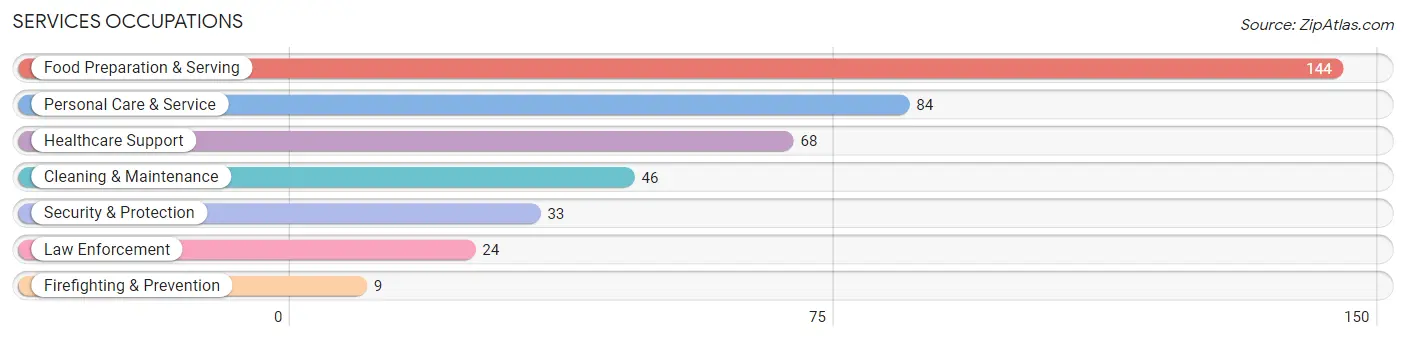
Services Occupations
The most common Services occupations in Cannon Falls are Food Preparation & Serving (144 | 6.2%), Personal Care & Service (84 | 3.6%), Healthcare Support (68 | 2.9%), Cleaning & Maintenance (46 | 2.0%), and Security & Protection (33 | 1.4%).
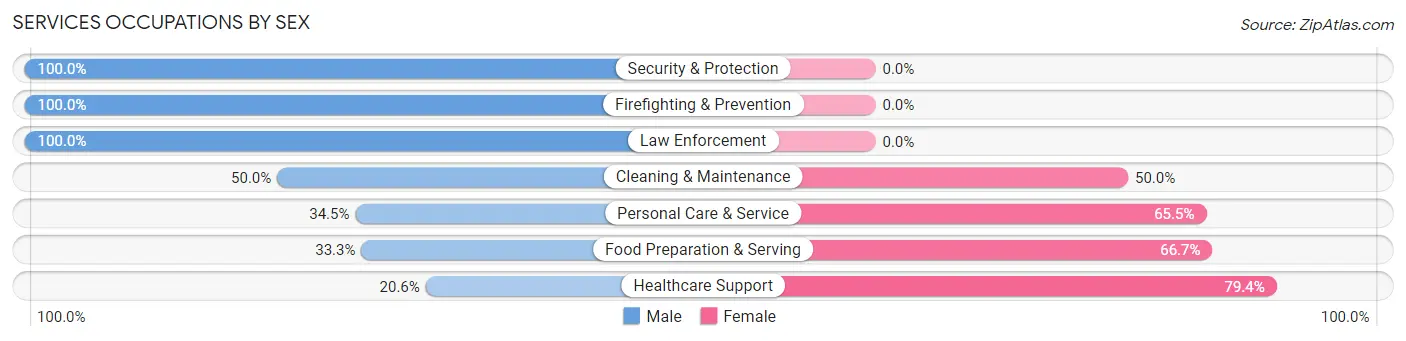
Services Occupations by Sex
Within the Services occupations in Cannon Falls, the most male-oriented occupations are Security & Protection (100.0%), Firefighting & Prevention (100.0%), and Law Enforcement (100.0%), while the most female-oriented occupations are Healthcare Support (79.4%), Food Preparation & Serving (66.7%), and Personal Care & Service (65.5%).
| Occupation | Male | Female |
| Healthcare Support | 14 (20.6%) | 54 (79.4%) |
| Security & Protection | 33 (100.0%) | 0 (0.0%) |
| Firefighting & Prevention | 9 (100.0%) | 0 (0.0%) |
| Law Enforcement | 24 (100.0%) | 0 (0.0%) |
| Food Preparation & Serving | 48 (33.3%) | 96 (66.7%) |
| Cleaning & Maintenance | 23 (50.0%) | 23 (50.0%) |
| Personal Care & Service | 29 (34.5%) | 55 (65.5%) |
| Total (Category) | 147 (39.2%) | 228 (60.8%) |
| Total (Overall) | 1,136 (49.0%) | 1,180 (50.9%) |
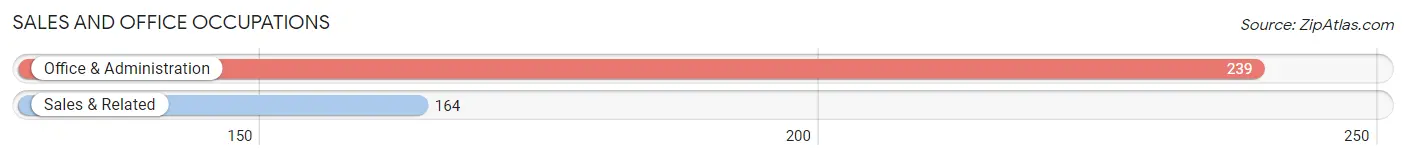
Sales and Office Occupations
The most common Sales and Office occupations in Cannon Falls are Office & Administration (239 | 10.3%), and Sales & Related (164 | 7.1%).
Sales and Office Occupations by Sex
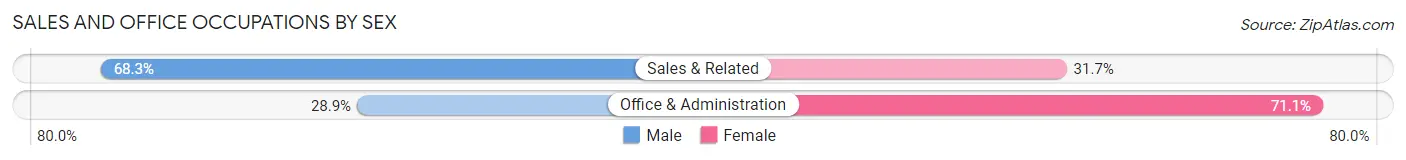
| Occupation | Male | Female |
| Sales & Related | 112 (68.3%) | 52 (31.7%) |
| Office & Administration | 69 (28.9%) | 170 (71.1%) |
| Total (Category) | 181 (44.9%) | 222 (55.1%) |
| Total (Overall) | 1,136 (49.0%) | 1,180 (50.9%) |
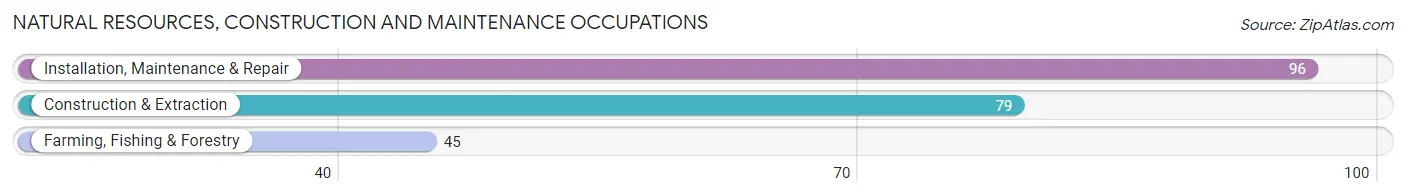
Natural Resources, Construction and Maintenance Occupations
The most common Natural Resources, Construction and Maintenance occupations in Cannon Falls are Installation, Maintenance & Repair (96 | 4.2%), Construction & Extraction (79 | 3.4%), and Farming, Fishing & Forestry (45 | 1.9%).
Natural Resources, Construction and Maintenance Occupations by Sex
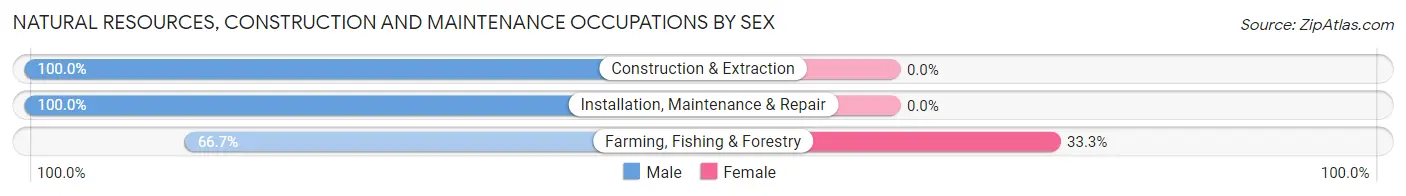
| Occupation | Male | Female |
| Farming, Fishing & Forestry | 30 (66.7%) | 15 (33.3%) |
| Construction & Extraction | 79 (100.0%) | 0 (0.0%) |
| Installation, Maintenance & Repair | 96 (100.0%) | 0 (0.0%) |
| Total (Category) | 205 (93.2%) | 15 (6.8%) |
| Total (Overall) | 1,136 (49.0%) | 1,180 (50.9%) |
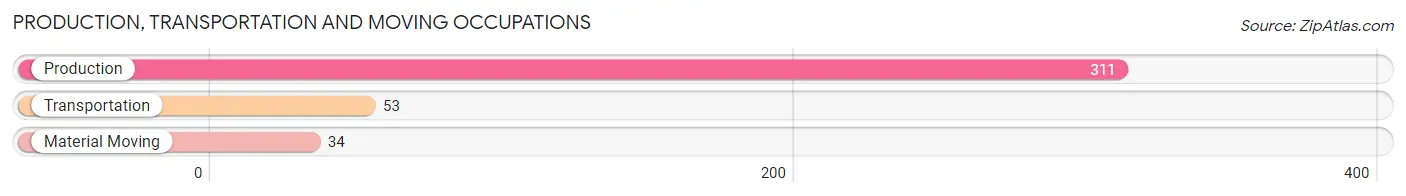
Production, Transportation and Moving Occupations
The most common Production, Transportation and Moving occupations in Cannon Falls are Production (311 | 13.4%), Transportation (53 | 2.3%), and Material Moving (34 | 1.5%).
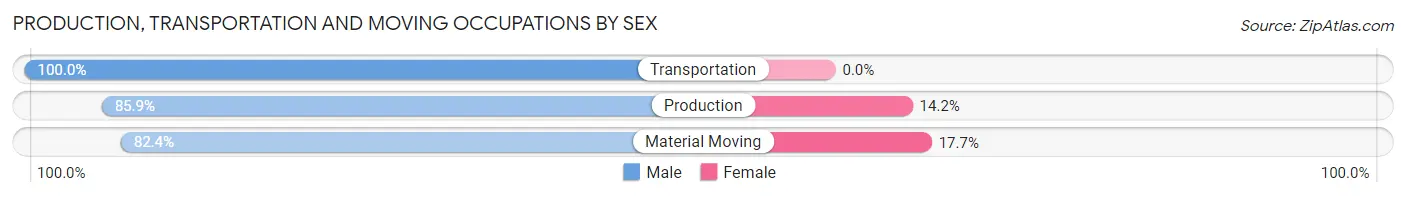
Production, Transportation and Moving Occupations by Sex
| Occupation | Male | Female |
| Production | 267 (85.9%) | 44 (14.1%) |
| Transportation | 53 (100.0%) | 0 (0.0%) |
| Material Moving | 28 (82.4%) | 6 (17.6%) |
| Total (Category) | 348 (87.4%) | 50 (12.6%) |
| Total (Overall) | 1,136 (49.0%) | 1,180 (50.9%) |
Employment Industries by Sex in Cannon Falls
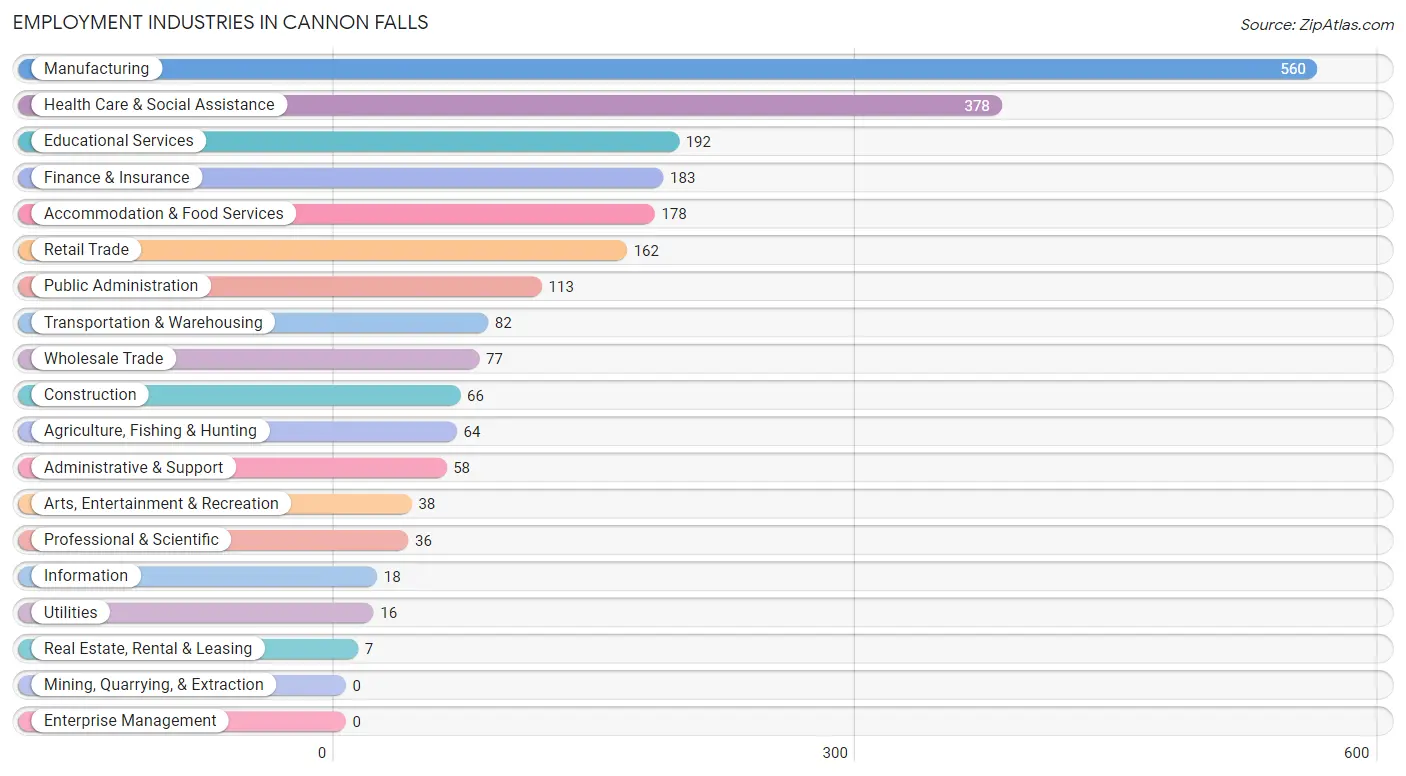
Employment Industries in Cannon Falls
The major employment industries in Cannon Falls include Manufacturing (560 | 24.2%), Health Care & Social Assistance (378 | 16.3%), Educational Services (192 | 8.3%), Finance & Insurance (183 | 7.9%), and Accommodation & Food Services (178 | 7.7%).
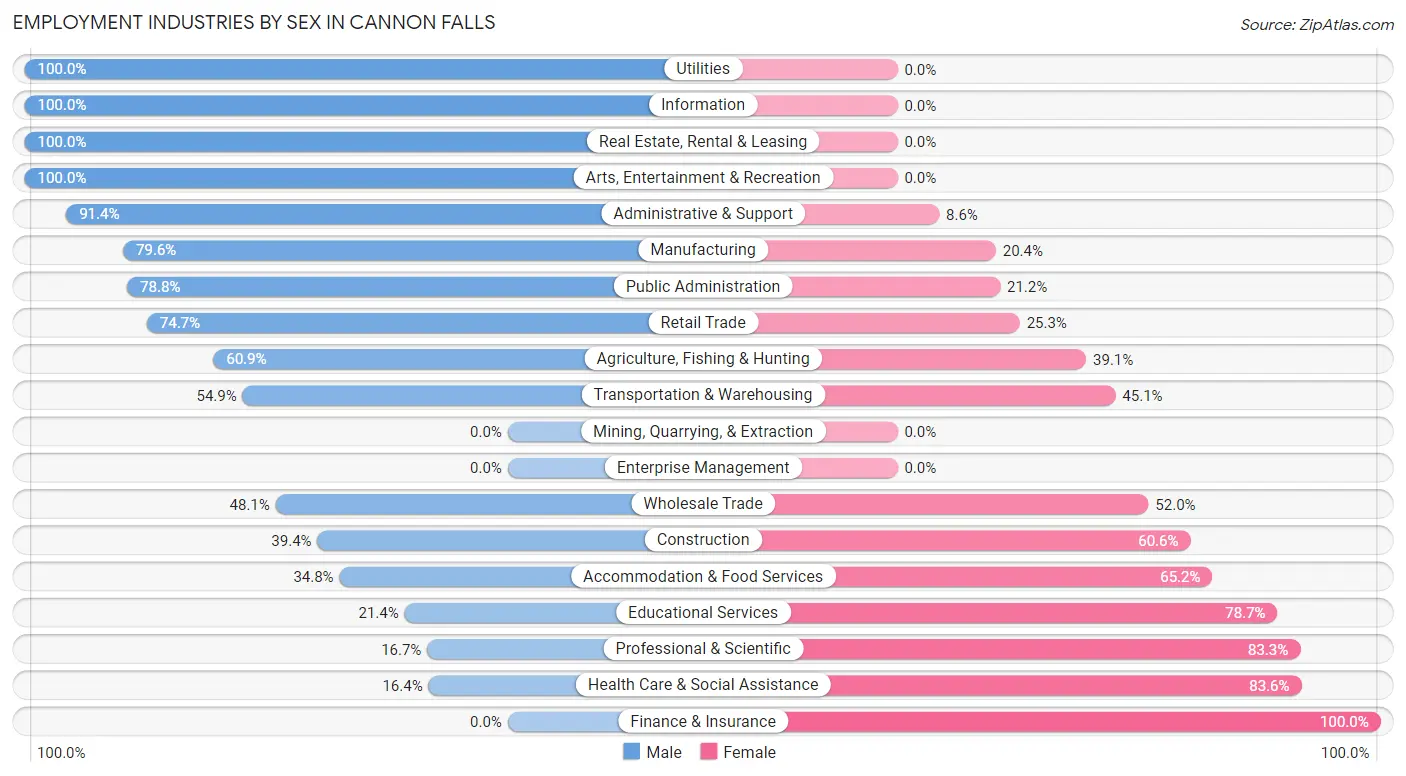
Employment Industries by Sex in Cannon Falls
The Cannon Falls industries that see more men than women are Utilities (100.0%), Information (100.0%), and Real Estate, Rental & Leasing (100.0%), whereas the industries that tend to have a higher number of women are Finance & Insurance (100.0%), Health Care & Social Assistance (83.6%), and Professional & Scientific (83.3%).
| Industry | Male | Female |
| Agriculture, Fishing & Hunting | 39 (60.9%) | 25 (39.1%) |
| Mining, Quarrying, & Extraction | 0 (0.0%) | 0 (0.0%) |
| Construction | 26 (39.4%) | 40 (60.6%) |
| Manufacturing | 446 (79.6%) | 114 (20.4%) |
| Wholesale Trade | 37 (48.0%) | 40 (51.9%) |
| Retail Trade | 121 (74.7%) | 41 (25.3%) |
| Transportation & Warehousing | 45 (54.9%) | 37 (45.1%) |
| Utilities | 16 (100.0%) | 0 (0.0%) |
| Information | 18 (100.0%) | 0 (0.0%) |
| Finance & Insurance | 0 (0.0%) | 183 (100.0%) |
| Real Estate, Rental & Leasing | 7 (100.0%) | 0 (0.0%) |
| Professional & Scientific | 6 (16.7%) | 30 (83.3%) |
| Enterprise Management | 0 (0.0%) | 0 (0.0%) |
| Administrative & Support | 53 (91.4%) | 5 (8.6%) |
| Educational Services | 41 (21.3%) | 151 (78.6%) |
| Health Care & Social Assistance | 62 (16.4%) | 316 (83.6%) |
| Arts, Entertainment & Recreation | 38 (100.0%) | 0 (0.0%) |
| Accommodation & Food Services | 62 (34.8%) | 116 (65.2%) |
| Public Administration | 89 (78.8%) | 24 (21.2%) |
| Total | 1,136 (49.0%) | 1,180 (50.9%) |
Education in Cannon Falls
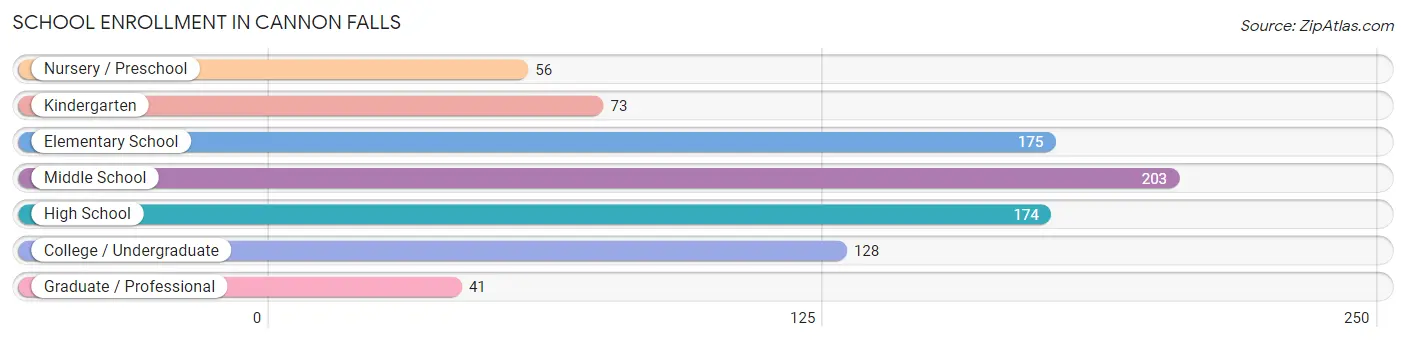
School Enrollment in Cannon Falls
The most common levels of schooling among the 850 students in Cannon Falls are middle school (203 | 23.9%), elementary school (175 | 20.6%), and high school (174 | 20.5%).
| School Level | # Students | % Students |
| Nursery / Preschool | 56 | 6.6% |
| Kindergarten | 73 | 8.6% |
| Elementary School | 175 | 20.6% |
| Middle School | 203 | 23.9% |
| High School | 174 | 20.5% |
| College / Undergraduate | 128 | 15.1% |
| Graduate / Professional | 41 | 4.8% |
| Total | 850 | 100.0% |
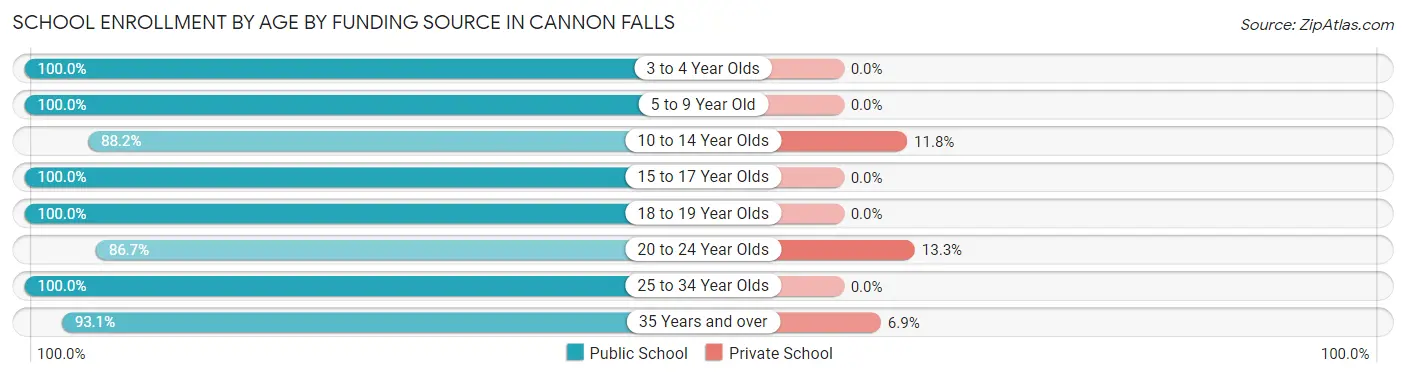
School Enrollment by Age by Funding Source in Cannon Falls
Out of a total of 850 students who are enrolled in schools in Cannon Falls, 42 (4.9%) attend a private institution, while the remaining 808 (95.1%) are enrolled in public schools. The age group of 20 to 24 year olds has the highest likelihood of being enrolled in private schools, with 13 (13.3% in the age bracket) enrolled. Conversely, the age group of 3 to 4 year olds has the lowest likelihood of being enrolled in a private school, with 31 (100.0% in the age bracket) attending a public institution.
| Age Bracket | Public School | Private School |
| 3 to 4 Year Olds | 31 (100.0%) | 0 (0.0%) |
| 5 to 9 Year Old | 273 (100.0%) | 0 (0.0%) |
| 10 to 14 Year Olds | 179 (88.2%) | 24 (11.8%) |
| 15 to 17 Year Olds | 113 (100.0%) | 0 (0.0%) |
| 18 to 19 Year Olds | 51 (100.0%) | 0 (0.0%) |
| 20 to 24 Year Olds | 85 (86.7%) | 13 (13.3%) |
| 25 to 34 Year Olds | 9 (100.0%) | 0 (0.0%) |
| 35 Years and over | 67 (93.1%) | 5 (6.9%) |
| Total | 808 (95.1%) | 42 (4.9%) |
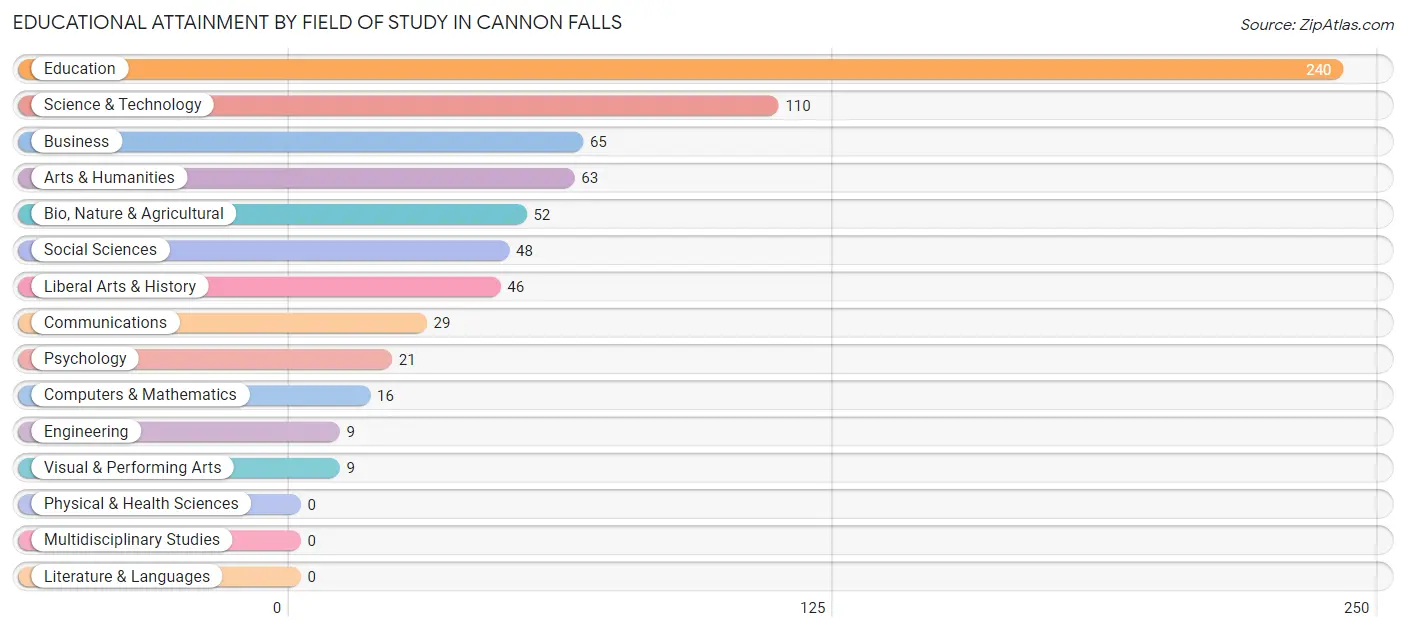
Educational Attainment by Field of Study in Cannon Falls
Education (240 | 33.9%), science & technology (110 | 15.5%), business (65 | 9.2%), arts & humanities (63 | 8.9%), and bio, nature & agricultural (52 | 7.3%) are the most common fields of study among 708 individuals in Cannon Falls who have obtained a bachelor's degree or higher.
| Field of Study | # Graduates | % Graduates |
| Computers & Mathematics | 16 | 2.3% |
| Bio, Nature & Agricultural | 52 | 7.3% |
| Physical & Health Sciences | 0 | 0.0% |
| Psychology | 21 | 3.0% |
| Social Sciences | 48 | 6.8% |
| Engineering | 9 | 1.3% |
| Multidisciplinary Studies | 0 | 0.0% |
| Science & Technology | 110 | 15.5% |
| Business | 65 | 9.2% |
| Education | 240 | 33.9% |
| Literature & Languages | 0 | 0.0% |
| Liberal Arts & History | 46 | 6.5% |
| Visual & Performing Arts | 9 | 1.3% |
| Communications | 29 | 4.1% |
| Arts & Humanities | 63 | 8.9% |
| Total | 708 | 100.0% |
Transportation & Commute in Cannon Falls
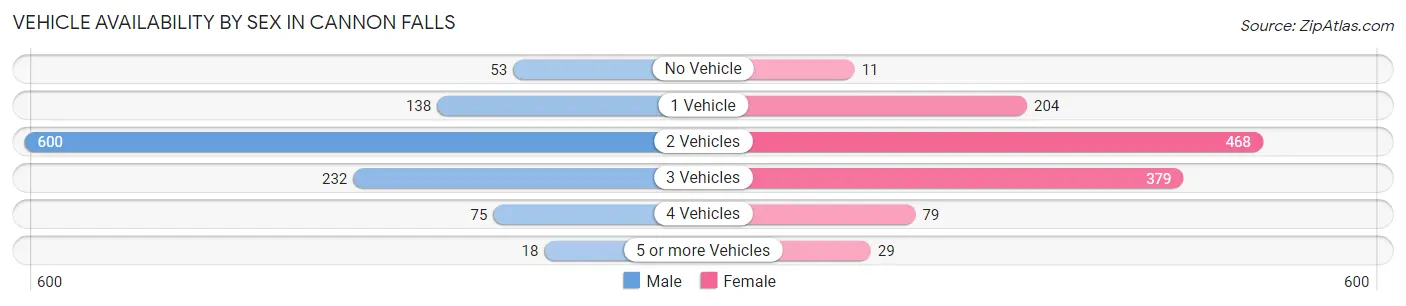
Vehicle Availability by Sex in Cannon Falls
The most prevalent vehicle ownership categories in Cannon Falls are males with 2 vehicles (600, accounting for 53.8%) and females with 2 vehicles (468, making up 51.3%).
| Vehicles Available | Male | Female |
| No Vehicle | 53 (4.8%) | 11 (0.9%) |
| 1 Vehicle | 138 (12.4%) | 204 (17.4%) |
| 2 Vehicles | 600 (53.8%) | 468 (40.0%) |
| 3 Vehicles | 232 (20.8%) | 379 (32.4%) |
| 4 Vehicles | 75 (6.7%) | 79 (6.8%) |
| 5 or more Vehicles | 18 (1.6%) | 29 (2.5%) |
| Total | 1,116 (100.0%) | 1,170 (100.0%) |
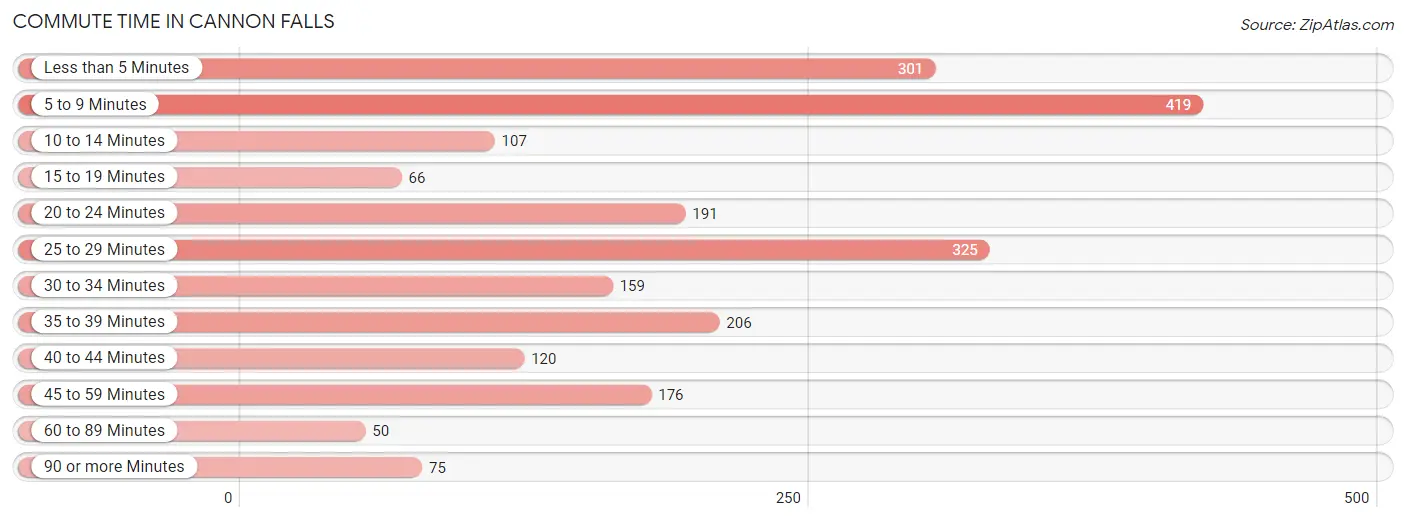
Commute Time in Cannon Falls
The most frequently occuring commute durations in Cannon Falls are 5 to 9 minutes (419 commuters, 19.1%), 25 to 29 minutes (325 commuters, 14.8%), and less than 5 minutes (301 commuters, 13.7%).
| Commute Time | # Commuters | % Commuters |
| Less than 5 Minutes | 301 | 13.7% |
| 5 to 9 Minutes | 419 | 19.1% |
| 10 to 14 Minutes | 107 | 4.9% |
| 15 to 19 Minutes | 66 | 3.0% |
| 20 to 24 Minutes | 191 | 8.7% |
| 25 to 29 Minutes | 325 | 14.8% |
| 30 to 34 Minutes | 159 | 7.2% |
| 35 to 39 Minutes | 206 | 9.4% |
| 40 to 44 Minutes | 120 | 5.5% |
| 45 to 59 Minutes | 176 | 8.0% |
| 60 to 89 Minutes | 50 | 2.3% |
| 90 or more Minutes | 75 | 3.4% |
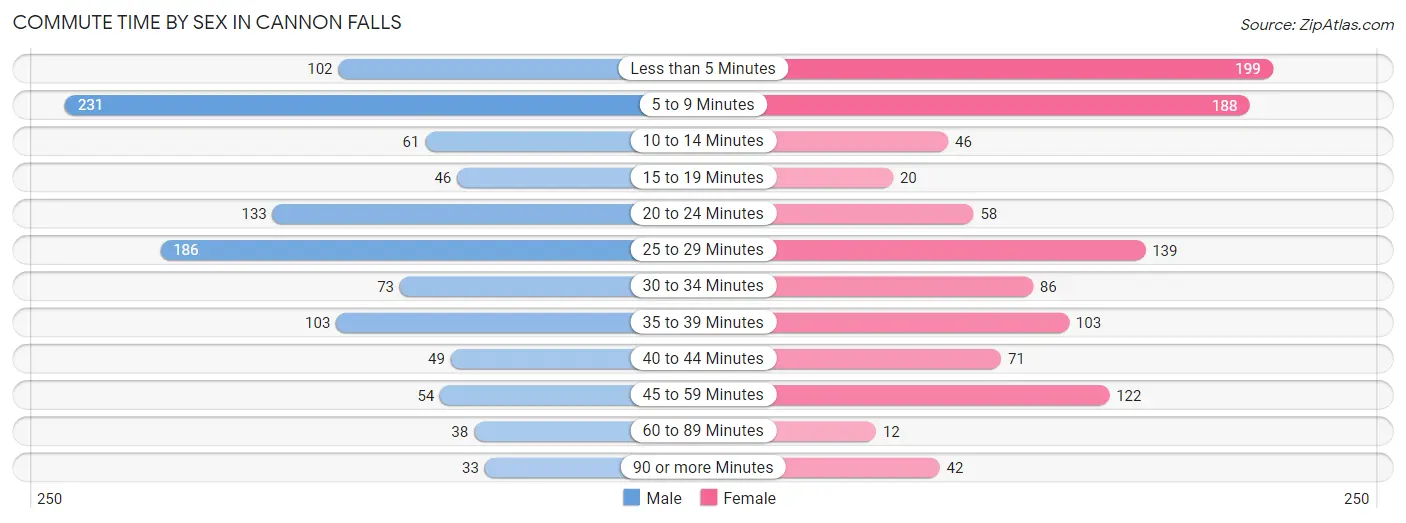
Commute Time by Sex in Cannon Falls
The most common commute times in Cannon Falls are 5 to 9 minutes (231 commuters, 20.8%) for males and less than 5 minutes (199 commuters, 18.3%) for females.
| Commute Time | Male | Female |
| Less than 5 Minutes | 102 (9.2%) | 199 (18.3%) |
| 5 to 9 Minutes | 231 (20.8%) | 188 (17.3%) |
| 10 to 14 Minutes | 61 (5.5%) | 46 (4.2%) |
| 15 to 19 Minutes | 46 (4.2%) | 20 (1.8%) |
| 20 to 24 Minutes | 133 (12.0%) | 58 (5.3%) |
| 25 to 29 Minutes | 186 (16.8%) | 139 (12.8%) |
| 30 to 34 Minutes | 73 (6.6%) | 86 (7.9%) |
| 35 to 39 Minutes | 103 (9.3%) | 103 (9.5%) |
| 40 to 44 Minutes | 49 (4.4%) | 71 (6.5%) |
| 45 to 59 Minutes | 54 (4.9%) | 122 (11.2%) |
| 60 to 89 Minutes | 38 (3.4%) | 12 (1.1%) |
| 90 or more Minutes | 33 (3.0%) | 42 (3.9%) |
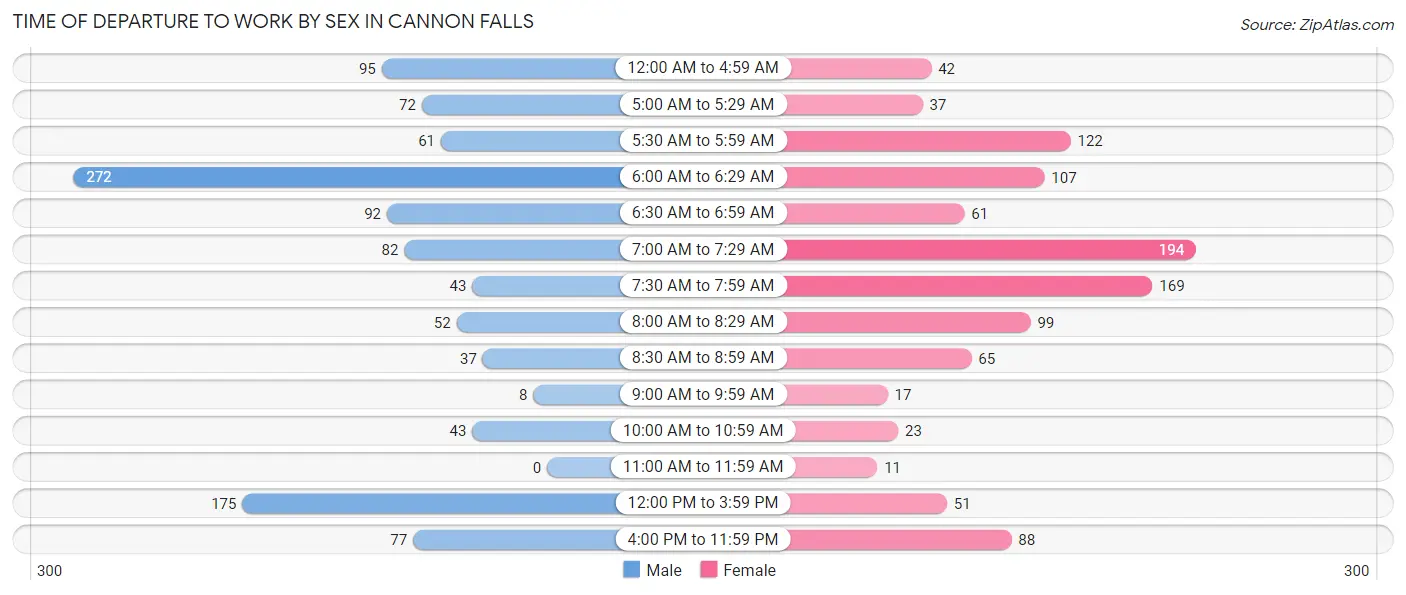
Time of Departure to Work by Sex in Cannon Falls
The most frequent times of departure to work in Cannon Falls are 6:00 AM to 6:29 AM (272, 24.5%) for males and 7:00 AM to 7:29 AM (194, 17.9%) for females.
| Time of Departure | Male | Female |
| 12:00 AM to 4:59 AM | 95 (8.6%) | 42 (3.9%) |
| 5:00 AM to 5:29 AM | 72 (6.5%) | 37 (3.4%) |
| 5:30 AM to 5:59 AM | 61 (5.5%) | 122 (11.2%) |
| 6:00 AM to 6:29 AM | 272 (24.5%) | 107 (9.9%) |
| 6:30 AM to 6:59 AM | 92 (8.3%) | 61 (5.6%) |
| 7:00 AM to 7:29 AM | 82 (7.4%) | 194 (17.9%) |
| 7:30 AM to 7:59 AM | 43 (3.9%) | 169 (15.6%) |
| 8:00 AM to 8:29 AM | 52 (4.7%) | 99 (9.1%) |
| 8:30 AM to 8:59 AM | 37 (3.3%) | 65 (6.0%) |
| 9:00 AM to 9:59 AM | 8 (0.7%) | 17 (1.6%) |
| 10:00 AM to 10:59 AM | 43 (3.9%) | 23 (2.1%) |
| 11:00 AM to 11:59 AM | 0 (0.0%) | 11 (1.0%) |
| 12:00 PM to 3:59 PM | 175 (15.8%) | 51 (4.7%) |
| 4:00 PM to 11:59 PM | 77 (6.9%) | 88 (8.1%) |
| Total | 1,109 (100.0%) | 1,086 (100.0%) |
Housing Occupancy in Cannon Falls
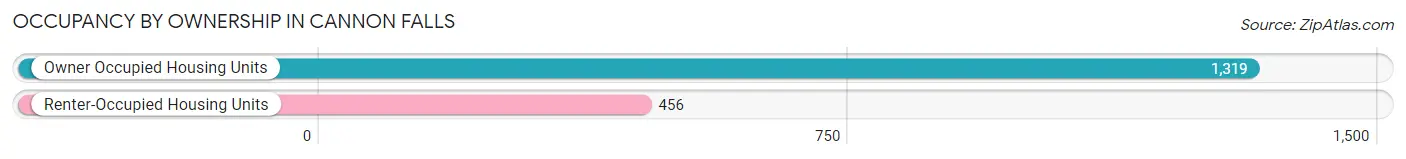
Occupancy by Ownership in Cannon Falls
Of the total 1,775 dwellings in Cannon Falls, owner-occupied units account for 1,319 (74.3%), while renter-occupied units make up 456 (25.7%).
| Occupancy | # Housing Units | % Housing Units |
| Owner Occupied Housing Units | 1,319 | 74.3% |
| Renter-Occupied Housing Units | 456 | 25.7% |
| Total Occupied Housing Units | 1,775 | 100.0% |
Occupancy by Household Size in Cannon Falls
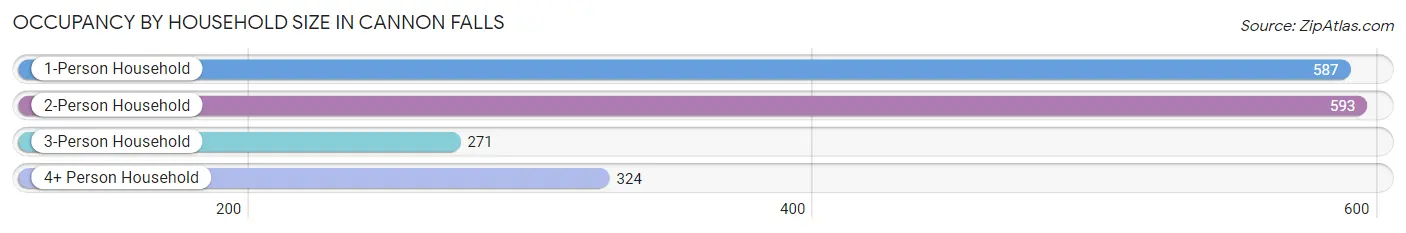
| Household Size | # Housing Units | % Housing Units |
| 1-Person Household | 587 | 33.1% |
| 2-Person Household | 593 | 33.4% |
| 3-Person Household | 271 | 15.3% |
| 4+ Person Household | 324 | 18.2% |
| Total Housing Units | 1,775 | 100.0% |
Occupancy by Ownership by Household Size in Cannon Falls
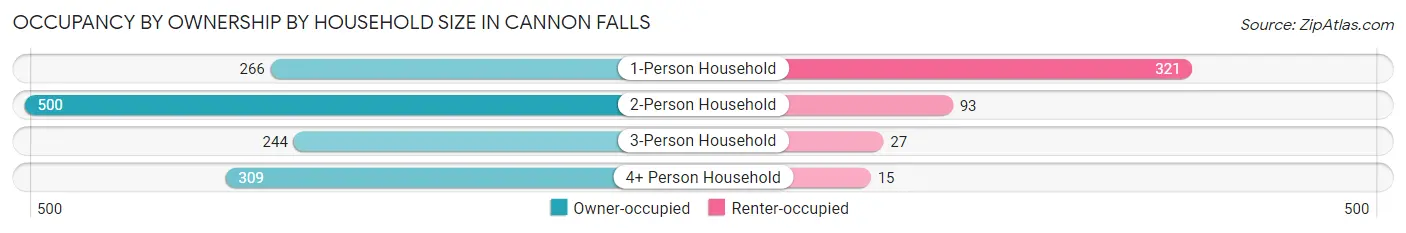
| Household Size | Owner-occupied | Renter-occupied |
| 1-Person Household | 266 (45.3%) | 321 (54.7%) |
| 2-Person Household | 500 (84.3%) | 93 (15.7%) |
| 3-Person Household | 244 (90.0%) | 27 (10.0%) |
| 4+ Person Household | 309 (95.4%) | 15 (4.6%) |
| Total Housing Units | 1,319 (74.3%) | 456 (25.7%) |
Occupancy by Educational Attainment in Cannon Falls
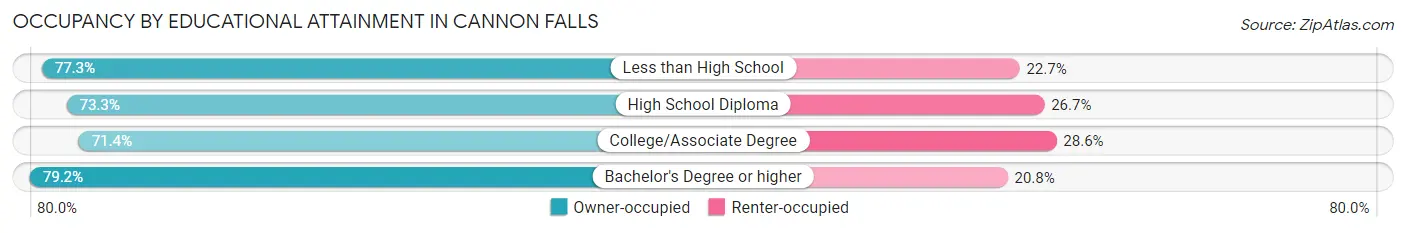
| Household Size | Owner-occupied | Renter-occupied |
| Less than High School | 85 (77.3%) | 25 (22.7%) |
| High School Diploma | 454 (73.3%) | 165 (26.7%) |
| College/Associate Degree | 442 (71.4%) | 177 (28.6%) |
| Bachelor's Degree or higher | 338 (79.2%) | 89 (20.8%) |
Occupancy by Age of Householder in Cannon Falls
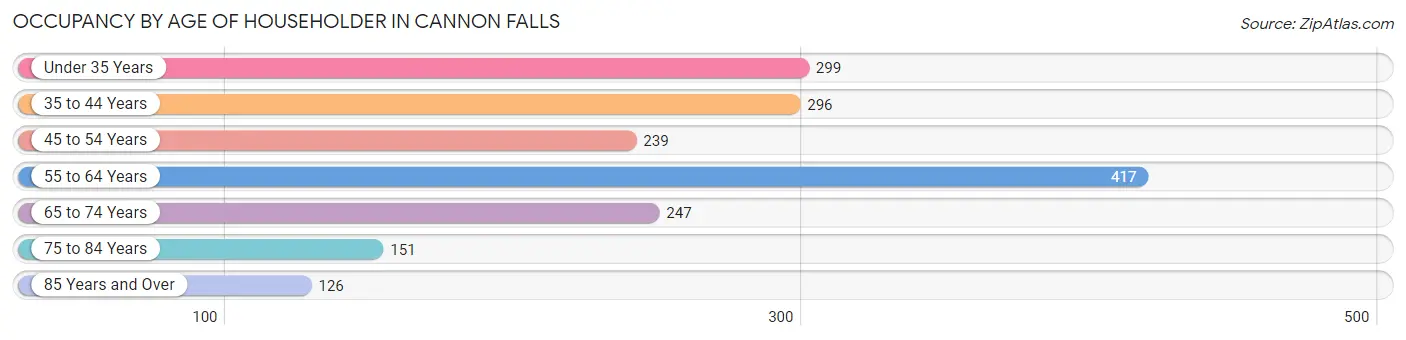
| Age Bracket | # Households | % Households |
| Under 35 Years | 299 | 16.9% |
| 35 to 44 Years | 296 | 16.7% |
| 45 to 54 Years | 239 | 13.5% |
| 55 to 64 Years | 417 | 23.5% |
| 65 to 74 Years | 247 | 13.9% |
| 75 to 84 Years | 151 | 8.5% |
| 85 Years and Over | 126 | 7.1% |
| Total | 1,775 | 100.0% |
Housing Finances in Cannon Falls
Median Income by Occupancy in Cannon Falls
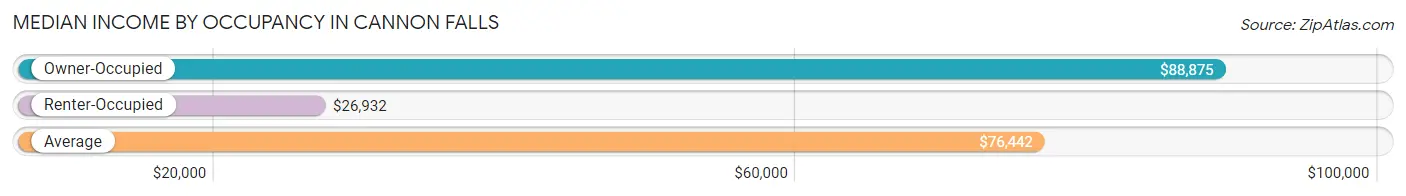
| Occupancy Type | # Households | Median Income |
| Owner-Occupied | 1,319 (74.3%) | $88,875 |
| Renter-Occupied | 456 (25.7%) | $26,932 |
| Average | 1,775 (100.0%) | $76,442 |
Occupancy by Householder Income Bracket in Cannon Falls
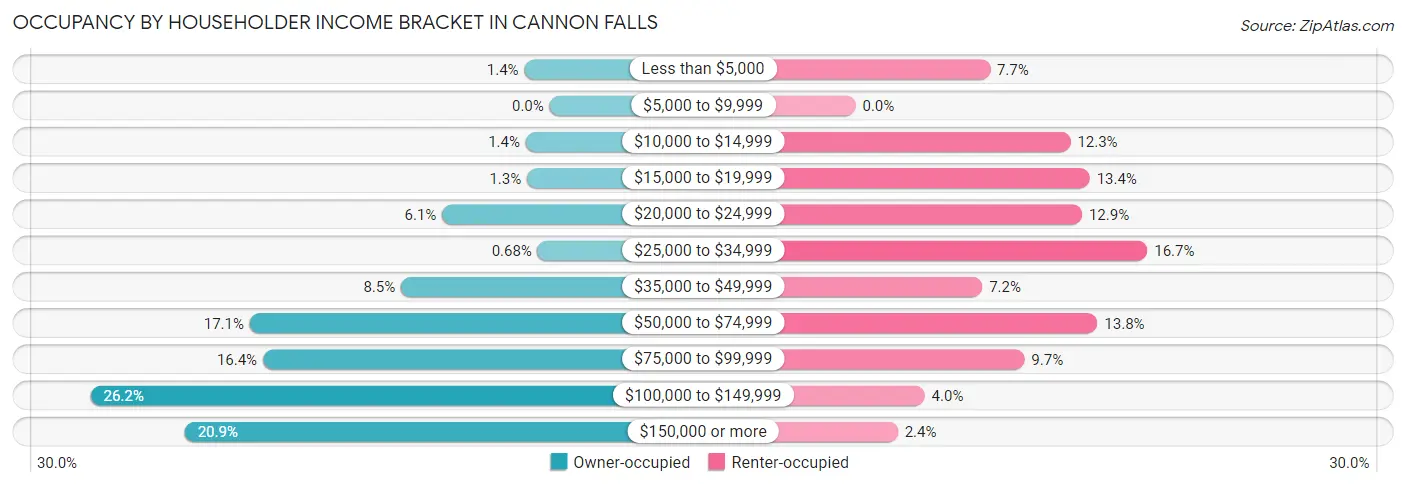
| Income Bracket | Owner-occupied | Renter-occupied |
| Less than $5,000 | 19 (1.4%) | 35 (7.7%) |
| $5,000 to $9,999 | 0 (0.0%) | 0 (0.0%) |
| $10,000 to $14,999 | 18 (1.4%) | 56 (12.3%) |
| $15,000 to $19,999 | 17 (1.3%) | 61 (13.4%) |
| $20,000 to $24,999 | 81 (6.1%) | 59 (12.9%) |
| $25,000 to $34,999 | 9 (0.7%) | 76 (16.7%) |
| $35,000 to $49,999 | 112 (8.5%) | 33 (7.2%) |
| $50,000 to $74,999 | 226 (17.1%) | 63 (13.8%) |
| $75,000 to $99,999 | 216 (16.4%) | 44 (9.7%) |
| $100,000 to $149,999 | 346 (26.2%) | 18 (4.0%) |
| $150,000 or more | 275 (20.8%) | 11 (2.4%) |
| Total | 1,319 (100.0%) | 456 (100.0%) |
Monthly Housing Cost Tiers in Cannon Falls
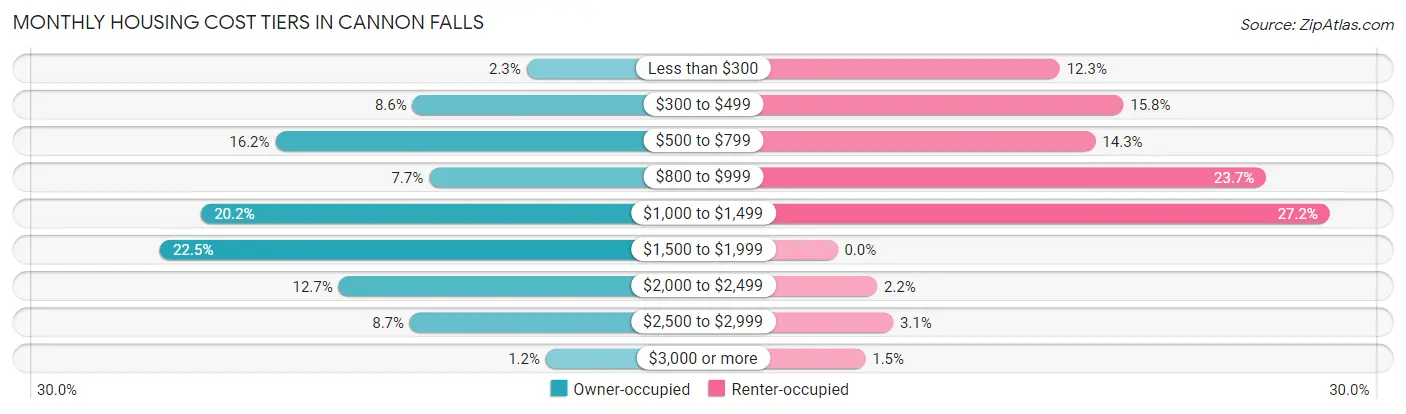
| Monthly Cost | Owner-occupied | Renter-occupied |
| Less than $300 | 30 (2.3%) | 56 (12.3%) |
| $300 to $499 | 113 (8.6%) | 72 (15.8%) |
| $500 to $799 | 213 (16.2%) | 65 (14.2%) |
| $800 to $999 | 101 (7.7%) | 108 (23.7%) |
| $1,000 to $1,499 | 267 (20.2%) | 124 (27.2%) |
| $1,500 to $1,999 | 297 (22.5%) | 0 (0.0%) |
| $2,000 to $2,499 | 167 (12.7%) | 10 (2.2%) |
| $2,500 to $2,999 | 115 (8.7%) | 14 (3.1%) |
| $3,000 or more | 16 (1.2%) | 7 (1.5%) |
| Total | 1,319 (100.0%) | 456 (100.0%) |
Physical Housing Characteristics in Cannon Falls
Housing Structures in Cannon Falls
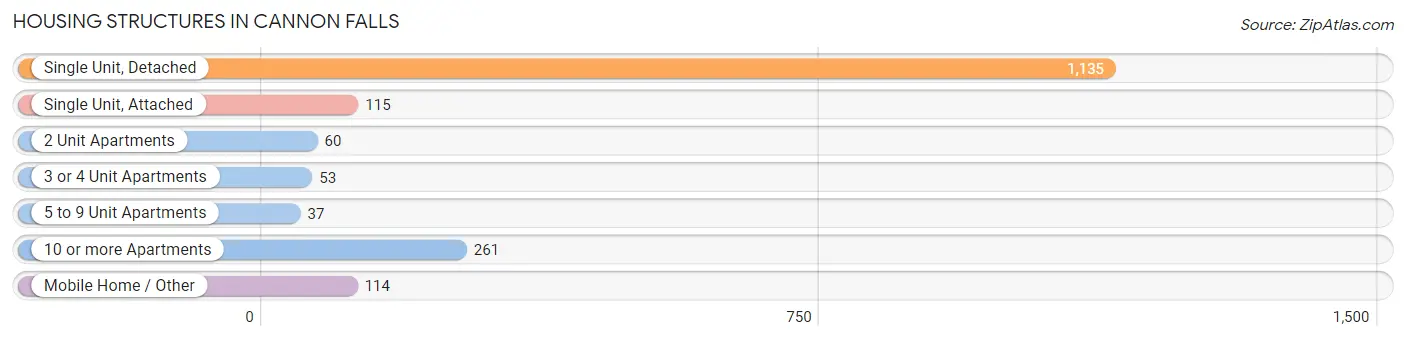
| Structure Type | # Housing Units | % Housing Units |
| Single Unit, Detached | 1,135 | 63.9% |
| Single Unit, Attached | 115 | 6.5% |
| 2 Unit Apartments | 60 | 3.4% |
| 3 or 4 Unit Apartments | 53 | 3.0% |
| 5 to 9 Unit Apartments | 37 | 2.1% |
| 10 or more Apartments | 261 | 14.7% |
| Mobile Home / Other | 114 | 6.4% |
| Total | 1,775 | 100.0% |
Housing Structures by Occupancy in Cannon Falls
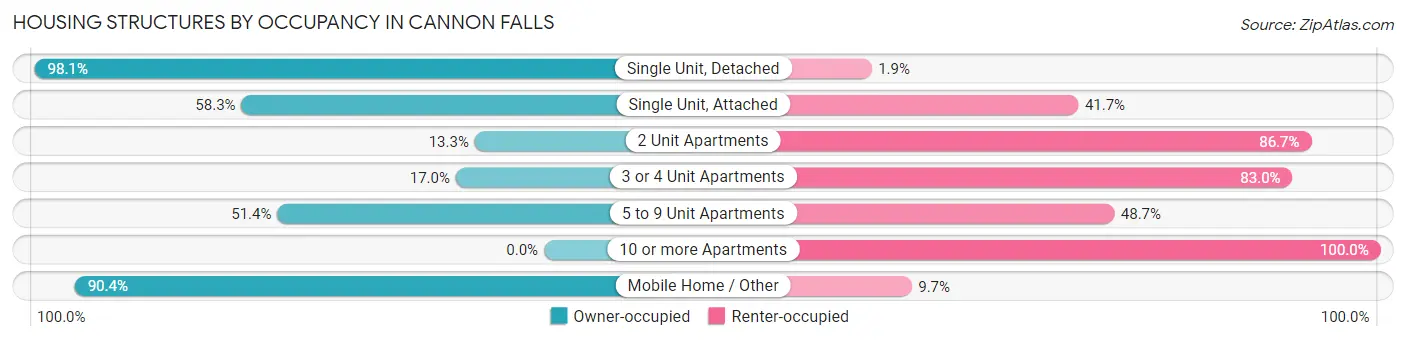
| Structure Type | Owner-occupied | Renter-occupied |
| Single Unit, Detached | 1,113 (98.1%) | 22 (1.9%) |
| Single Unit, Attached | 67 (58.3%) | 48 (41.7%) |
| 2 Unit Apartments | 8 (13.3%) | 52 (86.7%) |
| 3 or 4 Unit Apartments | 9 (17.0%) | 44 (83.0%) |
| 5 to 9 Unit Apartments | 19 (51.3%) | 18 (48.6%) |
| 10 or more Apartments | 0 (0.0%) | 261 (100.0%) |
| Mobile Home / Other | 103 (90.3%) | 11 (9.7%) |
| Total | 1,319 (74.3%) | 456 (25.7%) |
Housing Structures by Number of Rooms in Cannon Falls
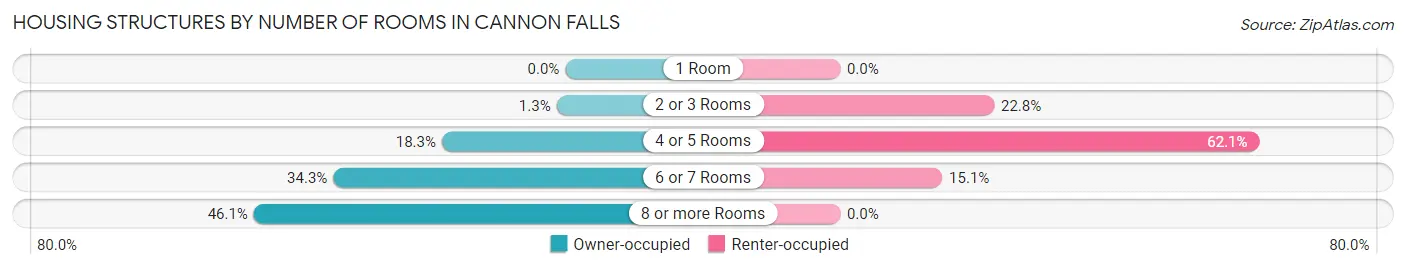
| Number of Rooms | Owner-occupied | Renter-occupied |
| 1 Room | 0 (0.0%) | 0 (0.0%) |
| 2 or 3 Rooms | 17 (1.3%) | 104 (22.8%) |
| 4 or 5 Rooms | 241 (18.3%) | 283 (62.1%) |
| 6 or 7 Rooms | 453 (34.3%) | 69 (15.1%) |
| 8 or more Rooms | 608 (46.1%) | 0 (0.0%) |
| Total | 1,319 (100.0%) | 456 (100.0%) |
Housing Structure by Heating Type in Cannon Falls
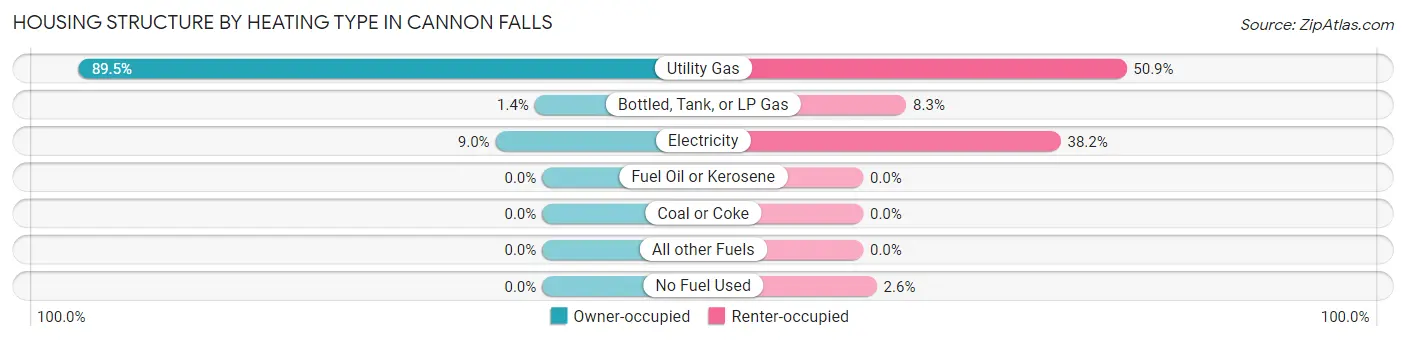
| Heating Type | Owner-occupied | Renter-occupied |
| Utility Gas | 1,181 (89.5%) | 232 (50.9%) |
| Bottled, Tank, or LP Gas | 19 (1.4%) | 38 (8.3%) |
| Electricity | 119 (9.0%) | 174 (38.2%) |
| Fuel Oil or Kerosene | 0 (0.0%) | 0 (0.0%) |
| Coal or Coke | 0 (0.0%) | 0 (0.0%) |
| All other Fuels | 0 (0.0%) | 0 (0.0%) |
| No Fuel Used | 0 (0.0%) | 12 (2.6%) |
| Total | 1,319 (100.0%) | 456 (100.0%) |
Household Vehicle Usage in Cannon Falls
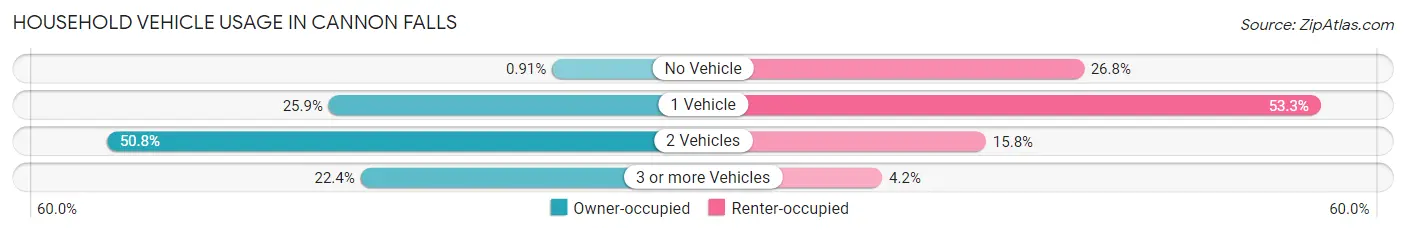
| Vehicles per Household | Owner-occupied | Renter-occupied |
| No Vehicle | 12 (0.9%) | 122 (26.8%) |
| 1 Vehicle | 342 (25.9%) | 243 (53.3%) |
| 2 Vehicles | 670 (50.8%) | 72 (15.8%) |
| 3 or more Vehicles | 295 (22.4%) | 19 (4.2%) |
| Total | 1,319 (100.0%) | 456 (100.0%) |
Real Estate & Mortgages in Cannon Falls
Real Estate and Mortgage Overview in Cannon Falls
| Characteristic | Without Mortgage | With Mortgage |
| Housing Units | 432 | 887 |
| Median Property Value | $216,300 | $257,500 |
| Median Household Income | $83,452 | $235 |
| Monthly Housing Costs | $633 | $16 |
| Real Estate Taxes | $3,034 | $5 |
Property Value by Mortgage Status in Cannon Falls
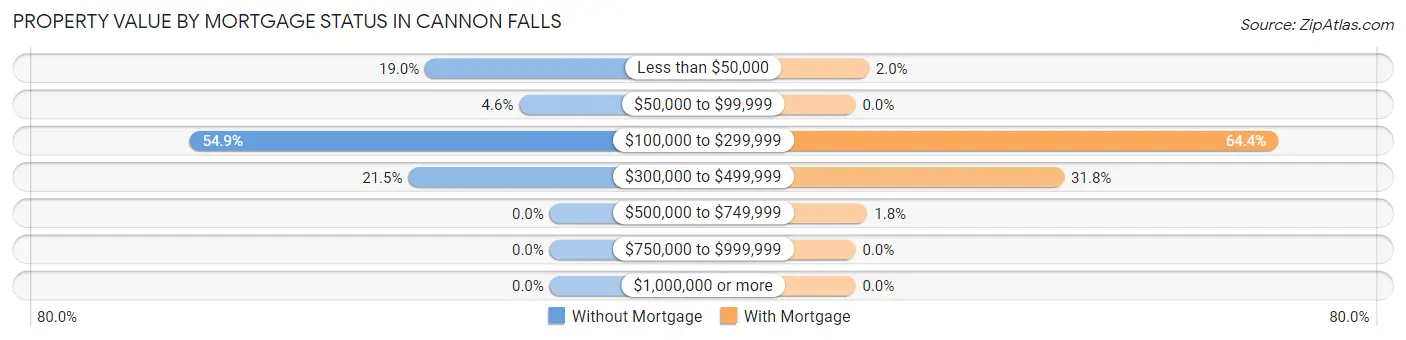
| Property Value | Without Mortgage | With Mortgage |
| Less than $50,000 | 82 (19.0%) | 18 (2.0%) |
| $50,000 to $99,999 | 20 (4.6%) | 0 (0.0%) |
| $100,000 to $299,999 | 237 (54.9%) | 571 (64.4%) |
| $300,000 to $499,999 | 93 (21.5%) | 282 (31.8%) |
| $500,000 to $749,999 | 0 (0.0%) | 16 (1.8%) |
| $750,000 to $999,999 | 0 (0.0%) | 0 (0.0%) |
| $1,000,000 or more | 0 (0.0%) | 0 (0.0%) |
| Total | 432 (100.0%) | 887 (100.0%) |
Household Income by Mortgage Status in Cannon Falls
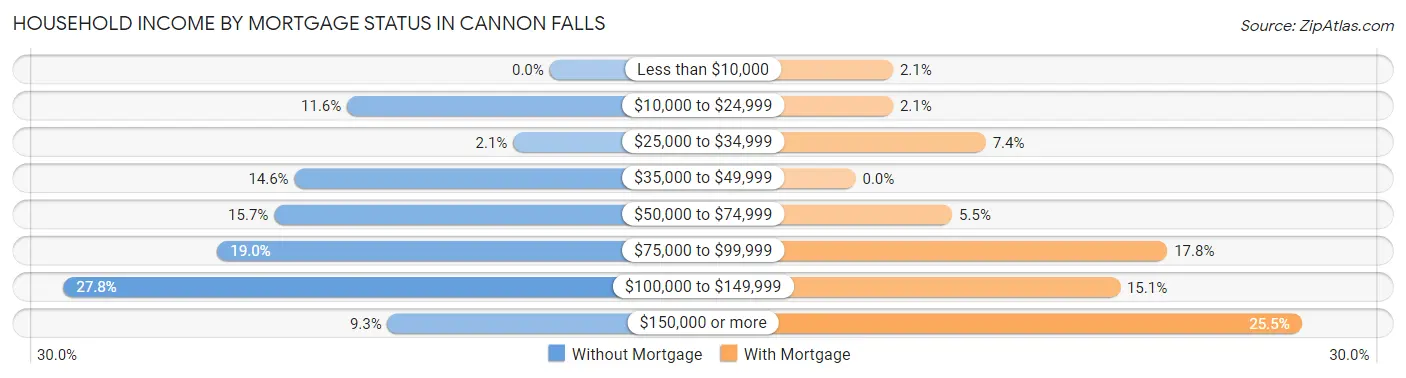
| Household Income | Without Mortgage | With Mortgage |
| Less than $10,000 | 0 (0.0%) | 19 (2.1%) |
| $10,000 to $24,999 | 50 (11.6%) | 19 (2.1%) |
| $25,000 to $34,999 | 9 (2.1%) | 66 (7.4%) |
| $35,000 to $49,999 | 63 (14.6%) | 0 (0.0%) |
| $50,000 to $74,999 | 68 (15.7%) | 49 (5.5%) |
| $75,000 to $99,999 | 82 (19.0%) | 158 (17.8%) |
| $100,000 to $149,999 | 120 (27.8%) | 134 (15.1%) |
| $150,000 or more | 40 (9.3%) | 226 (25.5%) |
| Total | 432 (100.0%) | 887 (100.0%) |
Property Value to Household Income Ratio in Cannon Falls
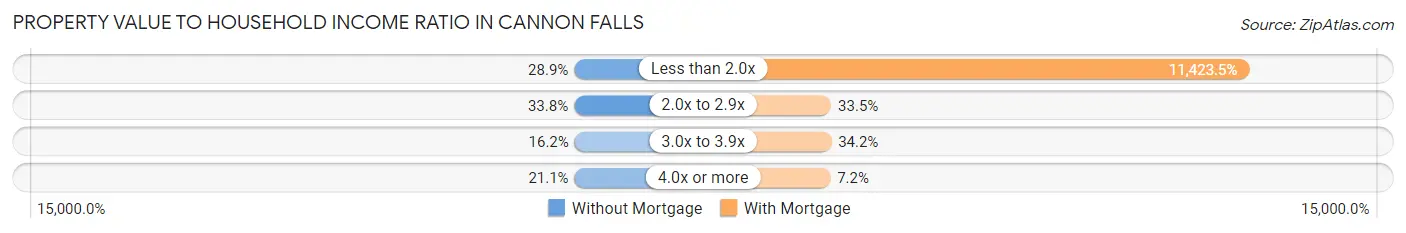
| Value-to-Income Ratio | Without Mortgage | With Mortgage |
| Less than 2.0x | 125 (28.9%) | 101,326 (11,423.4%) |
| 2.0x to 2.9x | 146 (33.8%) | 297 (33.5%) |
| 3.0x to 3.9x | 70 (16.2%) | 303 (34.2%) |
| 4.0x or more | 91 (21.1%) | 64 (7.2%) |
| Total | 432 (100.0%) | 887 (100.0%) |
Real Estate Taxes by Mortgage Status in Cannon Falls
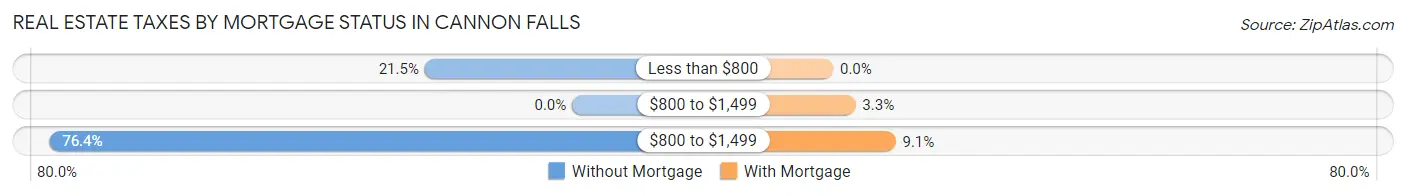
| Property Taxes | Without Mortgage | With Mortgage |
| Less than $800 | 93 (21.5%) | 0 (0.0%) |
| $800 to $1,499 | 0 (0.0%) | 29 (3.3%) |
| $800 to $1,499 | 330 (76.4%) | 81 (9.1%) |
| Total | 432 (100.0%) | 887 (100.0%) |
Health & Disability in Cannon Falls
Health Insurance Coverage by Age in Cannon Falls
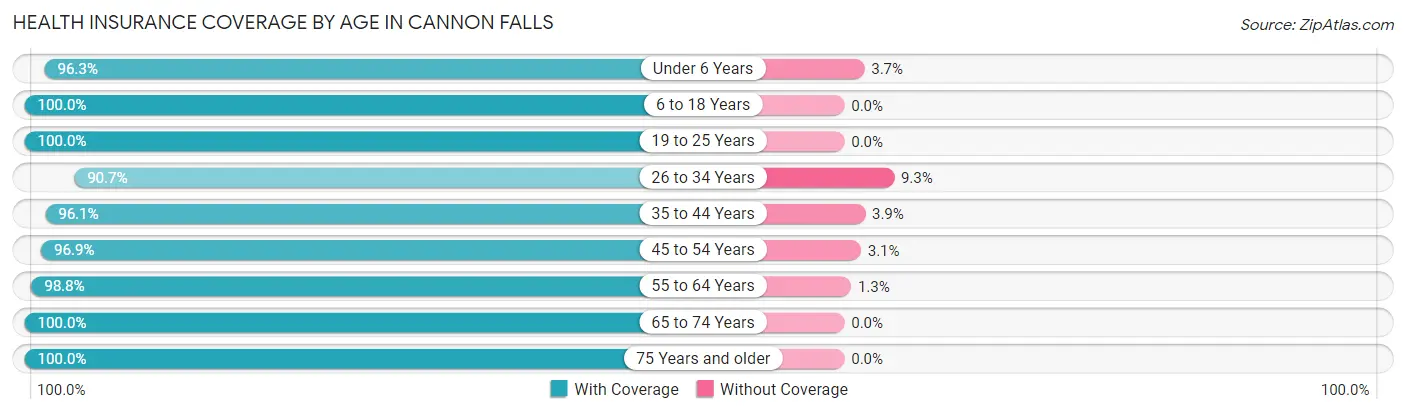
| Age Bracket | With Coverage | Without Coverage |
| Under 6 Years | 258 (96.3%) | 10 (3.7%) |
| 6 to 18 Years | 607 (100.0%) | 0 (0.0%) |
| 19 to 25 Years | 239 (100.0%) | 0 (0.0%) |
| 26 to 34 Years | 500 (90.7%) | 51 (9.3%) |
| 35 to 44 Years | 571 (96.1%) | 23 (3.9%) |
| 45 to 54 Years | 409 (96.9%) | 13 (3.1%) |
| 55 to 64 Years | 709 (98.8%) | 9 (1.3%) |
| 65 to 74 Years | 338 (100.0%) | 0 (0.0%) |
| 75 Years and older | 389 (100.0%) | 0 (0.0%) |
| Total | 4,020 (97.4%) | 106 (2.6%) |
Health Insurance Coverage by Citizenship Status in Cannon Falls
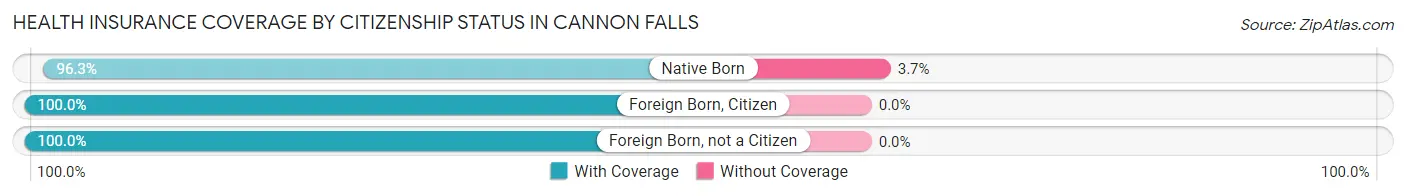
| Citizenship Status | With Coverage | Without Coverage |
| Native Born | 258 (96.3%) | 10 (3.7%) |
| Foreign Born, Citizen | 607 (100.0%) | 0 (0.0%) |
| Foreign Born, not a Citizen | 239 (100.0%) | 0 (0.0%) |
Health Insurance Coverage by Household Income in Cannon Falls
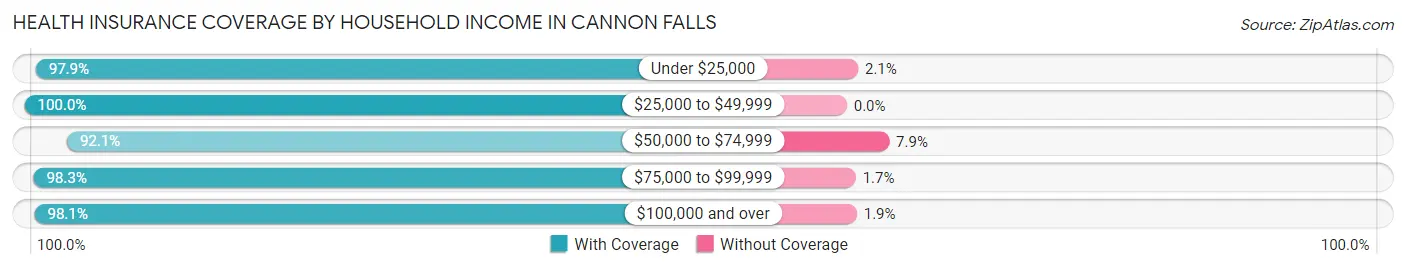
| Household Income | With Coverage | Without Coverage |
| Under $25,000 | 418 (97.9%) | 9 (2.1%) |
| $25,000 to $49,999 | 323 (100.0%) | 0 (0.0%) |
| $50,000 to $74,999 | 545 (92.1%) | 47 (7.9%) |
| $75,000 to $99,999 | 767 (98.3%) | 13 (1.7%) |
| $100,000 and over | 1,942 (98.1%) | 37 (1.9%) |
Public vs Private Health Insurance Coverage by Age in Cannon Falls
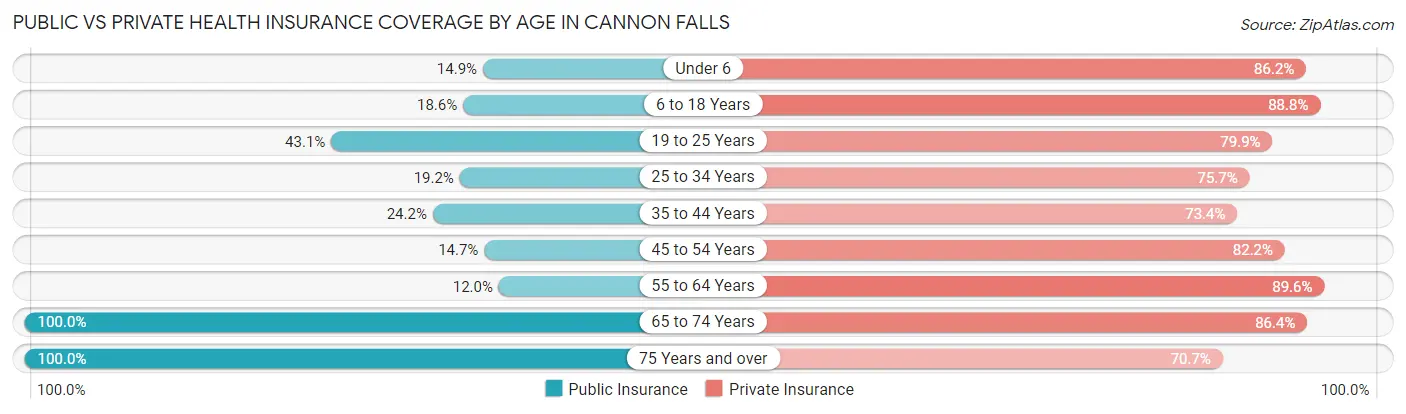
| Age Bracket | Public Insurance | Private Insurance |
| Under 6 | 40 (14.9%) | 231 (86.2%) |
| 6 to 18 Years | 113 (18.6%) | 539 (88.8%) |
| 19 to 25 Years | 103 (43.1%) | 191 (79.9%) |
| 25 to 34 Years | 106 (19.2%) | 417 (75.7%) |
| 35 to 44 Years | 144 (24.2%) | 436 (73.4%) |
| 45 to 54 Years | 62 (14.7%) | 347 (82.2%) |
| 55 to 64 Years | 86 (12.0%) | 643 (89.5%) |
| 65 to 74 Years | 338 (100.0%) | 292 (86.4%) |
| 75 Years and over | 389 (100.0%) | 275 (70.7%) |
| Total | 1,381 (33.5%) | 3,371 (81.7%) |
Disability Status by Sex by Age in Cannon Falls
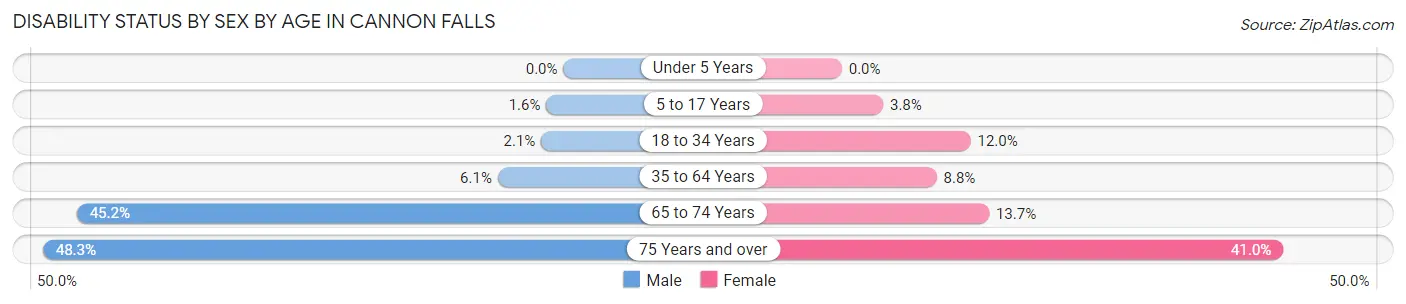
| Age Bracket | Male | Female |
| Under 5 Years | 0 (0.0%) | 0 (0.0%) |
| 5 to 17 Years | 6 (1.6%) | 8 (3.8%) |
| 18 to 34 Years | 8 (2.1%) | 54 (11.9%) |
| 35 to 64 Years | 53 (6.1%) | 76 (8.8%) |
| 65 to 74 Years | 70 (45.2%) | 25 (13.7%) |
| 75 Years and over | 57 (48.3%) | 111 (41.0%) |
Disability Class by Sex by Age in Cannon Falls
Disability Class: Hearing Difficulty
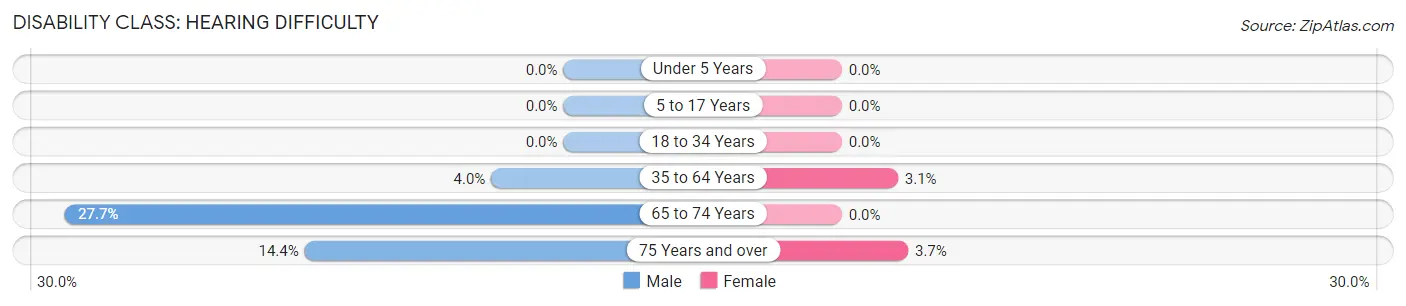
| Age Bracket | Male | Female |
| Under 5 Years | 0 (0.0%) | 0 (0.0%) |
| 5 to 17 Years | 0 (0.0%) | 0 (0.0%) |
| 18 to 34 Years | 0 (0.0%) | 0 (0.0%) |
| 35 to 64 Years | 35 (4.0%) | 27 (3.1%) |
| 65 to 74 Years | 43 (27.7%) | 0 (0.0%) |
| 75 Years and over | 17 (14.4%) | 10 (3.7%) |
Disability Class: Vision Difficulty
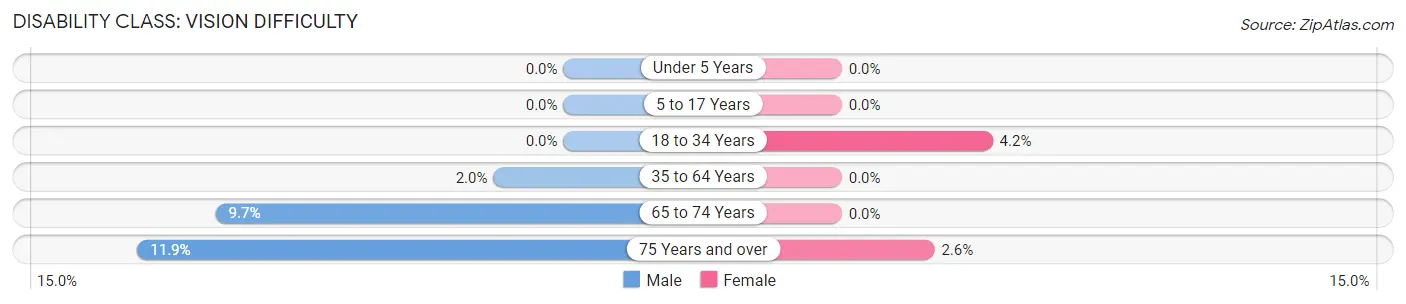
| Age Bracket | Male | Female |
| Under 5 Years | 0 (0.0%) | 0 (0.0%) |
| 5 to 17 Years | 0 (0.0%) | 0 (0.0%) |
| 18 to 34 Years | 0 (0.0%) | 19 (4.2%) |
| 35 to 64 Years | 17 (1.9%) | 0 (0.0%) |
| 65 to 74 Years | 15 (9.7%) | 0 (0.0%) |
| 75 Years and over | 14 (11.9%) | 7 (2.6%) |
Disability Class: Cognitive Difficulty
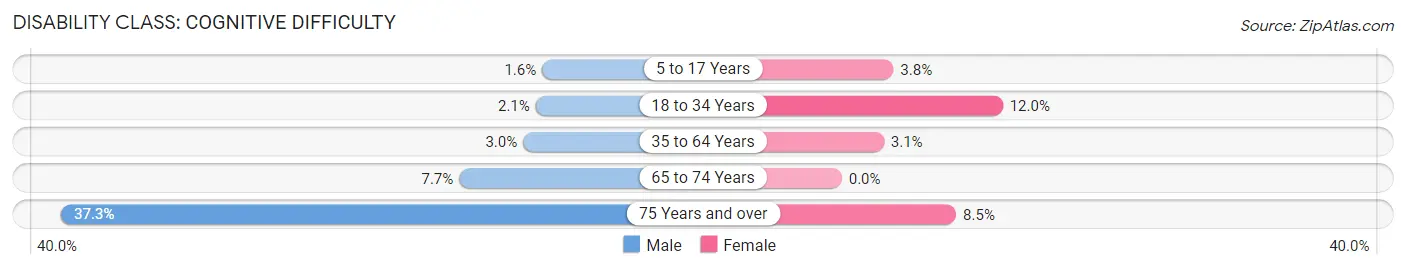
| Age Bracket | Male | Female |
| 5 to 17 Years | 6 (1.6%) | 8 (3.8%) |
| 18 to 34 Years | 8 (2.1%) | 54 (11.9%) |
| 35 to 64 Years | 26 (3.0%) | 27 (3.1%) |
| 65 to 74 Years | 12 (7.7%) | 0 (0.0%) |
| 75 Years and over | 44 (37.3%) | 23 (8.5%) |
Disability Class: Ambulatory Difficulty
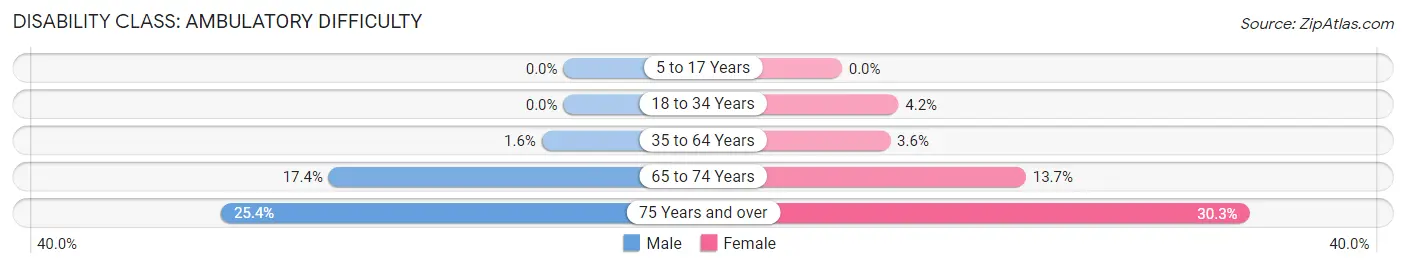
| Age Bracket | Male | Female |
| 5 to 17 Years | 0 (0.0%) | 0 (0.0%) |
| 18 to 34 Years | 0 (0.0%) | 19 (4.2%) |
| 35 to 64 Years | 14 (1.6%) | 31 (3.6%) |
| 65 to 74 Years | 27 (17.4%) | 25 (13.7%) |
| 75 Years and over | 30 (25.4%) | 82 (30.3%) |
Disability Class: Self-Care Difficulty
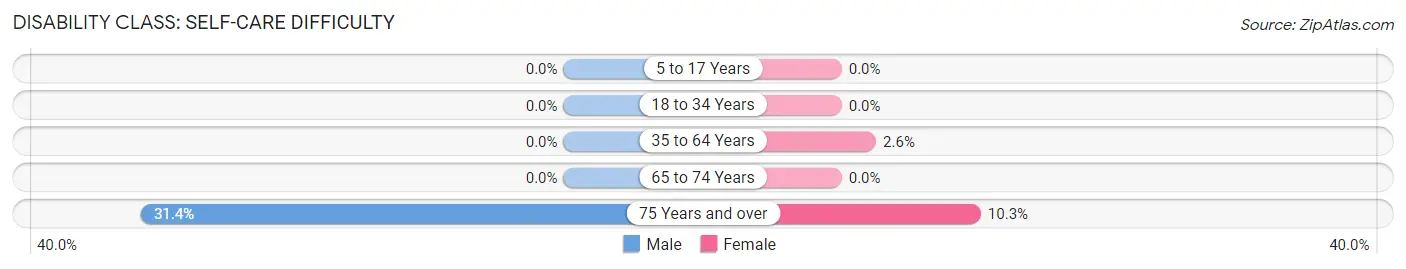
| Age Bracket | Male | Female |
| 5 to 17 Years | 0 (0.0%) | 0 (0.0%) |
| 18 to 34 Years | 0 (0.0%) | 0 (0.0%) |
| 35 to 64 Years | 0 (0.0%) | 22 (2.5%) |
| 65 to 74 Years | 0 (0.0%) | 0 (0.0%) |
| 75 Years and over | 37 (31.4%) | 28 (10.3%) |
Technology Access in Cannon Falls
Computing Device Access in Cannon Falls
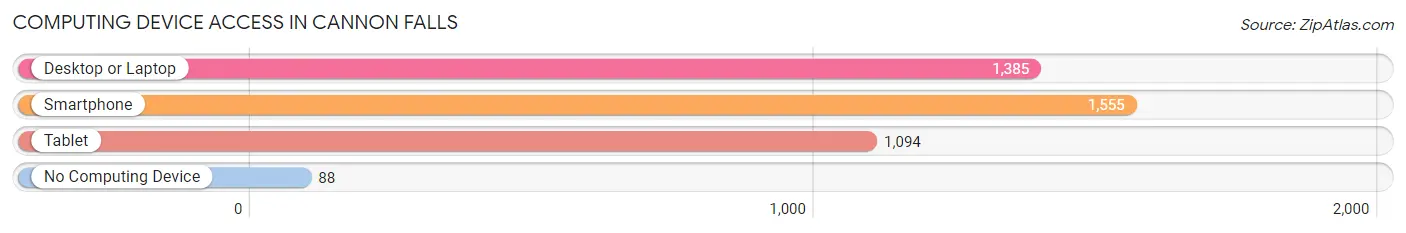
| Device Type | # Households | % Households |
| Desktop or Laptop | 1,385 | 78.0% |
| Smartphone | 1,555 | 87.6% |
| Tablet | 1,094 | 61.6% |
| No Computing Device | 88 | 5.0% |
| Total | 1,775 | 100.0% |
Internet Access in Cannon Falls
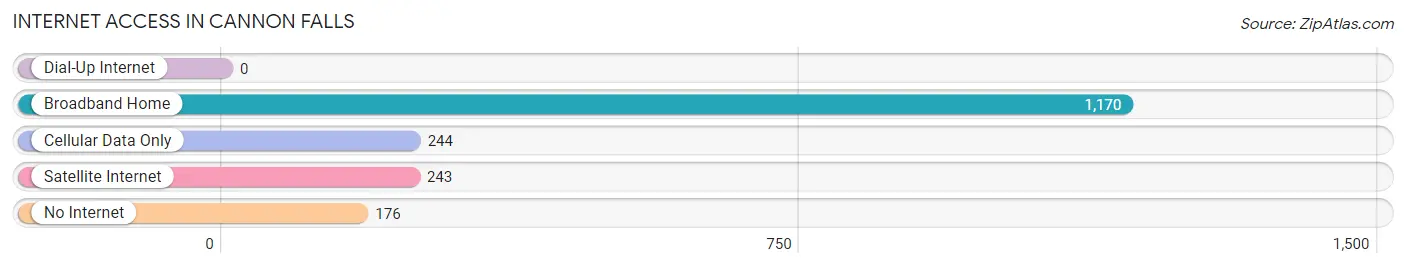
| Internet Type | # Households | % Households |
| Dial-Up Internet | 0 | 0.0% |
| Broadband Home | 1,170 | 65.9% |
| Cellular Data Only | 244 | 13.8% |
| Satellite Internet | 243 | 13.7% |
| No Internet | 176 | 9.9% |
| Total | 1,775 | 100.0% |
Cannon Falls Summary
Cannon Falls, Minnesota is a small city located in Goodhue County, Minnesota. It is situated along the Cannon River, approximately 40 miles south of the Twin Cities. The city has a population of 4,083 as of the 2010 census, making it the largest city in Goodhue County.
History
Cannon Falls was first settled in 1854 by a group of settlers from New York. The city was named after the nearby falls on the Cannon River. The falls were named after the cannon that was used to mark the boundary between the Dakota and Ojibwe nations. The city was incorporated in 1857 and was the first city in Goodhue County.
In the late 19th century, Cannon Falls was a major center for the lumber industry. The city was also home to several flour mills, which were powered by the Cannon River. The city was also home to a number of brickyards, which produced bricks for the construction of buildings in the area.
Geography
Cannon Falls is located in southeastern Minnesota, approximately 40 miles south of the Twin Cities. The city is situated along the Cannon River, which flows through the city. The city is located in a hilly area, with the highest point being the Cannon River Valley at an elevation of 890 feet.
The city has a total area of 4.2 square miles, of which 4.1 square miles is land and 0.1 square miles is water. The city is located in the Cannon River Valley, which is part of the Driftless Area. The area is known for its rolling hills and valleys, which are the result of the last glacial period.
Economy
Cannon Falls is home to a number of businesses, including manufacturing, retail, and service industries. The city is home to several manufacturing companies, including a plastics manufacturer, a metal fabricator, and a food processor. The city is also home to a number of retail stores, including a grocery store, a hardware store, and a variety of specialty shops.
The city is also home to a number of service industries, including a hospital, a nursing home, and a number of medical and dental offices. The city is also home to a number of restaurants, bars, and other entertainment venues.
Demographics
As of the 2010 census, the population of Cannon Falls was 4,083. The racial makeup of the city was 97.2% White, 0.7% African American, 0.3% Native American, 0.3% Asian, 0.1% Pacific Islander, 0.5% from other races, and 0.9% from two or more races. Hispanic or Latino of any race were 1.3% of the population.
The median income for a household in the city was $50,938, and the median income for a family was $60,938. The per capita income for the city was $24,938. About 5.2% of families and 7.2% of the population were below the poverty line, including 8.3% of those under age 18 and 6.2% of those age 65 or over.
Common Questions
What is Per Capita Income in Cannon Falls?
Per Capita income in Cannon Falls is $37,551.
What is the Median Family Income in Cannon Falls?
Median Family Income in Cannon Falls is $100,750.
What is the Median Household income in Cannon Falls?
Median Household Income in Cannon Falls is $76,442.
What is Income or Wage Gap in Cannon Falls?
Income or Wage Gap in Cannon Falls is 28.6%.
Women in Cannon Falls earn 71.4 cents for every dollar earned by a man.
What is Inequality or Gini Index in Cannon Falls?
Inequality or Gini Index in Cannon Falls is 0.39.
What is the Total Population of Cannon Falls?
Total Population of Cannon Falls is 4,214.
What is the Total Male Population of Cannon Falls?
Total Male Population of Cannon Falls is 2,078.
What is the Total Female Population of Cannon Falls?
Total Female Population of Cannon Falls is 2,136.
What is the Ratio of Males per 100 Females in Cannon Falls?
There are 97.28 Males per 100 Females in Cannon Falls.
What is the Ratio of Females per 100 Males in Cannon Falls?
There are 102.79 Females per 100 Males in Cannon Falls.
What is the Median Population Age in Cannon Falls?
Median Population Age in Cannon Falls is 41.6 Years.
What is the Average Family Size in Cannon Falls
Average Family Size in Cannon Falls is 3.0 People.
What is the Average Household Size in Cannon Falls
Average Household Size in Cannon Falls is 2.3 People.
How Large is the Labor Force in Cannon Falls?
There are 2,353 People in the Labor Forcein in Cannon Falls.
What is the Percentage of People in the Labor Force in Cannon Falls?
67.7% of People are in the Labor Force in Cannon Falls.
What is the Unemployment Rate in Cannon Falls?
Unemployment Rate in Cannon Falls is 1.6%.