White/Caucasian vs Soviet Union No Vehicles in Household
COMPARE
White/Caucasian
Soviet Union
No Vehicles in Household
No Vehicles in Household Comparison
Whites/Caucasians
Soviet Union
7.0%
NO VEHICLES IN HOUSEHOLD
100.0/ 100
METRIC RATING
15th/ 347
METRIC RANK
17.4%
NO VEHICLES IN HOUSEHOLD
0.0/ 100
METRIC RATING
320th/ 347
METRIC RANK
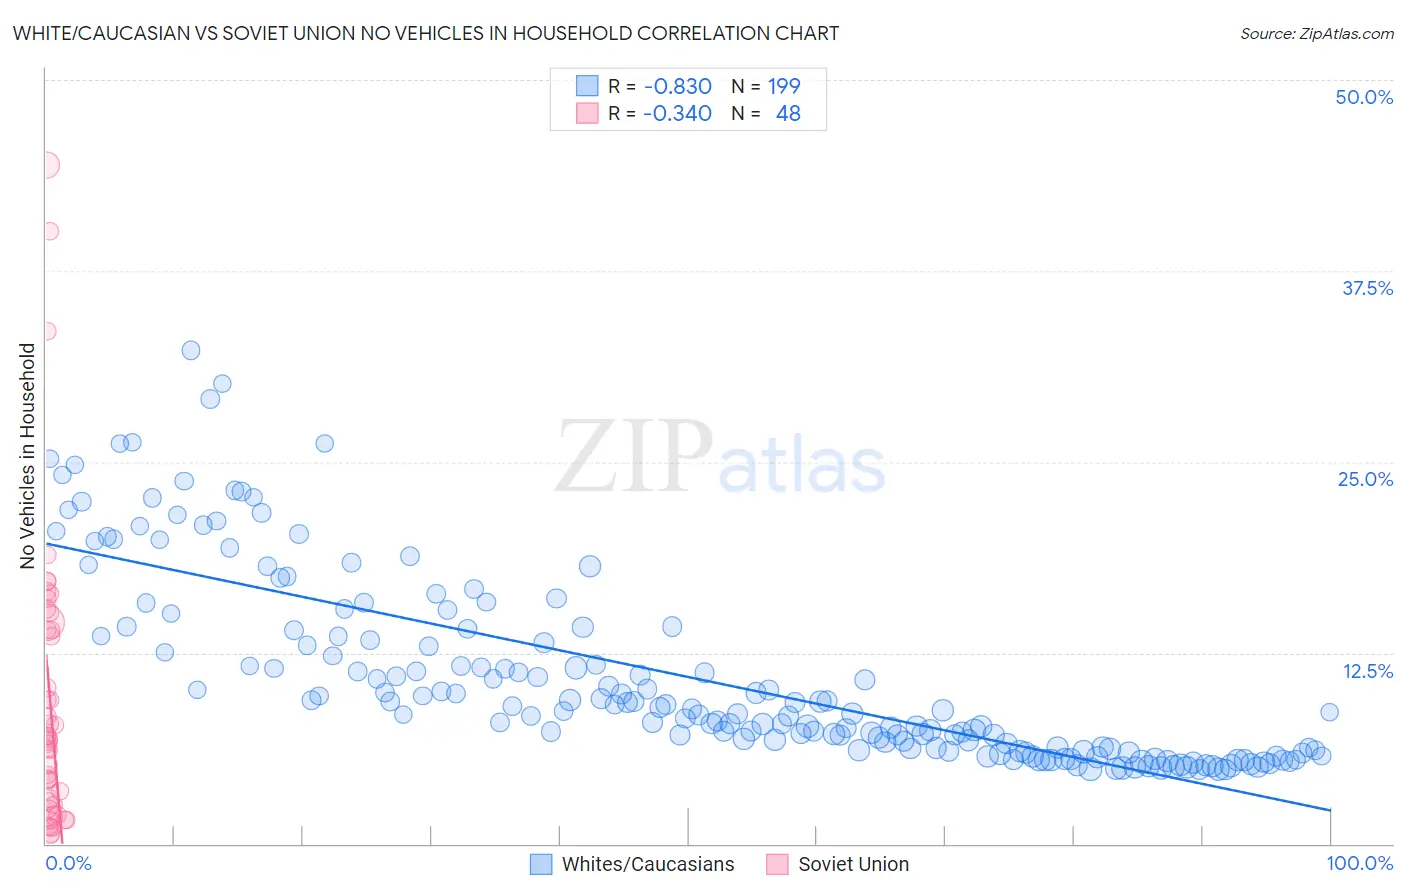
White/Caucasian vs Soviet Union No Vehicles in Household Correlation Chart
The statistical analysis conducted on geographies consisting of 564,577,305 people shows a very strong negative correlation between the proportion of Whites/Caucasians and percentage of households with no vehicle available in the United States with a correlation coefficient (R) of -0.830 and weighted average of 7.0%. Similarly, the statistical analysis conducted on geographies consisting of 43,483,285 people shows a mild negative correlation between the proportion of Soviet Union and percentage of households with no vehicle available in the United States with a correlation coefficient (R) of -0.340 and weighted average of 17.4%, a difference of 147.8%.
No Vehicles in Household Correlation Summary
| Measurement | White/Caucasian | Soviet Union |
| Minimum | 4.8% | 0.54% |
| Maximum | 32.3% | 44.4% |
| Range | 27.4% | 43.9% |
| Mean | 10.9% | 9.5% |
| Median | 8.7% | 6.8% |
| Interquartile 25% (IQ1) | 6.2% | 2.7% |
| Interquartile 75% (IQ3) | 13.6% | 14.3% |
| Interquartile Range (IQR) | 7.4% | 11.6% |
| Standard Deviation (Sample) | 6.1% | 9.6% |
| Standard Deviation (Population) | 6.1% | 9.5% |
Similar Demographics by No Vehicles in Household
Demographics Similar to Whites/Caucasians by No Vehicles in Household
In terms of no vehicles in household, the demographic groups most similar to Whites/Caucasians are Mexican (7.0%, a difference of 0.13%), Scandinavian (7.0%, a difference of 0.30%), Assyrian/Chaldean/Syriac (7.0%, a difference of 0.80%), European (7.1%, a difference of 1.1%), and Welsh (7.2%, a difference of 1.7%).
| Demographics | Rating | Rank | No Vehicles in Household |
| Swedes | 100.0 /100 | #8 | Exceptional 6.8% |
| Scotch-Irish | 100.0 /100 | #9 | Exceptional 6.8% |
| Dutch | 100.0 /100 | #10 | Exceptional 6.8% |
| Czechs | 100.0 /100 | #11 | Exceptional 6.9% |
| Assyrians/Chaldeans/Syriacs | 100.0 /100 | #12 | Exceptional 7.0% |
| Scandinavians | 100.0 /100 | #13 | Exceptional 7.0% |
| Mexicans | 100.0 /100 | #14 | Exceptional 7.0% |
| Whites/Caucasians | 100.0 /100 | #15 | Exceptional 7.0% |
| Europeans | 100.0 /100 | #16 | Exceptional 7.1% |
| Welsh | 100.0 /100 | #17 | Exceptional 7.2% |
| Tongans | 100.0 /100 | #18 | Exceptional 7.2% |
| Arapaho | 100.0 /100 | #19 | Exceptional 7.4% |
| Ottawa | 100.0 /100 | #20 | Exceptional 7.4% |
| Nepalese | 100.0 /100 | #21 | Exceptional 7.4% |
| Irish | 100.0 /100 | #22 | Exceptional 7.4% |
Demographics Similar to Soviet Union by No Vehicles in Household
In terms of no vehicles in household, the demographic groups most similar to Soviet Union are Alaska Native (17.4%, a difference of 0.16%), Jamaican (17.9%, a difference of 2.9%), Immigrants from Belarus (16.7%, a difference of 4.1%), Immigrants from Ghana (16.6%, a difference of 5.0%), and Immigrants from Cabo Verde (18.4%, a difference of 5.8%).
| Demographics | Rating | Rank | No Vehicles in Household |
| Tohono O'odham | 0.0 /100 | #313 | Tragic 15.6% |
| Albanians | 0.0 /100 | #314 | Tragic 15.6% |
| Cypriots | 0.0 /100 | #315 | Tragic 15.7% |
| Ghanaians | 0.0 /100 | #316 | Tragic 16.4% |
| Immigrants | Ghana | 0.0 /100 | #317 | Tragic 16.6% |
| Immigrants | Belarus | 0.0 /100 | #318 | Tragic 16.7% |
| Alaska Natives | 0.0 /100 | #319 | Tragic 17.4% |
| Soviet Union | 0.0 /100 | #320 | Tragic 17.4% |
| Jamaicans | 0.0 /100 | #321 | Tragic 17.9% |
| Immigrants | Cabo Verde | 0.0 /100 | #322 | Tragic 18.4% |
| Immigrants | Yemen | 0.0 /100 | #323 | Tragic 19.5% |
| Immigrants | Caribbean | 0.0 /100 | #324 | Tragic 19.6% |
| Senegalese | 0.0 /100 | #325 | Tragic 19.8% |
| Immigrants | West Indies | 0.0 /100 | #326 | Tragic 20.5% |
| Immigrants | Senegal | 0.0 /100 | #327 | Tragic 21.1% |