Welsh vs Costa Rican 4 or more Vehicles in Household
COMPARE
Welsh
Costa Rican
4 or more Vehicles in Household
4 or more Vehicles in Household Comparison
Welsh
Costa Ricans
7.5%
4 OR MORE VEHICLES IN HOUSEHOLD
99.9/ 100
METRIC RATING
68th/ 347
METRIC RANK
6.8%
4 OR MORE VEHICLES IN HOUSEHOLD
95.5/ 100
METRIC RATING
119th/ 347
METRIC RANK
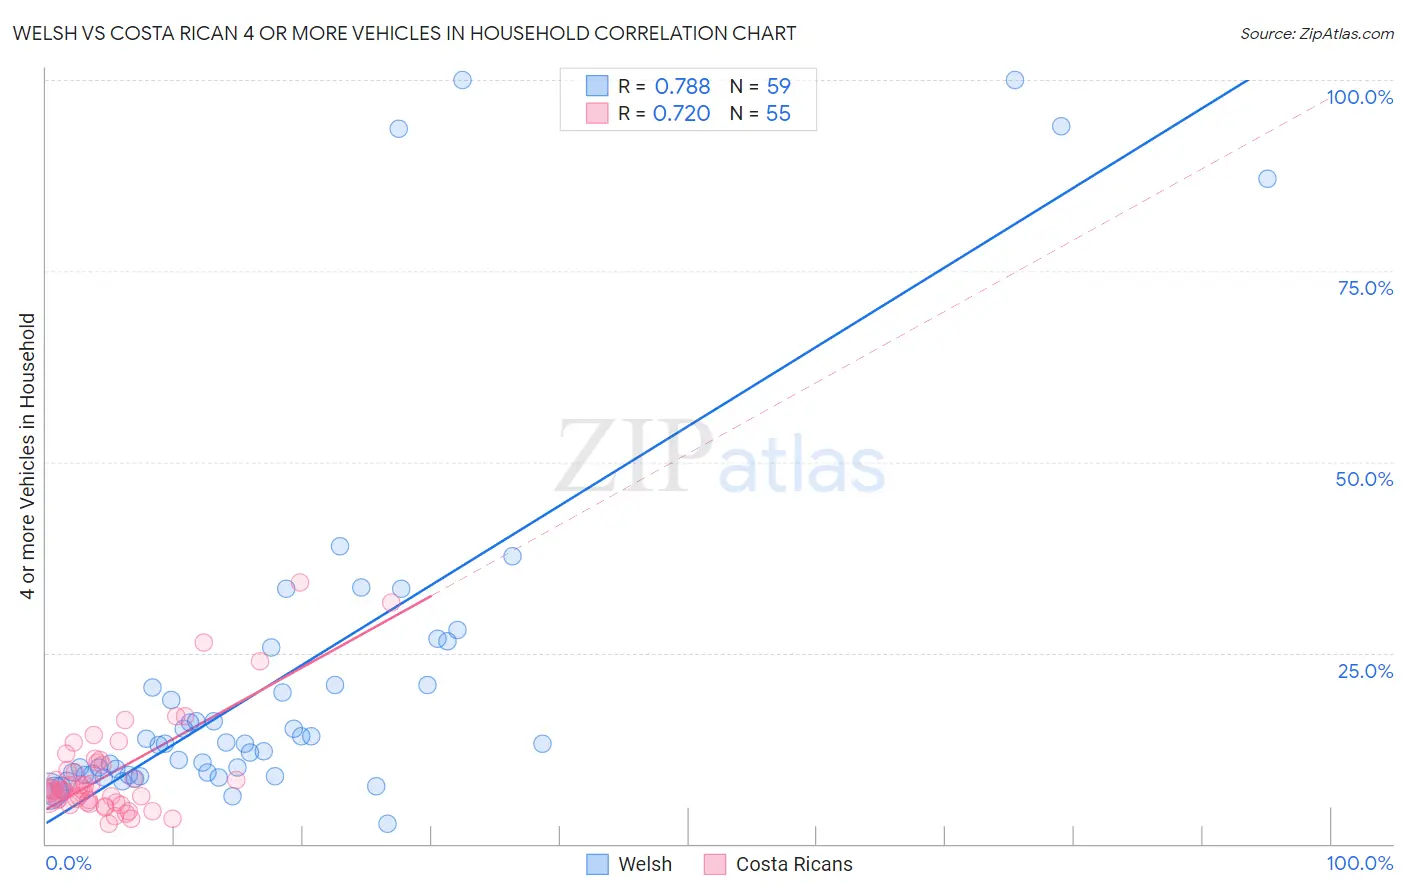
Welsh vs Costa Rican 4 or more Vehicles in Household Correlation Chart
The statistical analysis conducted on geographies consisting of 526,008,670 people shows a strong positive correlation between the proportion of Welsh and percentage of households with 4 or more vehicles available in the United States with a correlation coefficient (R) of 0.788 and weighted average of 7.5%. Similarly, the statistical analysis conducted on geographies consisting of 252,442,983 people shows a strong positive correlation between the proportion of Costa Ricans and percentage of households with 4 or more vehicles available in the United States with a correlation coefficient (R) of 0.720 and weighted average of 6.8%, a difference of 10.0%.
4 or more Vehicles in Household Correlation Summary
| Measurement | Welsh | Costa Rican |
| Minimum | 2.6% | 2.7% |
| Maximum | 100.0% | 34.3% |
| Range | 97.4% | 31.6% |
| Mean | 21.8% | 9.3% |
| Median | 13.1% | 7.1% |
| Interquartile 25% (IQ1) | 9.1% | 5.5% |
| Interquartile 75% (IQ3) | 20.8% | 10.6% |
| Interquartile Range (IQR) | 11.8% | 5.1% |
| Standard Deviation (Sample) | 24.0% | 6.6% |
| Standard Deviation (Population) | 23.8% | 6.5% |
Similar Demographics by 4 or more Vehicles in Household
Demographics Similar to Welsh by 4 or more Vehicles in Household
In terms of 4 or more vehicles in household, the demographic groups most similar to Welsh are American (7.5%, a difference of 0.36%), Immigrants from Taiwan (7.5%, a difference of 0.37%), German (7.5%, a difference of 0.59%), Scottish (7.4%, a difference of 0.67%), and Immigrants from the Azores (7.5%, a difference of 0.70%).
| Demographics | Rating | Rank | 4 or more Vehicles in Household |
| Europeans | 100.0 /100 | #61 | Exceptional 7.6% |
| Chippewa | 100.0 /100 | #62 | Exceptional 7.6% |
| Immigrants | Micronesia | 100.0 /100 | #63 | Exceptional 7.6% |
| Bangladeshis | 100.0 /100 | #64 | Exceptional 7.6% |
| Immigrants | Azores | 100.0 /100 | #65 | Exceptional 7.5% |
| Immigrants | Taiwan | 99.9 /100 | #66 | Exceptional 7.5% |
| Americans | 99.9 /100 | #67 | Exceptional 7.5% |
| Welsh | 99.9 /100 | #68 | Exceptional 7.5% |
| Germans | 99.9 /100 | #69 | Exceptional 7.5% |
| Scottish | 99.9 /100 | #70 | Exceptional 7.4% |
| Chickasaw | 99.9 /100 | #71 | Exceptional 7.4% |
| Scotch-Irish | 99.9 /100 | #72 | Exceptional 7.4% |
| Portuguese | 99.9 /100 | #73 | Exceptional 7.4% |
| Icelanders | 99.9 /100 | #74 | Exceptional 7.4% |
| Immigrants | Cambodia | 99.9 /100 | #75 | Exceptional 7.4% |
Demographics Similar to Costa Ricans by 4 or more Vehicles in Household
In terms of 4 or more vehicles in household, the demographic groups most similar to Costa Ricans are Burmese (6.8%, a difference of 0.11%), French American Indian (6.8%, a difference of 0.11%), Immigrants from Guatemala (6.8%, a difference of 0.13%), Comanche (6.8%, a difference of 0.36%), and Tlingit-Haida (6.8%, a difference of 0.39%).
| Demographics | Rating | Rank | 4 or more Vehicles in Household |
| Hopi | 97.0 /100 | #112 | Exceptional 6.9% |
| Canadians | 96.4 /100 | #113 | Exceptional 6.9% |
| Bolivians | 96.3 /100 | #114 | Exceptional 6.8% |
| Tlingit-Haida | 96.2 /100 | #115 | Exceptional 6.8% |
| Immigrants | Guatemala | 95.8 /100 | #116 | Exceptional 6.8% |
| Burmese | 95.7 /100 | #117 | Exceptional 6.8% |
| French American Indians | 95.7 /100 | #118 | Exceptional 6.8% |
| Costa Ricans | 95.5 /100 | #119 | Exceptional 6.8% |
| Comanche | 94.8 /100 | #120 | Exceptional 6.8% |
| Immigrants | Germany | 94.7 /100 | #121 | Exceptional 6.8% |
| Immigrants | Nicaragua | 94.7 /100 | #122 | Exceptional 6.8% |
| Immigrants | Immigrants | 94.6 /100 | #123 | Exceptional 6.8% |
| Immigrants | Asia | 94.4 /100 | #124 | Exceptional 6.8% |
| Austrians | 94.1 /100 | #125 | Exceptional 6.8% |
| Belgians | 94.1 /100 | #126 | Exceptional 6.8% |