Albanian vs Costa Rican 4 or more Vehicles in Household
COMPARE
Albanian
Costa Rican
4 or more Vehicles in Household
4 or more Vehicles in Household Comparison
Albanians
Costa Ricans
4.8%
4 OR MORE VEHICLES IN HOUSEHOLD
0.0/ 100
METRIC RATING
312th/ 347
METRIC RANK
6.8%
4 OR MORE VEHICLES IN HOUSEHOLD
95.5/ 100
METRIC RATING
119th/ 347
METRIC RANK
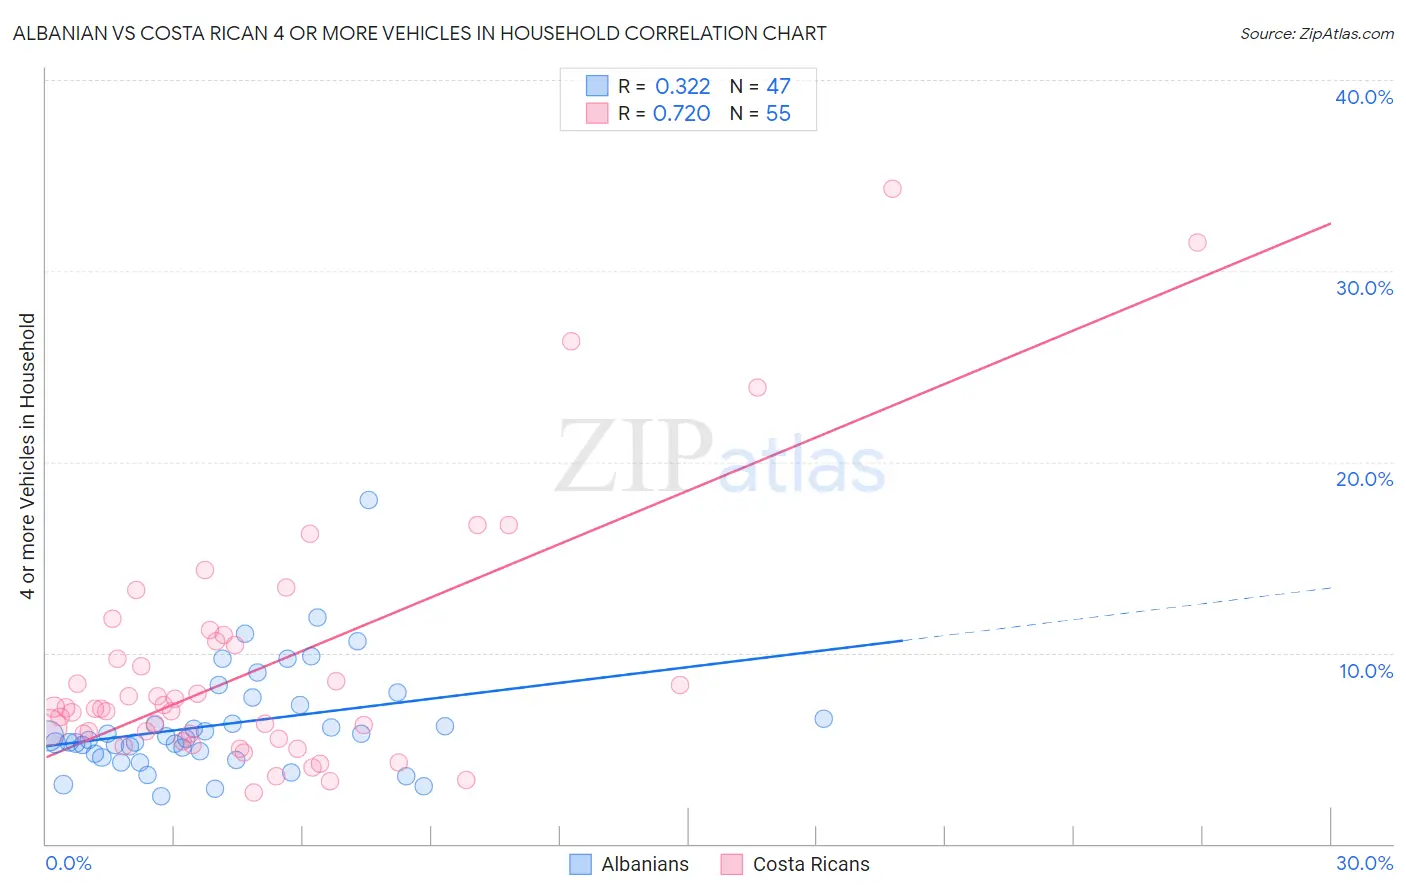
Albanian vs Costa Rican 4 or more Vehicles in Household Correlation Chart
The statistical analysis conducted on geographies consisting of 192,343,079 people shows a mild positive correlation between the proportion of Albanians and percentage of households with 4 or more vehicles available in the United States with a correlation coefficient (R) of 0.322 and weighted average of 4.8%. Similarly, the statistical analysis conducted on geographies consisting of 252,442,983 people shows a strong positive correlation between the proportion of Costa Ricans and percentage of households with 4 or more vehicles available in the United States with a correlation coefficient (R) of 0.720 and weighted average of 6.8%, a difference of 42.5%.
4 or more Vehicles in Household Correlation Summary
| Measurement | Albanian | Costa Rican |
| Minimum | 2.5% | 2.7% |
| Maximum | 18.0% | 34.3% |
| Range | 15.5% | 31.6% |
| Mean | 6.3% | 9.3% |
| Median | 5.5% | 7.1% |
| Interquartile 25% (IQ1) | 4.7% | 5.5% |
| Interquartile 75% (IQ3) | 7.3% | 10.6% |
| Interquartile Range (IQR) | 2.5% | 5.1% |
| Standard Deviation (Sample) | 2.8% | 6.6% |
| Standard Deviation (Population) | 2.8% | 6.5% |
Similar Demographics by 4 or more Vehicles in Household
Demographics Similar to Albanians by 4 or more Vehicles in Household
In terms of 4 or more vehicles in household, the demographic groups most similar to Albanians are Immigrants from Israel (4.8%, a difference of 0.010%), Immigrants from West Indies (4.7%, a difference of 0.81%), Immigrants from Belarus (4.7%, a difference of 0.90%), Puerto Rican (4.7%, a difference of 1.3%), and Houma (4.9%, a difference of 2.7%).
| Demographics | Rating | Rank | 4 or more Vehicles in Household |
| Somalis | 0.0 /100 | #305 | Tragic 5.0% |
| Immigrants | Serbia | 0.0 /100 | #306 | Tragic 5.0% |
| Menominee | 0.0 /100 | #307 | Tragic 5.0% |
| Paraguayans | 0.0 /100 | #308 | Tragic 4.9% |
| Immigrants | Somalia | 0.0 /100 | #309 | Tragic 4.9% |
| Moroccans | 0.0 /100 | #310 | Tragic 4.9% |
| Houma | 0.0 /100 | #311 | Tragic 4.9% |
| Albanians | 0.0 /100 | #312 | Tragic 4.8% |
| Immigrants | Israel | 0.0 /100 | #313 | Tragic 4.8% |
| Immigrants | West Indies | 0.0 /100 | #314 | Tragic 4.7% |
| Immigrants | Belarus | 0.0 /100 | #315 | Tragic 4.7% |
| Puerto Ricans | 0.0 /100 | #316 | Tragic 4.7% |
| U.S. Virgin Islanders | 0.0 /100 | #317 | Tragic 4.6% |
| Jamaicans | 0.0 /100 | #318 | Tragic 4.6% |
| Haitians | 0.0 /100 | #319 | Tragic 4.6% |
Demographics Similar to Costa Ricans by 4 or more Vehicles in Household
In terms of 4 or more vehicles in household, the demographic groups most similar to Costa Ricans are Burmese (6.8%, a difference of 0.11%), French American Indian (6.8%, a difference of 0.11%), Immigrants from Guatemala (6.8%, a difference of 0.13%), Comanche (6.8%, a difference of 0.36%), and Tlingit-Haida (6.8%, a difference of 0.39%).
| Demographics | Rating | Rank | 4 or more Vehicles in Household |
| Hopi | 97.0 /100 | #112 | Exceptional 6.9% |
| Canadians | 96.4 /100 | #113 | Exceptional 6.9% |
| Bolivians | 96.3 /100 | #114 | Exceptional 6.8% |
| Tlingit-Haida | 96.2 /100 | #115 | Exceptional 6.8% |
| Immigrants | Guatemala | 95.8 /100 | #116 | Exceptional 6.8% |
| Burmese | 95.7 /100 | #117 | Exceptional 6.8% |
| French American Indians | 95.7 /100 | #118 | Exceptional 6.8% |
| Costa Ricans | 95.5 /100 | #119 | Exceptional 6.8% |
| Comanche | 94.8 /100 | #120 | Exceptional 6.8% |
| Immigrants | Germany | 94.7 /100 | #121 | Exceptional 6.8% |
| Immigrants | Nicaragua | 94.7 /100 | #122 | Exceptional 6.8% |
| Immigrants | Immigrants | 94.6 /100 | #123 | Exceptional 6.8% |
| Immigrants | Asia | 94.4 /100 | #124 | Exceptional 6.8% |
| Austrians | 94.1 /100 | #125 | Exceptional 6.8% |
| Belgians | 94.1 /100 | #126 | Exceptional 6.8% |