Welsh vs Slovene 4 or more Vehicles in Household
COMPARE
Welsh
Slovene
4 or more Vehicles in Household
4 or more Vehicles in Household Comparison
Welsh
Slovenes
7.5%
4 OR MORE VEHICLES IN HOUSEHOLD
99.9/ 100
METRIC RATING
68th/ 347
METRIC RANK
6.3%
4 OR MORE VEHICLES IN HOUSEHOLD
51.1/ 100
METRIC RATING
173rd/ 347
METRIC RANK
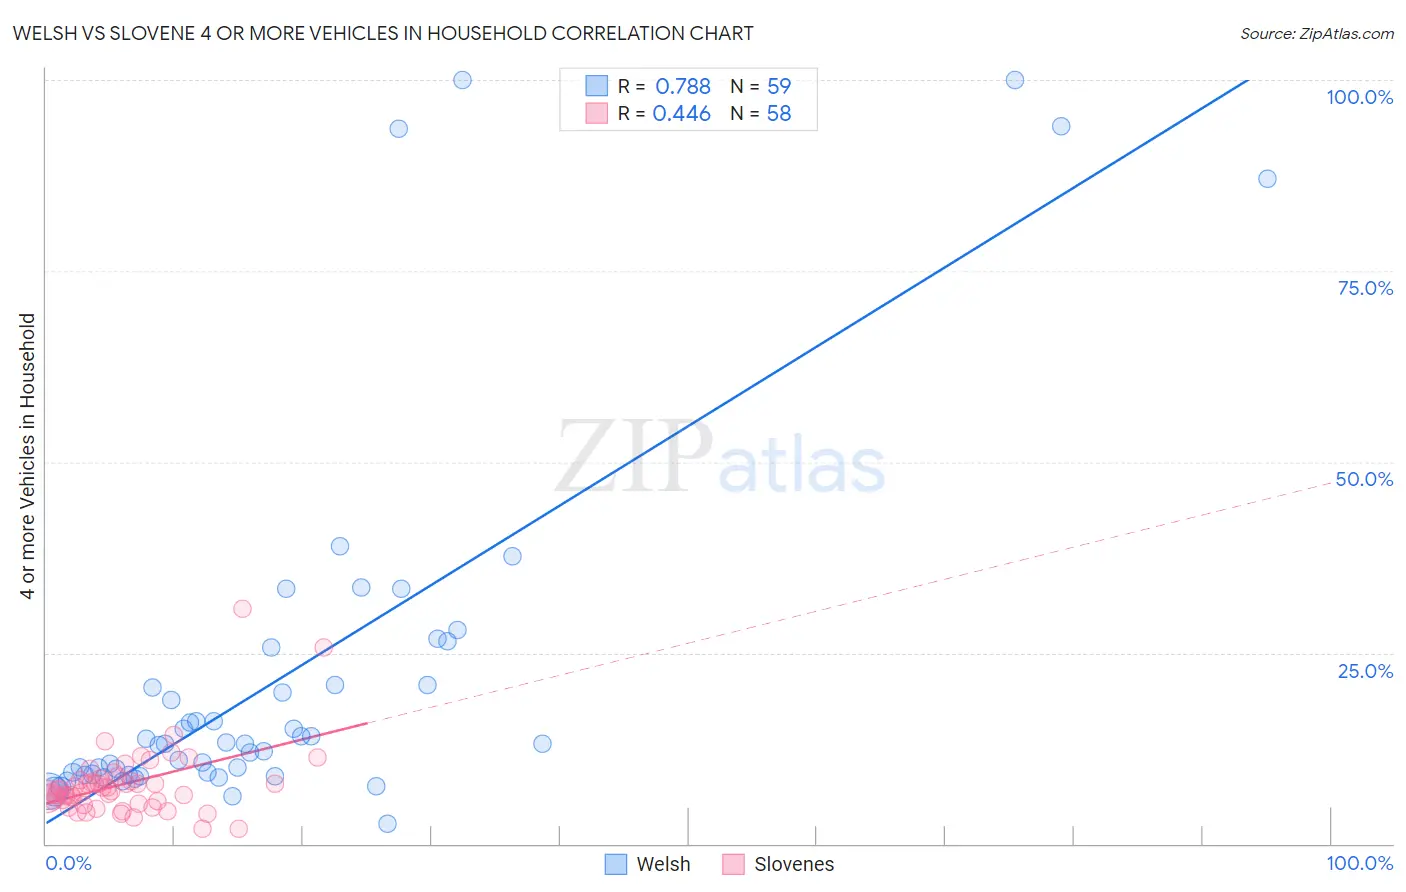
Welsh vs Slovene 4 or more Vehicles in Household Correlation Chart
The statistical analysis conducted on geographies consisting of 526,008,670 people shows a strong positive correlation between the proportion of Welsh and percentage of households with 4 or more vehicles available in the United States with a correlation coefficient (R) of 0.788 and weighted average of 7.5%. Similarly, the statistical analysis conducted on geographies consisting of 260,645,072 people shows a moderate positive correlation between the proportion of Slovenes and percentage of households with 4 or more vehicles available in the United States with a correlation coefficient (R) of 0.446 and weighted average of 6.3%, a difference of 18.4%.
4 or more Vehicles in Household Correlation Summary
| Measurement | Welsh | Slovene |
| Minimum | 2.6% | 2.0% |
| Maximum | 100.0% | 30.8% |
| Range | 97.4% | 28.8% |
| Mean | 21.8% | 7.8% |
| Median | 13.1% | 7.0% |
| Interquartile 25% (IQ1) | 9.1% | 5.5% |
| Interquartile 75% (IQ3) | 20.8% | 8.4% |
| Interquartile Range (IQR) | 11.8% | 2.9% |
| Standard Deviation (Sample) | 24.0% | 4.7% |
| Standard Deviation (Population) | 23.8% | 4.6% |
Similar Demographics by 4 or more Vehicles in Household
Demographics Similar to Welsh by 4 or more Vehicles in Household
In terms of 4 or more vehicles in household, the demographic groups most similar to Welsh are American (7.5%, a difference of 0.36%), Immigrants from Taiwan (7.5%, a difference of 0.37%), German (7.5%, a difference of 0.59%), Scottish (7.4%, a difference of 0.67%), and Immigrants from the Azores (7.5%, a difference of 0.70%).
| Demographics | Rating | Rank | 4 or more Vehicles in Household |
| Europeans | 100.0 /100 | #61 | Exceptional 7.6% |
| Chippewa | 100.0 /100 | #62 | Exceptional 7.6% |
| Immigrants | Micronesia | 100.0 /100 | #63 | Exceptional 7.6% |
| Bangladeshis | 100.0 /100 | #64 | Exceptional 7.6% |
| Immigrants | Azores | 100.0 /100 | #65 | Exceptional 7.5% |
| Immigrants | Taiwan | 99.9 /100 | #66 | Exceptional 7.5% |
| Americans | 99.9 /100 | #67 | Exceptional 7.5% |
| Welsh | 99.9 /100 | #68 | Exceptional 7.5% |
| Germans | 99.9 /100 | #69 | Exceptional 7.5% |
| Scottish | 99.9 /100 | #70 | Exceptional 7.4% |
| Chickasaw | 99.9 /100 | #71 | Exceptional 7.4% |
| Scotch-Irish | 99.9 /100 | #72 | Exceptional 7.4% |
| Portuguese | 99.9 /100 | #73 | Exceptional 7.4% |
| Icelanders | 99.9 /100 | #74 | Exceptional 7.4% |
| Immigrants | Cambodia | 99.9 /100 | #75 | Exceptional 7.4% |
Demographics Similar to Slovenes by 4 or more Vehicles in Household
In terms of 4 or more vehicles in household, the demographic groups most similar to Slovenes are Immigrants from Lebanon (6.3%, a difference of 0.060%), Immigrants from India (6.3%, a difference of 0.080%), Lithuanian (6.3%, a difference of 0.12%), Immigrants from Syria (6.3%, a difference of 0.16%), and Immigrants from Western Europe (6.3%, a difference of 0.24%).
| Demographics | Rating | Rank | 4 or more Vehicles in Household |
| Immigrants | Denmark | 57.8 /100 | #166 | Average 6.4% |
| Poles | 56.9 /100 | #167 | Average 6.4% |
| Lebanese | 55.8 /100 | #168 | Average 6.4% |
| Estonians | 55.1 /100 | #169 | Average 6.4% |
| Immigrants | Syria | 52.8 /100 | #170 | Average 6.3% |
| Immigrants | India | 51.9 /100 | #171 | Average 6.3% |
| Immigrants | Lebanon | 51.7 /100 | #172 | Average 6.3% |
| Slovenes | 51.1 /100 | #173 | Average 6.3% |
| Lithuanians | 50.0 /100 | #174 | Average 6.3% |
| Immigrants | Western Europe | 48.8 /100 | #175 | Average 6.3% |
| Ukrainians | 47.6 /100 | #176 | Average 6.3% |
| Slovaks | 46.9 /100 | #177 | Average 6.3% |
| Belizeans | 44.5 /100 | #178 | Average 6.3% |
| Immigrants | Japan | 43.1 /100 | #179 | Average 6.3% |
| Syrians | 42.0 /100 | #180 | Average 6.3% |