U.S. Virgin Islander vs South American Indian 4 or more Vehicles in Household
COMPARE
U.S. Virgin Islander
South American Indian
4 or more Vehicles in Household
4 or more Vehicles in Household Comparison
U.S. Virgin Islanders
South American Indians
4.6%
4 OR MORE VEHICLES IN HOUSEHOLD
0.0/ 100
METRIC RATING
317th/ 347
METRIC RANK
6.3%
4 OR MORE VEHICLES IN HOUSEHOLD
40.7/ 100
METRIC RATING
182nd/ 347
METRIC RANK
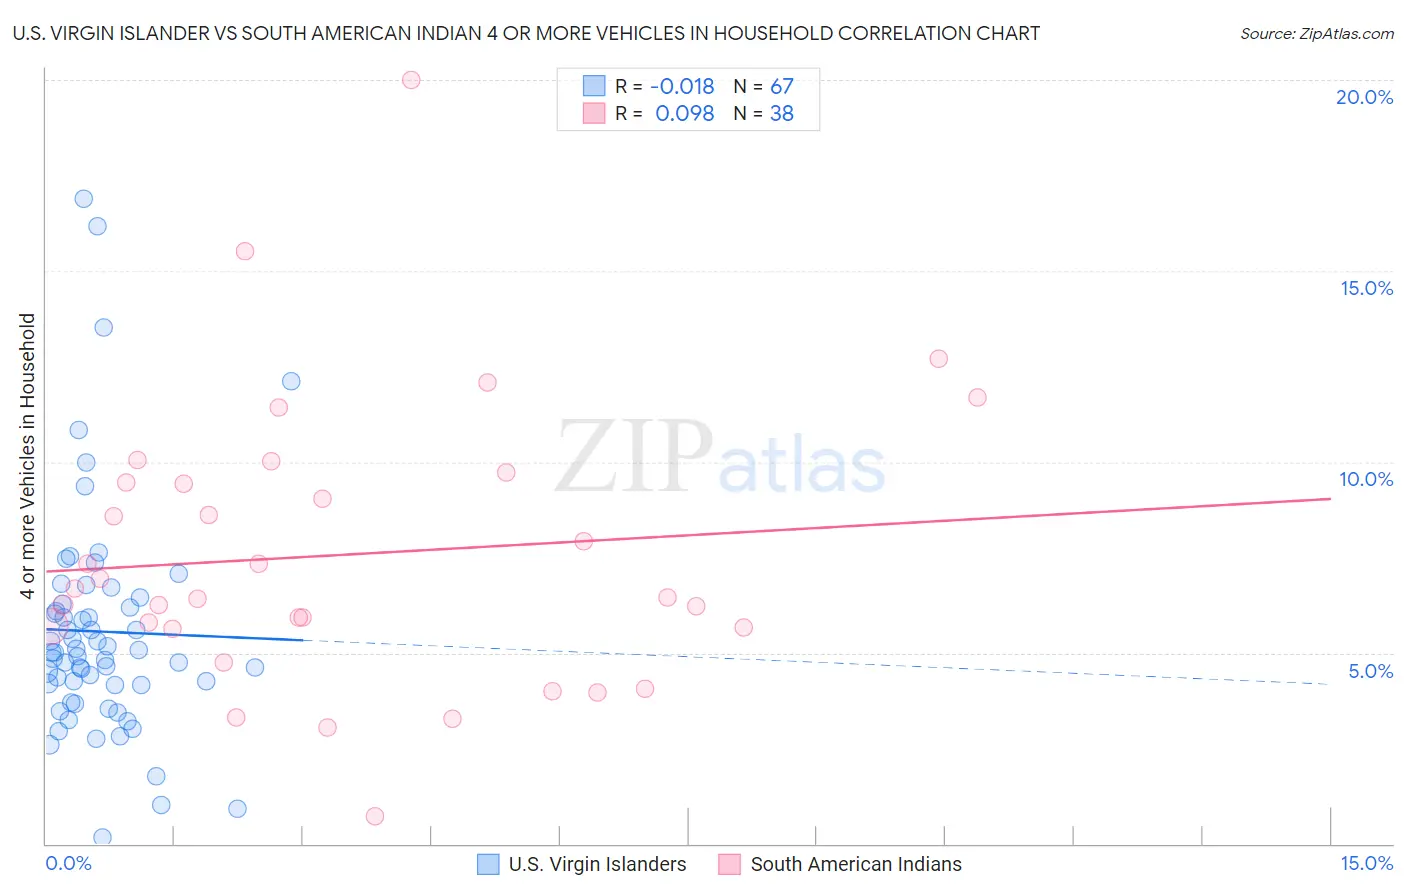
U.S. Virgin Islander vs South American Indian 4 or more Vehicles in Household Correlation Chart
The statistical analysis conducted on geographies consisting of 87,207,044 people shows no correlation between the proportion of U.S. Virgin Islanders and percentage of households with 4 or more vehicles available in the United States with a correlation coefficient (R) of -0.018 and weighted average of 4.6%. Similarly, the statistical analysis conducted on geographies consisting of 163,716,916 people shows a slight positive correlation between the proportion of South American Indians and percentage of households with 4 or more vehicles available in the United States with a correlation coefficient (R) of 0.098 and weighted average of 6.3%, a difference of 34.9%.
4 or more Vehicles in Household Correlation Summary
| Measurement | U.S. Virgin Islander | South American Indian |
| Minimum | 0.17% | 0.72% |
| Maximum | 16.9% | 20.0% |
| Range | 16.7% | 19.3% |
| Mean | 5.6% | 7.6% |
| Median | 5.0% | 6.6% |
| Interquartile 25% (IQ1) | 4.2% | 5.7% |
| Interquartile 75% (IQ3) | 6.3% | 9.5% |
| Interquartile Range (IQR) | 2.1% | 3.8% |
| Standard Deviation (Sample) | 3.0% | 3.7% |
| Standard Deviation (Population) | 3.0% | 3.6% |
Similar Demographics by 4 or more Vehicles in Household
Demographics Similar to U.S. Virgin Islanders by 4 or more Vehicles in Household
In terms of 4 or more vehicles in household, the demographic groups most similar to U.S. Virgin Islanders are Jamaican (4.6%, a difference of 0.24%), Haitian (4.6%, a difference of 0.89%), Puerto Rican (4.7%, a difference of 1.7%), Immigrants from Belarus (4.7%, a difference of 2.1%), and Immigrants from West Indies (4.7%, a difference of 2.2%).
| Demographics | Rating | Rank | 4 or more Vehicles in Household |
| Moroccans | 0.0 /100 | #310 | Tragic 4.9% |
| Houma | 0.0 /100 | #311 | Tragic 4.9% |
| Albanians | 0.0 /100 | #312 | Tragic 4.8% |
| Immigrants | Israel | 0.0 /100 | #313 | Tragic 4.8% |
| Immigrants | West Indies | 0.0 /100 | #314 | Tragic 4.7% |
| Immigrants | Belarus | 0.0 /100 | #315 | Tragic 4.7% |
| Puerto Ricans | 0.0 /100 | #316 | Tragic 4.7% |
| U.S. Virgin Islanders | 0.0 /100 | #317 | Tragic 4.6% |
| Jamaicans | 0.0 /100 | #318 | Tragic 4.6% |
| Haitians | 0.0 /100 | #319 | Tragic 4.6% |
| Immigrants | Haiti | 0.0 /100 | #320 | Tragic 4.5% |
| Ecuadorians | 0.0 /100 | #321 | Tragic 4.5% |
| Immigrants | Yemen | 0.0 /100 | #322 | Tragic 4.5% |
| Immigrants | Caribbean | 0.0 /100 | #323 | Tragic 4.4% |
| Soviet Union | 0.0 /100 | #324 | Tragic 4.4% |
Demographics Similar to South American Indians by 4 or more Vehicles in Household
In terms of 4 or more vehicles in household, the demographic groups most similar to South American Indians are Yugoslavian (6.3%, a difference of 0.050%), Syrian (6.3%, a difference of 0.14%), Immigrants from Japan (6.3%, a difference of 0.25%), Immigrants from Burma/Myanmar (6.2%, a difference of 0.34%), and Iraqi (6.2%, a difference of 0.36%).
| Demographics | Rating | Rank | 4 or more Vehicles in Household |
| Immigrants | Western Europe | 48.8 /100 | #175 | Average 6.3% |
| Ukrainians | 47.6 /100 | #176 | Average 6.3% |
| Slovaks | 46.9 /100 | #177 | Average 6.3% |
| Belizeans | 44.5 /100 | #178 | Average 6.3% |
| Immigrants | Japan | 43.1 /100 | #179 | Average 6.3% |
| Syrians | 42.0 /100 | #180 | Average 6.3% |
| Yugoslavians | 41.1 /100 | #181 | Average 6.3% |
| South American Indians | 40.7 /100 | #182 | Average 6.3% |
| Immigrants | Burma/Myanmar | 37.5 /100 | #183 | Fair 6.2% |
| Iraqis | 37.3 /100 | #184 | Fair 6.2% |
| Thais | 36.9 /100 | #185 | Fair 6.2% |
| Immigrants | Northern Europe | 36.8 /100 | #186 | Fair 6.2% |
| Immigrants | South Africa | 35.4 /100 | #187 | Fair 6.2% |
| Kiowa | 34.7 /100 | #188 | Fair 6.2% |
| Immigrants | Eastern Asia | 33.3 /100 | #189 | Fair 6.2% |