U.S. Virgin Islander vs Immigrants from Hong Kong 4 or more Vehicles in Household
COMPARE
U.S. Virgin Islander
Immigrants from Hong Kong
4 or more Vehicles in Household
4 or more Vehicles in Household Comparison
U.S. Virgin Islanders
Immigrants from Hong Kong
4.6%
4 OR MORE VEHICLES IN HOUSEHOLD
0.0/ 100
METRIC RATING
317th/ 347
METRIC RANK
6.5%
4 OR MORE VEHICLES IN HOUSEHOLD
72.2/ 100
METRIC RATING
151st/ 347
METRIC RANK
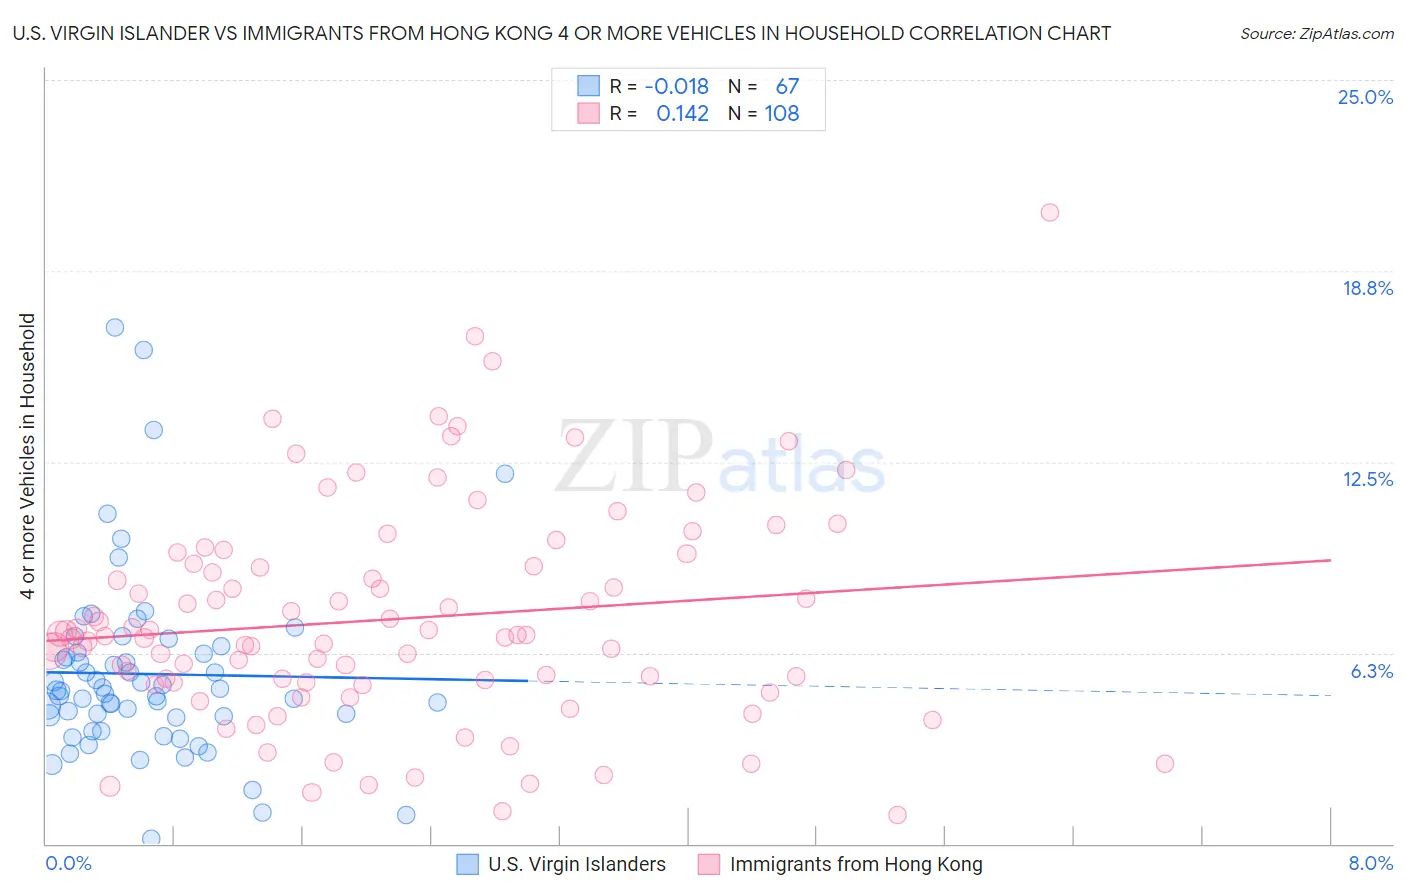
U.S. Virgin Islander vs Immigrants from Hong Kong 4 or more Vehicles in Household Correlation Chart
The statistical analysis conducted on geographies consisting of 87,207,044 people shows no correlation between the proportion of U.S. Virgin Islanders and percentage of households with 4 or more vehicles available in the United States with a correlation coefficient (R) of -0.018 and weighted average of 4.6%. Similarly, the statistical analysis conducted on geographies consisting of 252,698,345 people shows a poor positive correlation between the proportion of Immigrants from Hong Kong and percentage of households with 4 or more vehicles available in the United States with a correlation coefficient (R) of 0.142 and weighted average of 6.5%, a difference of 39.5%.
4 or more Vehicles in Household Correlation Summary
| Measurement | U.S. Virgin Islander | Immigrants from Hong Kong |
| Minimum | 0.17% | 0.93% |
| Maximum | 16.9% | 20.7% |
| Range | 16.7% | 19.7% |
| Mean | 5.6% | 7.3% |
| Median | 5.0% | 6.8% |
| Interquartile 25% (IQ1) | 4.2% | 5.3% |
| Interquartile 75% (IQ3) | 6.3% | 9.1% |
| Interquartile Range (IQR) | 2.1% | 3.9% |
| Standard Deviation (Sample) | 3.0% | 3.5% |
| Standard Deviation (Population) | 3.0% | 3.5% |
Similar Demographics by 4 or more Vehicles in Household
Demographics Similar to U.S. Virgin Islanders by 4 or more Vehicles in Household
In terms of 4 or more vehicles in household, the demographic groups most similar to U.S. Virgin Islanders are Jamaican (4.6%, a difference of 0.24%), Haitian (4.6%, a difference of 0.89%), Puerto Rican (4.7%, a difference of 1.7%), Immigrants from Belarus (4.7%, a difference of 2.1%), and Immigrants from West Indies (4.7%, a difference of 2.2%).
| Demographics | Rating | Rank | 4 or more Vehicles in Household |
| Moroccans | 0.0 /100 | #310 | Tragic 4.9% |
| Houma | 0.0 /100 | #311 | Tragic 4.9% |
| Albanians | 0.0 /100 | #312 | Tragic 4.8% |
| Immigrants | Israel | 0.0 /100 | #313 | Tragic 4.8% |
| Immigrants | West Indies | 0.0 /100 | #314 | Tragic 4.7% |
| Immigrants | Belarus | 0.0 /100 | #315 | Tragic 4.7% |
| Puerto Ricans | 0.0 /100 | #316 | Tragic 4.7% |
| U.S. Virgin Islanders | 0.0 /100 | #317 | Tragic 4.6% |
| Jamaicans | 0.0 /100 | #318 | Tragic 4.6% |
| Haitians | 0.0 /100 | #319 | Tragic 4.6% |
| Immigrants | Haiti | 0.0 /100 | #320 | Tragic 4.5% |
| Ecuadorians | 0.0 /100 | #321 | Tragic 4.5% |
| Immigrants | Yemen | 0.0 /100 | #322 | Tragic 4.5% |
| Immigrants | Caribbean | 0.0 /100 | #323 | Tragic 4.4% |
| Soviet Union | 0.0 /100 | #324 | Tragic 4.4% |
Demographics Similar to Immigrants from Hong Kong by 4 or more Vehicles in Household
In terms of 4 or more vehicles in household, the demographic groups most similar to Immigrants from Hong Kong are Yuman (6.5%, a difference of 0.010%), Immigrants from Armenia (6.5%, a difference of 0.13%), New Zealander (6.5%, a difference of 0.14%), Central American Indian (6.5%, a difference of 0.14%), and Immigrants from Jordan (6.5%, a difference of 0.18%).
| Demographics | Rating | Rank | 4 or more Vehicles in Household |
| Immigrants | North America | 78.5 /100 | #144 | Good 6.5% |
| Croatians | 77.8 /100 | #145 | Good 6.5% |
| Immigrants | Costa Rica | 74.4 /100 | #146 | Good 6.5% |
| Immigrants | Iran | 73.9 /100 | #147 | Good 6.5% |
| Immigrants | Jordan | 73.7 /100 | #148 | Good 6.5% |
| Greeks | 73.6 /100 | #149 | Good 6.5% |
| New Zealanders | 73.3 /100 | #150 | Good 6.5% |
| Immigrants | Hong Kong | 72.2 /100 | #151 | Good 6.5% |
| Yuman | 72.1 /100 | #152 | Good 6.5% |
| Immigrants | Armenia | 71.2 /100 | #153 | Good 6.5% |
| Central American Indians | 71.1 /100 | #154 | Good 6.5% |
| Iroquois | 70.4 /100 | #155 | Good 6.5% |
| Iranians | 69.9 /100 | #156 | Good 6.5% |
| Peruvians | 69.4 /100 | #157 | Good 6.5% |
| Zimbabweans | 67.1 /100 | #158 | Good 6.4% |