U.S. Virgin Islander vs Immigrants from Laos 4 or more Vehicles in Household
COMPARE
U.S. Virgin Islander
Immigrants from Laos
4 or more Vehicles in Household
4 or more Vehicles in Household Comparison
U.S. Virgin Islanders
Immigrants from Laos
4.6%
4 OR MORE VEHICLES IN HOUSEHOLD
0.0/ 100
METRIC RATING
317th/ 347
METRIC RANK
7.7%
4 OR MORE VEHICLES IN HOUSEHOLD
100.0/ 100
METRIC RATING
51st/ 347
METRIC RANK
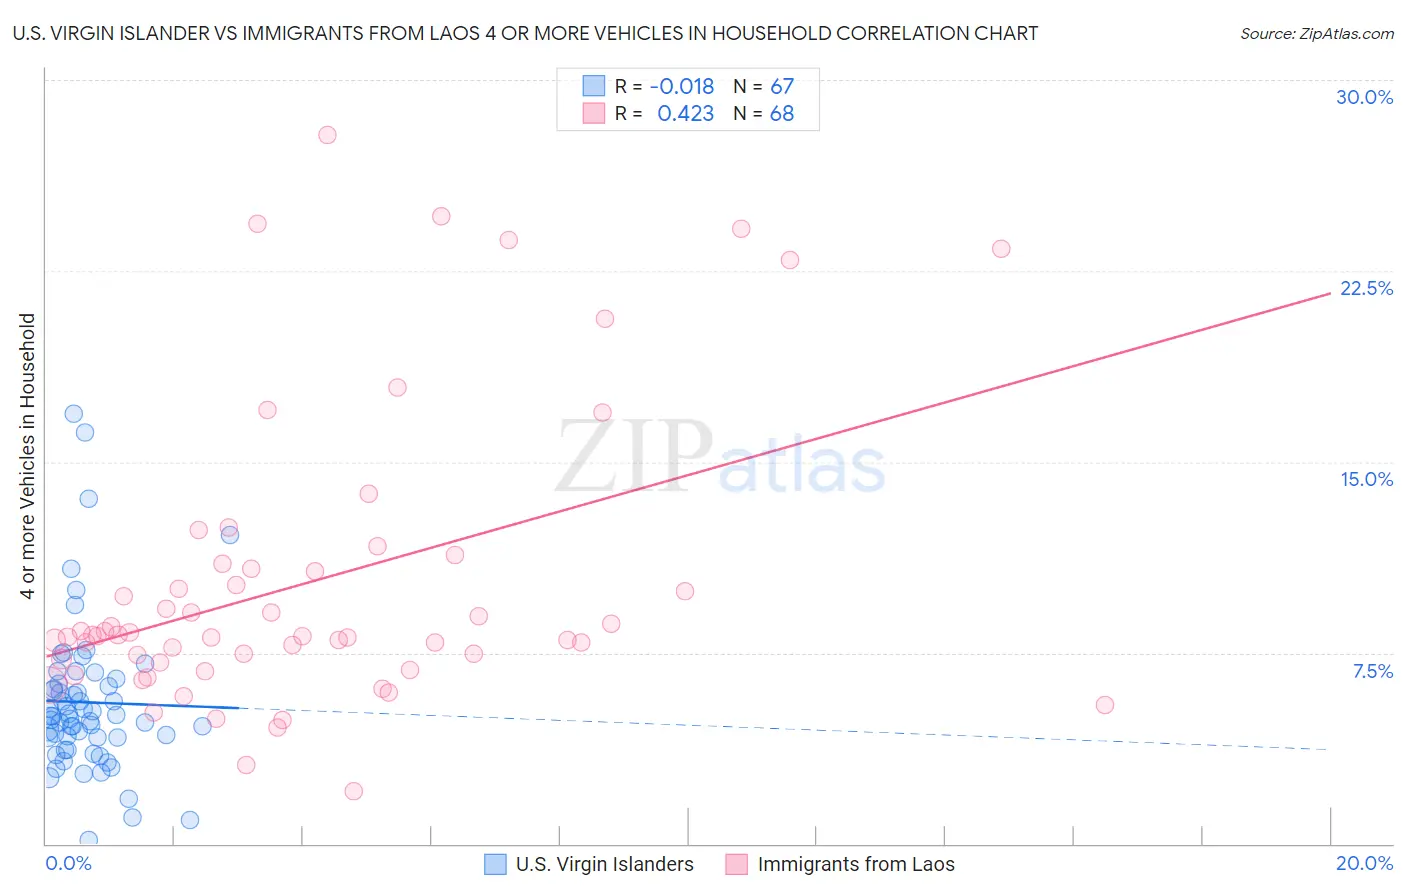
U.S. Virgin Islander vs Immigrants from Laos 4 or more Vehicles in Household Correlation Chart
The statistical analysis conducted on geographies consisting of 87,207,044 people shows no correlation between the proportion of U.S. Virgin Islanders and percentage of households with 4 or more vehicles available in the United States with a correlation coefficient (R) of -0.018 and weighted average of 4.6%. Similarly, the statistical analysis conducted on geographies consisting of 201,310,160 people shows a moderate positive correlation between the proportion of Immigrants from Laos and percentage of households with 4 or more vehicles available in the United States with a correlation coefficient (R) of 0.423 and weighted average of 7.7%, a difference of 65.9%.
4 or more Vehicles in Household Correlation Summary
| Measurement | U.S. Virgin Islander | Immigrants from Laos |
| Minimum | 0.17% | 2.1% |
| Maximum | 16.9% | 27.9% |
| Range | 16.7% | 25.8% |
| Mean | 5.6% | 10.3% |
| Median | 5.0% | 8.2% |
| Interquartile 25% (IQ1) | 4.2% | 7.2% |
| Interquartile 75% (IQ3) | 6.3% | 10.9% |
| Interquartile Range (IQR) | 2.1% | 3.7% |
| Standard Deviation (Sample) | 3.0% | 5.8% |
| Standard Deviation (Population) | 3.0% | 5.7% |
Similar Demographics by 4 or more Vehicles in Household
Demographics Similar to U.S. Virgin Islanders by 4 or more Vehicles in Household
In terms of 4 or more vehicles in household, the demographic groups most similar to U.S. Virgin Islanders are Jamaican (4.6%, a difference of 0.24%), Haitian (4.6%, a difference of 0.89%), Puerto Rican (4.7%, a difference of 1.7%), Immigrants from Belarus (4.7%, a difference of 2.1%), and Immigrants from West Indies (4.7%, a difference of 2.2%).
| Demographics | Rating | Rank | 4 or more Vehicles in Household |
| Moroccans | 0.0 /100 | #310 | Tragic 4.9% |
| Houma | 0.0 /100 | #311 | Tragic 4.9% |
| Albanians | 0.0 /100 | #312 | Tragic 4.8% |
| Immigrants | Israel | 0.0 /100 | #313 | Tragic 4.8% |
| Immigrants | West Indies | 0.0 /100 | #314 | Tragic 4.7% |
| Immigrants | Belarus | 0.0 /100 | #315 | Tragic 4.7% |
| Puerto Ricans | 0.0 /100 | #316 | Tragic 4.7% |
| U.S. Virgin Islanders | 0.0 /100 | #317 | Tragic 4.6% |
| Jamaicans | 0.0 /100 | #318 | Tragic 4.6% |
| Haitians | 0.0 /100 | #319 | Tragic 4.6% |
| Immigrants | Haiti | 0.0 /100 | #320 | Tragic 4.5% |
| Ecuadorians | 0.0 /100 | #321 | Tragic 4.5% |
| Immigrants | Yemen | 0.0 /100 | #322 | Tragic 4.5% |
| Immigrants | Caribbean | 0.0 /100 | #323 | Tragic 4.4% |
| Soviet Union | 0.0 /100 | #324 | Tragic 4.4% |
Demographics Similar to Immigrants from Laos by 4 or more Vehicles in Household
In terms of 4 or more vehicles in household, the demographic groups most similar to Immigrants from Laos are Japanese (7.7%, a difference of 0.12%), Immigrants from El Salvador (7.7%, a difference of 0.35%), Malaysian (7.7%, a difference of 0.50%), Cherokee (7.7%, a difference of 0.51%), and Dutch (7.7%, a difference of 0.58%).
| Demographics | Rating | Rank | 4 or more Vehicles in Household |
| Bhutanese | 100.0 /100 | #44 | Exceptional 7.8% |
| Choctaw | 100.0 /100 | #45 | Exceptional 7.8% |
| Crow | 100.0 /100 | #46 | Exceptional 7.8% |
| Osage | 100.0 /100 | #47 | Exceptional 7.8% |
| Swiss | 100.0 /100 | #48 | Exceptional 7.8% |
| Cherokee | 100.0 /100 | #49 | Exceptional 7.7% |
| Immigrants | El Salvador | 100.0 /100 | #50 | Exceptional 7.7% |
| Immigrants | Laos | 100.0 /100 | #51 | Exceptional 7.7% |
| Japanese | 100.0 /100 | #52 | Exceptional 7.7% |
| Malaysians | 100.0 /100 | #53 | Exceptional 7.7% |
| Dutch | 100.0 /100 | #54 | Exceptional 7.7% |
| Immigrants | Oceania | 100.0 /100 | #55 | Exceptional 7.6% |
| English | 100.0 /100 | #56 | Exceptional 7.6% |
| Pennsylvania Germans | 100.0 /100 | #57 | Exceptional 7.6% |
| Swedes | 100.0 /100 | #58 | Exceptional 7.6% |