U.S. Virgin Islander vs South American Indian In Labor Force | Age 45-54
COMPARE
U.S. Virgin Islander
South American Indian
In Labor Force | Age 45-54
In Labor Force | Age 45-54 Comparison
U.S. Virgin Islanders
South American Indians
81.2%
IN LABOR FORCE | AGE 45-54
0.0/ 100
METRIC RATING
276th/ 347
METRIC RANK
82.9%
IN LABOR FORCE | AGE 45-54
62.2/ 100
METRIC RATING
161st/ 347
METRIC RANK
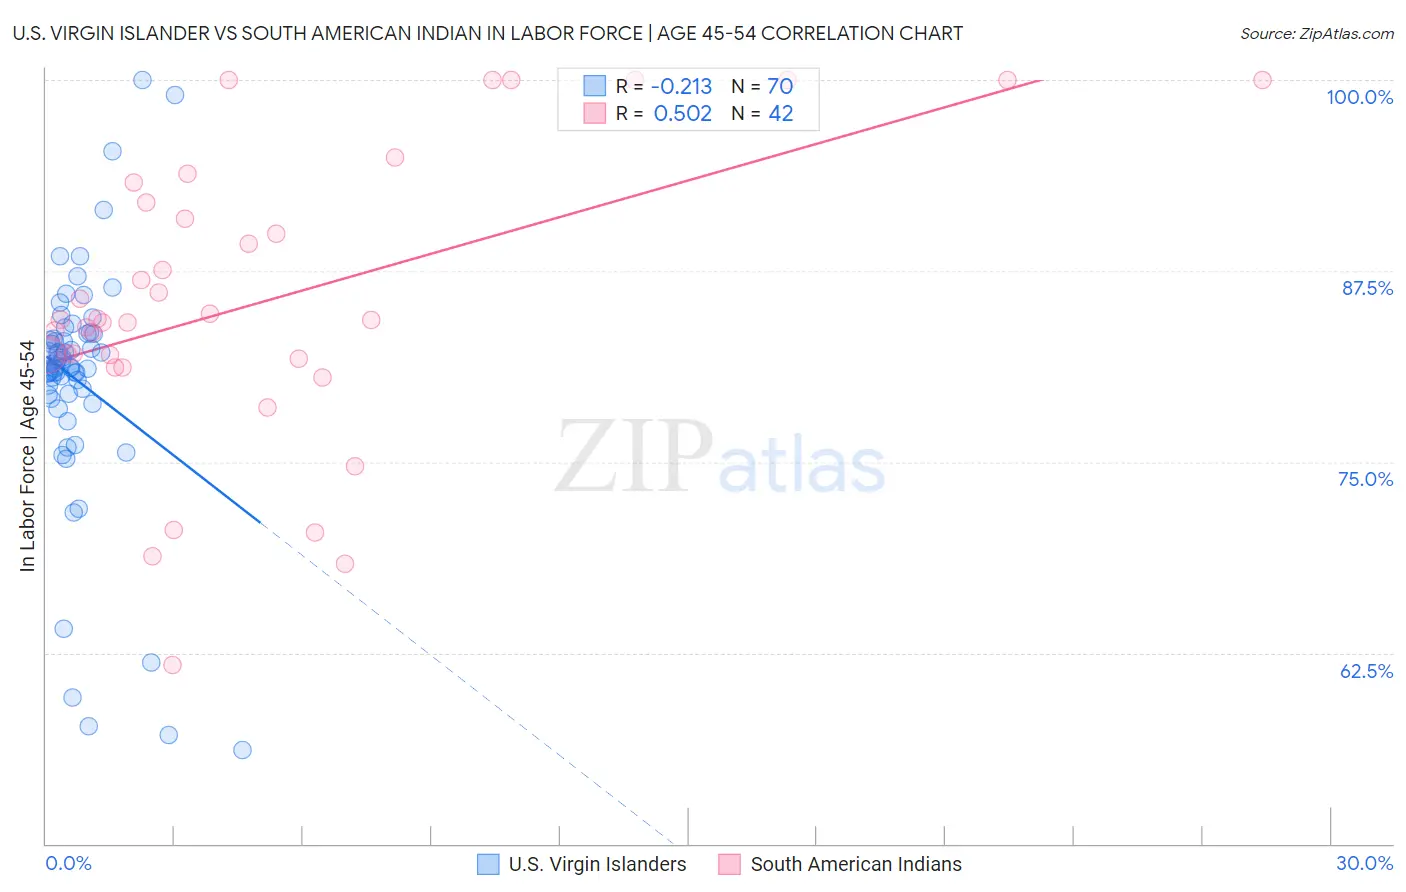
U.S. Virgin Islander vs South American Indian In Labor Force | Age 45-54 Correlation Chart
The statistical analysis conducted on geographies consisting of 87,510,116 people shows a weak negative correlation between the proportion of U.S. Virgin Islanders and labor force participation rate among population between the ages 45 and 54 in the United States with a correlation coefficient (R) of -0.213 and weighted average of 81.2%. Similarly, the statistical analysis conducted on geographies consisting of 164,535,706 people shows a substantial positive correlation between the proportion of South American Indians and labor force participation rate among population between the ages 45 and 54 in the United States with a correlation coefficient (R) of 0.502 and weighted average of 82.9%, a difference of 2.0%.
In Labor Force | Age 45-54 Correlation Summary
| Measurement | U.S. Virgin Islander | South American Indian |
| Minimum | 56.1% | 61.7% |
| Maximum | 100.0% | 100.0% |
| Range | 43.9% | 38.3% |
| Mean | 80.3% | 85.5% |
| Median | 81.2% | 84.3% |
| Interquartile 25% (IQ1) | 79.4% | 81.7% |
| Interquartile 75% (IQ3) | 83.4% | 91.9% |
| Interquartile Range (IQR) | 4.0% | 10.2% |
| Standard Deviation (Sample) | 8.1% | 9.5% |
| Standard Deviation (Population) | 8.0% | 9.4% |
Similar Demographics by In Labor Force | Age 45-54
Demographics Similar to U.S. Virgin Islanders by In Labor Force | Age 45-54
In terms of in labor force | age 45-54, the demographic groups most similar to U.S. Virgin Islanders are Guatemalan (81.2%, a difference of 0.020%), Nonimmigrants (81.2%, a difference of 0.040%), British West Indian (81.2%, a difference of 0.050%), Chippewa (81.3%, a difference of 0.090%), and Immigrants from Guatemala (81.1%, a difference of 0.10%).
| Demographics | Rating | Rank | In Labor Force | Age 45-54 |
| Alsatians | 0.0 /100 | #269 | Tragic 81.3% |
| Bangladeshis | 0.0 /100 | #270 | Tragic 81.3% |
| Immigrants | Barbados | 0.0 /100 | #271 | Tragic 81.3% |
| Spanish | 0.0 /100 | #272 | Tragic 81.3% |
| Chippewa | 0.0 /100 | #273 | Tragic 81.3% |
| British West Indians | 0.0 /100 | #274 | Tragic 81.2% |
| Immigrants | Nonimmigrants | 0.0 /100 | #275 | Tragic 81.2% |
| U.S. Virgin Islanders | 0.0 /100 | #276 | Tragic 81.2% |
| Guatemalans | 0.0 /100 | #277 | Tragic 81.2% |
| Immigrants | Guatemala | 0.0 /100 | #278 | Tragic 81.1% |
| Immigrants | Micronesia | 0.0 /100 | #279 | Tragic 81.1% |
| Immigrants | Latin America | 0.0 /100 | #280 | Tragic 81.0% |
| Immigrants | Grenada | 0.0 /100 | #281 | Tragic 81.0% |
| Aleuts | 0.0 /100 | #282 | Tragic 81.0% |
| French American Indians | 0.0 /100 | #283 | Tragic 80.8% |
Demographics Similar to South American Indians by In Labor Force | Age 45-54
In terms of in labor force | age 45-54, the demographic groups most similar to South American Indians are Haitian (82.8%, a difference of 0.0%), Dutch (82.8%, a difference of 0.0%), Laotian (82.9%, a difference of 0.010%), German Russian (82.8%, a difference of 0.010%), and Immigrants from Austria (82.9%, a difference of 0.020%).
| Demographics | Rating | Rank | In Labor Force | Age 45-54 |
| Immigrants | Ghana | 70.3 /100 | #154 | Good 82.9% |
| Immigrants | Philippines | 69.0 /100 | #155 | Good 82.9% |
| Immigrants | Saudi Arabia | 68.8 /100 | #156 | Good 82.9% |
| Immigrants | Australia | 68.2 /100 | #157 | Good 82.9% |
| Immigrants | Southern Europe | 67.8 /100 | #158 | Good 82.9% |
| Immigrants | Austria | 64.6 /100 | #159 | Good 82.9% |
| Laotians | 62.8 /100 | #160 | Good 82.9% |
| South American Indians | 62.2 /100 | #161 | Good 82.9% |
| Haitians | 61.8 /100 | #162 | Good 82.8% |
| Dutch | 61.7 /100 | #163 | Good 82.8% |
| German Russians | 61.3 /100 | #164 | Good 82.8% |
| Immigrants | Sudan | 59.9 /100 | #165 | Average 82.8% |
| Immigrants | South Eastern Asia | 57.4 /100 | #166 | Average 82.8% |
| Swiss | 56.5 /100 | #167 | Average 82.8% |
| Immigrants | South Africa | 55.8 /100 | #168 | Average 82.8% |