Israeli vs South American Indian 4 or more Vehicles in Household
COMPARE
Israeli
South American Indian
4 or more Vehicles in Household
4 or more Vehicles in Household Comparison
Israelis
South American Indians
5.2%
4 OR MORE VEHICLES IN HOUSEHOLD
0.1/ 100
METRIC RATING
296th/ 347
METRIC RANK
6.3%
4 OR MORE VEHICLES IN HOUSEHOLD
40.7/ 100
METRIC RATING
182nd/ 347
METRIC RANK
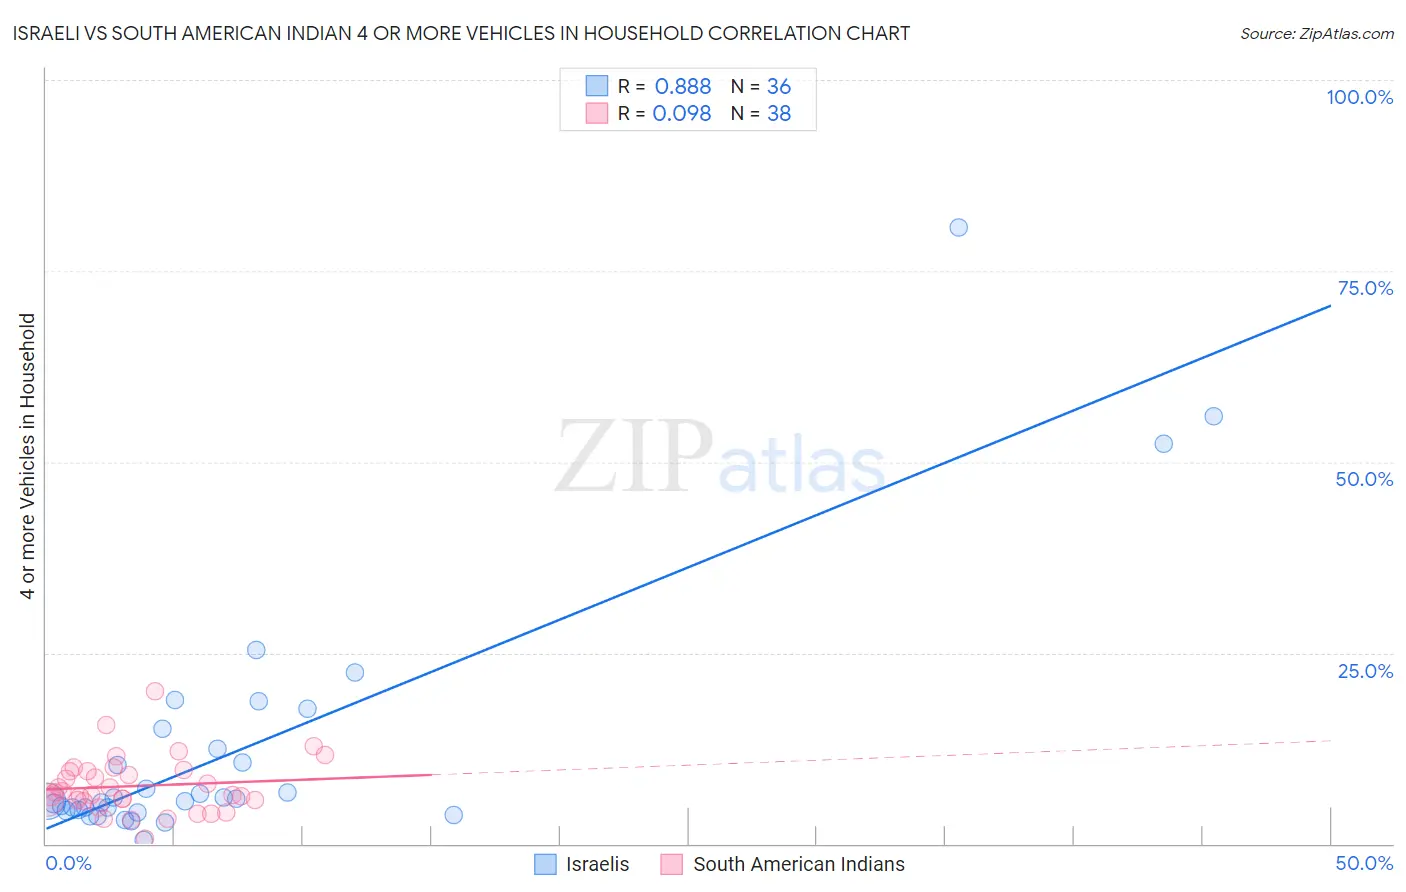
Israeli vs South American Indian 4 or more Vehicles in Household Correlation Chart
The statistical analysis conducted on geographies consisting of 209,765,898 people shows a very strong positive correlation between the proportion of Israelis and percentage of households with 4 or more vehicles available in the United States with a correlation coefficient (R) of 0.888 and weighted average of 5.2%. Similarly, the statistical analysis conducted on geographies consisting of 163,716,916 people shows a slight positive correlation between the proportion of South American Indians and percentage of households with 4 or more vehicles available in the United States with a correlation coefficient (R) of 0.098 and weighted average of 6.3%, a difference of 19.8%.
4 or more Vehicles in Household Correlation Summary
| Measurement | Israeli | South American Indian |
| Minimum | 0.51% | 0.72% |
| Maximum | 80.8% | 20.0% |
| Range | 80.3% | 19.3% |
| Mean | 12.6% | 7.6% |
| Median | 5.7% | 6.6% |
| Interquartile 25% (IQ1) | 4.4% | 5.7% |
| Interquartile 75% (IQ3) | 13.7% | 9.5% |
| Interquartile Range (IQR) | 9.3% | 3.8% |
| Standard Deviation (Sample) | 16.9% | 3.7% |
| Standard Deviation (Population) | 16.7% | 3.6% |
Similar Demographics by 4 or more Vehicles in Household
Demographics Similar to Israelis by 4 or more Vehicles in Household
In terms of 4 or more vehicles in household, the demographic groups most similar to Israelis are Immigrants from Brazil (5.2%, a difference of 0.18%), Ghanaian (5.2%, a difference of 0.29%), Immigrants from Venezuela (5.2%, a difference of 0.29%), Immigrants from Congo (5.2%, a difference of 0.35%), and Liberian (5.3%, a difference of 0.38%).
| Demographics | Rating | Rank | 4 or more Vehicles in Household |
| Immigrants | Bosnia and Herzegovina | 0.2 /100 | #289 | Tragic 5.3% |
| Immigrants | Russia | 0.2 /100 | #290 | Tragic 5.3% |
| Immigrants | Bahamas | 0.1 /100 | #291 | Tragic 5.3% |
| Liberians | 0.1 /100 | #292 | Tragic 5.3% |
| Immigrants | Congo | 0.1 /100 | #293 | Tragic 5.2% |
| Ghanaians | 0.1 /100 | #294 | Tragic 5.2% |
| Immigrants | Brazil | 0.1 /100 | #295 | Tragic 5.2% |
| Israelis | 0.1 /100 | #296 | Tragic 5.2% |
| Immigrants | Venezuela | 0.1 /100 | #297 | Tragic 5.2% |
| Immigrants | South America | 0.1 /100 | #298 | Tragic 5.2% |
| Immigrants | Ghana | 0.1 /100 | #299 | Tragic 5.2% |
| Immigrants | Morocco | 0.0 /100 | #300 | Tragic 5.1% |
| Immigrants | Zaire | 0.0 /100 | #301 | Tragic 5.1% |
| Bahamians | 0.0 /100 | #302 | Tragic 5.1% |
| Immigrants | Greece | 0.0 /100 | #303 | Tragic 5.1% |
Demographics Similar to South American Indians by 4 or more Vehicles in Household
In terms of 4 or more vehicles in household, the demographic groups most similar to South American Indians are Yugoslavian (6.3%, a difference of 0.050%), Syrian (6.3%, a difference of 0.14%), Immigrants from Japan (6.3%, a difference of 0.25%), Immigrants from Burma/Myanmar (6.2%, a difference of 0.34%), and Iraqi (6.2%, a difference of 0.36%).
| Demographics | Rating | Rank | 4 or more Vehicles in Household |
| Immigrants | Western Europe | 48.8 /100 | #175 | Average 6.3% |
| Ukrainians | 47.6 /100 | #176 | Average 6.3% |
| Slovaks | 46.9 /100 | #177 | Average 6.3% |
| Belizeans | 44.5 /100 | #178 | Average 6.3% |
| Immigrants | Japan | 43.1 /100 | #179 | Average 6.3% |
| Syrians | 42.0 /100 | #180 | Average 6.3% |
| Yugoslavians | 41.1 /100 | #181 | Average 6.3% |
| South American Indians | 40.7 /100 | #182 | Average 6.3% |
| Immigrants | Burma/Myanmar | 37.5 /100 | #183 | Fair 6.2% |
| Iraqis | 37.3 /100 | #184 | Fair 6.2% |
| Thais | 36.9 /100 | #185 | Fair 6.2% |
| Immigrants | Northern Europe | 36.8 /100 | #186 | Fair 6.2% |
| Immigrants | South Africa | 35.4 /100 | #187 | Fair 6.2% |
| Kiowa | 34.7 /100 | #188 | Fair 6.2% |
| Immigrants | Eastern Asia | 33.3 /100 | #189 | Fair 6.2% |