U.S. Virgin Islander vs Arab 4 or more Vehicles in Household
COMPARE
U.S. Virgin Islander
Arab
4 or more Vehicles in Household
4 or more Vehicles in Household Comparison
U.S. Virgin Islanders
Arabs
4.6%
4 OR MORE VEHICLES IN HOUSEHOLD
0.0/ 100
METRIC RATING
317th/ 347
METRIC RANK
6.0%
4 OR MORE VEHICLES IN HOUSEHOLD
14.4/ 100
METRIC RATING
213th/ 347
METRIC RANK
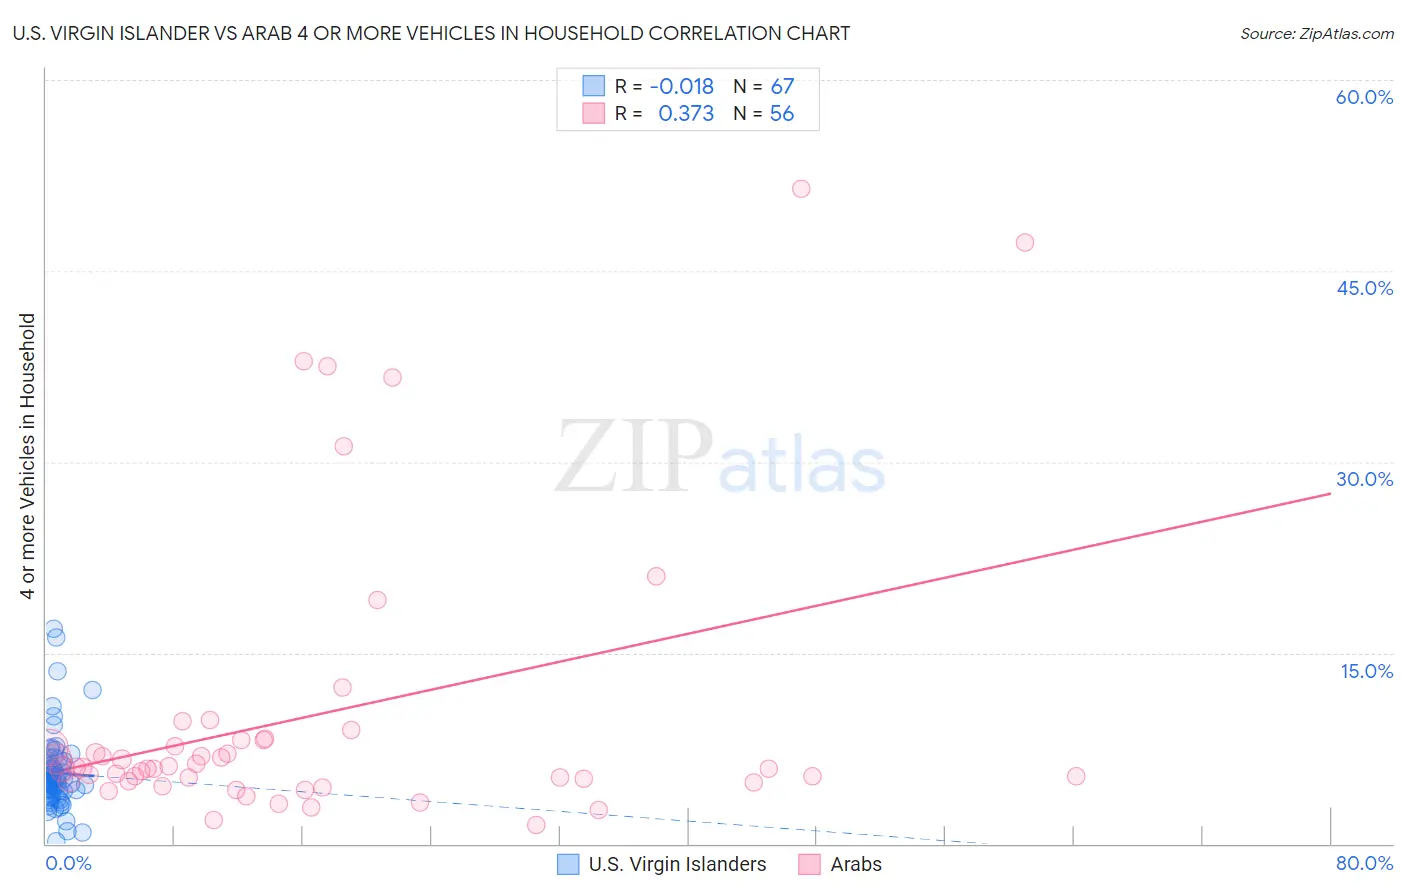
U.S. Virgin Islander vs Arab 4 or more Vehicles in Household Correlation Chart
The statistical analysis conducted on geographies consisting of 87,207,044 people shows no correlation between the proportion of U.S. Virgin Islanders and percentage of households with 4 or more vehicles available in the United States with a correlation coefficient (R) of -0.018 and weighted average of 4.6%. Similarly, the statistical analysis conducted on geographies consisting of 484,302,602 people shows a mild positive correlation between the proportion of Arabs and percentage of households with 4 or more vehicles available in the United States with a correlation coefficient (R) of 0.373 and weighted average of 6.0%, a difference of 30.1%.
4 or more Vehicles in Household Correlation Summary
| Measurement | U.S. Virgin Islander | Arab |
| Minimum | 0.17% | 1.5% |
| Maximum | 16.9% | 51.4% |
| Range | 16.7% | 50.0% |
| Mean | 5.6% | 10.0% |
| Median | 5.0% | 5.9% |
| Interquartile 25% (IQ1) | 4.2% | 4.9% |
| Interquartile 75% (IQ3) | 6.3% | 8.1% |
| Interquartile Range (IQR) | 2.1% | 3.2% |
| Standard Deviation (Sample) | 3.0% | 11.3% |
| Standard Deviation (Population) | 3.0% | 11.2% |
Similar Demographics by 4 or more Vehicles in Household
Demographics Similar to U.S. Virgin Islanders by 4 or more Vehicles in Household
In terms of 4 or more vehicles in household, the demographic groups most similar to U.S. Virgin Islanders are Jamaican (4.6%, a difference of 0.24%), Haitian (4.6%, a difference of 0.89%), Puerto Rican (4.7%, a difference of 1.7%), Immigrants from Belarus (4.7%, a difference of 2.1%), and Immigrants from West Indies (4.7%, a difference of 2.2%).
| Demographics | Rating | Rank | 4 or more Vehicles in Household |
| Moroccans | 0.0 /100 | #310 | Tragic 4.9% |
| Houma | 0.0 /100 | #311 | Tragic 4.9% |
| Albanians | 0.0 /100 | #312 | Tragic 4.8% |
| Immigrants | Israel | 0.0 /100 | #313 | Tragic 4.8% |
| Immigrants | West Indies | 0.0 /100 | #314 | Tragic 4.7% |
| Immigrants | Belarus | 0.0 /100 | #315 | Tragic 4.7% |
| Puerto Ricans | 0.0 /100 | #316 | Tragic 4.7% |
| U.S. Virgin Islanders | 0.0 /100 | #317 | Tragic 4.6% |
| Jamaicans | 0.0 /100 | #318 | Tragic 4.6% |
| Haitians | 0.0 /100 | #319 | Tragic 4.6% |
| Immigrants | Haiti | 0.0 /100 | #320 | Tragic 4.5% |
| Ecuadorians | 0.0 /100 | #321 | Tragic 4.5% |
| Immigrants | Yemen | 0.0 /100 | #322 | Tragic 4.5% |
| Immigrants | Caribbean | 0.0 /100 | #323 | Tragic 4.4% |
| Soviet Union | 0.0 /100 | #324 | Tragic 4.4% |
Demographics Similar to Arabs by 4 or more Vehicles in Household
In terms of 4 or more vehicles in household, the demographic groups most similar to Arabs are Immigrants from Austria (6.0%, a difference of 0.020%), Immigrants from Egypt (6.0%, a difference of 0.060%), Panamanian (6.0%, a difference of 0.080%), Immigrants from China (6.0%, a difference of 0.13%), and Immigrants from Romania (6.0%, a difference of 0.13%).
| Demographics | Rating | Rank | 4 or more Vehicles in Household |
| Kenyans | 18.5 /100 | #206 | Poor 6.1% |
| Immigrants | Chile | 16.9 /100 | #207 | Poor 6.1% |
| Immigrants | Nigeria | 15.6 /100 | #208 | Poor 6.1% |
| Immigrants | Honduras | 15.4 /100 | #209 | Poor 6.1% |
| Immigrants | Zimbabwe | 15.1 /100 | #210 | Poor 6.0% |
| Panamanians | 14.8 /100 | #211 | Poor 6.0% |
| Immigrants | Egypt | 14.7 /100 | #212 | Poor 6.0% |
| Arabs | 14.4 /100 | #213 | Poor 6.0% |
| Immigrants | Austria | 14.3 /100 | #214 | Poor 6.0% |
| Immigrants | China | 13.8 /100 | #215 | Poor 6.0% |
| Immigrants | Romania | 13.8 /100 | #216 | Poor 6.0% |
| Nigerians | 12.2 /100 | #217 | Poor 6.0% |
| Immigrants | Italy | 11.0 /100 | #218 | Poor 6.0% |
| Serbians | 11.0 /100 | #219 | Poor 6.0% |
| Russians | 10.3 /100 | #220 | Poor 6.0% |