Immigrants from Canada vs Austrian 4 or more Vehicles in Household
COMPARE
Immigrants from Canada
Austrian
4 or more Vehicles in Household
4 or more Vehicles in Household Comparison
Immigrants from Canada
Austrians
6.5%
4 OR MORE VEHICLES IN HOUSEHOLD
78.6/ 100
METRIC RATING
143rd/ 347
METRIC RANK
6.8%
4 OR MORE VEHICLES IN HOUSEHOLD
94.1/ 100
METRIC RATING
125th/ 347
METRIC RANK
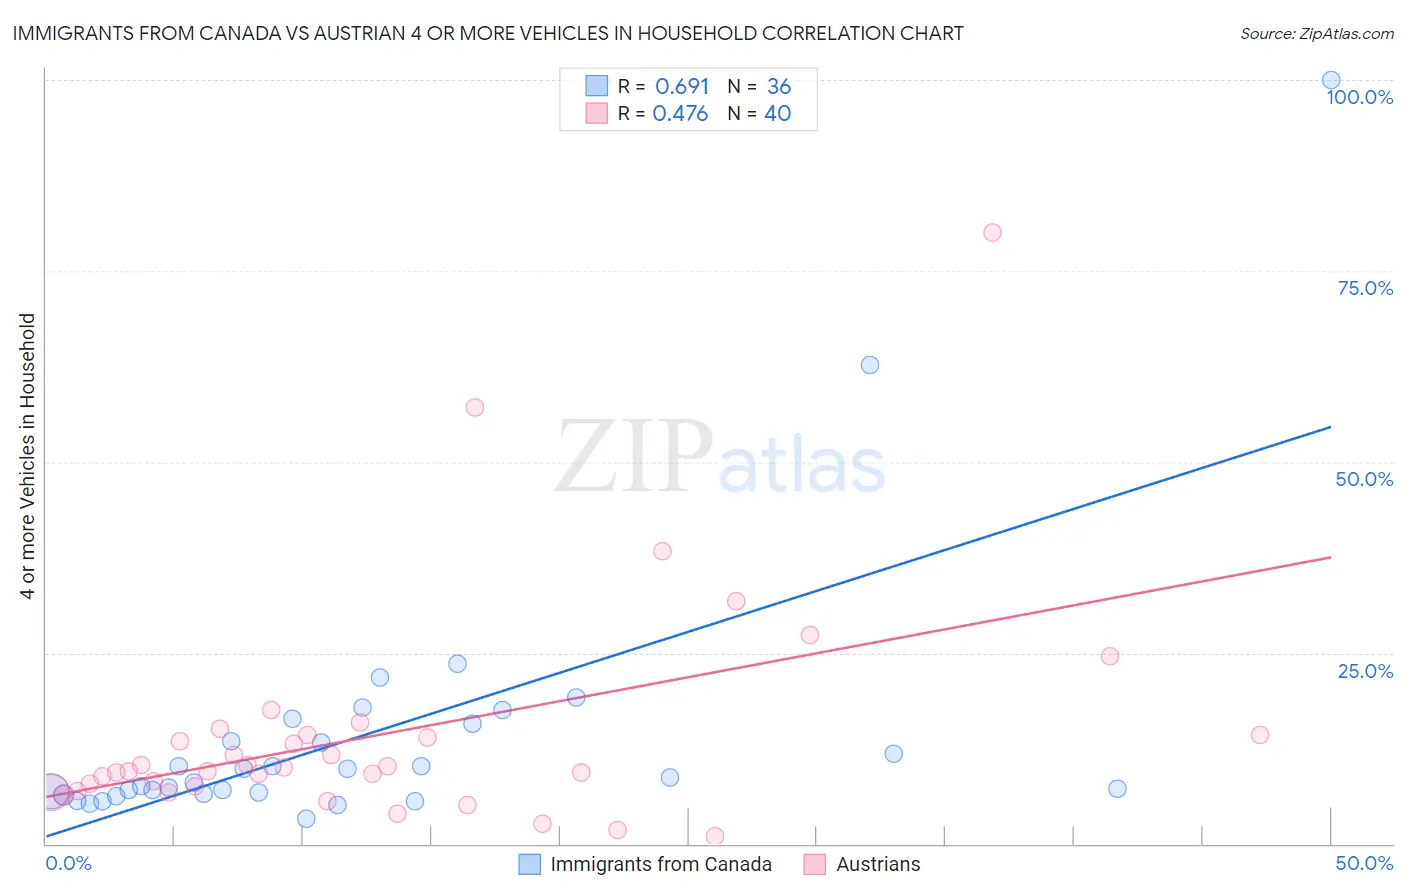
Immigrants from Canada vs Austrian 4 or more Vehicles in Household Correlation Chart
The statistical analysis conducted on geographies consisting of 457,196,725 people shows a significant positive correlation between the proportion of Immigrants from Canada and percentage of households with 4 or more vehicles available in the United States with a correlation coefficient (R) of 0.691 and weighted average of 6.5%. Similarly, the statistical analysis conducted on geographies consisting of 450,167,430 people shows a moderate positive correlation between the proportion of Austrians and percentage of households with 4 or more vehicles available in the United States with a correlation coefficient (R) of 0.476 and weighted average of 6.8%, a difference of 3.6%.
4 or more Vehicles in Household Correlation Summary
| Measurement | Immigrants from Canada | Austrian |
| Minimum | 3.3% | 0.94% |
| Maximum | 100.0% | 80.0% |
| Range | 96.7% | 79.1% |
| Mean | 14.1% | 14.4% |
| Median | 8.4% | 9.7% |
| Interquartile 25% (IQ1) | 6.7% | 7.2% |
| Interquartile 75% (IQ3) | 14.6% | 14.3% |
| Interquartile Range (IQR) | 7.9% | 7.1% |
| Standard Deviation (Sample) | 17.9% | 14.9% |
| Standard Deviation (Population) | 17.6% | 14.7% |
Demographics Similar to Immigrants from Canada and Austrians by 4 or more Vehicles in Household
In terms of 4 or more vehicles in household, the demographic groups most similar to Immigrants from Canada are Immigrants from North America (6.5%, a difference of 0.020%), Immigrants from Iraq (6.5%, a difference of 0.13%), Australian (6.6%, a difference of 0.33%), Slavic (6.6%, a difference of 0.46%), and Jordanian (6.6%, a difference of 0.54%). Similarly, the demographic groups most similar to Austrians are Belgian (6.8%, a difference of 0.010%), Immigrants from Asia (6.8%, a difference of 0.10%), Immigrants from Korea (6.8%, a difference of 0.13%), Immigrants from Bolivia (6.7%, a difference of 0.63%), and Immigrants from England (6.7%, a difference of 0.79%).
| Demographics | Rating | Rank | 4 or more Vehicles in Household |
| Immigrants | Asia | 94.4 /100 | #124 | Exceptional 6.8% |
| Austrians | 94.1 /100 | #125 | Exceptional 6.8% |
| Belgians | 94.1 /100 | #126 | Exceptional 6.8% |
| Immigrants | Korea | 93.8 /100 | #127 | Exceptional 6.8% |
| Immigrants | Bolivia | 92.5 /100 | #128 | Exceptional 6.7% |
| Immigrants | England | 92.0 /100 | #129 | Exceptional 6.7% |
| Immigrants | Scotland | 89.0 /100 | #130 | Excellent 6.7% |
| Maltese | 88.4 /100 | #131 | Excellent 6.7% |
| Immigrants | Netherlands | 87.8 /100 | #132 | Excellent 6.6% |
| Armenians | 86.9 /100 | #133 | Excellent 6.6% |
| Ottawa | 86.9 /100 | #134 | Excellent 6.6% |
| Tohono O'odham | 86.7 /100 | #135 | Excellent 6.6% |
| Luxembourgers | 86.4 /100 | #136 | Excellent 6.6% |
| French Canadians | 85.4 /100 | #137 | Excellent 6.6% |
| Italians | 84.5 /100 | #138 | Excellent 6.6% |
| Jordanians | 82.1 /100 | #139 | Excellent 6.6% |
| Slavs | 81.6 /100 | #140 | Excellent 6.6% |
| Australians | 80.8 /100 | #141 | Excellent 6.6% |
| Immigrants | Iraq | 79.4 /100 | #142 | Good 6.5% |
| Immigrants | Canada | 78.6 /100 | #143 | Good 6.5% |
| Immigrants | North America | 78.5 /100 | #144 | Good 6.5% |