U.S. Virgin Islander vs Arab Unemployment Among Seniors over 75 years
COMPARE
U.S. Virgin Islander
Arab
Unemployment Among Seniors over 75 years
Unemployment Among Seniors over 75 years Comparison
U.S. Virgin Islanders
Arabs
8.1%
UNEMPLOYMENT AMONG SENIORS OVER 75 YEARS
99.7/ 100
METRIC RATING
84th/ 347
METRIC RANK
9.5%
UNEMPLOYMENT AMONG SENIORS OVER 75 YEARS
0.2/ 100
METRIC RATING
276th/ 347
METRIC RANK
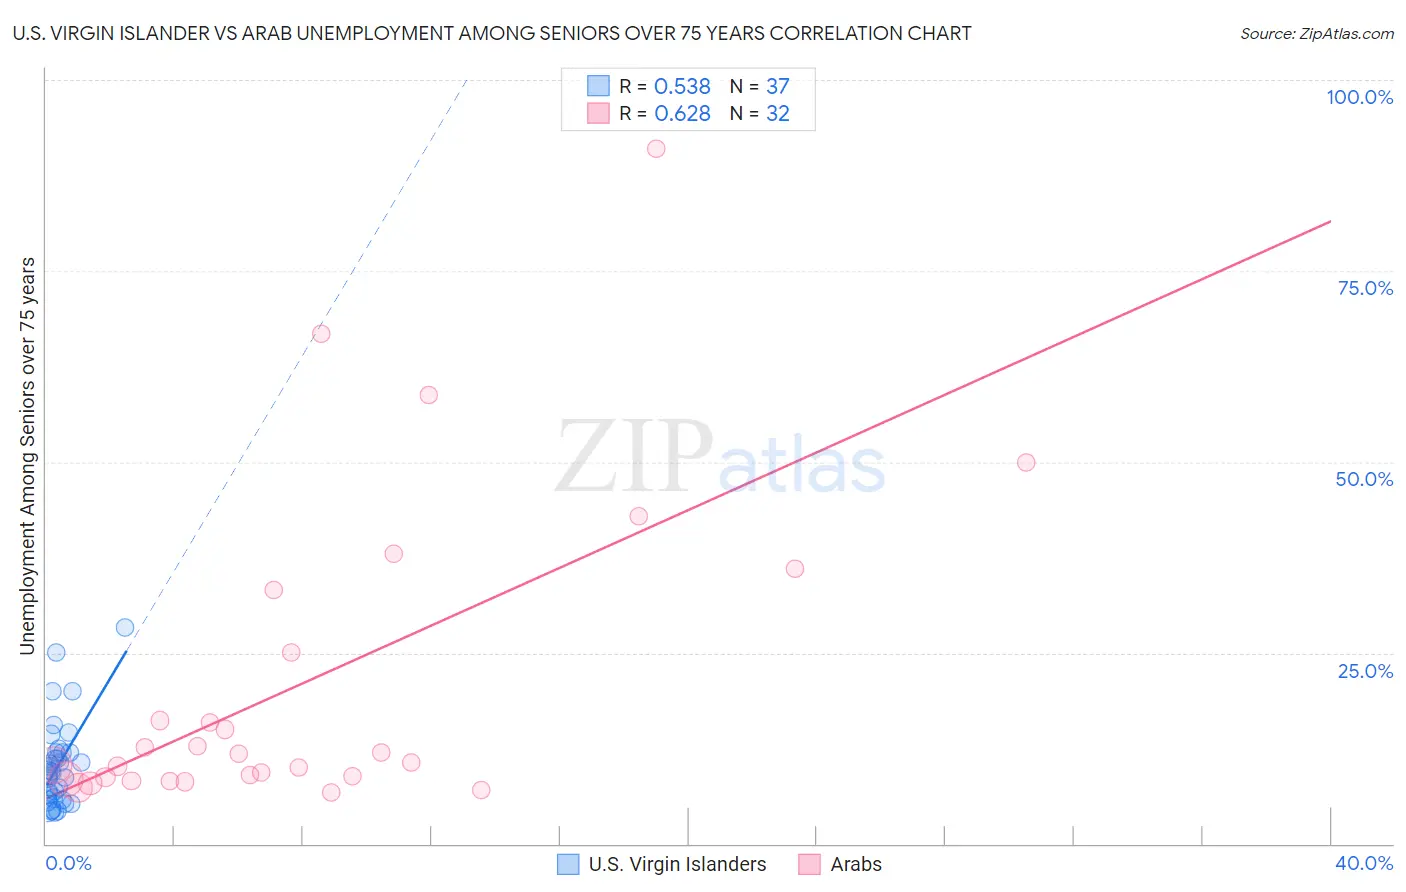
U.S. Virgin Islander vs Arab Unemployment Among Seniors over 75 years Correlation Chart
The statistical analysis conducted on geographies consisting of 67,378,879 people shows a substantial positive correlation between the proportion of U.S. Virgin Islanders and unemployment rate among seniors over the age of 75 in the United States with a correlation coefficient (R) of 0.538 and weighted average of 8.1%. Similarly, the statistical analysis conducted on geographies consisting of 225,172,972 people shows a significant positive correlation between the proportion of Arabs and unemployment rate among seniors over the age of 75 in the United States with a correlation coefficient (R) of 0.628 and weighted average of 9.5%, a difference of 17.6%.
Unemployment Among Seniors over 75 years Correlation Summary
| Measurement | U.S. Virgin Islander | Arab |
| Minimum | 4.0% | 6.8% |
| Maximum | 28.3% | 91.1% |
| Range | 24.3% | 84.3% |
| Mean | 10.3% | 21.1% |
| Median | 9.6% | 11.2% |
| Interquartile 25% (IQ1) | 5.8% | 8.6% |
| Interquartile 75% (IQ3) | 11.9% | 29.2% |
| Interquartile Range (IQR) | 6.1% | 20.6% |
| Standard Deviation (Sample) | 5.7% | 20.7% |
| Standard Deviation (Population) | 5.6% | 20.4% |
Similar Demographics by Unemployment Among Seniors over 75 years
Demographics Similar to U.S. Virgin Islanders by Unemployment Among Seniors over 75 years
In terms of unemployment among seniors over 75 years, the demographic groups most similar to U.S. Virgin Islanders are Immigrants from Indonesia (8.1%, a difference of 0.060%), Arapaho (8.1%, a difference of 0.080%), Immigrants from Singapore (8.1%, a difference of 0.15%), Bhutanese (8.0%, a difference of 0.19%), and Cuban (8.0%, a difference of 0.21%).
| Demographics | Rating | Rank | Unemployment Among Seniors over 75 years |
| Immigrants | Turkey | 99.8 /100 | #77 | Exceptional 8.0% |
| Immigrants | Belarus | 99.8 /100 | #78 | Exceptional 8.0% |
| Immigrants | Japan | 99.7 /100 | #79 | Exceptional 8.0% |
| Immigrants | Australia | 99.7 /100 | #80 | Exceptional 8.0% |
| Cubans | 99.7 /100 | #81 | Exceptional 8.0% |
| Bhutanese | 99.7 /100 | #82 | Exceptional 8.0% |
| Arapaho | 99.7 /100 | #83 | Exceptional 8.1% |
| U.S. Virgin Islanders | 99.7 /100 | #84 | Exceptional 8.1% |
| Immigrants | Indonesia | 99.7 /100 | #85 | Exceptional 8.1% |
| Immigrants | Singapore | 99.7 /100 | #86 | Exceptional 8.1% |
| Basques | 99.5 /100 | #87 | Exceptional 8.1% |
| New Zealanders | 99.5 /100 | #88 | Exceptional 8.1% |
| Immigrants | Korea | 99.5 /100 | #89 | Exceptional 8.1% |
| Immigrants | Vietnam | 99.5 /100 | #90 | Exceptional 8.1% |
| Egyptians | 99.5 /100 | #91 | Exceptional 8.1% |
Demographics Similar to Arabs by Unemployment Among Seniors over 75 years
In terms of unemployment among seniors over 75 years, the demographic groups most similar to Arabs are Senegalese (9.5%, a difference of 0.080%), Jamaican (9.5%, a difference of 0.29%), Czechoslovakian (9.4%, a difference of 0.41%), Swiss (9.5%, a difference of 0.50%), and Immigrants from Iraq (9.4%, a difference of 0.55%).
| Demographics | Rating | Rank | Unemployment Among Seniors over 75 years |
| Puerto Ricans | 0.3 /100 | #269 | Tragic 9.4% |
| Yaqui | 0.3 /100 | #270 | Tragic 9.4% |
| Bulgarians | 0.3 /100 | #271 | Tragic 9.4% |
| Immigrants | Iraq | 0.3 /100 | #272 | Tragic 9.4% |
| Czechoslovakians | 0.3 /100 | #273 | Tragic 9.4% |
| Jamaicans | 0.2 /100 | #274 | Tragic 9.5% |
| Senegalese | 0.2 /100 | #275 | Tragic 9.5% |
| Arabs | 0.2 /100 | #276 | Tragic 9.5% |
| Swiss | 0.1 /100 | #277 | Tragic 9.5% |
| Immigrants | Senegal | 0.1 /100 | #278 | Tragic 9.6% |
| British | 0.1 /100 | #279 | Tragic 9.6% |
| Croatians | 0.1 /100 | #280 | Tragic 9.6% |
| Bangladeshis | 0.1 /100 | #281 | Tragic 9.6% |
| Macedonians | 0.0 /100 | #282 | Tragic 9.6% |
| Immigrants | Nigeria | 0.0 /100 | #283 | Tragic 9.6% |