Immigrants from Haiti vs Arab 4 or more Vehicles in Household
COMPARE
Immigrants from Haiti
Arab
4 or more Vehicles in Household
4 or more Vehicles in Household Comparison
Immigrants from Haiti
Arabs
4.5%
4 OR MORE VEHICLES IN HOUSEHOLD
0.0/ 100
METRIC RATING
320th/ 347
METRIC RANK
6.0%
4 OR MORE VEHICLES IN HOUSEHOLD
14.4/ 100
METRIC RATING
213th/ 347
METRIC RANK
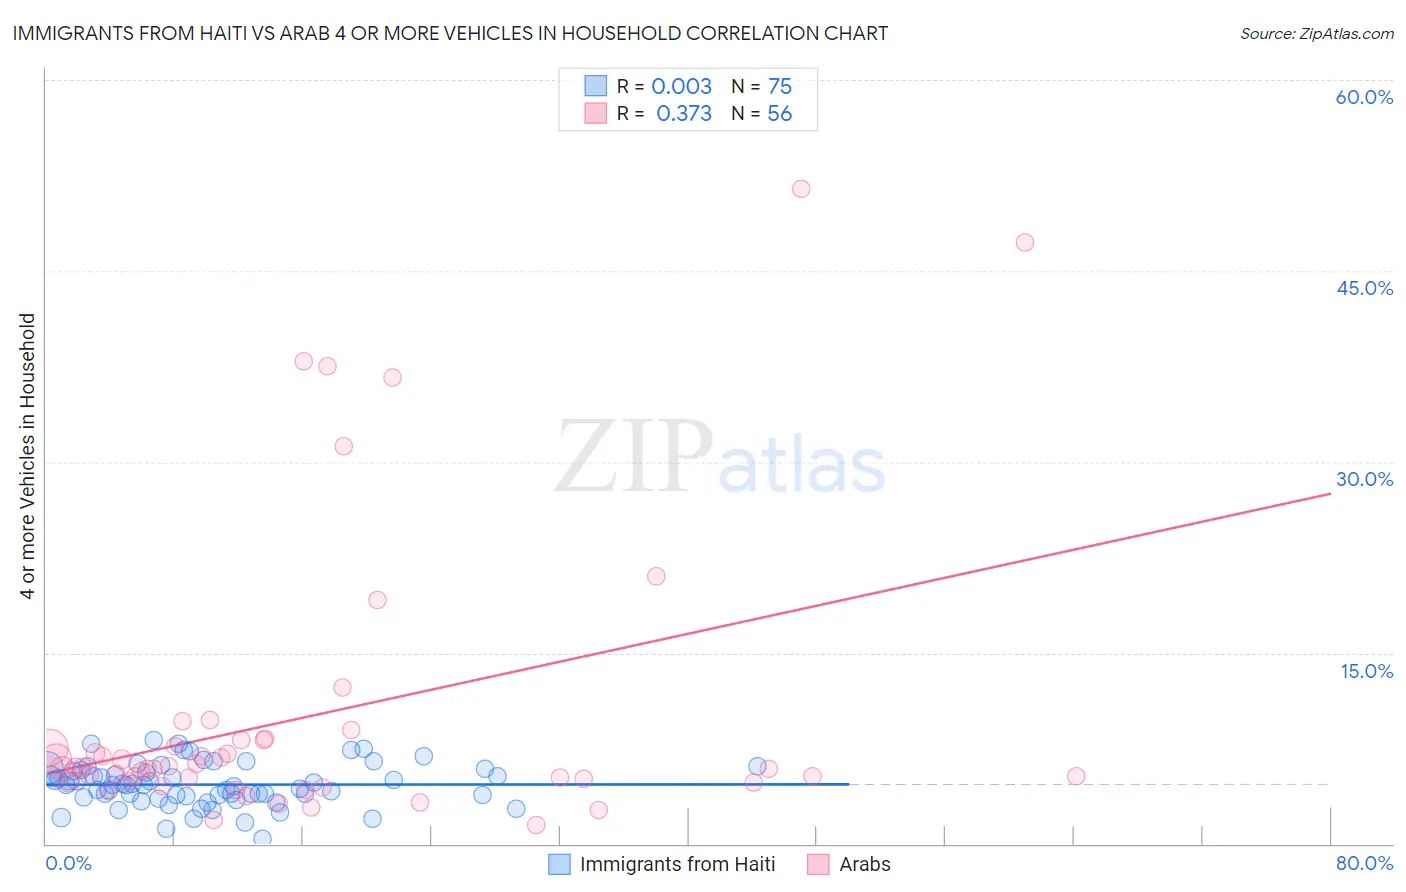
Immigrants from Haiti vs Arab 4 or more Vehicles in Household Correlation Chart
The statistical analysis conducted on geographies consisting of 223,924,769 people shows no correlation between the proportion of Immigrants from Haiti and percentage of households with 4 or more vehicles available in the United States with a correlation coefficient (R) of 0.003 and weighted average of 4.5%. Similarly, the statistical analysis conducted on geographies consisting of 484,302,602 people shows a mild positive correlation between the proportion of Arabs and percentage of households with 4 or more vehicles available in the United States with a correlation coefficient (R) of 0.373 and weighted average of 6.0%, a difference of 34.3%.
4 or more Vehicles in Household Correlation Summary
| Measurement | Immigrants from Haiti | Arab |
| Minimum | 0.37% | 1.5% |
| Maximum | 8.2% | 51.4% |
| Range | 7.8% | 50.0% |
| Mean | 4.7% | 10.0% |
| Median | 4.6% | 5.9% |
| Interquartile 25% (IQ1) | 3.7% | 4.9% |
| Interquartile 75% (IQ3) | 5.8% | 8.1% |
| Interquartile Range (IQR) | 2.1% | 3.2% |
| Standard Deviation (Sample) | 1.6% | 11.3% |
| Standard Deviation (Population) | 1.6% | 11.2% |
Similar Demographics by 4 or more Vehicles in Household
Demographics Similar to Immigrants from Haiti by 4 or more Vehicles in Household
In terms of 4 or more vehicles in household, the demographic groups most similar to Immigrants from Haiti are Ecuadorian (4.5%, a difference of 0.75%), Immigrants from Yemen (4.5%, a difference of 0.93%), Immigrants from Caribbean (4.4%, a difference of 1.3%), Soviet Union (4.4%, a difference of 1.6%), and Immigrants from Jamaica (4.4%, a difference of 1.9%).
| Demographics | Rating | Rank | 4 or more Vehicles in Household |
| Immigrants | Israel | 0.0 /100 | #313 | Tragic 4.8% |
| Immigrants | West Indies | 0.0 /100 | #314 | Tragic 4.7% |
| Immigrants | Belarus | 0.0 /100 | #315 | Tragic 4.7% |
| Puerto Ricans | 0.0 /100 | #316 | Tragic 4.7% |
| U.S. Virgin Islanders | 0.0 /100 | #317 | Tragic 4.6% |
| Jamaicans | 0.0 /100 | #318 | Tragic 4.6% |
| Haitians | 0.0 /100 | #319 | Tragic 4.6% |
| Immigrants | Haiti | 0.0 /100 | #320 | Tragic 4.5% |
| Ecuadorians | 0.0 /100 | #321 | Tragic 4.5% |
| Immigrants | Yemen | 0.0 /100 | #322 | Tragic 4.5% |
| Immigrants | Caribbean | 0.0 /100 | #323 | Tragic 4.4% |
| Soviet Union | 0.0 /100 | #324 | Tragic 4.4% |
| Immigrants | Jamaica | 0.0 /100 | #325 | Tragic 4.4% |
| Cape Verdeans | 0.0 /100 | #326 | Tragic 4.4% |
| Senegalese | 0.0 /100 | #327 | Tragic 4.3% |
Demographics Similar to Arabs by 4 or more Vehicles in Household
In terms of 4 or more vehicles in household, the demographic groups most similar to Arabs are Immigrants from Austria (6.0%, a difference of 0.020%), Immigrants from Egypt (6.0%, a difference of 0.060%), Panamanian (6.0%, a difference of 0.080%), Immigrants from China (6.0%, a difference of 0.13%), and Immigrants from Romania (6.0%, a difference of 0.13%).
| Demographics | Rating | Rank | 4 or more Vehicles in Household |
| Kenyans | 18.5 /100 | #206 | Poor 6.1% |
| Immigrants | Chile | 16.9 /100 | #207 | Poor 6.1% |
| Immigrants | Nigeria | 15.6 /100 | #208 | Poor 6.1% |
| Immigrants | Honduras | 15.4 /100 | #209 | Poor 6.1% |
| Immigrants | Zimbabwe | 15.1 /100 | #210 | Poor 6.0% |
| Panamanians | 14.8 /100 | #211 | Poor 6.0% |
| Immigrants | Egypt | 14.7 /100 | #212 | Poor 6.0% |
| Arabs | 14.4 /100 | #213 | Poor 6.0% |
| Immigrants | Austria | 14.3 /100 | #214 | Poor 6.0% |
| Immigrants | China | 13.8 /100 | #215 | Poor 6.0% |
| Immigrants | Romania | 13.8 /100 | #216 | Poor 6.0% |
| Nigerians | 12.2 /100 | #217 | Poor 6.0% |
| Immigrants | Italy | 11.0 /100 | #218 | Poor 6.0% |
| Serbians | 11.0 /100 | #219 | Poor 6.0% |
| Russians | 10.3 /100 | #220 | Poor 6.0% |