Choctaw vs Arab 4 or more Vehicles in Household
COMPARE
Choctaw
Arab
4 or more Vehicles in Household
4 or more Vehicles in Household Comparison
Choctaw
Arabs
7.8%
4 OR MORE VEHICLES IN HOUSEHOLD
100.0/ 100
METRIC RATING
45th/ 347
METRIC RANK
6.0%
4 OR MORE VEHICLES IN HOUSEHOLD
14.4/ 100
METRIC RATING
213th/ 347
METRIC RANK
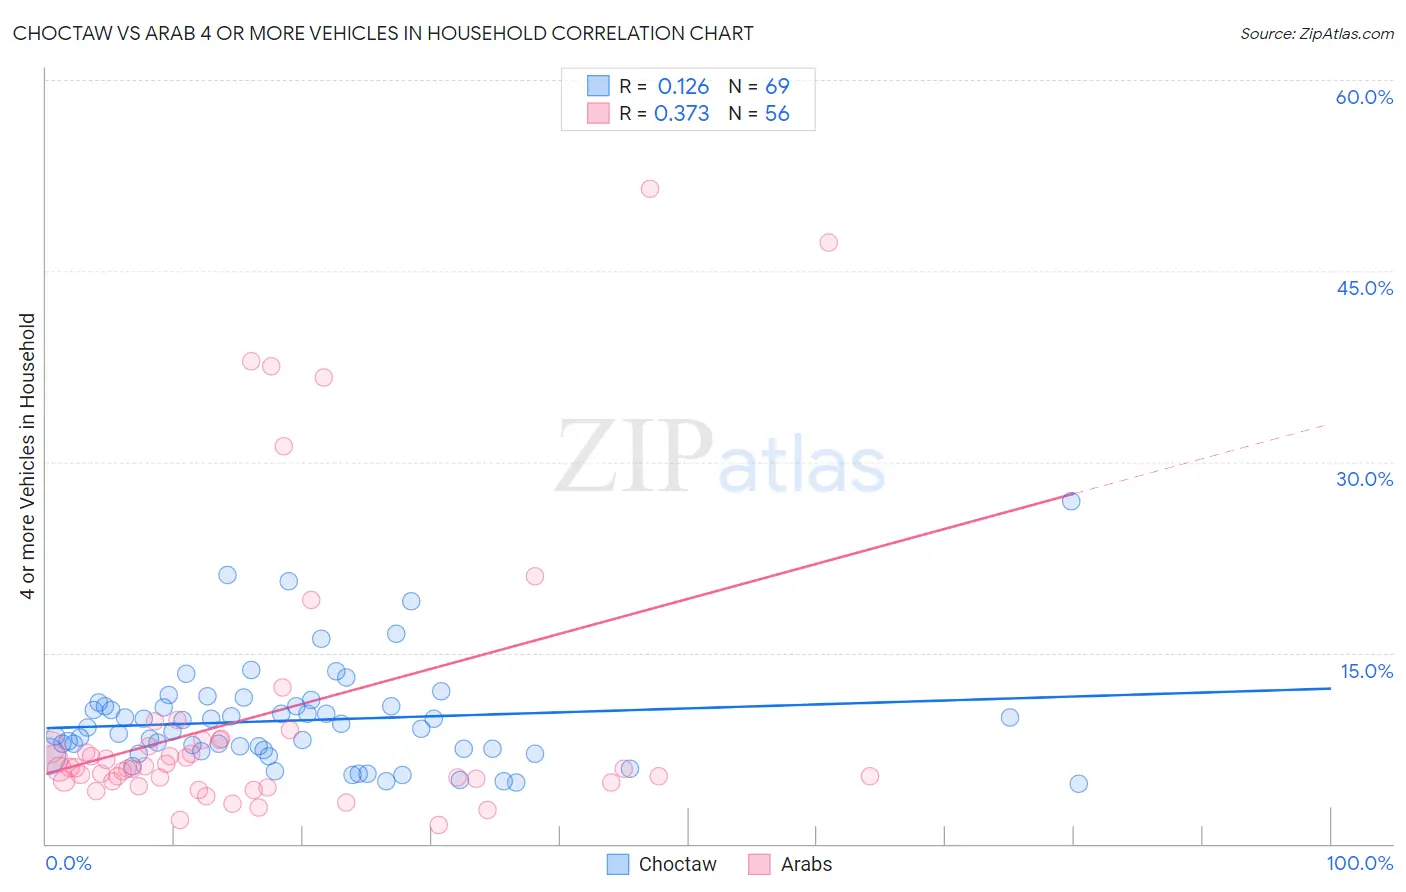
Choctaw vs Arab 4 or more Vehicles in Household Correlation Chart
The statistical analysis conducted on geographies consisting of 269,154,664 people shows a poor positive correlation between the proportion of Choctaw and percentage of households with 4 or more vehicles available in the United States with a correlation coefficient (R) of 0.126 and weighted average of 7.8%. Similarly, the statistical analysis conducted on geographies consisting of 484,302,602 people shows a mild positive correlation between the proportion of Arabs and percentage of households with 4 or more vehicles available in the United States with a correlation coefficient (R) of 0.373 and weighted average of 6.0%, a difference of 29.0%.
4 or more Vehicles in Household Correlation Summary
| Measurement | Choctaw | Arab |
| Minimum | 4.7% | 1.5% |
| Maximum | 26.9% | 51.4% |
| Range | 22.2% | 50.0% |
| Mean | 9.7% | 10.0% |
| Median | 9.0% | 5.9% |
| Interquartile 25% (IQ1) | 7.3% | 4.9% |
| Interquartile 75% (IQ3) | 10.8% | 8.1% |
| Interquartile Range (IQR) | 3.5% | 3.2% |
| Standard Deviation (Sample) | 4.1% | 11.3% |
| Standard Deviation (Population) | 4.0% | 11.2% |
Similar Demographics by 4 or more Vehicles in Household
Demographics Similar to Choctaw by 4 or more Vehicles in Household
In terms of 4 or more vehicles in household, the demographic groups most similar to Choctaw are Bhutanese (7.8%, a difference of 0.050%), Crow (7.8%, a difference of 0.17%), Fijian (7.8%, a difference of 0.31%), Osage (7.8%, a difference of 0.33%), and Salvadoran (7.8%, a difference of 0.43%).
| Demographics | Rating | Rank | 4 or more Vehicles in Household |
| Sioux | 100.0 /100 | #38 | Exceptional 8.0% |
| Spanish Americans | 100.0 /100 | #39 | Exceptional 8.0% |
| Spanish | 100.0 /100 | #40 | Exceptional 7.9% |
| Pima | 100.0 /100 | #41 | Exceptional 7.9% |
| Salvadorans | 100.0 /100 | #42 | Exceptional 7.8% |
| Fijians | 100.0 /100 | #43 | Exceptional 7.8% |
| Bhutanese | 100.0 /100 | #44 | Exceptional 7.8% |
| Choctaw | 100.0 /100 | #45 | Exceptional 7.8% |
| Crow | 100.0 /100 | #46 | Exceptional 7.8% |
| Osage | 100.0 /100 | #47 | Exceptional 7.8% |
| Swiss | 100.0 /100 | #48 | Exceptional 7.8% |
| Cherokee | 100.0 /100 | #49 | Exceptional 7.7% |
| Immigrants | El Salvador | 100.0 /100 | #50 | Exceptional 7.7% |
| Immigrants | Laos | 100.0 /100 | #51 | Exceptional 7.7% |
| Japanese | 100.0 /100 | #52 | Exceptional 7.7% |
Demographics Similar to Arabs by 4 or more Vehicles in Household
In terms of 4 or more vehicles in household, the demographic groups most similar to Arabs are Immigrants from Austria (6.0%, a difference of 0.020%), Immigrants from Egypt (6.0%, a difference of 0.060%), Panamanian (6.0%, a difference of 0.080%), Immigrants from China (6.0%, a difference of 0.13%), and Immigrants from Romania (6.0%, a difference of 0.13%).
| Demographics | Rating | Rank | 4 or more Vehicles in Household |
| Kenyans | 18.5 /100 | #206 | Poor 6.1% |
| Immigrants | Chile | 16.9 /100 | #207 | Poor 6.1% |
| Immigrants | Nigeria | 15.6 /100 | #208 | Poor 6.1% |
| Immigrants | Honduras | 15.4 /100 | #209 | Poor 6.1% |
| Immigrants | Zimbabwe | 15.1 /100 | #210 | Poor 6.0% |
| Panamanians | 14.8 /100 | #211 | Poor 6.0% |
| Immigrants | Egypt | 14.7 /100 | #212 | Poor 6.0% |
| Arabs | 14.4 /100 | #213 | Poor 6.0% |
| Immigrants | Austria | 14.3 /100 | #214 | Poor 6.0% |
| Immigrants | China | 13.8 /100 | #215 | Poor 6.0% |
| Immigrants | Romania | 13.8 /100 | #216 | Poor 6.0% |
| Nigerians | 12.2 /100 | #217 | Poor 6.0% |
| Immigrants | Italy | 11.0 /100 | #218 | Poor 6.0% |
| Serbians | 11.0 /100 | #219 | Poor 6.0% |
| Russians | 10.3 /100 | #220 | Poor 6.0% |