Uruguayan vs New Zealander 2 or more Vehicles in Household
COMPARE
Uruguayan
New Zealander
2 or more Vehicles in Household
2 or more Vehicles in Household Comparison
Uruguayans
New Zealanders
52.7%
2 OR MORE VEHICLES IN HOUSEHOLD
0.7/ 100
METRIC RATING
255th/ 347
METRIC RANK
56.7%
2 OR MORE VEHICLES IN HOUSEHOLD
91.8/ 100
METRIC RATING
124th/ 347
METRIC RANK
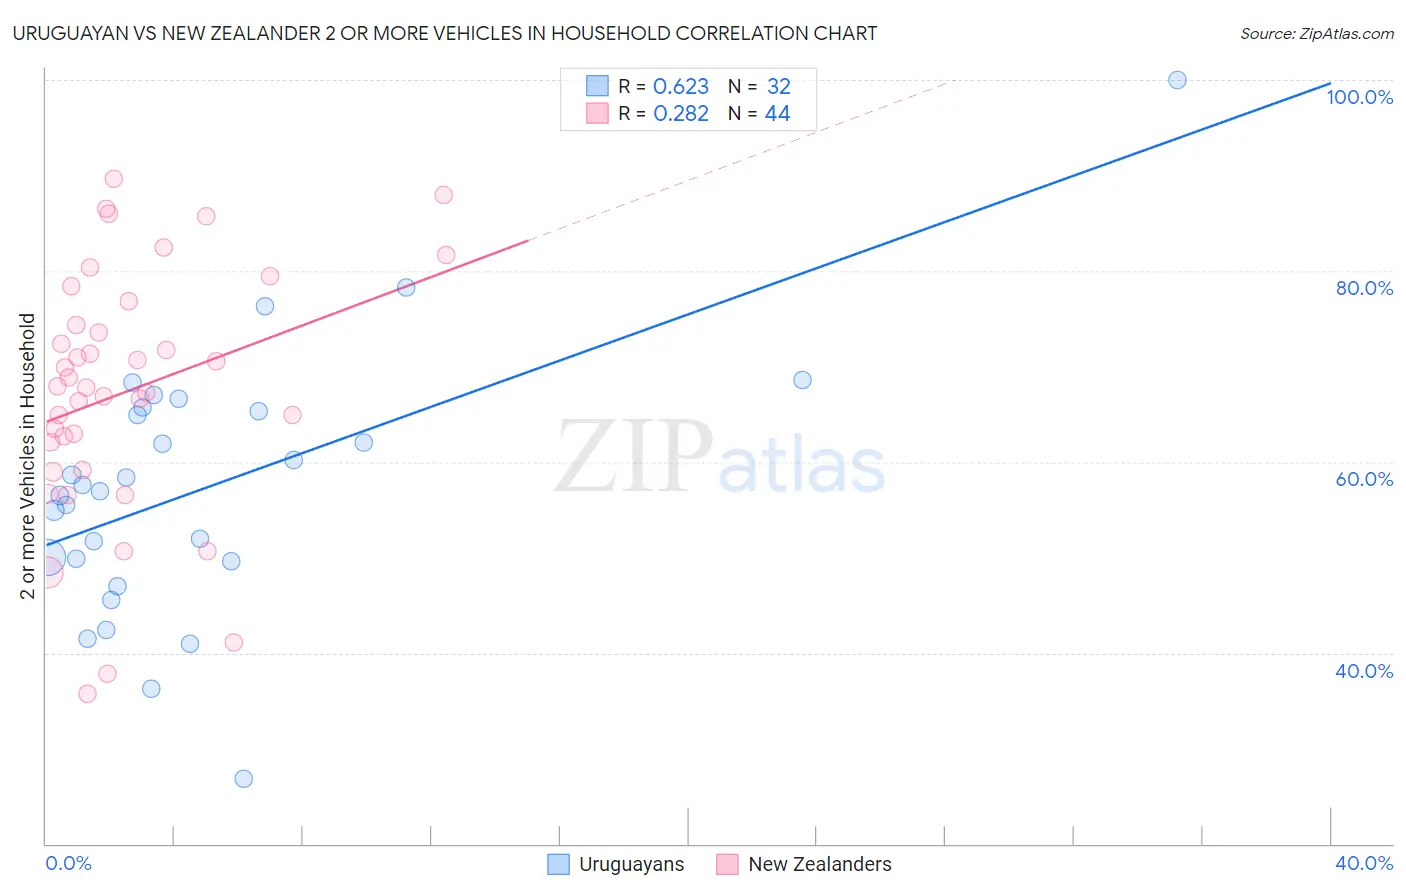
Uruguayan vs New Zealander 2 or more Vehicles in Household Correlation Chart
The statistical analysis conducted on geographies consisting of 144,759,773 people shows a significant positive correlation between the proportion of Uruguayans and percentage of households with 2 or more vehicles available in the United States with a correlation coefficient (R) of 0.623 and weighted average of 52.7%. Similarly, the statistical analysis conducted on geographies consisting of 106,900,392 people shows a weak positive correlation between the proportion of New Zealanders and percentage of households with 2 or more vehicles available in the United States with a correlation coefficient (R) of 0.282 and weighted average of 56.7%, a difference of 7.6%.
2 or more Vehicles in Household Correlation Summary
| Measurement | Uruguayan | New Zealander |
| Minimum | 26.8% | 35.8% |
| Maximum | 100.0% | 89.7% |
| Range | 73.2% | 53.9% |
| Mean | 57.4% | 67.4% |
| Median | 57.3% | 67.9% |
| Interquartile 25% (IQ1) | 49.8% | 60.6% |
| Interquartile 75% (IQ3) | 65.5% | 75.6% |
| Interquartile Range (IQR) | 15.7% | 15.0% |
| Standard Deviation (Sample) | 13.8% | 12.9% |
| Standard Deviation (Population) | 13.6% | 12.8% |
Similar Demographics by 2 or more Vehicles in Household
Demographics Similar to Uruguayans by 2 or more Vehicles in Household
In terms of 2 or more vehicles in household, the demographic groups most similar to Uruguayans are Immigrants from Malaysia (52.7%, a difference of 0.030%), Immigrants from Eritrea (52.6%, a difference of 0.040%), Immigrants from Hong Kong (52.6%, a difference of 0.18%), Nigerian (52.8%, a difference of 0.22%), and Immigrants from Portugal (52.8%, a difference of 0.27%).
| Demographics | Rating | Rank | 2 or more Vehicles in Household |
| Colombians | 1.1 /100 | #248 | Tragic 52.9% |
| Immigrants | Brazil | 1.0 /100 | #249 | Tragic 52.8% |
| Mongolians | 1.0 /100 | #250 | Tragic 52.8% |
| Immigrants | Sudan | 1.0 /100 | #251 | Tragic 52.8% |
| Immigrants | Portugal | 1.0 /100 | #252 | Tragic 52.8% |
| Nigerians | 0.9 /100 | #253 | Tragic 52.8% |
| Immigrants | Malaysia | 0.8 /100 | #254 | Tragic 52.7% |
| Uruguayans | 0.7 /100 | #255 | Tragic 52.7% |
| Immigrants | Eritrea | 0.7 /100 | #256 | Tragic 52.6% |
| Immigrants | Hong Kong | 0.6 /100 | #257 | Tragic 52.6% |
| Central American Indians | 0.6 /100 | #258 | Tragic 52.5% |
| Alsatians | 0.6 /100 | #259 | Tragic 52.5% |
| Immigrants | Bahamas | 0.5 /100 | #260 | Tragic 52.5% |
| Immigrants | Australia | 0.5 /100 | #261 | Tragic 52.4% |
| Immigrants | Northern Africa | 0.4 /100 | #262 | Tragic 52.3% |
Demographics Similar to New Zealanders by 2 or more Vehicles in Household
In terms of 2 or more vehicles in household, the demographic groups most similar to New Zealanders are Australian (56.7%, a difference of 0.0%), Tsimshian (56.7%, a difference of 0.020%), Immigrants from South Africa (56.7%, a difference of 0.10%), Estonian (56.6%, a difference of 0.10%), and Immigrants from Thailand (56.6%, a difference of 0.13%).
| Demographics | Rating | Rank | 2 or more Vehicles in Household |
| Iraqis | 95.8 /100 | #117 | Exceptional 57.1% |
| Asians | 95.1 /100 | #118 | Exceptional 57.0% |
| Natives/Alaskans | 95.0 /100 | #119 | Exceptional 57.0% |
| Costa Ricans | 94.7 /100 | #120 | Exceptional 56.9% |
| Sioux | 93.8 /100 | #121 | Exceptional 56.8% |
| Immigrants | South Africa | 92.5 /100 | #122 | Exceptional 56.7% |
| Australians | 91.8 /100 | #123 | Exceptional 56.7% |
| New Zealanders | 91.8 /100 | #124 | Exceptional 56.7% |
| Tsimshian | 91.6 /100 | #125 | Exceptional 56.7% |
| Estonians | 90.9 /100 | #126 | Exceptional 56.6% |
| Immigrants | Thailand | 90.7 /100 | #127 | Exceptional 56.6% |
| Immigrants | South Central Asia | 90.5 /100 | #128 | Exceptional 56.6% |
| Ute | 90.4 /100 | #129 | Exceptional 56.6% |
| Yugoslavians | 90.0 /100 | #130 | Exceptional 56.6% |
| Bulgarians | 89.7 /100 | #131 | Excellent 56.5% |