Turkish vs Immigrants from South America Disability
COMPARE
Turkish
Immigrants from South America
Disability
Disability Comparison
Turks
Immigrants from South America
10.7%
DISABILITY
100.0/ 100
METRIC RATING
37th/ 347
METRIC RANK
10.9%
DISABILITY
99.8/ 100
METRIC RATING
58th/ 347
METRIC RANK
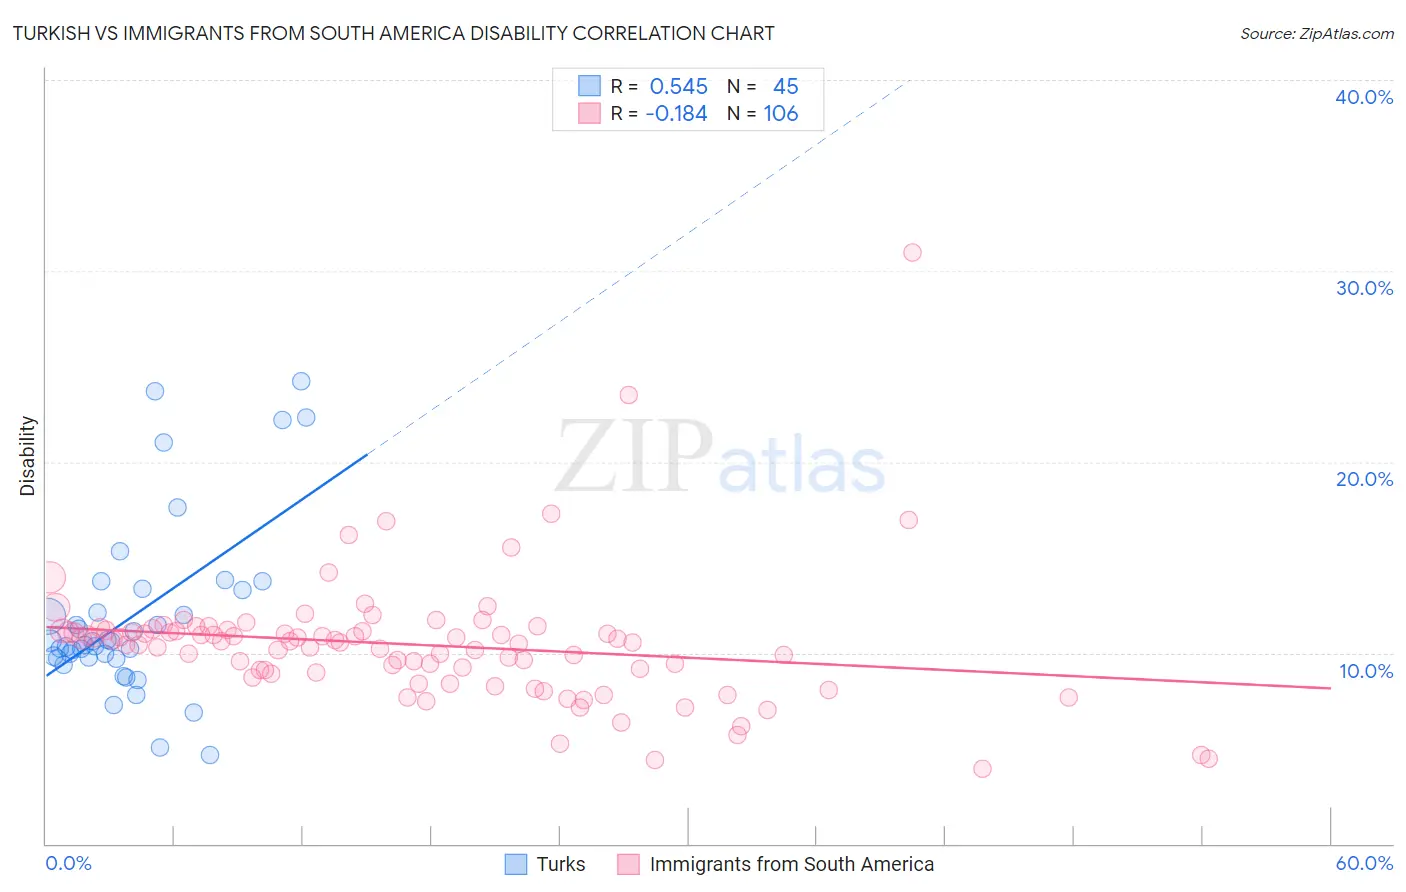
Turkish vs Immigrants from South America Disability Correlation Chart
The statistical analysis conducted on geographies consisting of 271,857,414 people shows a substantial positive correlation between the proportion of Turks and percentage of population with a disability in the United States with a correlation coefficient (R) of 0.545 and weighted average of 10.7%. Similarly, the statistical analysis conducted on geographies consisting of 486,347,042 people shows a poor negative correlation between the proportion of Immigrants from South America and percentage of population with a disability in the United States with a correlation coefficient (R) of -0.184 and weighted average of 10.9%, a difference of 2.0%.
Disability Correlation Summary
| Measurement | Turkish | Immigrants from South America |
| Minimum | 4.7% | 3.9% |
| Maximum | 24.3% | 31.0% |
| Range | 19.6% | 27.0% |
| Mean | 11.9% | 10.4% |
| Median | 10.6% | 10.6% |
| Interquartile 25% (IQ1) | 9.7% | 9.0% |
| Interquartile 75% (IQ3) | 13.3% | 11.2% |
| Interquartile Range (IQR) | 3.6% | 2.2% |
| Standard Deviation (Sample) | 4.5% | 3.4% |
| Standard Deviation (Population) | 4.5% | 3.4% |
Similar Demographics by Disability
Demographics Similar to Turks by Disability
In terms of disability, the demographic groups most similar to Turks are Ethiopian (10.7%, a difference of 0.010%), Immigrants from Indonesia (10.7%, a difference of 0.070%), Immigrants from Ethiopia (10.7%, a difference of 0.080%), Immigrants from Kuwait (10.7%, a difference of 0.30%), and Afghan (10.8%, a difference of 0.44%).
| Demographics | Rating | Rank | Disability |
| Immigrants | Turkey | 100.0 /100 | #30 | Exceptional 10.6% |
| Immigrants | Egypt | 100.0 /100 | #31 | Exceptional 10.6% |
| Paraguayans | 100.0 /100 | #32 | Exceptional 10.6% |
| Immigrants | Kuwait | 100.0 /100 | #33 | Exceptional 10.7% |
| Immigrants | Ethiopia | 100.0 /100 | #34 | Exceptional 10.7% |
| Immigrants | Indonesia | 100.0 /100 | #35 | Exceptional 10.7% |
| Ethiopians | 100.0 /100 | #36 | Exceptional 10.7% |
| Turks | 100.0 /100 | #37 | Exceptional 10.7% |
| Afghans | 99.9 /100 | #38 | Exceptional 10.8% |
| Cambodians | 99.9 /100 | #39 | Exceptional 10.8% |
| Mongolians | 99.9 /100 | #40 | Exceptional 10.8% |
| Immigrants | Australia | 99.9 /100 | #41 | Exceptional 10.8% |
| Immigrants | Nepal | 99.9 /100 | #42 | Exceptional 10.8% |
| Israelis | 99.9 /100 | #43 | Exceptional 10.8% |
| Immigrants | Japan | 99.9 /100 | #44 | Exceptional 10.8% |
Demographics Similar to Immigrants from South America by Disability
In terms of disability, the demographic groups most similar to Immigrants from South America are Salvadoran (10.9%, a difference of 0.030%), Immigrants from Colombia (10.9%, a difference of 0.090%), Zimbabwean (10.9%, a difference of 0.18%), Immigrants from Bulgaria (10.9%, a difference of 0.24%), and Immigrants from Lithuania (10.9%, a difference of 0.27%).
| Demographics | Rating | Rank | Disability |
| Peruvians | 99.8 /100 | #51 | Exceptional 10.9% |
| South Americans | 99.8 /100 | #52 | Exceptional 10.9% |
| Immigrants | Spain | 99.8 /100 | #53 | Exceptional 10.9% |
| Jordanians | 99.8 /100 | #54 | Exceptional 10.9% |
| Immigrants | El Salvador | 99.8 /100 | #55 | Exceptional 10.9% |
| Immigrants | Lithuania | 99.8 /100 | #56 | Exceptional 10.9% |
| Salvadorans | 99.8 /100 | #57 | Exceptional 10.9% |
| Immigrants | South America | 99.8 /100 | #58 | Exceptional 10.9% |
| Immigrants | Colombia | 99.7 /100 | #59 | Exceptional 10.9% |
| Zimbabweans | 99.7 /100 | #60 | Exceptional 10.9% |
| Immigrants | Bulgaria | 99.7 /100 | #61 | Exceptional 10.9% |
| Immigrants | Northern Africa | 99.7 /100 | #62 | Exceptional 10.9% |
| Immigrants | Eritrea | 99.7 /100 | #63 | Exceptional 11.0% |
| Immigrants | Sweden | 99.6 /100 | #64 | Exceptional 11.0% |
| Bulgarians | 99.6 /100 | #65 | Exceptional 11.0% |