Turkish vs Immigrants from Caribbean Doctorate Degree
COMPARE
Turkish
Immigrants from Caribbean
Doctorate Degree
Doctorate Degree Comparison
Turks
Immigrants from Caribbean
2.7%
DOCTORATE DEGREE
100.0/ 100
METRIC RATING
26th/ 347
METRIC RANK
1.3%
DOCTORATE DEGREE
0.0/ 100
METRIC RATING
333rd/ 347
METRIC RANK
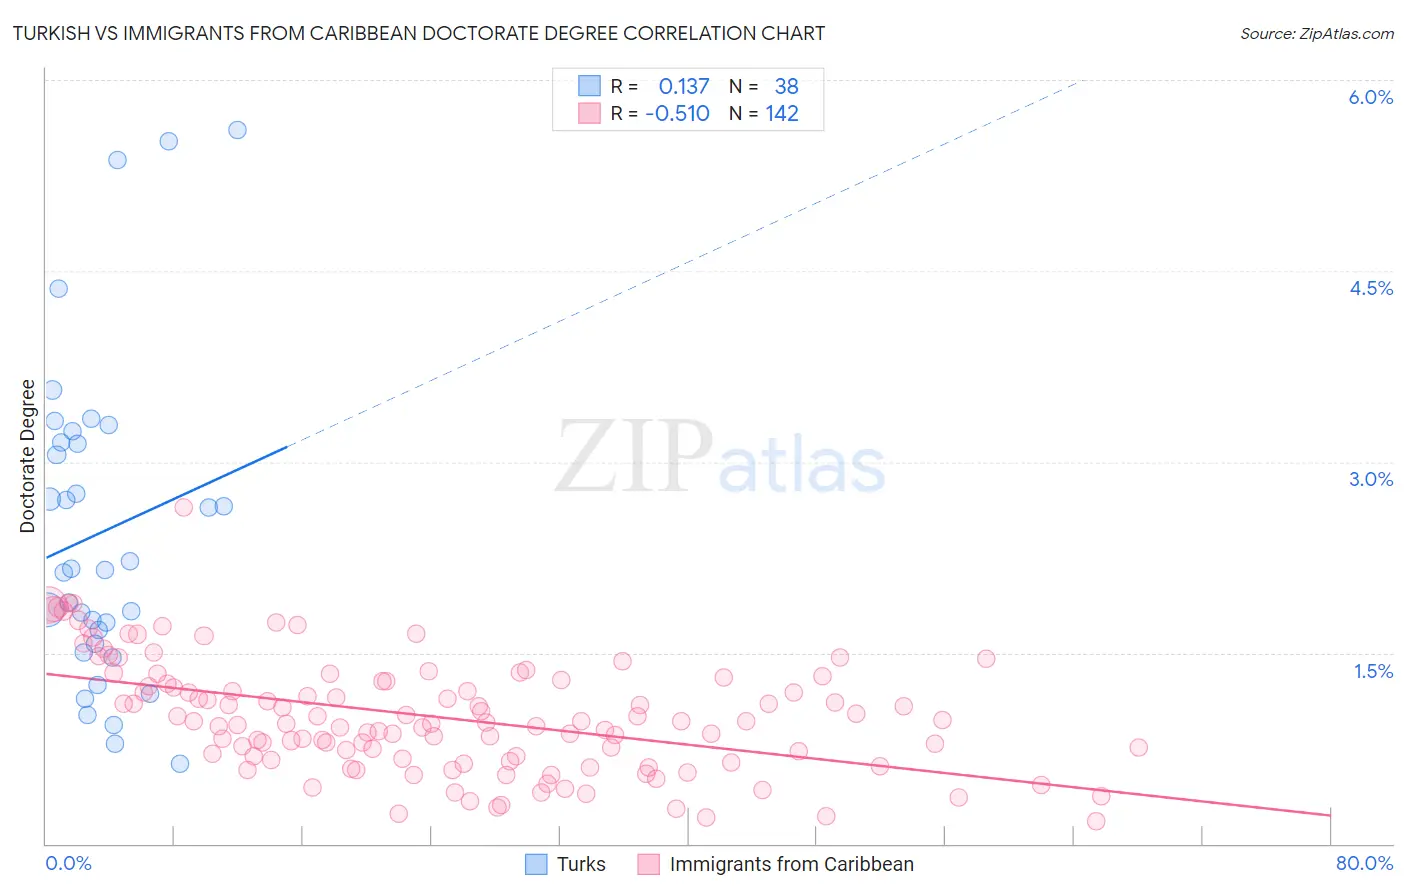
Turkish vs Immigrants from Caribbean Doctorate Degree Correlation Chart
The statistical analysis conducted on geographies consisting of 271,099,789 people shows a poor positive correlation between the proportion of Turks and percentage of population with at least doctorate degree education in the United States with a correlation coefficient (R) of 0.137 and weighted average of 2.7%. Similarly, the statistical analysis conducted on geographies consisting of 443,887,060 people shows a substantial negative correlation between the proportion of Immigrants from Caribbean and percentage of population with at least doctorate degree education in the United States with a correlation coefficient (R) of -0.510 and weighted average of 1.3%, a difference of 108.1%.
Doctorate Degree Correlation Summary
| Measurement | Turkish | Immigrants from Caribbean |
| Minimum | 0.63% | 0.18% |
| Maximum | 5.6% | 2.6% |
| Range | 5.0% | 2.5% |
| Mean | 2.4% | 1.00% |
| Median | 2.2% | 0.96% |
| Interquartile 25% (IQ1) | 1.6% | 0.67% |
| Interquartile 75% (IQ3) | 3.2% | 1.3% |
| Interquartile Range (IQR) | 1.6% | 0.61% |
| Standard Deviation (Sample) | 1.3% | 0.44% |
| Standard Deviation (Population) | 1.2% | 0.44% |
Similar Demographics by Doctorate Degree
Demographics Similar to Turks by Doctorate Degree
In terms of doctorate degree, the demographic groups most similar to Turks are Immigrants from Saudi Arabia (2.7%, a difference of 0.52%), Immigrants from Turkey (2.6%, a difference of 0.87%), Burmese (2.6%, a difference of 1.2%), Immigrants from South Central Asia (2.6%, a difference of 1.4%), and Immigrants from Korea (2.6%, a difference of 1.5%).
| Demographics | Rating | Rank | Doctorate Degree |
| Immigrants | Japan | 100.0 /100 | #19 | Exceptional 2.8% |
| Immigrants | Hong Kong | 100.0 /100 | #20 | Exceptional 2.8% |
| Thais | 100.0 /100 | #21 | Exceptional 2.8% |
| Mongolians | 100.0 /100 | #22 | Exceptional 2.8% |
| Immigrants | Denmark | 100.0 /100 | #23 | Exceptional 2.8% |
| Israelis | 100.0 /100 | #24 | Exceptional 2.7% |
| Immigrants | Saudi Arabia | 100.0 /100 | #25 | Exceptional 2.7% |
| Turks | 100.0 /100 | #26 | Exceptional 2.7% |
| Immigrants | Turkey | 100.0 /100 | #27 | Exceptional 2.6% |
| Burmese | 100.0 /100 | #28 | Exceptional 2.6% |
| Immigrants | South Central Asia | 100.0 /100 | #29 | Exceptional 2.6% |
| Immigrants | Korea | 100.0 /100 | #30 | Exceptional 2.6% |
| Latvians | 100.0 /100 | #31 | Exceptional 2.6% |
| Immigrants | Northern Europe | 100.0 /100 | #32 | Exceptional 2.6% |
| Cambodians | 100.0 /100 | #33 | Exceptional 2.6% |
Demographics Similar to Immigrants from Caribbean by Doctorate Degree
In terms of doctorate degree, the demographic groups most similar to Immigrants from Caribbean are Yakama (1.3%, a difference of 0.16%), Immigrants from Dominican Republic (1.3%, a difference of 0.19%), Immigrants from Latin America (1.3%, a difference of 1.7%), Yup'ik (1.3%, a difference of 1.8%), and Haitian (1.3%, a difference of 2.0%).
| Demographics | Rating | Rank | Doctorate Degree |
| Immigrants | Cabo Verde | 0.0 /100 | #326 | Tragic 1.3% |
| Hispanics or Latinos | 0.0 /100 | #327 | Tragic 1.3% |
| Inupiat | 0.0 /100 | #328 | Tragic 1.3% |
| Haitians | 0.0 /100 | #329 | Tragic 1.3% |
| Yup'ik | 0.0 /100 | #330 | Tragic 1.3% |
| Immigrants | Latin America | 0.0 /100 | #331 | Tragic 1.3% |
| Yakama | 0.0 /100 | #332 | Tragic 1.3% |
| Immigrants | Caribbean | 0.0 /100 | #333 | Tragic 1.3% |
| Immigrants | Dominican Republic | 0.0 /100 | #334 | Tragic 1.3% |
| Immigrants | Haiti | 0.0 /100 | #335 | Tragic 1.3% |
| Nepalese | 0.0 /100 | #336 | Tragic 1.3% |
| Bangladeshis | 0.0 /100 | #337 | Tragic 1.2% |
| Puget Sound Salish | 0.0 /100 | #338 | Tragic 1.2% |
| Immigrants | Central America | 0.0 /100 | #339 | Tragic 1.2% |
| Immigrants | Cuba | 0.0 /100 | #340 | Tragic 1.2% |