Swiss vs Sioux No Vehicles in Household
COMPARE
Swiss
Sioux
No Vehicles in Household
No Vehicles in Household Comparison
Swiss
Sioux
7.9%
NO VEHICLES IN HOUSEHOLD
99.9/ 100
METRIC RATING
42nd/ 347
METRIC RANK
10.1%
NO VEHICLES IN HOUSEHOLD
72.4/ 100
METRIC RATING
154th/ 347
METRIC RANK
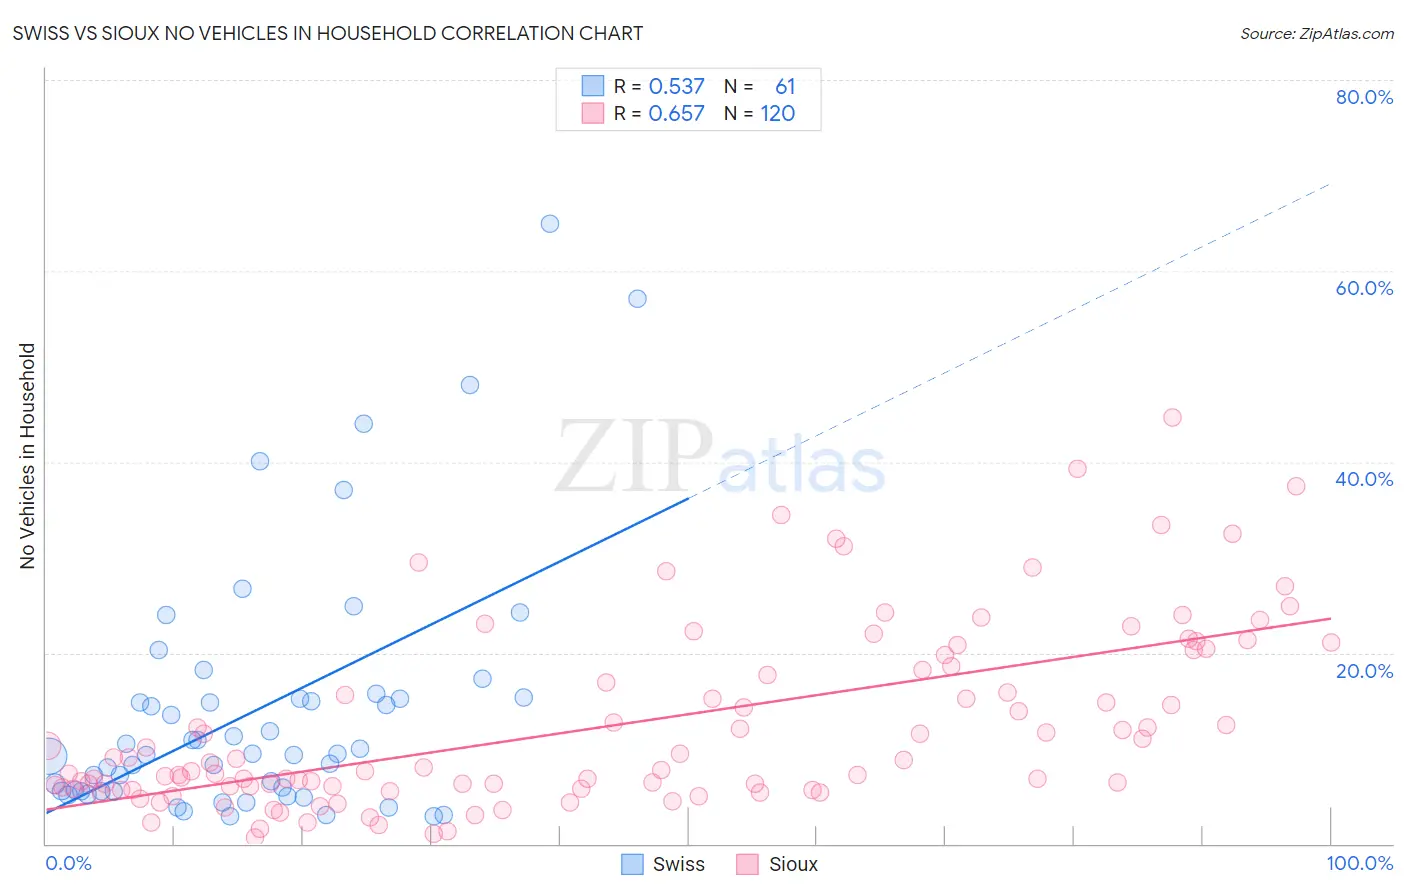
Swiss vs Sioux No Vehicles in Household Correlation Chart
The statistical analysis conducted on geographies consisting of 462,788,069 people shows a substantial positive correlation between the proportion of Swiss and percentage of households with no vehicle available in the United States with a correlation coefficient (R) of 0.537 and weighted average of 7.9%. Similarly, the statistical analysis conducted on geographies consisting of 233,693,165 people shows a significant positive correlation between the proportion of Sioux and percentage of households with no vehicle available in the United States with a correlation coefficient (R) of 0.657 and weighted average of 10.1%, a difference of 28.2%.
No Vehicles in Household Correlation Summary
| Measurement | Swiss | Sioux |
| Minimum | 2.8% | 0.66% |
| Maximum | 65.0% | 44.7% |
| Range | 62.2% | 44.0% |
| Mean | 14.0% | 12.4% |
| Median | 9.4% | 7.8% |
| Interquartile 25% (IQ1) | 5.5% | 5.8% |
| Interquartile 75% (IQ3) | 15.2% | 18.4% |
| Interquartile Range (IQR) | 9.7% | 12.5% |
| Standard Deviation (Sample) | 13.3% | 9.5% |
| Standard Deviation (Population) | 13.1% | 9.4% |
Similar Demographics by No Vehicles in Household
Demographics Similar to Swiss by No Vehicles in Household
In terms of no vehicles in household, the demographic groups most similar to Swiss are Chickasaw (7.9%, a difference of 0.080%), French Canadian (7.8%, a difference of 0.14%), Czechoslovakian (7.8%, a difference of 0.28%), Immigrants from Fiji (7.8%, a difference of 0.38%), and Choctaw (7.9%, a difference of 0.44%).
| Demographics | Rating | Rank | No Vehicles in Household |
| Cherokee | 99.9 /100 | #35 | Exceptional 7.7% |
| Iraqis | 99.9 /100 | #36 | Exceptional 7.7% |
| Basques | 99.9 /100 | #37 | Exceptional 7.8% |
| Creek | 99.9 /100 | #38 | Exceptional 7.8% |
| Immigrants | Fiji | 99.9 /100 | #39 | Exceptional 7.8% |
| Czechoslovakians | 99.9 /100 | #40 | Exceptional 7.8% |
| French Canadians | 99.9 /100 | #41 | Exceptional 7.8% |
| Swiss | 99.9 /100 | #42 | Exceptional 7.9% |
| Chickasaw | 99.9 /100 | #43 | Exceptional 7.9% |
| Choctaw | 99.9 /100 | #44 | Exceptional 7.9% |
| Immigrants | Nonimmigrants | 99.9 /100 | #45 | Exceptional 7.9% |
| Spanish | 99.9 /100 | #46 | Exceptional 7.9% |
| Northern Europeans | 99.9 /100 | #47 | Exceptional 7.9% |
| Afghans | 99.9 /100 | #48 | Exceptional 8.0% |
| Guamanians/Chamorros | 99.9 /100 | #49 | Exceptional 8.0% |
Demographics Similar to Sioux by No Vehicles in Household
In terms of no vehicles in household, the demographic groups most similar to Sioux are Salvadoran (10.1%, a difference of 0.010%), Tlingit-Haida (10.1%, a difference of 0.020%), Immigrants from Congo (10.1%, a difference of 0.11%), Immigrants from Eastern Africa (10.0%, a difference of 0.25%), and Colombian (10.0%, a difference of 0.26%).
| Demographics | Rating | Rank | No Vehicles in Household |
| Immigrants | Nicaragua | 79.8 /100 | #147 | Good 9.9% |
| Immigrants | Bosnia and Herzegovina | 79.1 /100 | #148 | Good 9.9% |
| Immigrants | Uganda | 76.1 /100 | #149 | Good 10.0% |
| Colombians | 73.9 /100 | #150 | Good 10.0% |
| Immigrants | Eastern Africa | 73.8 /100 | #151 | Good 10.0% |
| Immigrants | Congo | 73.0 /100 | #152 | Good 10.1% |
| Tlingit-Haida | 72.5 /100 | #153 | Good 10.1% |
| Sioux | 72.4 /100 | #154 | Good 10.1% |
| Salvadorans | 72.4 /100 | #155 | Good 10.1% |
| Immigrants | Micronesia | 70.9 /100 | #156 | Good 10.1% |
| Australians | 70.6 /100 | #157 | Good 10.1% |
| Spanish American Indians | 70.2 /100 | #158 | Good 10.1% |
| Immigrants | Indonesia | 69.3 /100 | #159 | Good 10.1% |
| Immigrants | Middle Africa | 65.7 /100 | #160 | Good 10.2% |
| New Zealanders | 65.1 /100 | #161 | Good 10.2% |