Immigrants from Moldova vs Sioux No Vehicles in Household
COMPARE
Immigrants from Moldova
Sioux
No Vehicles in Household
No Vehicles in Household Comparison
Immigrants from Moldova
Sioux
9.8%
NO VEHICLES IN HOUSEHOLD
84.6/ 100
METRIC RATING
137th/ 347
METRIC RANK
10.1%
NO VEHICLES IN HOUSEHOLD
72.4/ 100
METRIC RATING
154th/ 347
METRIC RANK
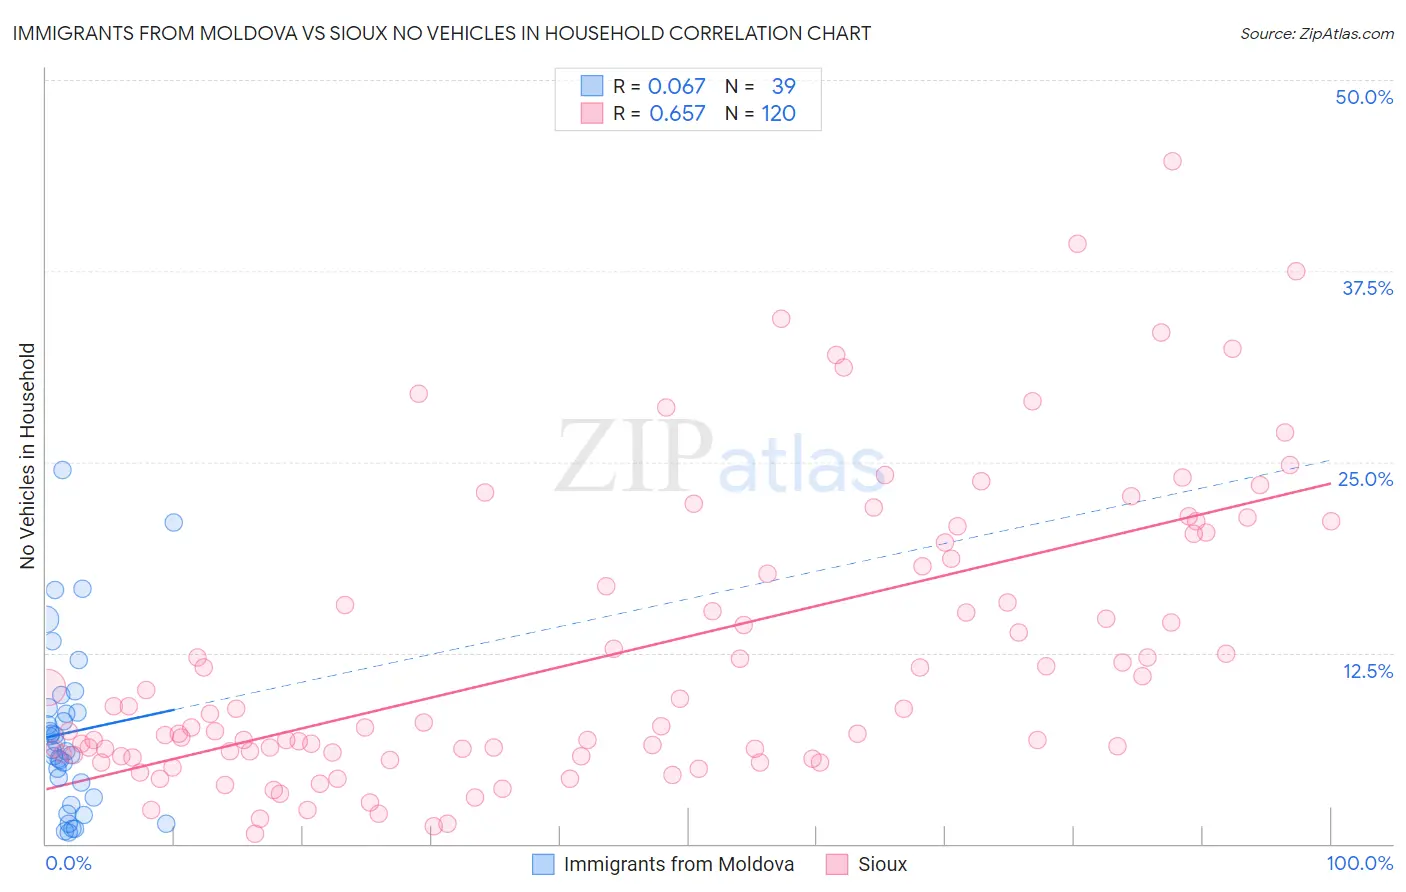
Immigrants from Moldova vs Sioux No Vehicles in Household Correlation Chart
The statistical analysis conducted on geographies consisting of 124,267,195 people shows a slight positive correlation between the proportion of Immigrants from Moldova and percentage of households with no vehicle available in the United States with a correlation coefficient (R) of 0.067 and weighted average of 9.8%. Similarly, the statistical analysis conducted on geographies consisting of 233,693,165 people shows a significant positive correlation between the proportion of Sioux and percentage of households with no vehicle available in the United States with a correlation coefficient (R) of 0.657 and weighted average of 10.1%, a difference of 2.7%.
No Vehicles in Household Correlation Summary
| Measurement | Immigrants from Moldova | Sioux |
| Minimum | 0.71% | 0.66% |
| Maximum | 24.5% | 44.7% |
| Range | 23.8% | 44.0% |
| Mean | 7.3% | 12.4% |
| Median | 6.2% | 7.8% |
| Interquartile 25% (IQ1) | 3.0% | 5.8% |
| Interquartile 75% (IQ3) | 8.9% | 18.4% |
| Interquartile Range (IQR) | 5.9% | 12.5% |
| Standard Deviation (Sample) | 5.5% | 9.5% |
| Standard Deviation (Population) | 5.5% | 9.4% |
Demographics Similar to Immigrants from Moldova and Sioux by No Vehicles in Household
In terms of no vehicles in household, the demographic groups most similar to Immigrants from Moldova are Immigrants from South Africa (9.8%, a difference of 0.10%), Estonian (9.8%, a difference of 0.12%), Latvian (9.8%, a difference of 0.15%), Marshallese (9.8%, a difference of 0.16%), and Immigrants from Lithuania (9.8%, a difference of 0.17%). Similarly, the demographic groups most similar to Sioux are Salvadoran (10.1%, a difference of 0.010%), Tlingit-Haida (10.1%, a difference of 0.020%), Immigrants from Congo (10.1%, a difference of 0.11%), Immigrants from Eastern Africa (10.0%, a difference of 0.25%), and Colombian (10.0%, a difference of 0.26%).
| Demographics | Rating | Rank | No Vehicles in Household |
| Latvians | 85.1 /100 | #135 | Excellent 9.8% |
| Immigrants | South Africa | 85.0 /100 | #136 | Excellent 9.8% |
| Immigrants | Moldova | 84.6 /100 | #137 | Excellent 9.8% |
| Estonians | 84.2 /100 | #138 | Excellent 9.8% |
| Marshallese | 84.0 /100 | #139 | Excellent 9.8% |
| Immigrants | Lithuania | 84.0 /100 | #140 | Excellent 9.8% |
| Sudanese | 83.1 /100 | #141 | Excellent 9.8% |
| Immigrants | Zimbabwe | 82.6 /100 | #142 | Excellent 9.9% |
| Chileans | 81.2 /100 | #143 | Excellent 9.9% |
| Immigrants | Bahamas | 81.2 /100 | #144 | Excellent 9.9% |
| Bahamians | 81.0 /100 | #145 | Excellent 9.9% |
| Hungarians | 80.0 /100 | #146 | Excellent 9.9% |
| Immigrants | Nicaragua | 79.8 /100 | #147 | Good 9.9% |
| Immigrants | Bosnia and Herzegovina | 79.1 /100 | #148 | Good 9.9% |
| Immigrants | Uganda | 76.1 /100 | #149 | Good 10.0% |
| Colombians | 73.9 /100 | #150 | Good 10.0% |
| Immigrants | Eastern Africa | 73.8 /100 | #151 | Good 10.0% |
| Immigrants | Congo | 73.0 /100 | #152 | Good 10.1% |
| Tlingit-Haida | 72.5 /100 | #153 | Good 10.1% |
| Sioux | 72.4 /100 | #154 | Good 10.1% |
| Salvadorans | 72.4 /100 | #155 | Good 10.1% |