Swiss vs Immigrants from Uzbekistan No Vehicles in Household
COMPARE
Swiss
Immigrants from Uzbekistan
No Vehicles in Household
No Vehicles in Household Comparison
Swiss
Immigrants from Uzbekistan
7.9%
NO VEHICLES IN HOUSEHOLD
99.9/ 100
METRIC RATING
42nd/ 347
METRIC RANK
26.7%
NO VEHICLES IN HOUSEHOLD
0.0/ 100
METRIC RATING
337th/ 347
METRIC RANK
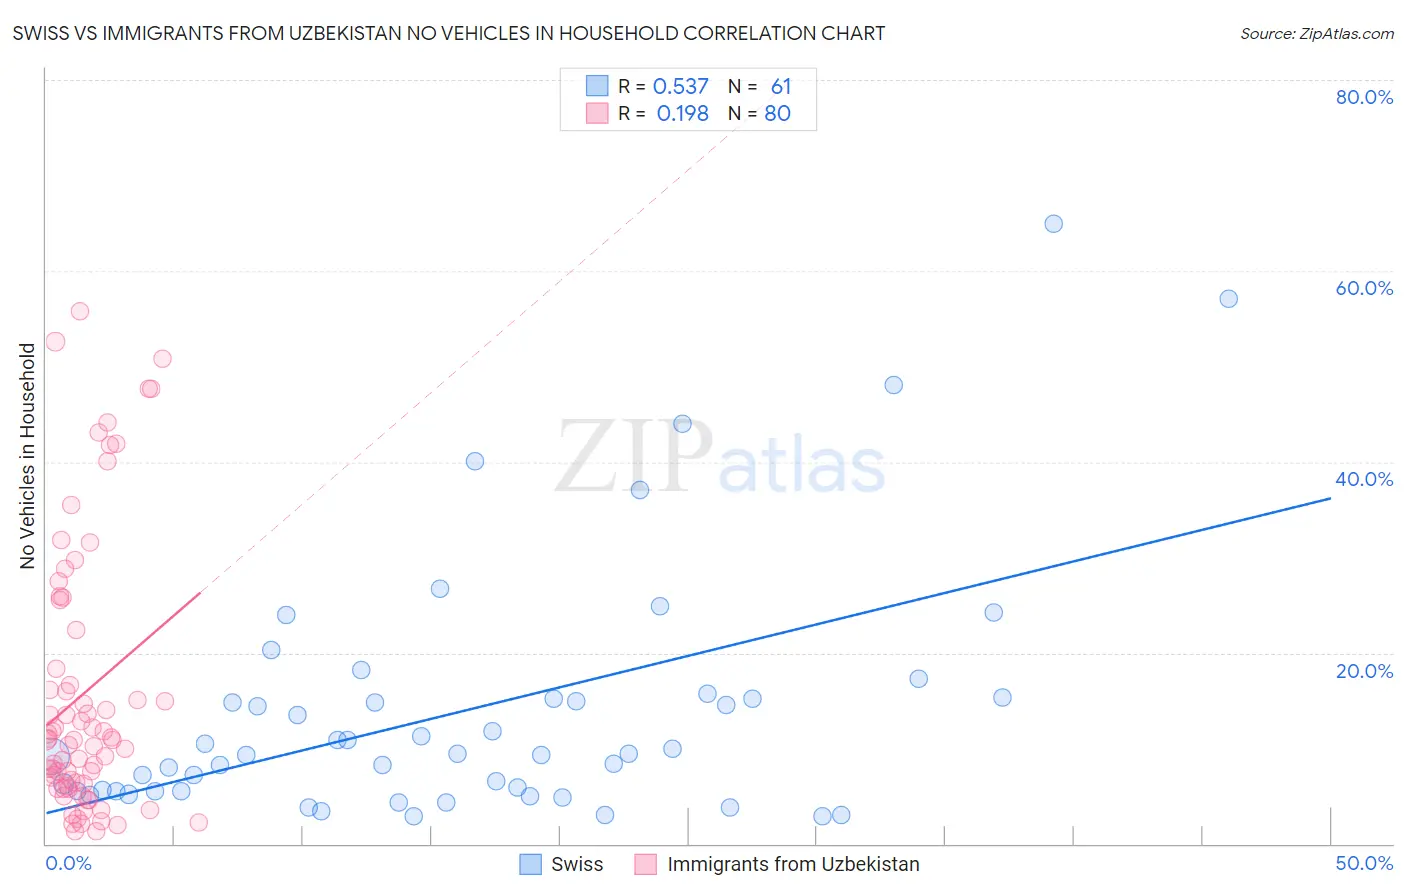
Swiss vs Immigrants from Uzbekistan No Vehicles in Household Correlation Chart
The statistical analysis conducted on geographies consisting of 462,788,069 people shows a substantial positive correlation between the proportion of Swiss and percentage of households with no vehicle available in the United States with a correlation coefficient (R) of 0.537 and weighted average of 7.9%. Similarly, the statistical analysis conducted on geographies consisting of 118,657,901 people shows a poor positive correlation between the proportion of Immigrants from Uzbekistan and percentage of households with no vehicle available in the United States with a correlation coefficient (R) of 0.198 and weighted average of 26.7%, a difference of 239.6%.
No Vehicles in Household Correlation Summary
| Measurement | Swiss | Immigrants from Uzbekistan |
| Minimum | 2.8% | 1.3% |
| Maximum | 65.0% | 55.8% |
| Range | 62.2% | 54.5% |
| Mean | 14.0% | 15.8% |
| Median | 9.4% | 10.9% |
| Interquartile 25% (IQ1) | 5.5% | 6.2% |
| Interquartile 75% (IQ3) | 15.2% | 20.4% |
| Interquartile Range (IQR) | 9.7% | 14.2% |
| Standard Deviation (Sample) | 13.3% | 14.1% |
| Standard Deviation (Population) | 13.1% | 14.0% |
Similar Demographics by No Vehicles in Household
Demographics Similar to Swiss by No Vehicles in Household
In terms of no vehicles in household, the demographic groups most similar to Swiss are Chickasaw (7.9%, a difference of 0.080%), French Canadian (7.8%, a difference of 0.14%), Czechoslovakian (7.8%, a difference of 0.28%), Immigrants from Fiji (7.8%, a difference of 0.38%), and Choctaw (7.9%, a difference of 0.44%).
| Demographics | Rating | Rank | No Vehicles in Household |
| Cherokee | 99.9 /100 | #35 | Exceptional 7.7% |
| Iraqis | 99.9 /100 | #36 | Exceptional 7.7% |
| Basques | 99.9 /100 | #37 | Exceptional 7.8% |
| Creek | 99.9 /100 | #38 | Exceptional 7.8% |
| Immigrants | Fiji | 99.9 /100 | #39 | Exceptional 7.8% |
| Czechoslovakians | 99.9 /100 | #40 | Exceptional 7.8% |
| French Canadians | 99.9 /100 | #41 | Exceptional 7.8% |
| Swiss | 99.9 /100 | #42 | Exceptional 7.9% |
| Chickasaw | 99.9 /100 | #43 | Exceptional 7.9% |
| Choctaw | 99.9 /100 | #44 | Exceptional 7.9% |
| Immigrants | Nonimmigrants | 99.9 /100 | #45 | Exceptional 7.9% |
| Spanish | 99.9 /100 | #46 | Exceptional 7.9% |
| Northern Europeans | 99.9 /100 | #47 | Exceptional 7.9% |
| Afghans | 99.9 /100 | #48 | Exceptional 8.0% |
| Guamanians/Chamorros | 99.9 /100 | #49 | Exceptional 8.0% |
Demographics Similar to Immigrants from Uzbekistan by No Vehicles in Household
In terms of no vehicles in household, the demographic groups most similar to Immigrants from Uzbekistan are Vietnamese (26.2%, a difference of 1.7%), Barbadian (26.1%, a difference of 2.2%), Immigrants from Bangladesh (25.8%, a difference of 3.5%), Immigrants from Trinidad and Tobago (24.6%, a difference of 8.3%), and Guyanese (29.3%, a difference of 9.9%).
| Demographics | Rating | Rank | No Vehicles in Household |
| West Indians | 0.0 /100 | #330 | Tragic 23.7% |
| Trinidadians and Tobagonians | 0.0 /100 | #331 | Tragic 23.7% |
| Immigrants | Ecuador | 0.0 /100 | #332 | Tragic 23.8% |
| Immigrants | Trinidad and Tobago | 0.0 /100 | #333 | Tragic 24.6% |
| Immigrants | Bangladesh | 0.0 /100 | #334 | Tragic 25.8% |
| Barbadians | 0.0 /100 | #335 | Tragic 26.1% |
| Vietnamese | 0.0 /100 | #336 | Tragic 26.2% |
| Immigrants | Uzbekistan | 0.0 /100 | #337 | Tragic 26.7% |
| Guyanese | 0.0 /100 | #338 | Tragic 29.3% |
| Dominicans | 0.0 /100 | #339 | Tragic 29.4% |
| Immigrants | Barbados | 0.0 /100 | #340 | Tragic 29.5% |
| Immigrants | Guyana | 0.0 /100 | #341 | Tragic 29.5% |
| British West Indians | 0.0 /100 | #342 | Tragic 29.7% |
| Inupiat | 0.0 /100 | #343 | Tragic 29.9% |
| Immigrants | Dominican Republic | 0.0 /100 | #344 | Tragic 31.4% |